40
1 Peter Hodgson Group Managing Director Institutional (previously CRO) David Stephen Chief Risk Officer What do I worry about? July 2007
1
Peter HodgsonGroup Managing Director Institutional (previously CRO)
David StephenChief Risk Officer
What do I worry about?July 2007
2
Key takeaways
• Environment still supportive
• “De-risking” worked, ANZ risk profile now in line with peers
• Some concerns, but not likely to have material impact on ANZ
– Isolated pockets of NSW housing
• Longer term, we can’t ignore the risks posed by climate change
– Indirect, including higher electricity prices
3
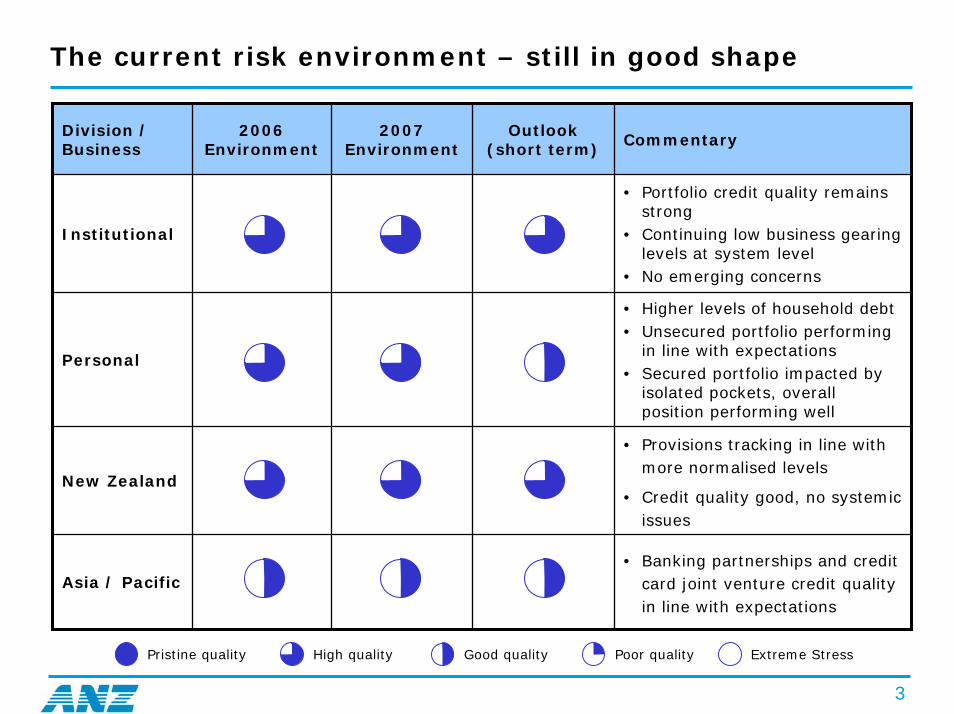
The current risk environment – still in good shape
Division / Business
2006 Environment
2007 Environment
Outlook (short term) Commentary
Institutional
• Portfolio credit quality remains strong
• Continuing low business gearing levels at system level
• No emerging concerns
Personal
• Higher levels of household debt• Unsecured portfolio performing
in line with expectations• Secured portfolio impacted by
isolated pockets, overall position performing well
New Zealand
• Provisions tracking in line with more normalised levels
• Credit quality good, no systemic issues
Asia / Pacific• Banking partnerships and credit
card joint venture credit quality in line with expectations
Pristine quality High quality Good quality Poor quality Extreme Stress
4
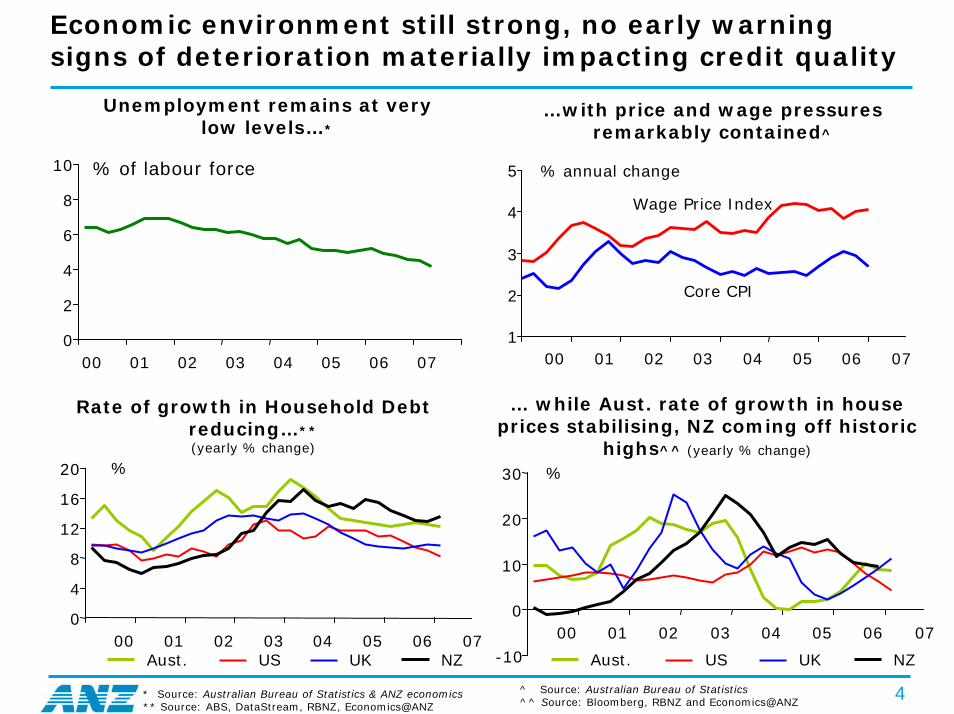
Economic environment still strong, no early warning signs of deterioration materially impacting credit quality
Unemployment remains at very low levels…*
…with price and wage pressures remarkably contained^
% of labour force
0
2
4
6
8
10
00 01 02 03 04 05 06 07
1
2
3
4
5
00 01 02 03 04 05 06 07
% annual change
Wage Price Index
Core CPI
Rate of growth in Household Debt reducing…**(yearly % change)
… while Aust. rate of growth in house prices stabilising, NZ coming off historic
highs^^ (yearly % change)
^ Source: Australian Bureau of Statistics ^^ Source: Bloomberg, RBNZ and Economics@ANZ
0
4
8
12
16
20
00 01 02 03 04 05 06 07Aust. US UK NZ
%
-10
0
10
20
30
00 01 02 03 04 05 06 07
Aust. US UK NZ
%
* Source: Australian Bureau of Statistics & ANZ economics ** Source: ABS, DataStream, RBNZ, Economics@ANZ
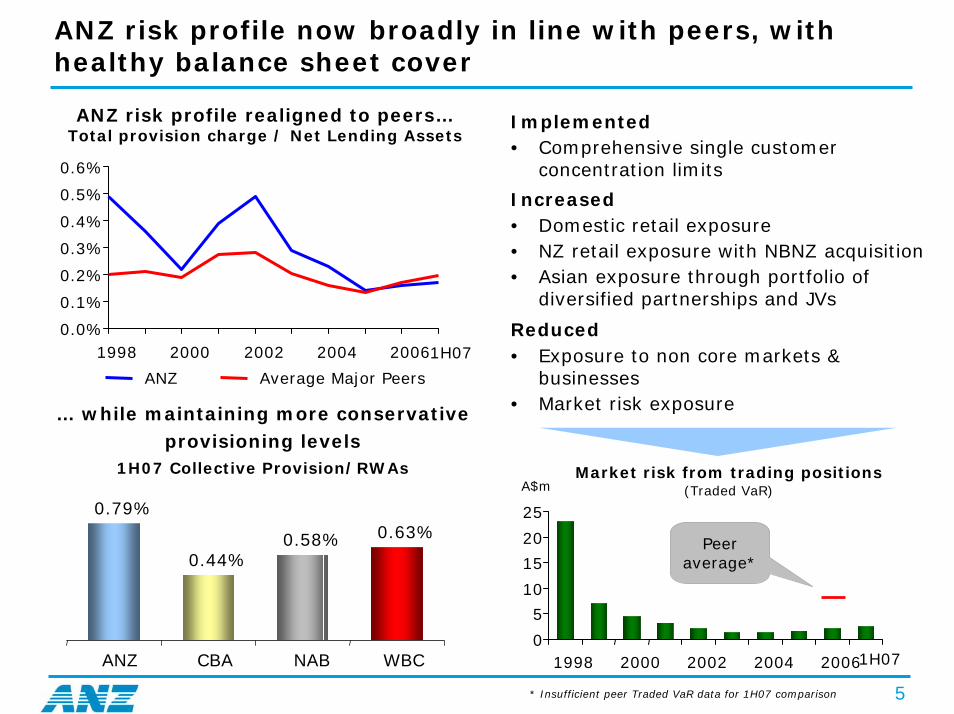
ANZ risk profile now broadly in line with peers, with healthy balance sheet cover
5
… while maintaining more conservative provisioning levels
1H07 Collective Provision/RWAs
ANZ risk profile realigned to peers…Total provision charge / Net Lending Assets
Implemented• Comprehensive single customer
concentration limits
Increased• Domestic retail exposure • NZ retail exposure with NBNZ acquisition• Asian exposure through portfolio of
diversified partnerships and JVs
Reduced• Exposure to non core markets &
businesses• Market risk exposure
A$mMarket risk from trading positions
(Traded VaR)
Peer average*
1H07
1H070.0%
0.1%
0.2%
0.3%
0.4%
0.5%
0.6%
1998 2000 2002 2004 2006
ANZ Average Major Peers
0.79%
0.44%0.58% 0.63%
ANZ CBA NAB WBC 0
5
10
15
20
25
1998 2000 2002 2004 2006
* Insufficient peer Traded VaR data for 1H07 comparison
6
40m+
10m-20m
5m-10m
<5m
Consumer
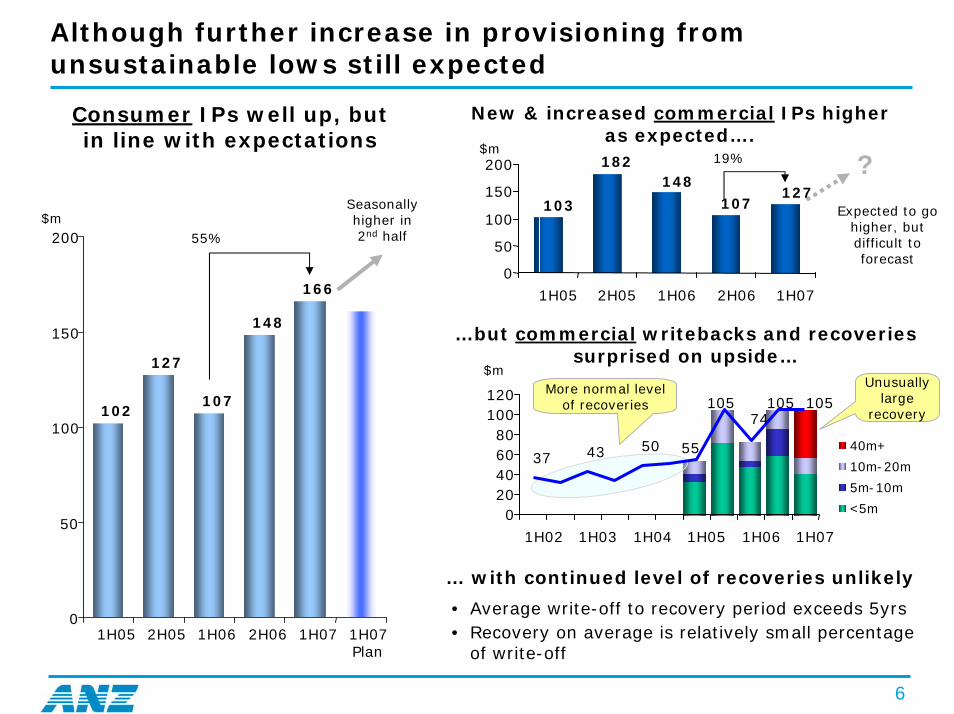
Although further increase in provisioning from unsustainable lows still expected
IPs well up, but in line with expectations
$m55%
New & increased commercial IPs higher as expected….
…but commercial writebacks and recoveries surprised on upside…
19%$m
Seasonally higher in 2nd half
?
Expected to go higher, but difficult to forecast
$mUnusually
large recovery
More normal level of recoveries
… with continued level of recoveries unlikely
• Average write-off to recovery period exceeds 5yrs• Recovery on average is relatively small percentage
of write-off
102
127
107
148
166
0
50
100
150
200
1H05 2H05 1H06 2H06 1H07 1H07Plan
127107103
182148
0
50
100
150
200
1H05 2H05 1H06 2H06 1H07
37 43 50
105 105
55
74105
020406080
100120
1H02 1H03 1H04 1H05 1H06 1H07
7
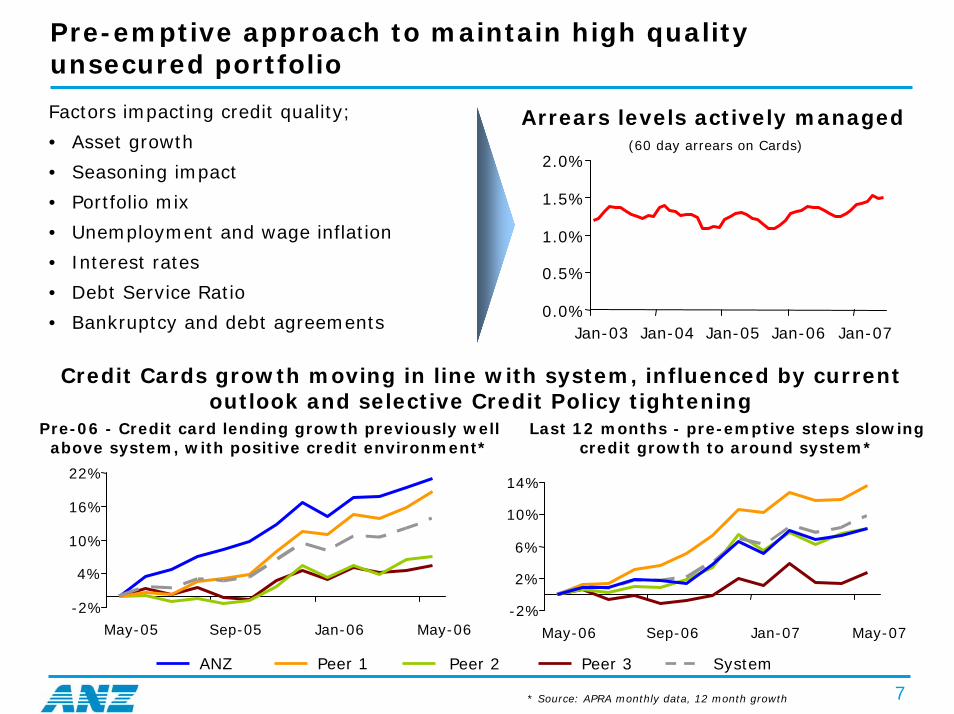
Pre-emptive approach to maintain high quality unsecured portfolio
Factors impacting credit quality;
• Asset growth
• Seasoning impact
• Portfolio mix
• Unemployment and wage inflation
• Interest rates
• Debt Service Ratio
• Bankruptcy and debt agreements
Arrears levels actively managed(60 day arrears on Cards)
* Source: APRA monthly data, 12 month growth
Credit Cards growth moving in line with system, influenced by current outlook and selective Credit Policy tightening
Last 12 months - pre-emptive steps slowing credit growth to around system*
Pre-06 - Credit card lending growth previously well above system, with positive credit environment*
ANZ Peer 1 Peer 2 Peer 3 System
0.0%
0.5%
1.0%
1.5%
2.0%
Jan-03 Jan-04 Jan-05 Jan-06 Jan-07
-2%
4%
10%
16%
22%
May-05 Sep-05 Jan-06 May-06-2%
2%
6%
10%
14%
May-06 Sep-06 Jan-07 May-07
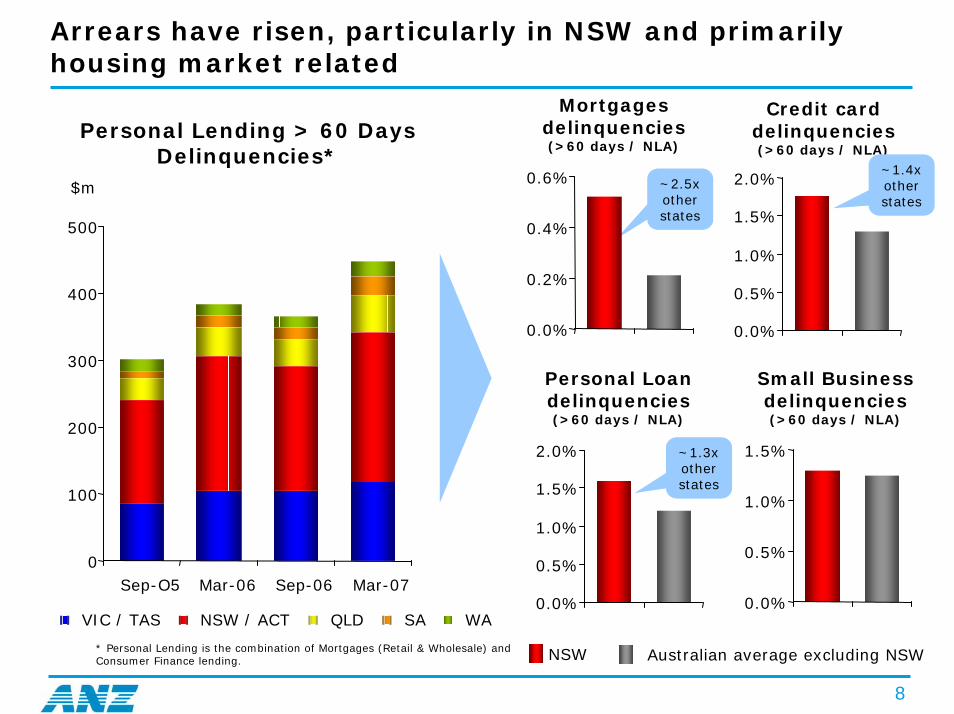
Arrears have risen, particularly in NSW and primarily housing market related
8
Personal Lending > 60 Days Delinquencies*
* Personal Lending is the combination of Mortgages (Retail & Wholesale) and Consumer Finance lending.
$m
NSW
Mortgages delinquencies (>60 days / NLA)
Credit card delinquencies (>60 days / NLA)
Personal Loan delinquencies (>60 days / NLA)
Small Business delinquencies (>60 days / NLA)
~2.5x other states
~1.4x other states
~1.3x other states
0
100
200
300
400
500
Sep-O5 Mar-06 Sep-06 Mar-07
VIC / TAS NSW / ACT QLD SA WA0.0%
0.5%
1.0%
1.5%
2.0%
0.0%
0.5%
1.0%
1.5%
0.0%
0.2%
0.4%
0.6%
0.0%
0.5%
1.0%
1.5%
2.0%
Australian average excluding NSW
9
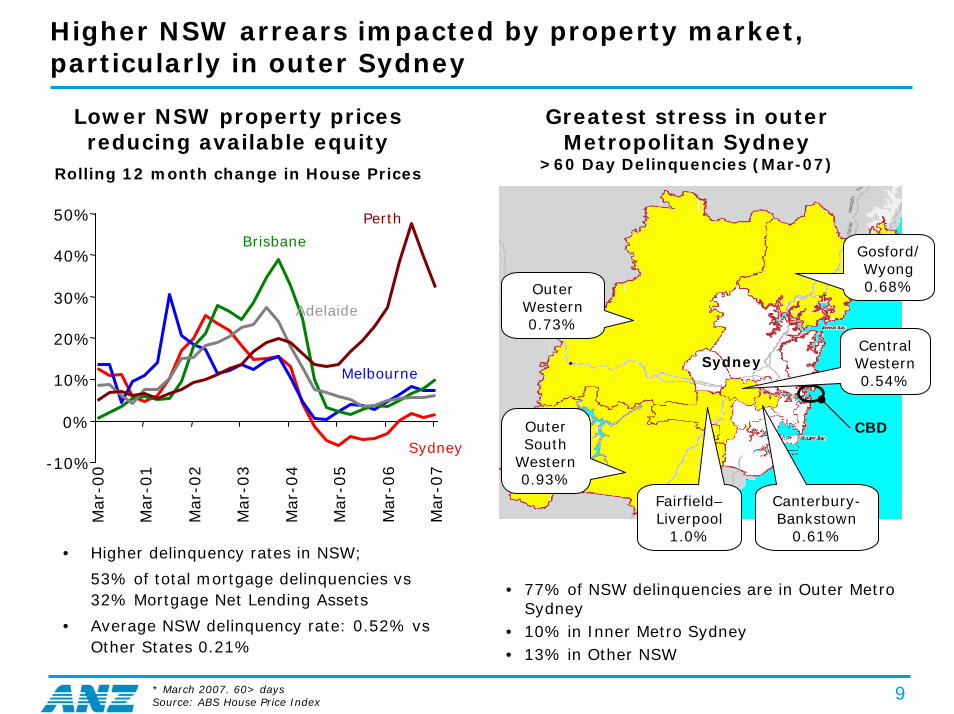
Higher NSW arrears impacted by property market, particularly in outer Sydney
Lower NSW property prices reducing available equity
Rolling 12 month change in House Prices
Greatest stress in outer Metropolitan Sydney
>60 Day Delinquencies (Mar-07)
Sydney
CBDSydney
Melbourne
Brisbane
Adelaide
Perth
-10%
0%
10%
20%
30%
40%
50%
Mar
-00
Mar
-01
Mar
-02
Mar
-03
Mar
-04
Mar
-05
Mar
-06
Mar
-07
Outer Western0.73%
Outer South
Western0.93%
Fairfield–Liverpool
1.0%
Canterbury-Bankstown
0.61%
Central Western 0.54%
Gosford/ Wyong0.68%
• Higher delinquency rates in NSW;
53% of total mortgage delinquencies vs 32% Mortgage Net Lending Assets
• Average NSW delinquency rate: 0.52% vs Other States 0.21%
• 77% of NSW delinquencies are in Outer Metro Sydney
• 10% in Inner Metro Sydney• 13% in Other NSW
* March 2007. 60> days Source: ABS House Price Index
10
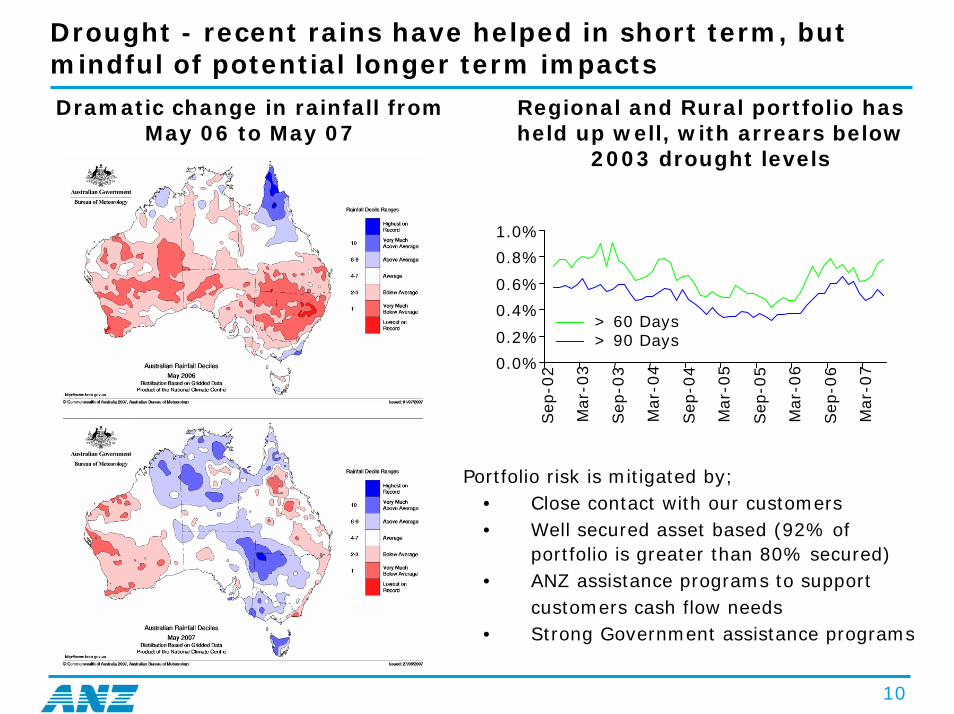
Drought - recent rains have helped in short term, but mindful of potential longer term impacts
Dramatic change in rainfall from May 06 to May 07
Regional and Rural portfolio has held up well, with arrears below
2003 drought levels
Portfolio risk is mitigated by;• Close contact with our customers• Well secured asset based (92% of
portfolio is greater than 80% secured)• ANZ assistance programs to support
customers cash flow needs• Strong Government assistance programs
0.0%
0.2%
0.4%
0.6%
0.8%
1.0%
Sep
-02
Mar
-03
Sep
-03
Mar
-04
Sep
-04
Mar
-05
Sep
-05
Mar
-06
Sep
-06
Mar
-07
> 60 Days > 90 Days

11
Impacts from drought can be beyond the obvious -electricity prices up significantly, with water a key input
Calendar 2008 Electricity Futures Prices(dollars per megawatt hour)
Electricity estimated to represent around 5%
of business input costs, so potentially significant impact
Tarongwater
capacity reduction
Start of Q2
Water issue: Swanbank
Water issue:
Hydro Tas
Snowy warning announcement
Jan 07 Feb 07 Mar 07 Apr 07 May 07 Jun 07 July 07
$/MWh
0
10
20
30
40
50
60
70
80
90
100
NSW Calendar 2008 (cal08) Vic Calendar 2008 (cal08)SA Calendar 2008 (cal08) QLD Calendar 2008 (cal08)
Source: ANZ Institutional Banking
12
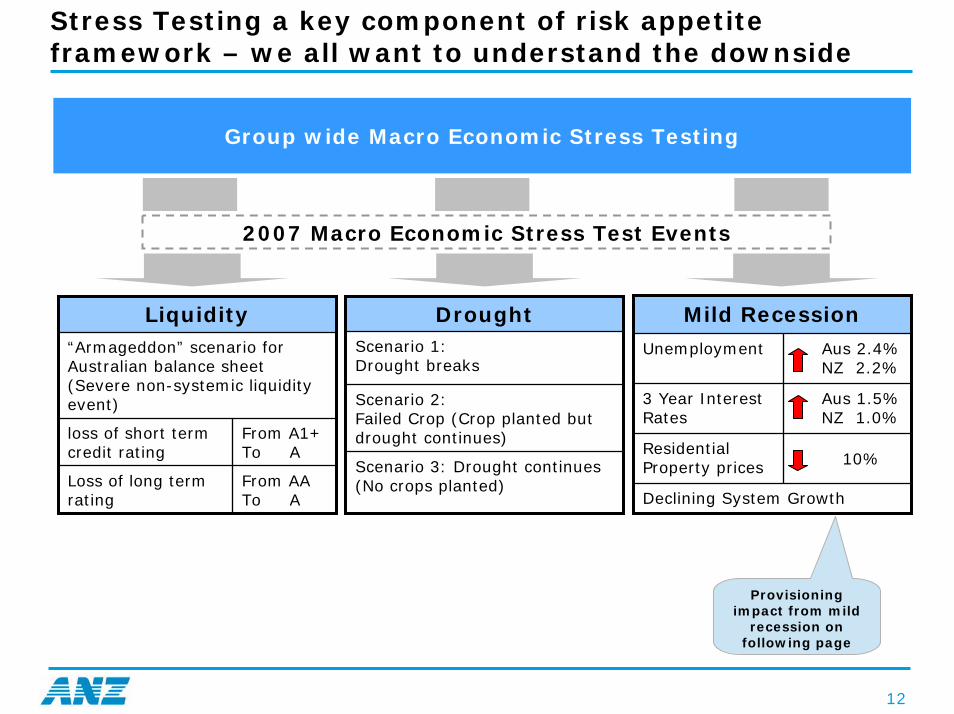
Stress Testing a key component of risk appetite framework – we all want to understand the downside
Group wide Macro Economic Stress Testing
2007 Macro Economic Stress Test Events
Mild Recession
Unemployment Aus 2.4%NZ 2.2%
3 Year Interest Rates
Aus 1.5%NZ 1.0%
Residential Property prices 10%
Declining System Growth
DroughtScenario 1:Drought breaks
Scenario 2: Failed Crop (Crop planted but drought continues)
Scenario 3: Drought continues (No crops planted)
Liquidity“Armageddon” scenario for Australian balance sheet (Severe non-systemic liquidity event)
loss of short term credit rating
From A1+ To A
Loss of long term rating
From AATo A
Provisioning impact from mild
recession on following page
13
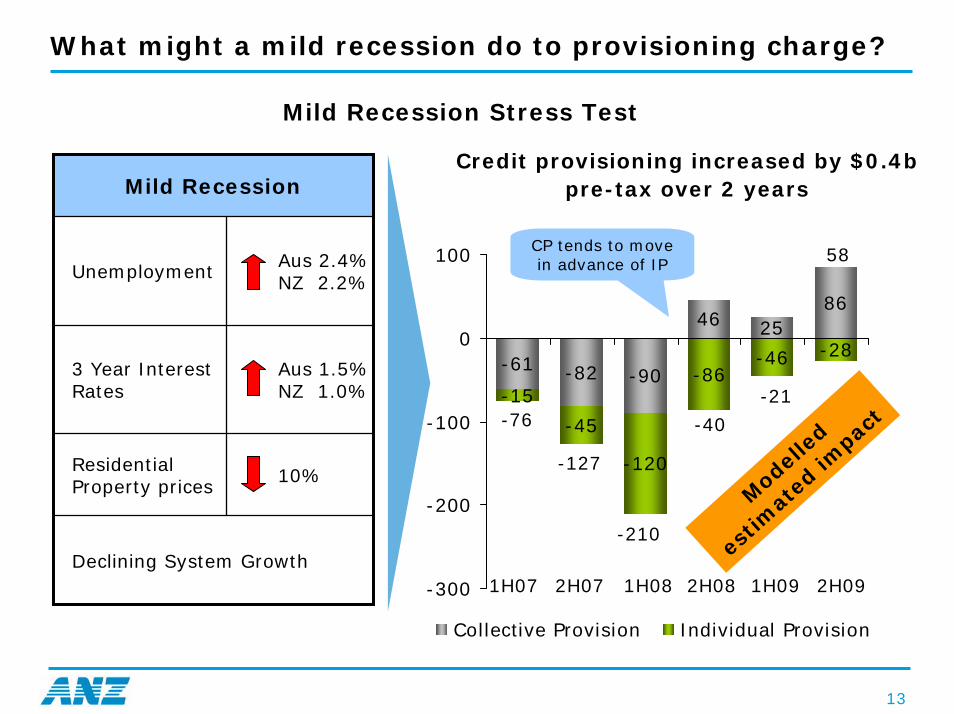
What might a mild recession do to provisioning charge?
Mild Recession Stress Test
Credit provisioning increased by $0.4b pre-tax over 2 yearsMild Recession
Unemployment Aus 2.4%NZ 2.2%
3 Year Interest Rates
Aus 1.5%NZ 1.0%
Residential Property prices 10%
Declining System Growth
-61 -82 -90
46 2586
-28-46-86
-15
-45
-120
-300
-200
-100
0
100
Collective Provision Individual Provision
Mod
elle
d
estim
ated
impac
t
1H07 2H07 1H08 2H08 1H09 2H09
-76
-127
-210
-40
-21
58CP tends to move in advance of IP
14
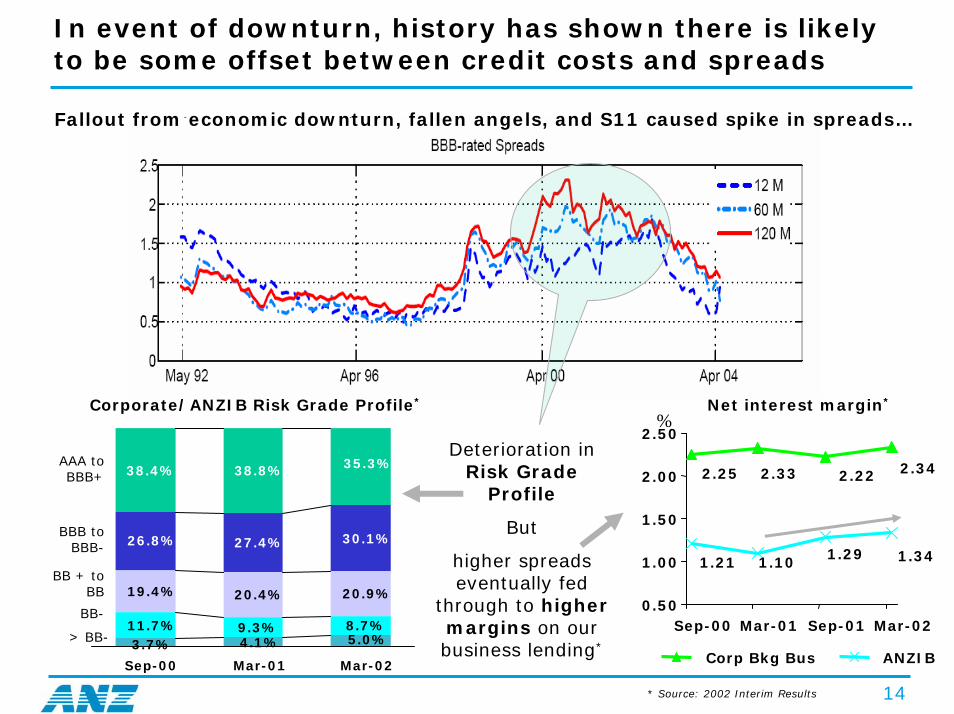
In event of downturn, history has shown there is likely to be some offset between credit costs and spreads
Fallout from economic downturn, fallen angels, and S11 caused spike in spreads…
%Deterioration in
Risk Grade Profile
But
higher spreads eventually fed
through to higher margins on our business lending*
AAA to BBB+
BBB to BBB-
BB + to BB
BB-
> BB-
Net interest margin*Corporate/ANZIB Risk Grade Profile*
11.7% 9.3% 8.7%
19.4% 20.4% 20.9%
27.4% 30.1%
38.8%
3.7% 4.1% 5.0%
26.8%
38.4% 35.3%
Sep-00 Mar-01 Mar-02
2.342.25 2.222.33
1.341.291.101.21
0.50
1.00
1.50
2.00
2.50
Sep-00 Mar-01 Sep-01 Mar-02
Corp Bkg Bus ANZIB
* Source: 2002 Interim Results
15
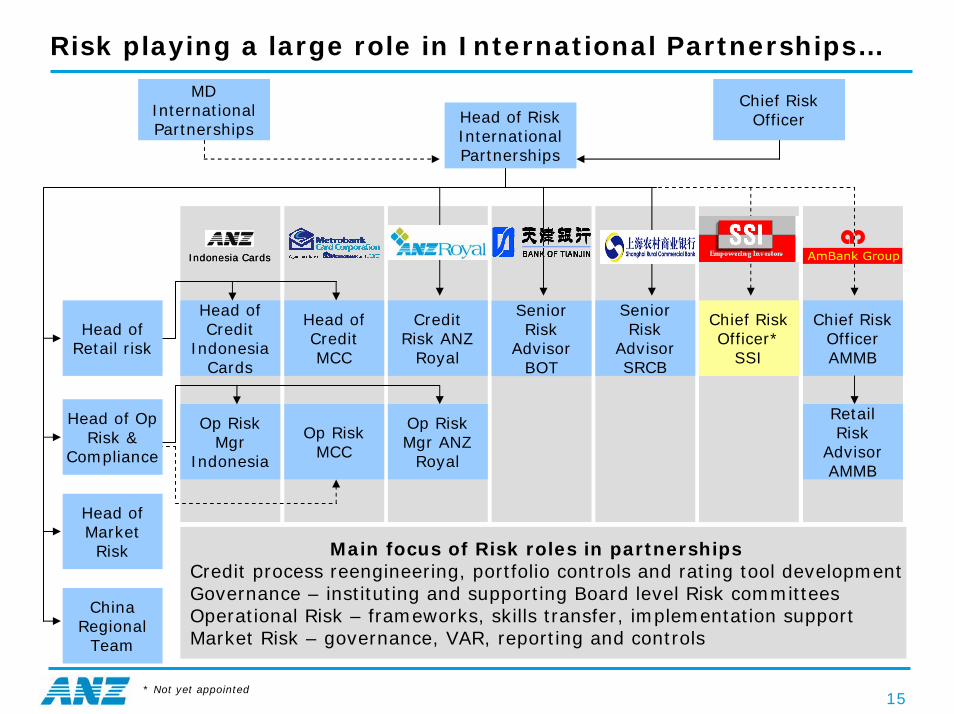
Risk playing a large role in International Partnerships…
Indonesia CardsIndonesia Cards
Head of Market Risk
China Regional
Team
Senior Risk
Advisor BOT
Chief Risk Officer AMMB
Credit Risk ANZ
Royal
Senior Risk
Advisor SRCB
Retail Risk
AdvisorAMMB
Op Risk Mgr ANZ
Royal
Op Risk Mgr
Indonesia
Op Risk MCC
Head of Credit
Indonesia Cards
Head of CreditMCC
Head of RiskInternational Partnerships
MD International Partnerships
Chief Risk Officer
Main focus of Risk roles in partnershipsCredit process reengineering, portfolio controls and rating tool developmentGovernance – instituting and supporting Board level Risk committeesOperational Risk – frameworks, skills transfer, implementation supportMarket Risk – governance, VAR, reporting and controls
Chief Risk Officer*
SSI
Head of Op Risk &
Compliance
Head of Retail risk
* Not yet appointed
16
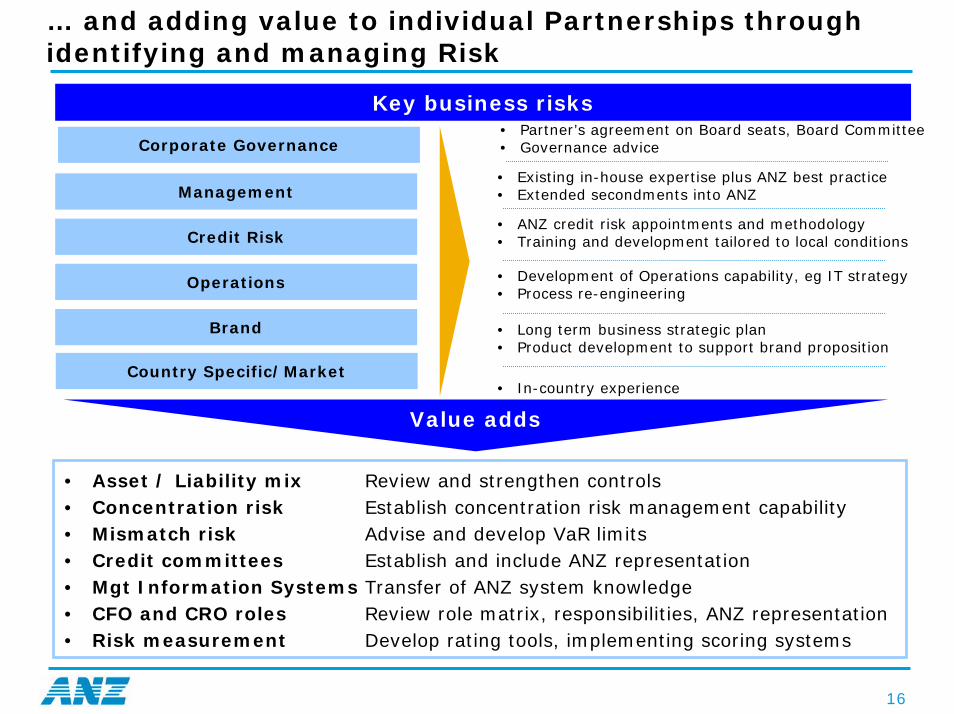
… and adding value to individual Partnerships through identifying and managing Risk
Management
Credit Risk
Brand
Operations
Country Specific/Market
• Long term business strategic plan• Product development to support brand proposition
• In-country experience
• Development of Operations capability, eg IT strategy• Process re-engineering
• Existing in-house expertise plus ANZ best practice• Extended secondments into ANZ
• ANZ credit risk appointments and methodology• Training and development tailored to local conditions
Key business risks
Corporate Governance• Partner’s agreement on Board seats, Board Committee• Governance advice
Value adds
• Asset / Liability mix Review and strengthen controls• Concentration risk Establish concentration risk management capability• Mismatch risk Advise and develop VaR limits• Credit committees Establish and include ANZ representation• Mgt Information Systems Transfer of ANZ system knowledge• CFO and CRO roles Review role matrix, responsibilities, ANZ representation• Risk measurement Develop rating tools, implementing scoring systems
17
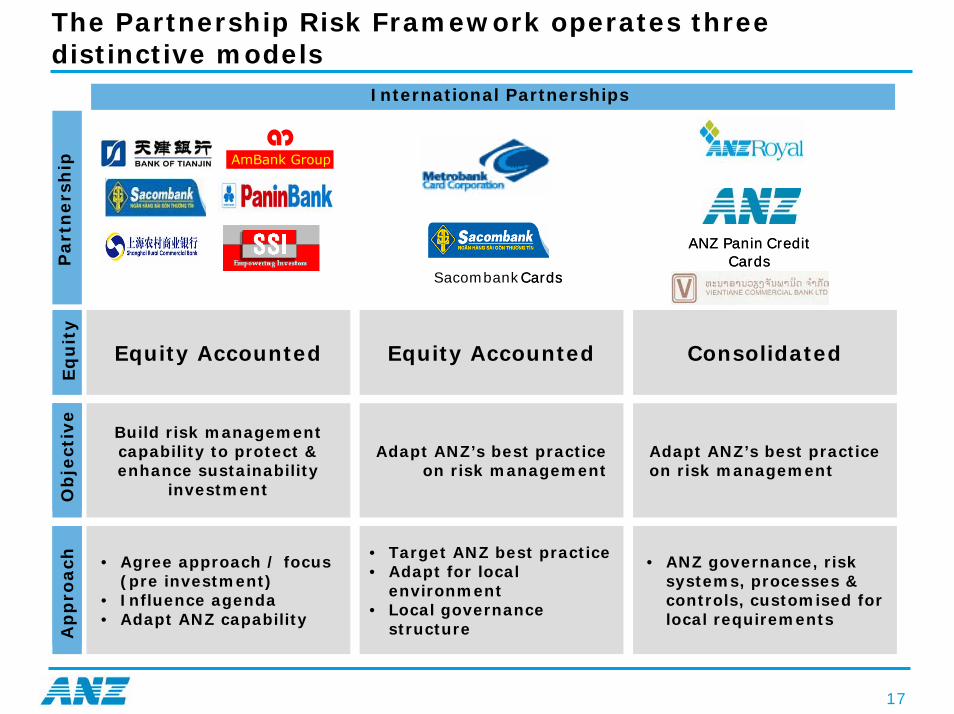
The Partnership Risk Framework operates three distinctive models
SacombankCards
ANZ Panin Credit Cards
Cards
ANZ Panin Credit Cards
Eq
uit
yP
art
ners
hip
International Partnerships
Equity Accounted Equity Accounted Consolidated
Ap
pro
ach
Ob
ject
ive
Ap
pro
ach
Ob
ject
ive
Adapt ANZ’s best practice on risk management
• ANZ governance, risk systems, processes & controls, customised for local requirements
• Agree approach / focus (pre investment)
• Influence agenda• Adapt ANZ capability
Adapt ANZ’s best practice on risk management
Build risk management capability to protect & enhance sustainability
investment
• Target ANZ best practice• Adapt for local
environment• Local governance
structure
18
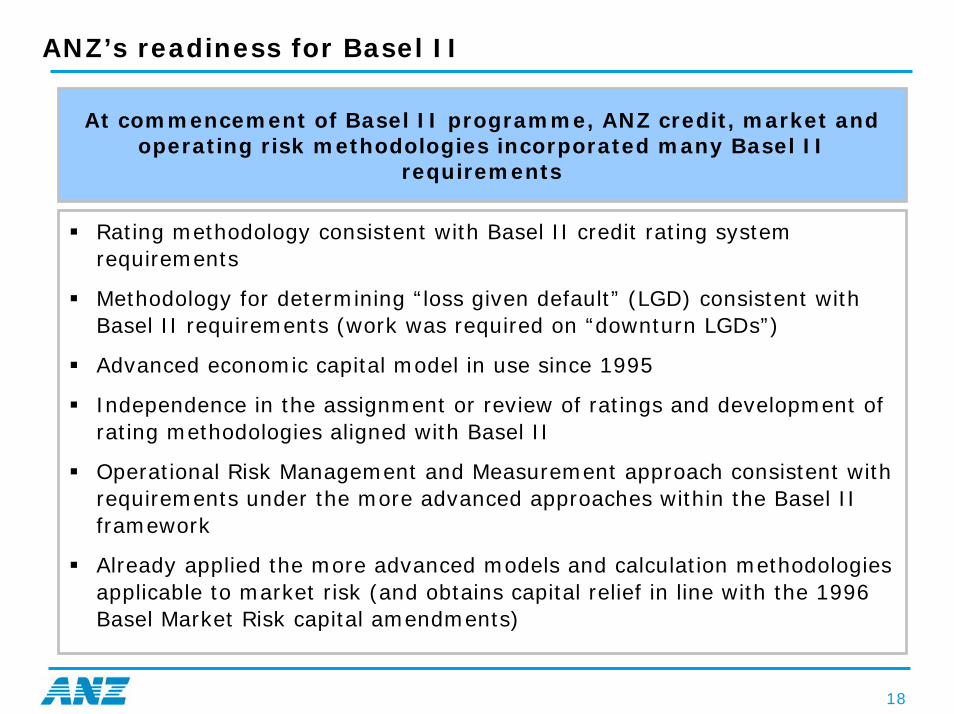
ANZ’s readiness for Basel II
At commencement of Basel II programme, ANZ credit, market and operating risk methodologies incorporated many Basel II
requirements
Rating methodology consistent with Basel II credit rating systemrequirements
Methodology for determining “loss given default” (LGD) consistent with Basel II requirements (work was required on “downturn LGDs”)
Advanced economic capital model in use since 1995
Independence in the assignment or review of ratings and development of rating methodologies aligned with Basel II
Operational Risk Management and Measurement approach consistent with requirements under the more advanced approaches within the Basel II framework
Already applied the more advanced models and calculation methodologies applicable to market risk (and obtains capital relief in line with the 1996 Basel Market Risk capital amendments)
19
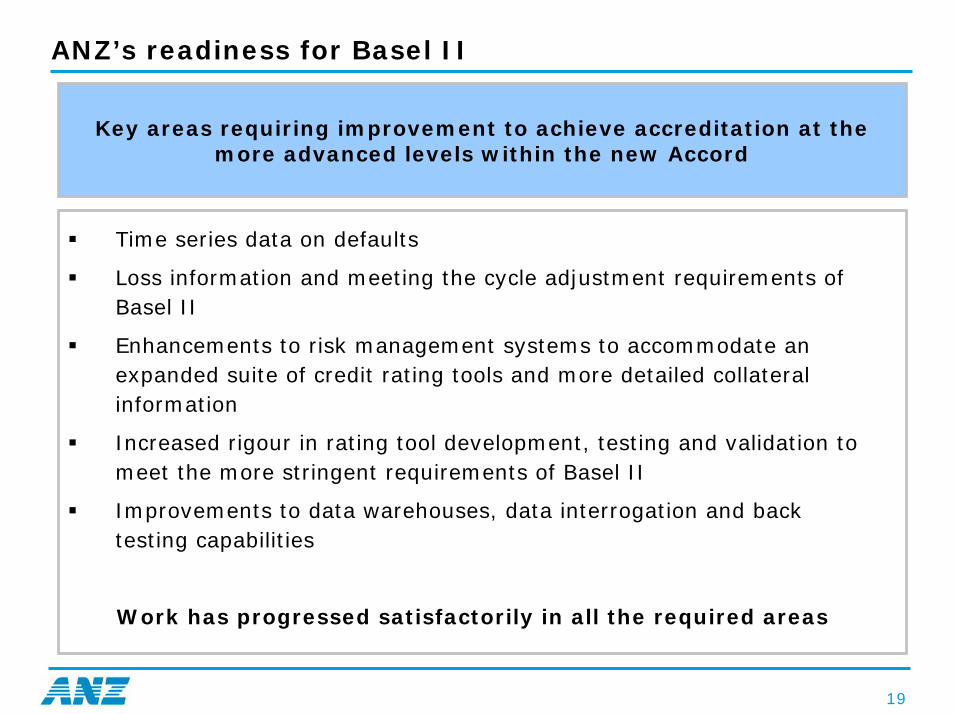
ANZ’s readiness for Basel II
Key areas requiring improvement to achieve accreditation at the more advanced levels within the new Accord
Time series data on defaults
Loss information and meeting the cycle adjustment requirements of Basel II
Enhancements to risk management systems to accommodate an expanded suite of credit rating tools and more detailed collateral information
Increased rigour in rating tool development, testing and validation to meet the more stringent requirements of Basel II
Improvements to data warehouses, data interrogation and back testing capabilities
Work has progressed satisfactorily in all the required areas

20
Other Risk matters
Inner city delinquencies
• No issues
• Previous large supply increase has been absorbed, lack of new supply coming on to market
Low Doc loans
• Lo doc 80 less than 1% of Portfolio
Sub prime market
• No exposure to sub-prime related RMBS or CDO issues.
• Total exposure to CDOs is $5.5m ($3m AA, $1m AA- and $1.5m BBB+)
• Total exposure to MBSs is $191m ($185.5 AAA, A $0.9m, AA $1.4m, AA- $1.6m, BBB $1.3m)
Anti Money Laundering
• Estimated total budgeted cost $66M over 3 years
21
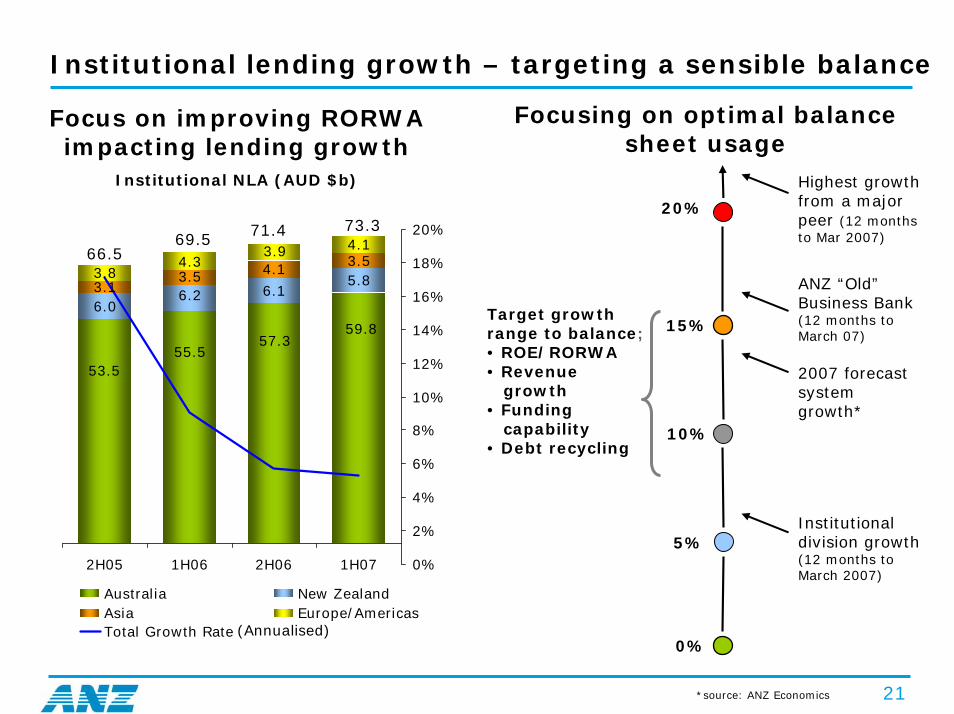
Institutional lending growth – targeting a sensible balance
Focusing on optimal balance sheet usage
Focus on improving RORWA impacting lending growth
Institutional NLA (AUD $b) Highest growth from a major peer (12 months to Mar 2007)
20%
Target growth range to balance;• ROE/RORWA• Revenue
growth• Funding
capability• Debt recycling
*source: ANZ Economics
0%
5%
10%
15%
Institutional division growth (12 months to March 2007)
2007 forecast system growth*
ANZ “Old”Business Bank (12 months to March 07)
6.06.1
5.83.14.1 3.5
3.84.3
4.1
59.857.3
55.553.5
6.23.5
3.9
2H05 1H06 2H06 1H07 0%
2%
4%
6%
8%
10%
12%
14%
16%
18%
20%
Australia New ZealandAsia Europe/AmericasTotal Growth Rate
66.569.5 71.4 73.3
(Annualised)

22
Additional information
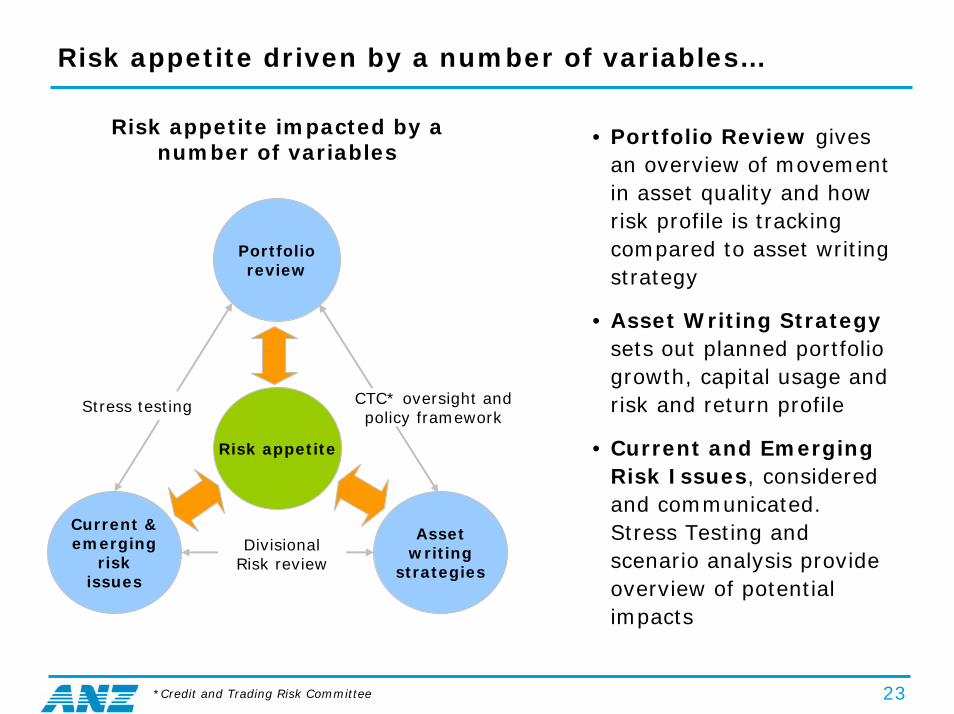
Risk appetite driven by a number of variables…
23
Asset writing
strategies
Risk appetite
Current & emerging
risk issues
Portfolio review
Stress testing
Divisional Risk review
CTC* oversight and policy framework
• Portfolio Review gives an overview of movement in asset quality and how risk profile is tracking compared to asset writing strategy
• Asset Writing Strategysets out planned portfolio growth, capital usage and risk and return profile
• Current and Emerging Risk Issues, considered and communicated. Stress Testing and scenario analysis provide overview of potential impacts
Risk appetite impacted by a number of variables
*Credit and Trading Risk Committee
24
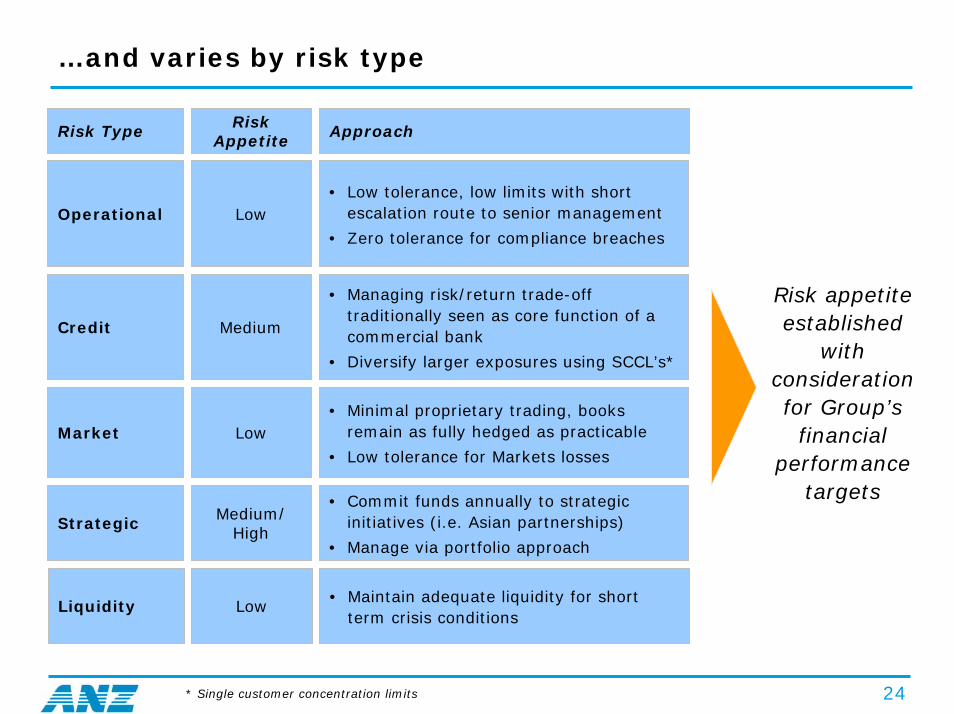
…and varies by risk type
Risk Type Risk Appetite
Approach
Operational Low• Low tolerance, low limits with short
escalation route to senior management
• Zero tolerance for compliance breaches
Credit Medium
• Managing risk/return trade-off traditionally seen as core function of a commercial bank
• Diversify larger exposures using SCCL’s*
Market Low• Minimal proprietary trading, books
remain as fully hedged as practicable
• Low tolerance for Markets losses
Strategic Medium/ High
• Commit funds annually to strategic initiatives (i.e. Asian partnerships)
• Manage via portfolio approach
Liquidity Low• Maintain adequate liquidity for short
term crisis conditions
Risk appetite established
with consideration for Group’s
financial performance
targets
* Single customer concentration limits
25
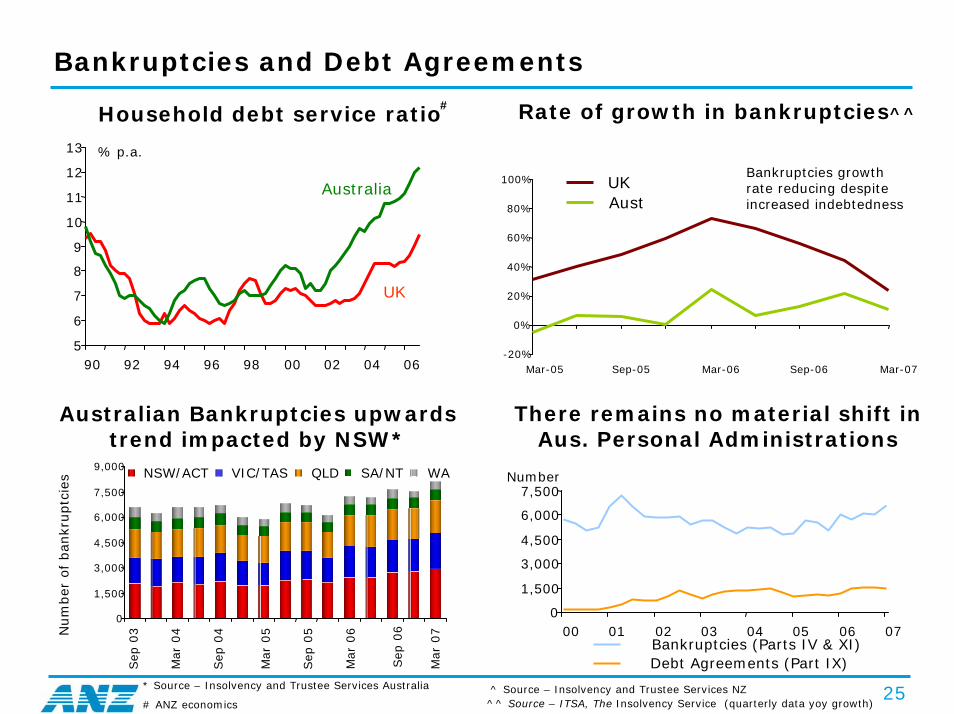
Bankruptcies and Debt Agreements
Australian Bankruptcies upwards trend impacted by NSW*
Sep
03
Mar
04
Sep
04
Mar
05
Sep
05
Mar
06
Sep
06
Mar
07Num
ber
of
ban
kruptc
ies
There remains no material shift in Aus. Personal Administrations
Number
Household debt service ratio
Australia
UK
Bankruptcies growth rate reducing despite increased indebtedness
# Rate of growth in bankruptcies^^
5
6
7
8
9
10
11
12
13
90 92 94 96 98 00 02 04 06
% p.a.
-20%
0%
20%
40%
60%
80%
100%
Mar-05 Sep-05 Mar-06 Sep-06 Mar-07
UKAust
0
1,500
3,000
4,500
6,000
7,500
9,000 NSW/ACT VIC/TAS QLD SA/NT WA
0
1,500
3,000
4,500
6,000
7,500
00 01 02 03 04 05 06 07Bankruptcies (Parts IV & XI)Debt Agreements (Part IX)
* Source – Insolvency and Trustee Services Australia
# ANZ economics^ Source – Insolvency and Trustee Services NZ^^ Source – ITSA, The Insolvency Service (quarterly data yoy growth)
26
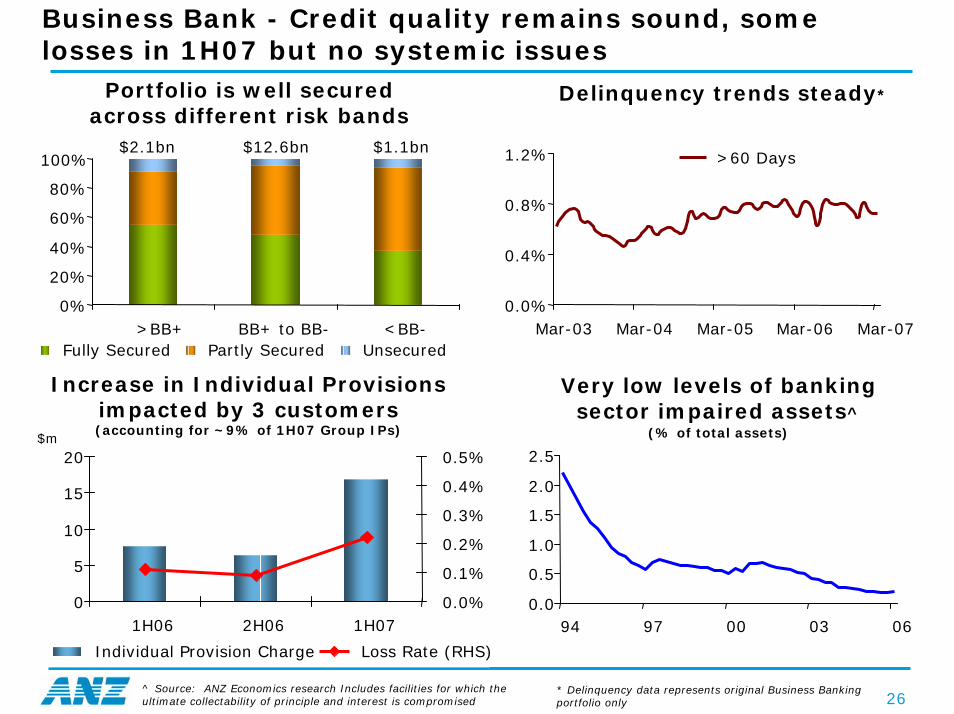
Business Bank - Credit quality remains sound, some losses in 1H07 but no systemic issues
$m
Increase in Individual Provisions impacted by 3 customers(accounting for ~9% of 1H07 Group IPs)
^ Source: ANZ Economics research Includes facilities for which theultimate collectability of principle and interest is compromised
Portfolio is well secured across different risk bands
$2.1bn $12.6bn $1.1bn
* Delinquency data represents original Business Banking portfolio only
Very low levels of banking sector impaired assets^
(% of total assets)
Delinquency trends steady*
0%
20%
40%
60%
80%
100%
>BB+ BB+ to BB- <BB-Fully Secured Partly Secured Unsecured
0.0%
0.4%
0.8%
1.2%
Mar-03 Mar-04 Mar-05 Mar-06 Mar-07
>60 Days
0
5
10
15
20
1H06 2H06 1H070.0%
0.1%
0.2%
0.3%
0.4%
0.5%
Individual Provision Charge Loss Rate (RHS)
0.0
0.5
1.0
1.5
2.0
2.5
94 97 00 03 06
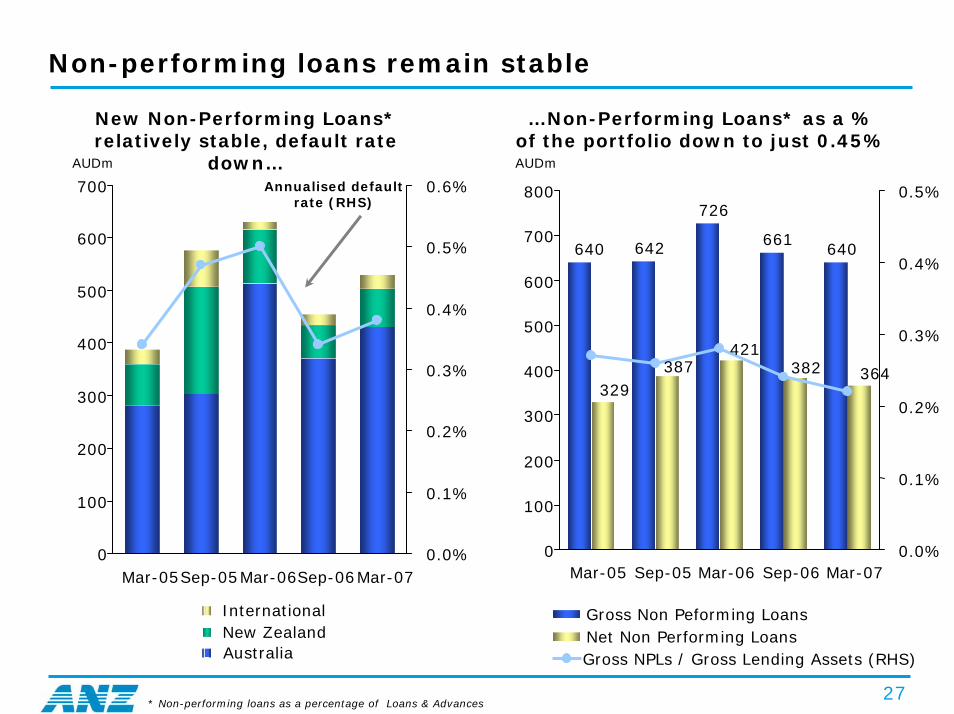
Non-performing loans remain stable
27
…Non-Performing Loans* as a % of the portfolio down to just 0.45%
New Non-Performing Loans* relatively stable, default rate
down…Annualised default
rate (RHS)
AUDmAUDm
0
100
200
300
400
500
600
700
Mar-05Sep-05Mar-06Sep-06Mar-070.0%
0.1%
0.2%
0.3%
0.4%
0.5%
0.6%
InternationalNew ZealandAustralia
642
726
661640640
364382421
387329
0
100
200
300
400
500
600
700
800
Mar-05 Sep-05 Mar-06 Sep-06 Mar-070.0%
0.1%
0.2%
0.3%
0.4%
0.5%
Gross Non Peforming LoansNet Non Performing LoansGross NPLs / Gross Lending Assets (RHS)
* Non-performing loans as a percentage of Loans & Advances
28
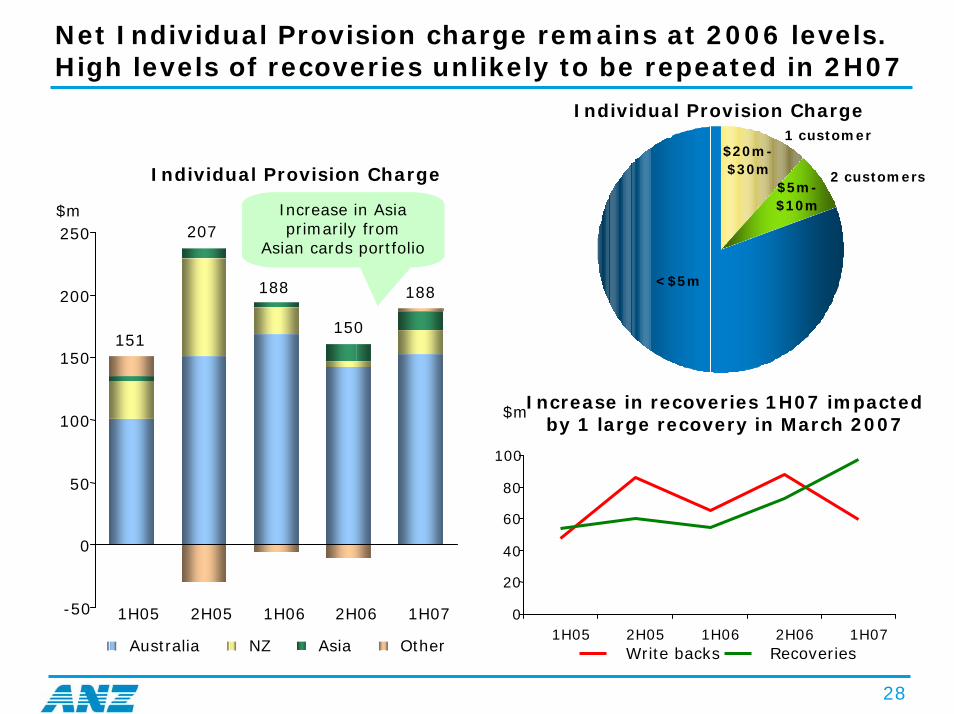
Net Individual Provision charge remains at 2006 levels. High levels of recoveries unlikely to be repeated in 2H07
Individual Provision Charge
Individual Provision Charge
$m
$m
$5m-$10m
$20m-$30m
<$5m
1 customer
2 customers
151
207
188
150
188
Increase in recoveries 1H07 impacted by 1 large recovery in March 2007
Increase in Asia primarily from
Asian cards portfolio
-50
0
50
100
150
200
250
1H05 2H05 1H06 2H06 1H07
Australia NZ Asia Other
0
20
40
60
80
100
1H05 2H05 1H06 2H06 1H07Write backs Recoveries
29
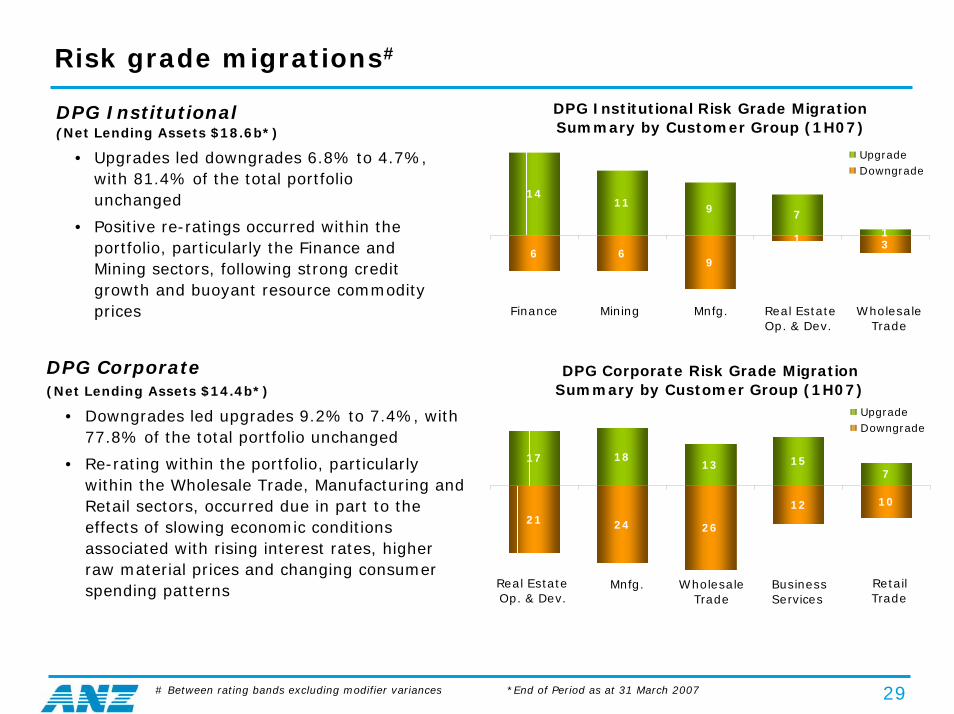
Risk grade migrations#
DPG Institutional Risk Grade Migration Summary by Customer Group (1H07)
1411 9 7
31
966
1
UpgradeDowngrade
Finance Mining Mnfg. Real EstateOp. & Dev.
WholesaleTrade
DPG Corporate Risk Grade MigrationSummary by Customer Group (1H07)
17 1813 15
7
1012
262421
UpgradeDowngrade
Real EstateOp. & Dev.
Mnfg. WholesaleTrade
Business Services
RetailTrade
DPG Institutional (Net Lending Assets $18.6b*)
• Upgrades led downgrades 6.8% to 4.7%, with 81.4% of the total portfolio unchanged
• Positive re-ratings occurred within the portfolio, particularly the Finance and Mining sectors, following strong credit growth and buoyant resource commodity prices
DPG Corporate(Net Lending Assets $14.4b*)
• Downgrades led upgrades 9.2% to 7.4%, with 77.8% of the total portfolio unchanged
• Re-rating within the portfolio, particularly within the Wholesale Trade, Manufacturing and Retail sectors, occurred due in part to the effects of slowing economic conditions associated with rising interest rates, higher raw material prices and changing consumer spending patterns
# Between rating bands excluding modifier variances *End of Period as at 31 March 2007
30
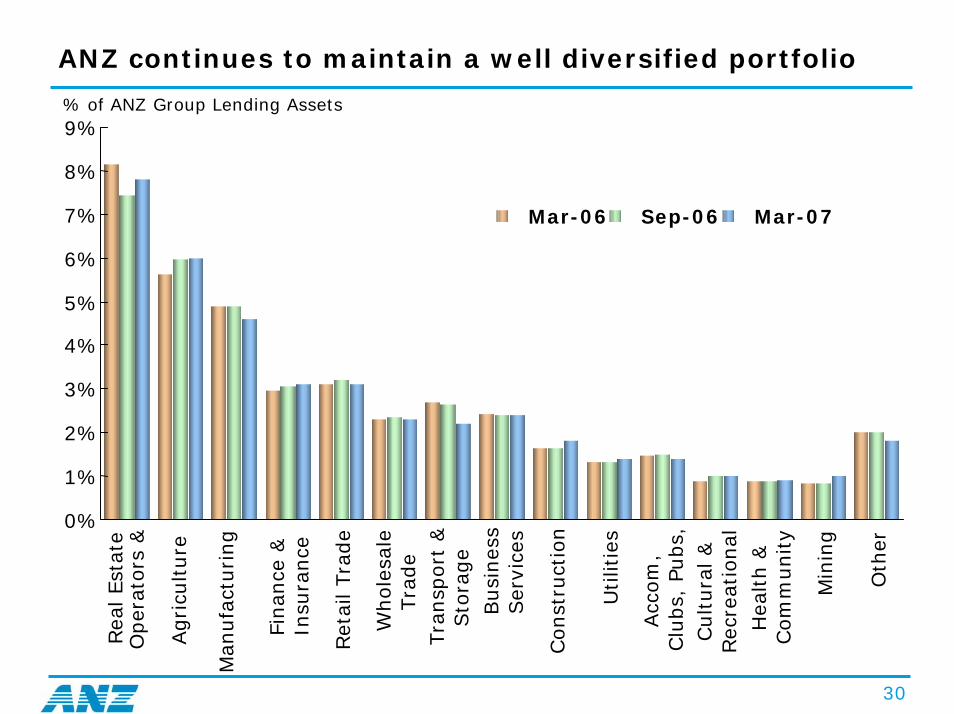
ANZ continues to maintain a well diversified portfolio
% of ANZ Group Lending Assets
0%
1%
2%
3%
4%
5%
6%
7%
8%
9%Rea
l Est
ate
Oper
ators
&
Agricu
lture
Man
ufa
cturing
Finan
ce &
Insu
rance
Ret
ail Tra
de
Whole
sale
Tra
de
Tra
nsp
ort
&Sto
rage
Busi
nes
sSer
vice
s
Const
ruct
ion
Utilit
ies
Acc
om
,Clu
bs,
Pubs,
Cultura
l &
Rec
reat
ional
Hea
lth &
Com
munity
Min
ing
Oth
er
Mar-06 Sep-06 Mar-07
31
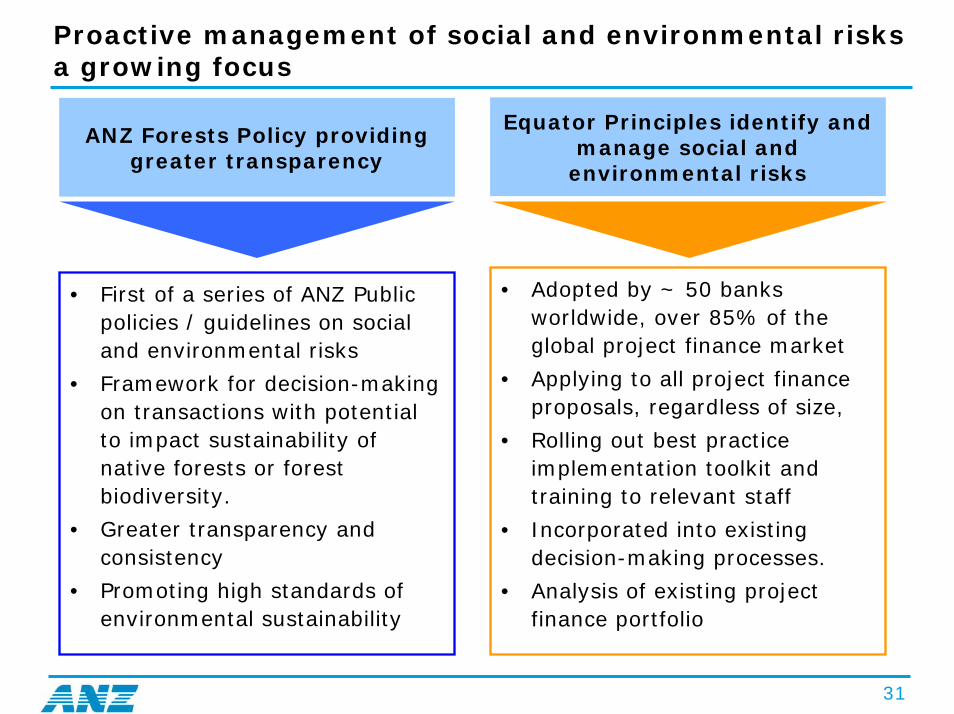
Proactive management of social and environmental risksa growing focus
Equator Principles identify and manage social and
environmental risks
ANZ Forests Policy providinggreater transparency
• Adopted by ~ 50 banks worldwide, over 85% of the global project finance market
• Applying to all project finance proposals, regardless of size,
• Rolling out best practice implementation toolkit and training to relevant staff
• Incorporated into existing decision-making processes.
• Analysis of existing project finance portfolio
• First of a series of ANZ Public policies / guidelines on social and environmental risks
• Framework for decision-making on transactions with potential to impact sustainability of native forests or forest biodiversity.
• Greater transparency and consistency
• Promoting high standards of environmental sustainability
32
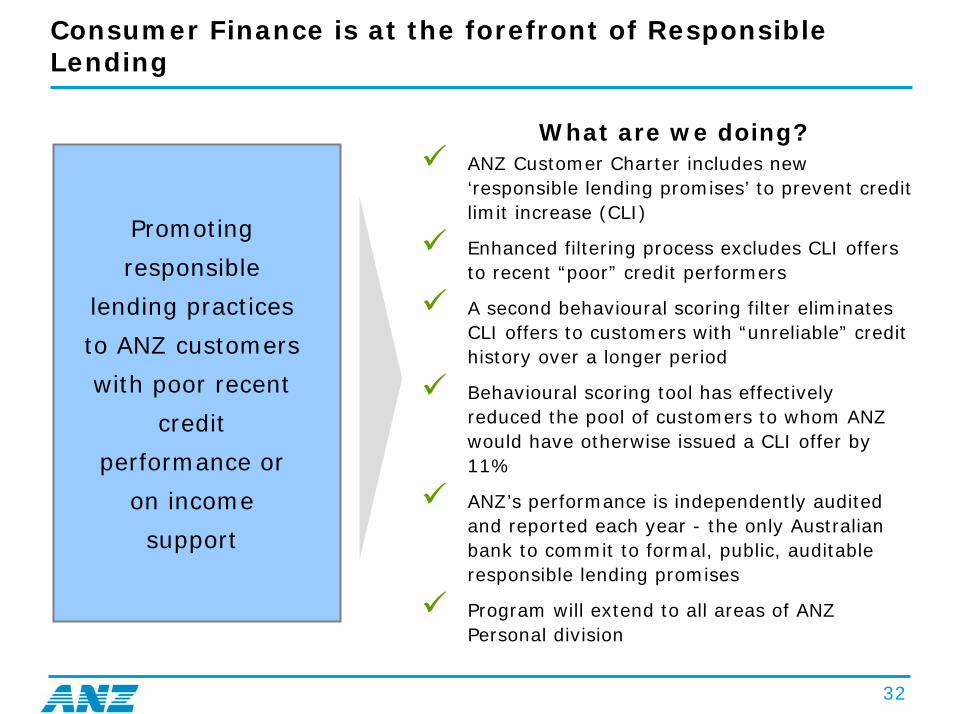
Consumer Finance is at the forefront of Responsible Lending
ANZ Customer Charter includes new ‘responsible lending promises’ to prevent credit limit increase (CLI)
Enhanced filtering process excludes CLI offers to recent “poor” credit performers
A second behavioural scoring filter eliminates CLI offers to customers with “unreliable” credit history over a longer period
Behavioural scoring tool has effectively reduced the pool of customers to whom ANZ would have otherwise issued a CLI offer by 11%
ANZ’s performance is independently audited and reported each year - the only Australian bank to commit to formal, public, auditable responsible lending promises
Program will extend to all areas of ANZ Personal division
What are we doing?
Promoting
responsible
lending practices
to ANZ customers
with poor recent
credit
performance or
on income
support
33
Economic factors impacting the credit environment
34
Australian Credit Cycle Trends– Key Facts
Credit quality remains sound
• No clear signs of systemic deterioration
• Private sector credit growth strong (near 15%) but converging towards income growth
• Consumer confidence trending upwards since 2006
Increased household debt more than offset by growth in net assets
• 2/3 households have little or no debt
• HH debt to income and DSR at record levels but HH debt capacity high
– HH assets dwarf liabilities
– HH gearing increased<10% over 17years
• Housing affordability increasingly an issue
No indicators to support delinquency rise
• No proven relationship between DSR and NPL
• High correlation between unemployment and NPLs - unemployment at 30 year lows
35
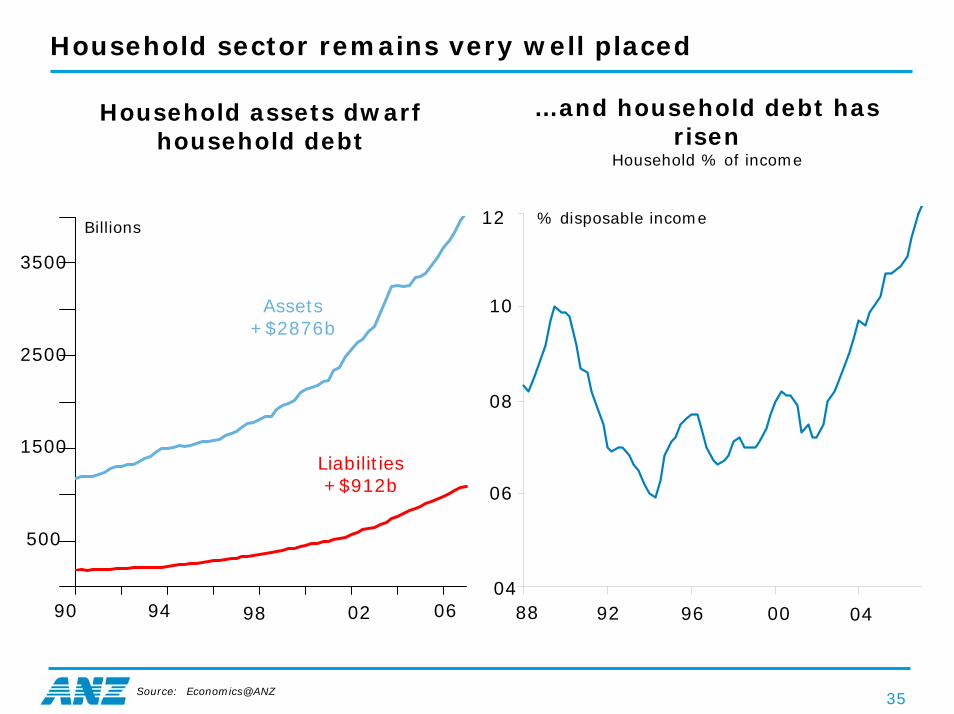
Household sector remains very well placed
Household assets dwarf household debt
…and household debt has risen
Household % of income
88 92 96 00 0490 94 98 02 06
06
08
10
12
04
1500
500
2500
3500
Assets+$2876b
Liabilities+$912b
% disposable incomeBillions
Source: Economics@ANZ
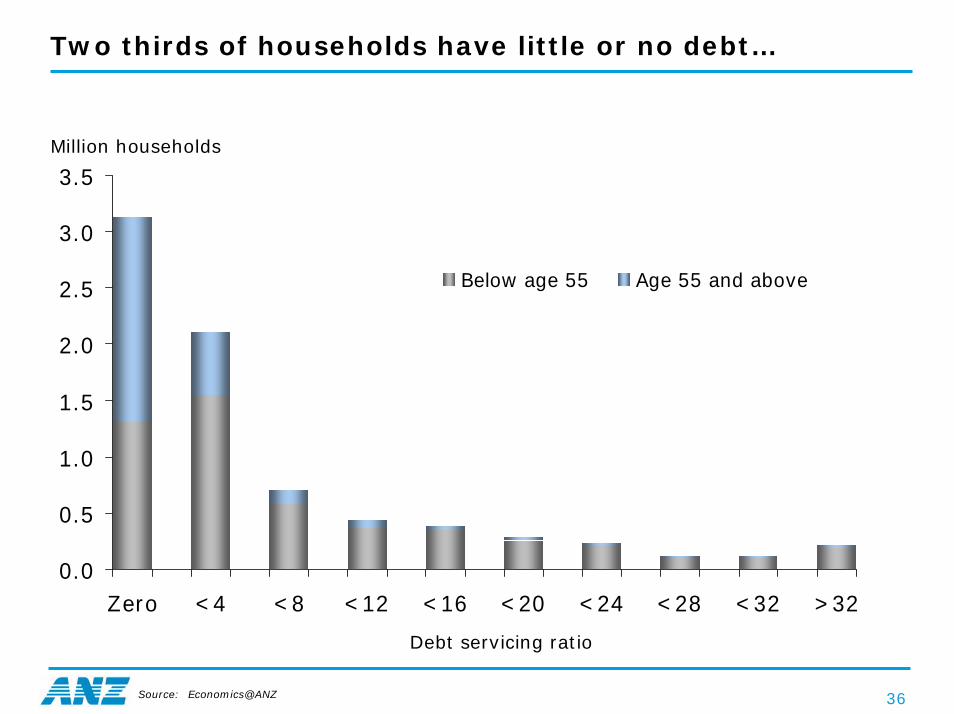
36
Two thirds of households have little or no debt…
0.0
0.5
1.0
1.5
2.0
2.5
3.0
3.5
Zero <4 <8 <12 <16 <20 <24 <28 <32 >32
Below age 55 Age 55 and above
Million households
Debt servicing ratio
Source: Economics@ANZ
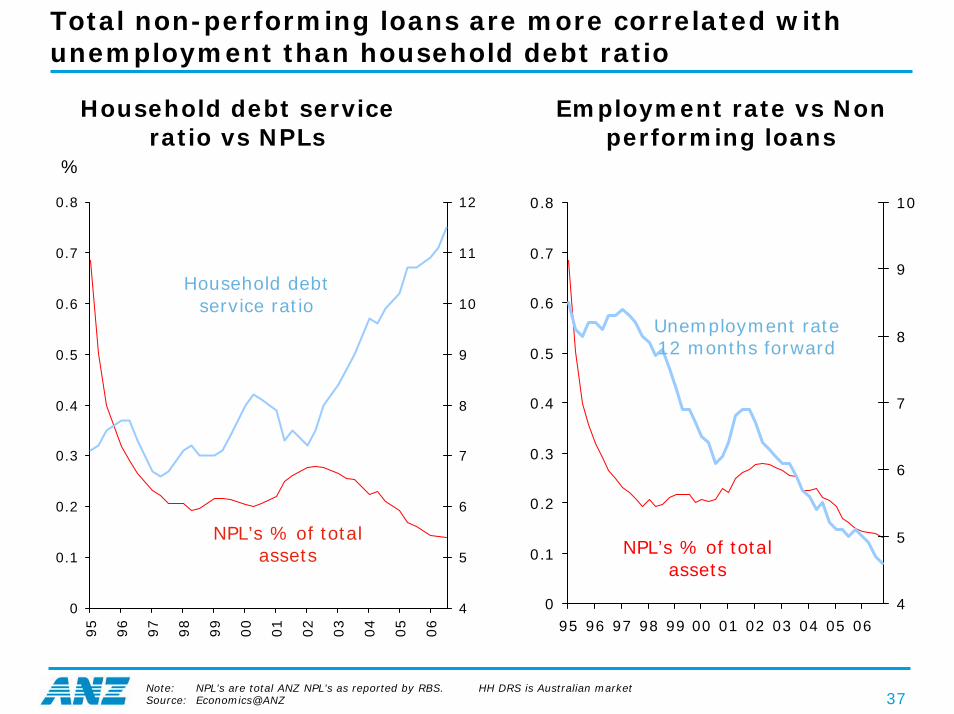
37
Total non-performing loans are more correlated with unemployment than household debt ratio
Household debt service ratio vs NPLs
Employment rate vs Non performing loans
0
0.1
0.2
0.3
0.4
0.5
0.6
0.7
0.8
95
96
97
98
99
00
01
02
03
04
05
06
4
5
6
7
8
9
10
11
12
0
0.1
0.2
0.3
0.4
0.5
0.6
0.7
0.8
95 96 97 98 99 00 01 02 03 04 05 064
5
6
7
8
9
10
Household debt service ratio
NPL’s % of total assets
%
Unemployment rate 12 months forward
NPL’s % of total assets
Note: NPL’s are total ANZ NPL’s as reported by RBS. HH DRS is Australian marketSource: Economics@ANZ
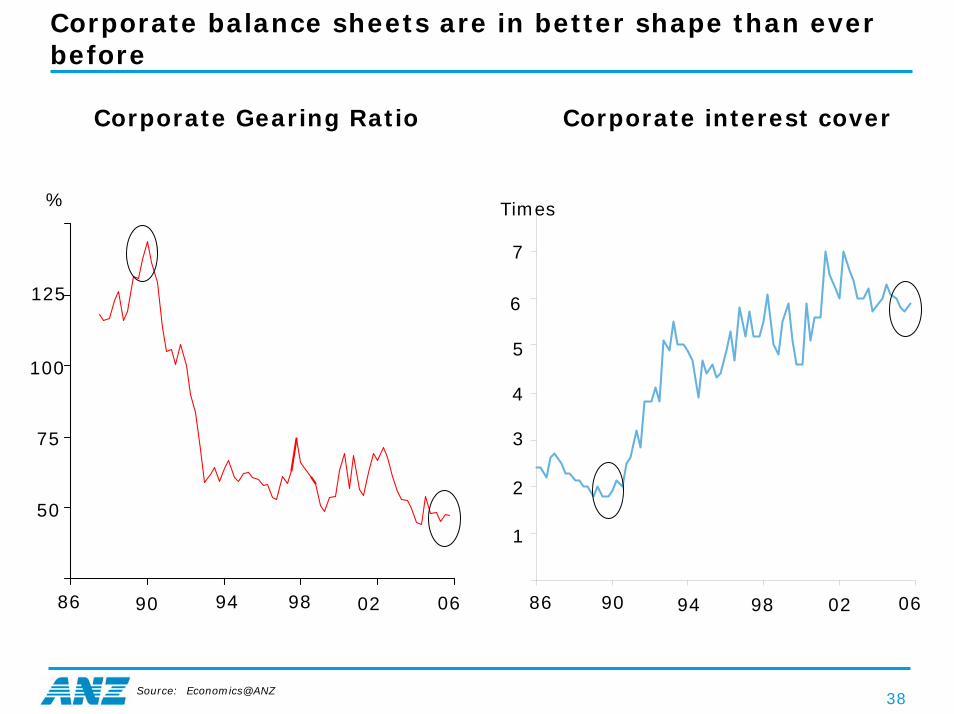
38
Corporate balance sheets are in better shape than ever before
Corporate Gearing Ratio Corporate interest cover
86 90 98 02 06 86 90 94 98 02 0694
1
3
5
7
50
75
125
100
6
4
2
% Times
Source: Economics@ANZ
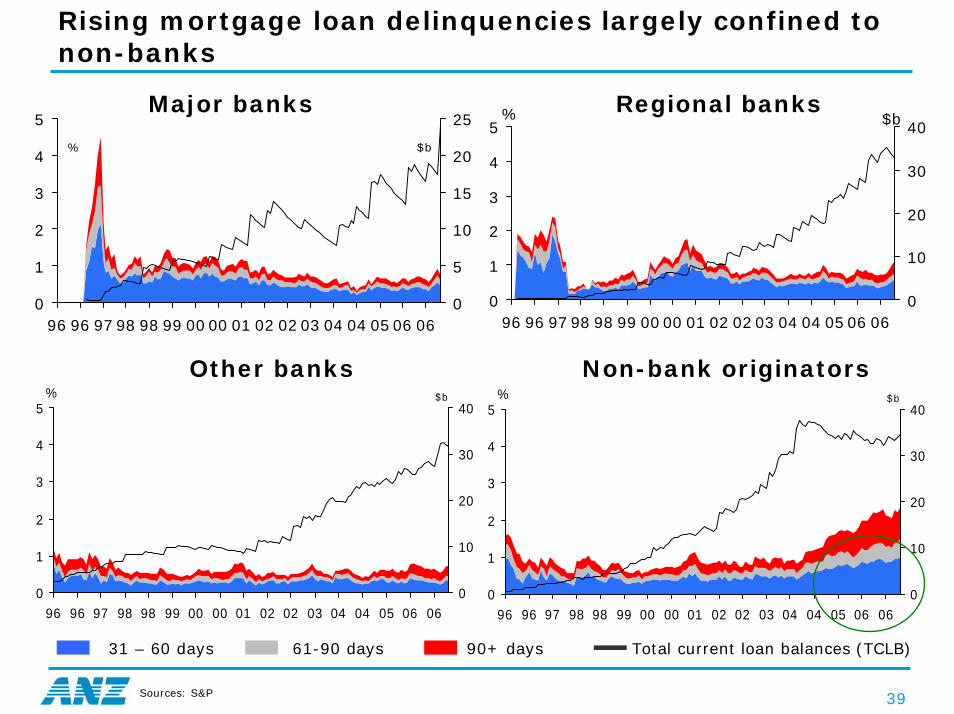
39
Rising mortgage loan delinquencies largely confined to non-banks
Major banks Regional banks
0
1
2
3
4
5
96 96 97 98 98 99 00 00 01 02 02 03 04 04 05 06 060
5
10
15
20
25
% $b
0
1
2
3
4
5
96 96 97 98 98 99 00 00 01 02 02 03 04 04 05 06 060
10
20
30
40% $b
0
1
2
3
4
5
96 96 97 98 98 99 00 00 01 02 02 03 04 04 05 06 060
10
20
30
40% $b
Non-bank originatorsOther banks
0
1
2
3
4
5
96 96 97 98 98 99 00 00 01 02 02 03 04 04 05 06 060
10
20
30
40% $b
31 – 60 days 61-90 days 90+ days Total current loan balances (TCLB)
Sources: S&P
40
The material in this presentation is general background information about the Bank’s activities current at the date of the presentation. It is information given in summary
form and does not purport to be complete. It is not intended to be relied upon as advice to investors or potential investors and does not take into account the investment
objectives, financial situation or needs of any particular investor. These should be considered, with or without professional advice when deciding if an investment is
appropriate.
For further information visit
www.anz.comor contact
Stephen HigginsHead of Investor Relations
ph: (613) 9273 4185 fax: (613) 9273 4899 e-mail: [email protected]


