21
What does it mean for Ethiopia’s development? Uganda’s low carbon development opportunities Date 21 st August 2014 Shuaib Lwasa, Lead Author WG 3 Makerere University
| Date post: | 02-Jan-2016 |
| Category: |
Documents |
| Upload: | melvin-gray |
| View: | 28 times |
| Download: | 0 times |

What does it mean for Ethiopia’s development?
Uganda’s low carbon development opportunities
Date 21st August 2014
Shuaib Lwasa, Lead Author WG 3
Makerere University
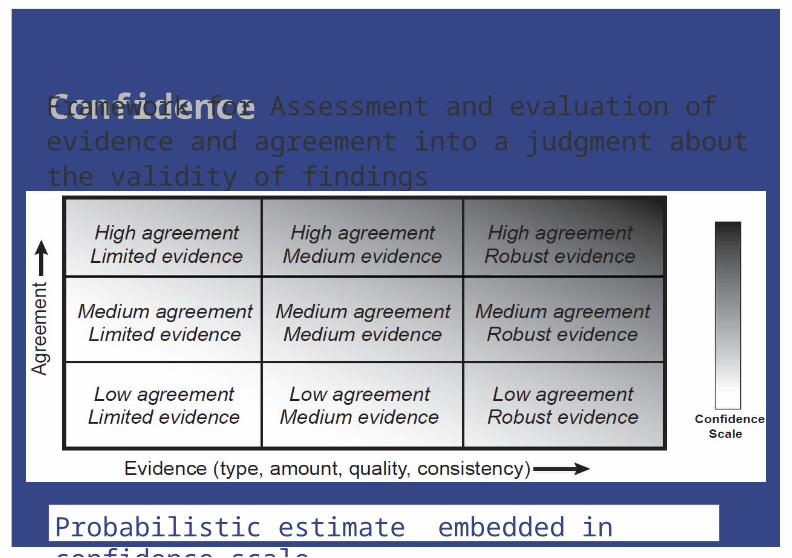
ConfidenceFramework for Assessment and evaluation of evidence and agreement into a judgment about the validity of findings
Probabilistic estimate embedded in confidence scale

3
Climate change, a globalcommons problem: The drivers
4
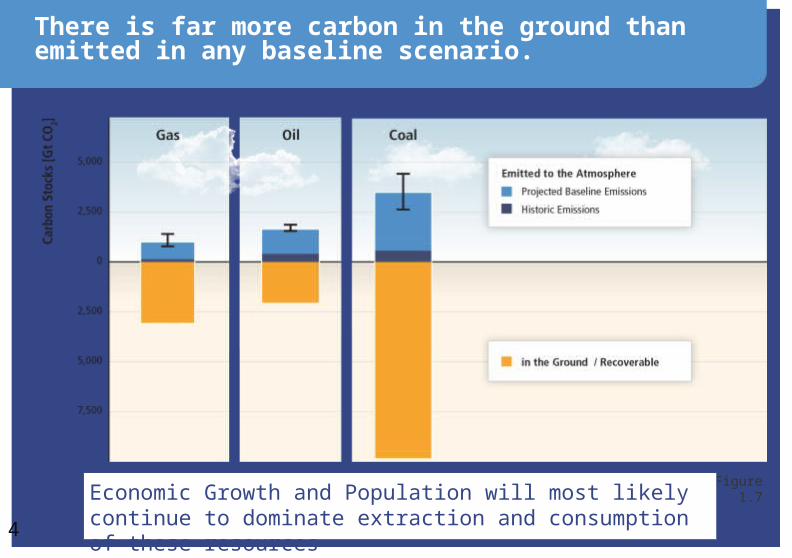
There is far more carbon in the ground than emitted in any baseline scenario.
Based on SRREN Figure 1.7Economic Growth and Population will most likely continue to dominate extraction and consumption of these resources

5
GHG emissions growth has accelerated despite reduction efforts.
6
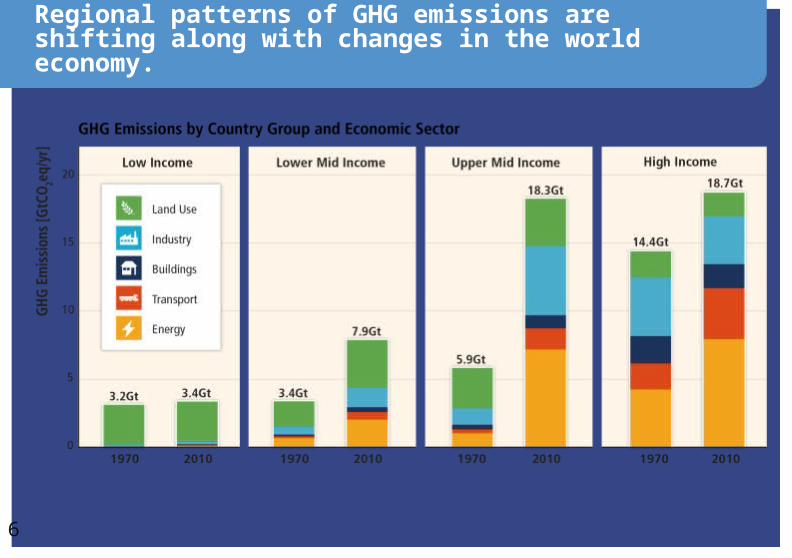
Regional patterns of GHG emissions are shifting along with changes in the world economy.

“
”
Limiting warming to 2°C involves substantial technological, economic
and institutional challenges.
WG III SPM AR5
8
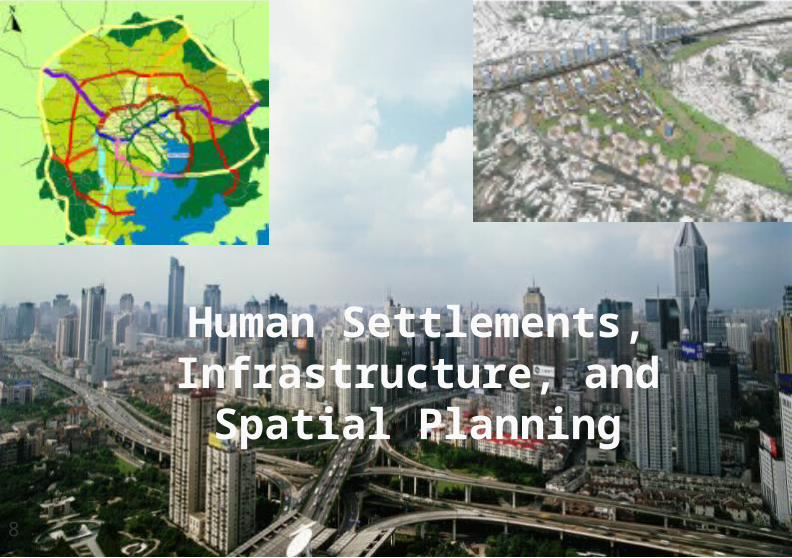
Human Settlements,Infrastructure, and
Spatial Planning
9
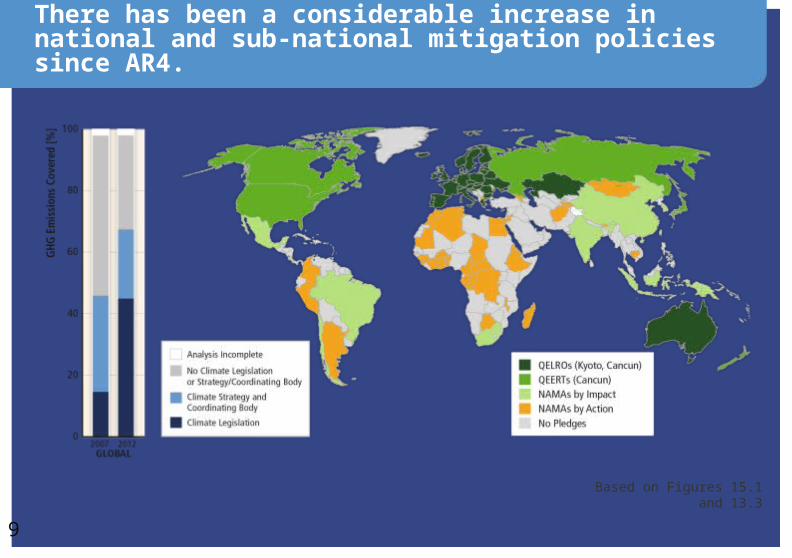
There has been a considerable increase in national and sub-national mitigation policies since AR4.
Based on Figures 15.1 and 13.3

Not IPCC finding but a local example
Residential Buildings0%
Commercial Institutional Facil-ities1%
Energy Generation73%
Energy use in industrial processes
3%
On-road transport
0%
Railways0%
Water-borne navigation
0%
Aviation2%
Solid waste disposal
7%
Landfilled outside the
Community in the Analysis-
Year5%
Incineration and open burning
0%
Wastewater treatment and discharge
6%
Industrial processes and product uses3%
AFOLU0%
GHG Emission proportion by sector in Kampala: based on 2012 baseline
Based on 2012 baseline ~ Mt 42,960 from transportation over a period of 25 years.
The BRT NAMA targets reduction by 30%

“
”
The anticipated growth in urban population will require a massive
build-up of urban infrastructure, which is a key driver of
emissions across multiple sectors limited evidence, high agreement
WG III CH_12
In Africa, the urban population is
growing fasterUN-Habitat 2012/2013

“
”
That is happening in the second urbanization wave which is
dependent on significant increases in global
resource extraction and consumption
Swilling et al 2012
What does it mean for Ethiopia?
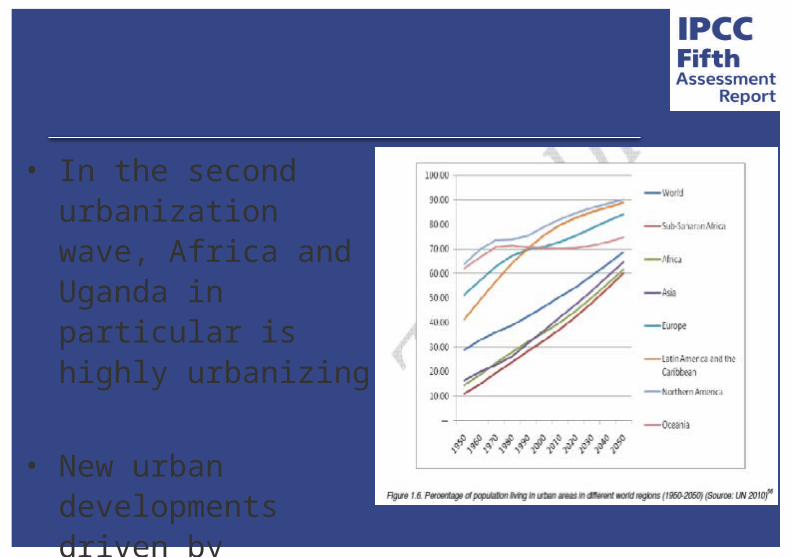
• In the second urbanization wave, Africa and Uganda in particular is highly urbanizing
• New urban developments driven by resource extractive industry

What does it mean for Uganda?
Although cities only occupy 4% of the
earth’s land surface, 75% of all natural resources are consumed within cities, and as of 2007Urbanization nationally and Kampala’s growth was at 3.72% by 2010 with a share of national population of 4.7% and projected share of 6.09% in 2025
Importance of taking action about small-medium sized citiesSource: OpenData_IUWM_31citiesAfrica accessed 2013

Key issues from findings for Uganda
• Infrastructure and urban form are strongly linked, especially among transportation infrastructure provision, travel demand and vehicle kilometres travelled (robust evidence, high agreement).
• Key urban form drivers of energy and GHG emissions are density, land use mix, connectivity, and accessibility (medium evidence, high agreement)

Key Opportunities
• The largest opportunities for future urban GHG emissions reduction are in rapidly urbanizing areas where urban form and infrastructure are not locked-in, but where there are often limited governance, technical, financial, and institutional capacities (robust evidence, high agreement)
• Greening urban systems, ecological enhancement, opportunities creation are important for cities in this wave
Key Issues for mitigation in Uganda
• Successful implementation of urban climate change mitigation strategies can provide co-benefits (robust evidence, high agreement).
• Thousands of cities are undertaking climate action plans, but their aggregate impact on urban emissions is uncertain (robust evidence, high agreement)
• The feasibility of spatial planning instruments for climate change mitigation is highly dependent on a city’s financial and governance capability (robust evidence, high agreement).

18
Sector-specific policies have been more widely used than economy-wide policies.
Based on Figure 10.15

Options of urban policies for reduction of emissions

Key Policy Options for consideration Ethiopia
Conclusion
• Cities and national governments have started to work towards reducing GHG emissions
• But future urban trajectories indicate that most likely cities will grow as extraction and consumption patterns change
• Reducing GHG emissions from cities and making them sustainable is key to a national, regional and global cumulative reduction of emissions


