HERMAN DELEECK CENTRE FOR SOCIAL POLICY Tim Goedemé, Tess Penne, Tine Hufkens, Alexandros Karakitsios, Anikó Bernát, Bori Simonovits, Elena Carillo Alvarez, Eleni Kanavitsa, Irene Cussó Parcerisas, Jordi Riera Romaní, Lauri Mäkinen, Manos Matsaganis, Marco Arlotti, Marianna Kopasz, Péter Szivós, Veli-Matti Ritakallio, Yuri Kazepov, Karel Van den Bosch & Bérénice Storms What Does It Mean To Live on the Poverty Threshold? Lessons From Reference Budgets WORKING PAPER NO. 17.07 April 2017 University of Antwerp Herman Deleeck Centre for Social Policy centrumvoorsociaalbeleid.be
Transcript
HERMAN DELEECK
CENTRE FOR SOCIAL POLICY
Tim Goedemé, Tess Penne, Tine Hufkens, Alexandros
Karakitsios, Anikó Bernát, Bori Simonovits, Elena
Carillo Alvarez, Eleni Kanavitsa, Irene Cussó
Parcerisas, Jordi Riera Romaní, Lauri Mäkinen,
Manos Matsaganis, Marco Arlotti, Marianna Kopasz,
Péter Szivós, Veli-Matti Ritakallio, Yuri Kazepov, Karel
Van den Bosch & Bérénice Storms
What Does It Mean To Live on the Poverty
Threshold? Lessons From Reference
Budgets
WORKING PAPER
NO. 17.07
April 2017
University of Antwerp Herman Deleeck Centre for Social Policy
centrumvoorsociaalbeleid.be
1 CSB Working Paper No. 17 / 07
What Does It Mean To Live on the Poverty Threshold? Lessons From Reference
Romaní, Lauri Mäkinen, Manos Matsaganis, Marco Arlotti, Marianna Kopasz, Péter Szivós,
Veli-Matti Ritakallio, Yuri Kazepov, Karel Van den Bosch & Bérénice Storms
Working Paper No. 17 / 07
April 2017
ABSTRACT
Over the past 20 years the use of the at-risk-of-poverty threshold has become increasingly widespread. However, as is well known, the indicator builds on a number of assumptions and simplifications that have given rise to several criticisms. In this paper we illustrate how reference budgets can help to ‘contextualise’ the weaknesses of the at-risk-of-poverty threshold by generating more insight into the kind of living standard that can be afforded with an income at the level of the threshold in different countries. This provides essential background information for those using the indicator. More in particular, we make use of the first effort to construct cross-country comparable reference budgets in Europe to show what the strong cross-national differences in living standards imply in practice for the adequacy of incomes at the level of the at-risk-of-poverty threshold. The budgets show that in the poorest EU Member States, even adequate food and housing are barely affordable at the level of the threshold, whereas a decent living standard is much more in reach for those living on the threshold in the richer EU Member States. The reference budgets also suggest that the poverty risk of some groups (for instance children) is underestimated relative to that of other age groups, while the poverty risk of homeowners is probably relatively overestimated. To be published in Cantillon, B., Goedemé, T. and Hills, J. (forthcoming) Improving Poverty Reduction in Europe, Oxford: Oxford University Press.
Over the past 20 years the use of the at-risk-of-poverty threshold has become increasingly
widespread. Also in Cantillon et al. (forthcoming) it takes centre-stage as a tool for assessing
trends in poverty and social exclusion and to evaluate the distributive effects of social and
fiscal policies. However, as is well known, the indicator builds on a number of assumptions
and simplifications that have given rise to several criticisms. In this paper we illustrate how
reference budgets could help to ‘contextualise’ the at-risk-of-poverty threshold by
generating more insight into the kind of living standard that can be afforded with an income
at the level of the threshold in different countries. Such an approach does not necessarily
generate empirical support for the use of this threshold, nor does it offer an alternative to
the at-risk-of-poverty indicator. Nonetheless, we contend that it provides essential
background information for researchers and policy makers who use the at-risk-of-poverty
indicator.
Especially since the enlargement of the EU in 2004, the at-risk-of-poverty indicator has
attracted criticism, in spite of its strengths and widespread use, as highlighted in, for
instance, Atkinson, Cantillon, Marlier, and Nolan (2002). In this paper, we argue that
reference budgets can help to put into context four weaknesses that are often the subject of
criticism.
1. The threshold is defined rather arbitrarily, as 60 per cent of the national median
equivalent disposable household income.
2. The at-risk-of-poverty line represents very different levels of purchasing power in
different countries, and it is not at all obvious that an income at the level of the
threshold indicates a similar or comparable situation in terms of poverty or social
exclusion.
3. The at-risk-of-poverty indicator builds on the assumption that economies of scale at
the household level are proportional to the level of household income and constant
across countries, in spite of varying consumption patterns across the income
distribution and across countries.
3 CSB Working Paper No. 17 / 07
4. The at-risk-of-poverty threshold does not take account of cross-national variations in
the institutional characteristics of the welfare state, and in particular variations in the
public provision or subsidisation of essential goods and services. Obviously, it is a
different thing to live on a certain income when essential goods and services (e.g.
primary health care, public transport, education) are freely available or heavily
subsidised as compared to a situation in which these have to be bought at market
prices, ceteris paribus.
For several purposes, these shortcomings are not very problematic. For instance, the
indicator properly allows for studying the size and characteristics of the groups living on a
very low income, within and between countries and over time, and provides useful
information on the extent to which social and fiscal policies are targeted at the bottom of
the income distribution. In contrast, for other purposes these aspects may be more
problematic. For instance, as an indicator of poverty, comparability is undermined if there is
no linear relation between the at-risk-of-poverty threshold and the necessary resources for
having access to a minimum acceptable living standard. Similarly, as a poverty indicator it
may partially fail if economies of scale vary substantially across countries or if the provision
and subsidisation of essential goods and services varies in important respects within or
across countries. Also, when evaluating the adequacy of minimum income support, or when
entering into a public debate about an appropriate level of the minimum wage or minimum
income support, the arbitrariness of the level of the threshold can be problematic. In these
cases comparable reference budgets can be helpful.
Reference budgets, or budget standards, are illustrative priced baskets of goods and services
that represent a certain living standard (cf. Bradshaw, 1993). Reference budgets are mainly
used to identify the resources required for a decent living standard. They serve a variety of
purposes, including setting income maintenance levels, determining additional income
support, debt rescheduling, financial education, and assessing the adequacy of (minimum)
wages and benefits (for a review, see Storms et al., 2014). As we have argued elsewhere (e.g.
Goedemé, Storms, Penne, & Van den Bosch, 2015), if developed in a cross-country
comparable way, reference budgets could in addition help to contextualise EU social
indicators, to monitor the adequacy of social protection schemes in a comparative
4 CSB Working Paper No. 17 / 07
perspective and to facilitate cross-national learning in order to design more effective social
policies. However, reference budgets are difficult to construct in a way that is valid, robust
and comparable at the same time. In the ImPRovE project (2012-2016) several country
teams have endeavoured to construct for the first time cross-nationally comparable
reference budgets for six European cities (Antwerp, Athens, Barcelona, Budapest, Helsinki
and Milan). These cities are located in countries which vary greatly in terms of the size and
structure of their welfare state as well as GDP per capita. The main methodological
considerations as well as the first results of this endeavour have been described in detail in
Goedemé, Storms, Stockman, Penne, and Van den Bosch (2015). In this paper we set a step
further, and explore how comparable reference budgets can be put to use for
contextualising the at-risk-of-poverty indicator.
From the ImPRovE project it has become clear that due to their complexity, limits to data
availability and the current level of methodological development, reference budgets cannot
replace any of the existing indicators of poverty or social exclusion. However, as we will try
to show, reference budgets can help to put into context the weaknesses of, for instance, the
at-risk-of-poverty indicator, such that a better informed interpretation of poverty estimates
is possible. In particular, reference budgets help to show what the strong cross-national
differences in living standards mean in practice for the adequacy of incomes at the level of
the at-risk-of-poverty threshold. They also suggest that the poverty risk of some groups (for
instance children) is underestimated, in absolute terms or relative to that of other groups
(such as singles and outright homeowners).
The paper is structured as follows: first we elaborate on why it is necessary to contextualise
the at-risk-of-poverty threshold. Next, we explain the main assumptions underlying the
ImPRovE budgets and sketch the method used. Subsequently, we present the ImPRovE
reference budgets and explain briefly the most important reasons for the main differences
across countries. In the following section we explore the use of the reference budgets to
contextualise the at-risk-of-poverty indicator. We conclude with a discussion about what we
have learned from the present exercise and how it could be improved in the future.
5 CSB Working Paper No. 17 / 07
2 Why contextualise the at-risk-of-poverty indicator?
The idea that the results of the at-risk-of-poverty indicator should be contextualised is not
new (cf. Cantillon & Vandenbroucke, 2014). In fact, when Atkinson et al. (2002) made their
recommendations for a system of EU social indicators, they wrote that “it is, we believe,
possible to ‘demystify’ the choice of percentage, and thus the level of the poverty line, by
explaining what it means in terms of purchasing power in each individual member state”
(Atkinson et al., 2002: 92). Later, the EU’s Indicator Sub-Group emphasised that “[f]or each
country, the poverty risk indicator must be assessed by looking at both the share of people
whose income is below the threshold and the comparative level (in PPS […]) of this
threshold.” (Social Protection Committee - Indicators Sub-Group, 2015, p. 10).
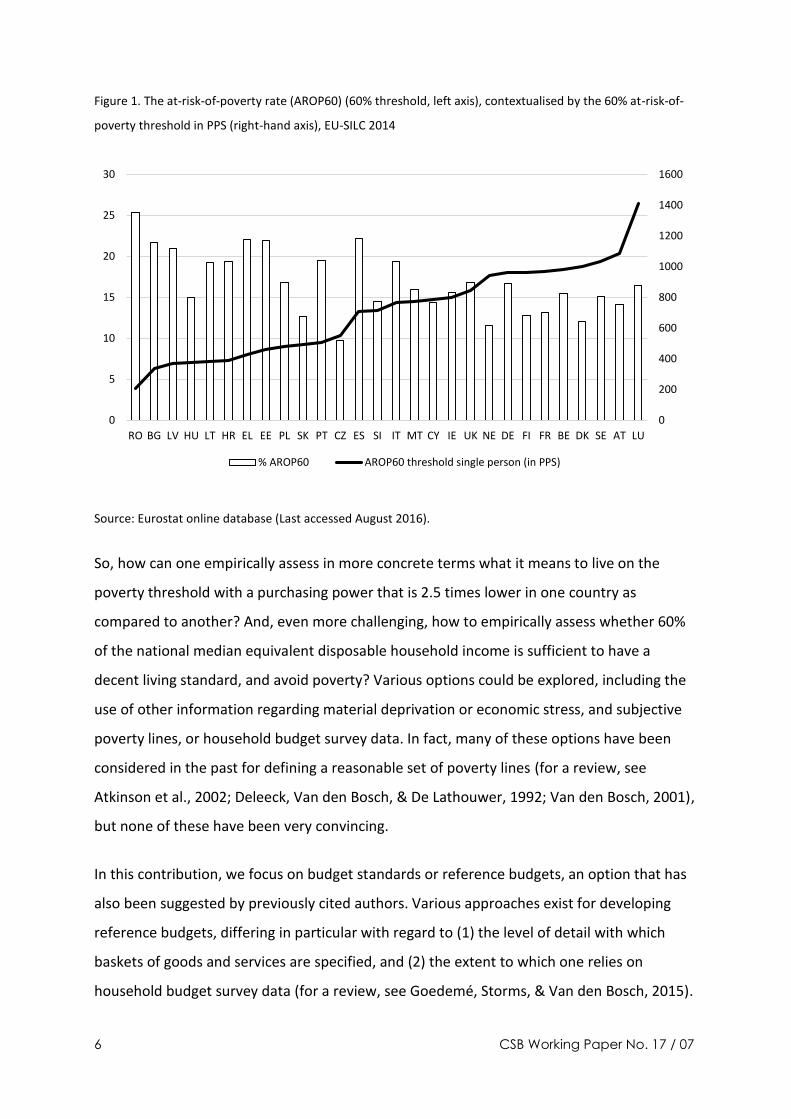
Keeping that recommendation in mind, we can note that even though, for instance, the
percentage of the population at-risk-of-poverty in Hungary is on a similar level as compared
to Belgium and Sweden, the purchasing power of those below the poverty line is much
lower, given that at the level of the threshold a household in Belgium can afford over 2.5
times more goods and services than a similar household in Hungary (see Figure 1). It also
shows that – according to these indicators – the poverty situation was worst in Romania,
where the at-risk-of-poverty rate was clearly the highest, while the threshold was the lowest
– nearly 7 times lower than the threshold in Luxembourg (that is, accounting for relative
price differences). However, interpretation becomes more difficult when thresholds as well
as poverty risks are higher, or both are lower (e.g. Luxembourg compared to the Czech
Republic). In these cases it is very difficult to give a consistent interpretation and provide an
answer with regard to where poverty is most likely to be highest. In addition, the vast
differences in purchasing power as indicated by the threshold expressed in PPS remain
rather abstract.
6 CSB Working Paper No. 17 / 07
Figure 1. The at-risk-of-poverty rate (AROP60) (60% threshold, left axis), contextualised by the 60% at-risk-of-
poverty threshold in PPS (right-hand axis), EU-SILC 2014
Source: Eurostat online database (Last accessed August 2016).
So, how can one empirically assess in more concrete terms what it means to live on the
poverty threshold with a purchasing power that is 2.5 times lower in one country as
compared to another? And, even more challenging, how to empirically assess whether 60%
of the national median equivalent disposable household income is sufficient to have a
decent living standard, and avoid poverty? Various options could be explored, including the
use of other information regarding material deprivation or economic stress, and subjective
poverty lines, or household budget survey data. In fact, many of these options have been
considered in the past for defining a reasonable set of poverty lines (for a review, see
Atkinson et al., 2002; Deleeck, Van den Bosch, & De Lathouwer, 1992; Van den Bosch, 2001),
but none of these have been very convincing.
In this contribution, we focus on budget standards or reference budgets, an option that has
also been suggested by previously cited authors. Various approaches exist for developing
reference budgets, differing in particular with regard to (1) the level of detail with which
baskets of goods and services are specified, and (2) the extent to which one relies on
household budget survey data (for a review, see Goedemé, Storms, & Van den Bosch, 2015).
0
200
400
600
800
1000
1200
1400
1600
0
5
10
15
20
25
30
RO BG LV HU LT HR EL EE PL SK PT CZ ES SI IT MT CY IE UK NE DE FI FR BE DK SE AT LU
% AROP60 AROP60 threshold single person (in PPS)
7 CSB Working Paper No. 17 / 07
In the ImPRovE project, we opted for fully-specified reference budgets, i.e. reference
budgets consisting of a concrete list of goods and services, specifying for each product and
service the type, quality, quantity, lifespan, provider and price. The budgets were
constructed on the basis of a variety of information sources, including public guidelines and
regulations, survey data, and discussions in focus groups.
3 The ImPRovE reference budgets: assumptions and method
3.1 Main assumptions underlying the ImPRovE budgets
The starting point of developing reference budgets consists in defining the ‘targeted living
standard’, that is, the living standard to which the budgets should correspond1. In our case,
this is the minimum financial resources that a household requires for adequate social
participation. Adequate social participation is itself defined as “the ability of people to
adequately fulfil the various social roles they should be able to take on as members of
society” (Goedemé, Storms, Stockman, et al., 2015, p. 5; cf. Storms, 2012). With regard to
the minimum required financial resources, it is important to note that we focus on
disposable household income, taking account of subsidised goods and services. In other
words, the budgets reflect the out-of-pocket payments by private households, in addition to
what they may already be paying through direct taxes and social contributions.
Evidently, the minimum resources required for adequate social participation depend on the
characteristics of households as well as their living circumstances. Therefore, fully-specified
reference budgets can only be constructed for specific hypothetical household types. These
‘hypothetical households’ have primarily an illustrative nature, and should not be considered
representative. The composition of the hypothetical households is defined as follows:
1. A single person
2. A single parent with one child, about 10 years old
3. A couple without children
1 This subsection relies strongly on Goedemé, Storms, Stockman, et al. (2015).
8 CSB Working Paper No. 17 / 07
4. A couple with two children, a boy of about 10 years old and a girl of about 14 years
old2.
The adults are assumed to be about 40 years old. The households live in an urban
environment (Antwerp, Athens, Barcelona, Budapest, Helsinki and Milan). In addition, we
make the following assumptions about:
1. Competences: family members are well-informed persons, having the necessary
competences to make adequate decisions with regard to their health and safety and
to be self-reliant. In addition, they are assumed to be able to act economically. For
instance, they know their social rights and are willing to exercise them, and know
how to access public goods and services; they are able to compare prices and buy the
products with best value for money and can cook economically and healthily with
sufficient variation.
2. Health: all household members are in good health. The reason for this assumption is
not so much that this is the most common health condition, but rather that costs for
health care vary enormously depending on the kind and severity of health problems,
each having different implications for the needs of the person affected. Therefore,
assuming people are in good health offers a good starting point for comparative
analysis, with variations on health to be added in future work.
3. Government-provided or subsidised goods and services: we start from actual provision
and actual prices, insofar accessible for low-income households.
The purpose was to develop long-term reference budgets that should give people access to
the targeted living standard for an indeterminate period of time. In other words, the
reference budgets include some room for saving in order to gradually replace durables and
to cover large one-off or annual costs. For instance, if a young person without any assets
would move out to start a new family, the reference budgets would not suffice for covering
the initial cost of buying all necessary durables at once. If, on the contrary, a household
2 In Finland researchers made use of the results from some previous work (cf. Lehtinen, Varjonen, Raijas, & Aalto, 2011) and assumed, for this reason, that the children of the couple are a boy of 4 years old and a girl of 10 years old.
9 CSB Working Paper No. 17 / 07
could rely on savings to compensate for an income below the calculated threshold, the
reference budget would be overestimated.
These assumptions imply that in real-life situations, especially for vulnerable families, more
resources will be required than those implied by the reference budgets: people are often
confronted with physical or mental health problems, there is no equal access to information
and to public goods and services, while people’s budgeting capacities are sometimes limited
and resources are not always spent in the most optimal or economic way. These
assumptions should ensure that the reference budgets are not subject to the critique that
they are ‘too high’ when using them as a benchmark for assessing the adequacy of incomes
(cf. Rowntree, 2000 [1901]). Nonetheless, the concept of ‘adequate social participation’, will
always remain to some extent elusive when it is translated into a concrete priced list of
goods and services: due to the strong heterogeneity in living conditions, personal
characteristics and needs as well as diverging experiences and opinions of people, it is very
difficult to define a generally applicable standard in very concrete terms.
3.2 The procedure for compiling and pricing comparable reference budgets
We used a common theoretical and methodological framework to translate the targeted
living standard into a concrete set of needs, building to an important extent on the Theory of
Human Need. In this theory, Doyal and Gough (1991) identify two universal needs,
‘autonomy’ and ‘health’, and ten so-called ‘intermediate needs’ that should be fulfilled in
order to participate adequately in society. For each of these needs we developed a basket of
essential goods and services3. The ten baskets are: adequate housing, food, health care,
personal care, clothing, mobility, leisure, rest, maintaining social relations, and safety in
childhood4.
For drawing up priced lists of goods and services fulfilling the above needs, we used a largely
standardised approach, as recommended by Bradshaw and Finch (2000). In order to avoid
arbitrary variations across countries in the composition of the baskets, all country teams
3 We also built upon other sources, such as international declarations (e.g. Council of Europe, 1996; UN General Assembly, 1989). The theoretical framework is discussed in more depth in Storms, Goedemé, Van den Bosch, and Devuyst (2013). 4 This is a somewhat adapted version of the initial list of Doyal and Gough (1991), to make it better fit for the purpose of developing coherent baskets of goods and services. This list of intermediate needs is not exhaustive. For instance, the needs of ‘security’ and ‘lifelong learning’ are not covered in the ImPRovE budgets.
10 CSB Working Paper No. 17 / 07
started from the same assumptions, quality criteria and one list of goods and services,
namely a list that was developed several years earlier in Belgium (e.g. Storms & Van den
Bosch, 2009). Each team was asked to adapt this ‘common base’ to the local situation on the
basis of a range of information sources, including national regulations and guidelines (e.g.
with regard to dietary guidelines, disease prevention, …), survey data, national studies on
the cost and accessibility of public goods and services, expert opinion, and focus group
discussions5. A standardised approach benefits comparability and facilitates cross-national
learning because it makes it easier to trace and understand cross-national differences in the
level of the reference budgets. However, standardisation also involves a risk of not reflecting
fully the cross-country variation in living conditions, given that differences across countries
(cities) were only accepted if they could be well motivated on the basis of the evidence
collected by the country teams. Hence the level of the reference budgets could be upwardly
biased in some less well-off countries, insofar insufficient evidence was available for further
deviations from the common list. In the presentation of results below, we come back to this
issue. A more in-depth discussion of the ImPRovE method, its strengths and weaknesses and
the issue of comparability can be found in Goedemé, Storms, Stockman, et al. (2015) and
Goedemé, Storms, and Van den Bosch (2015).
4 Comparing reference budgets and the EU poverty threshold: wat can be
learned?
In what follows we first briefly present the level of the ImPRovE budgets. Subsequently, we
illustrate how the reference budgets compare to the at-risk-of-poverty threshold. In the
third subsection we turn to the assumptions implied in the at-risk-of-poverty indicator with
regard to household economies of scale. Differences in housing costs between tenants and
owners, which are neglected by the at-risk-of-poverty indicator, have a very large impact on
5 For the estimation of housing costs we followed the same rationale, but applied a different procedure given the heterogeneity of housing markets, as well as the availability of representative survey data. More precisely, on the basis of EU-SILC the cost of an adequate dwelling was estimated at the 30th percentile for the NUTS2 region in which the city is located, differentiating across tenure status. In order to define an adequate dwelling, a set of minimum quality criteria was applied to all six countries, mainly building upon EU housing indicators (Van den Bosch, Goedemé, Schuerman, & Storms, 2016).
11 CSB Working Paper No. 17 / 07
the reference budgets. For this and other reasons, the relative poverty risk of children is
probably under-estimated.
4.1 The level of the reference budgets in six large EU cities
Figure 2 displays the total reference budgets for four different household types in six large
European cities, differentiated by tenure status. The budgets were priced during the first half
of 2014 and are expressed in EUR per month6. It can be observed that for all family types,
the level of the budgets is the highest in Helsinki and the lowest in Budapest, except for
outright home owners, who face the highest costs in Athens. For Budapest, the reference
budgets suggest that a single woman who rents a dwelling at the private market needs
about 524 EUR per month at the minimum to participate adequately in society, while she
needs more than twice that amount (about 1206 EUR/month) in Helsinki in order to reach
the same living standard. Yet, the variation of reference budgets across cities is smaller than
the variation of national median equivalent net incomes, even when expressed in PPS. The
highest reference budget for a single person renting a dwelling at the private market
exceeds the lowest budget with a factor of 1.3, while the highest median equivalent net
income in PPS (for the six countries) lies 1.6 times above the lowest median income. Overall,
the level of the budgets is positively correlated with national median equivalent disposable
household incomes in PPS, but there are important exceptions, such as Athens in the case of
outright homeowners (relatively expensive), and Antwerp for families without children
(relatively cheap).
6 Note that for our purposes, reference budgets are best expressed in EUR rather than PPS, given that they already incorporate price differences across countries. The exchange rate that we have applied for Hungary is 300 HUF to the EUR.
12 CSB Working Paper No. 17 / 07
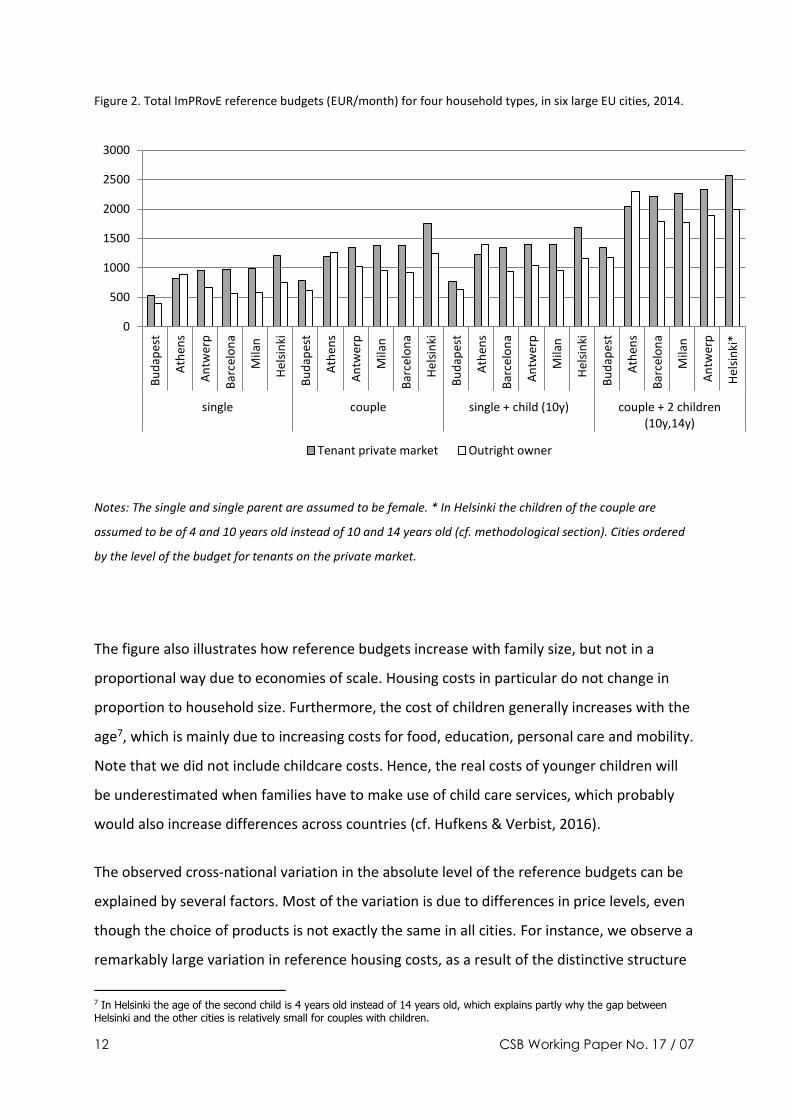
Figure 2. Total ImPRovE reference budgets (EUR/month) for four household types, in six large EU cities, 2014.
Notes: The single and single parent are assumed to be female. * In Helsinki the children of the couple are
assumed to be of 4 and 10 years old instead of 10 and 14 years old (cf. methodological section). Cities ordered
by the level of the budget for tenants on the private market.
The figure also illustrates how reference budgets increase with family size, but not in a
proportional way due to economies of scale. Housing costs in particular do not change in
proportion to household size. Furthermore, the cost of children generally increases with the
age7, which is mainly due to increasing costs for food, education, personal care and mobility.
Note that we did not include childcare costs. Hence, the real costs of younger children will
be underestimated when families have to make use of child care services, which probably
would also increase differences across countries (cf. Hufkens & Verbist, 2016).
The observed cross-national variation in the absolute level of the reference budgets can be
explained by several factors. Most of the variation is due to differences in price levels, even
though the choice of products is not exactly the same in all cities. For instance, we observe a
remarkably large variation in reference housing costs, as a result of the distinctive structure
7 In Helsinki the age of the second child is 4 years old instead of 14 years old, which explains partly why the gap between Helsinki and the other cities is relatively small for couples with children.
0
500
1000
1500
2000
2500
3000B
ud
apes
t
Ath
ens
An
twer
p
Bar
celo
na
Mila
n
Hel
sin
ki
Bu
dap
est
Ath
ens
An
twer
p
Mila
n
Bar
celo
na
Hel
sin
ki
Bu
dap
est
Ath
ens
Bar
celo
na
An
twer
p
Mila
n
Hel
sin
ki
Bu
dap
est
Ath
ens
Bar
celo
na
Mila
n
An
twer
p
Hel
sin
ki*
single couple single + child (10y) couple + 2 children(10y,14y)
Tenant private market Outright owner
13 CSB Working Paper No. 17 / 07
of the housing market in each region. Another example is the relatively high cost of clothing
in Helsinki and Milan, or the relatively low cost of membership of youth associations and
sporting clubs in Budapest. The reference budgets are also affected by the climatological,
institutional and cultural context. Climatological differences affect the clothing basket, as we
allow for more variation in countries with more pronounced seasons, as is the case for
Athens, Barcelona, Budapest and Milan. Not surprisingly, the institutional context has an
important effect on the accessibility and affordability of health care (e.g. out of pocket costs
for a general practitioner in Antwerp, which is free of charge in the other cities), education
(high cost in Barcelona, low cost in Helsinki), and public transport (high cost in Helsinki,
Barcelona and Milan, low cost in Antwerp). Institutional variation in terms of public
guidelines and regulations appears to be particularly relevant for the food basket. In Greece,
Spain and Italy remarkably larger quantities of meat, fish and fruit are recommended than in
the other countries. Finally, cultural habits explain some of the differences, particularly for
baskets fulfilling socio-cultural needs such as leisure and maintaining social relations.
4.2 The at-risk-of-poverty threshold in perspective
Figure 3 shows how the reference budgets can help to grasp what kind of living standard can
be achieved with an income at the level of the poverty threshold. For this purpose, we
express the reference budgets for a single woman and a couple with two children as a
percentage of the at-risk-of-poverty threshold8. In Athens and Budapest the at-risk-of-
poverty threshold is clearly far below the level of the reference budgets, suggesting that it is
not possible to participate adequately in society at the level of the threshold. In contrast, the
at-risk-of-poverty thresholds approaches the level of the reference budgets in Antwerp and
Helsinki, in particular in the case of tenants, suggesting that for these cities the at-risk-of-
poverty threshold captures better the minimum cost of participating adequately in society.
For outright owners, the at-risk-of-poverty threshold is even higher than the reference
budgets. In the case of Barcelona and Milan, outright homeownership seems to determine
8 The level of the at-risk-of-poverty threshold is subject to sampling error. Estimations for EU-SILC 2014 show that the sampling variance of the ratio of the reference budgets and the at-risk-of-poverty threshold is relatively small. For tenants renting at market prices in Athens, the 95% confidence interval spans 6 percentage points below and above the value shown in Figure 3. For the other cases, the confidence interval is smaller.
14 CSB Working Paper No. 17 / 07
whether or not an income at the level of the at-risk-of-poverty threshold allows for
participating adequately in society.
Figure 3. Total reference budgets of a single woman and a couple with two children (private tenant or outright
owner) expressed as percentage of the at-risk-of-poverty threshold in six cities, 2014
Notes: *In Helsinki the children of the couple are assumed to be of 4 and 10 years old instead of 10 and 14 years
old. At-risk-of-poverty threshold retrieved from Eurostat on 25/08/2016. Values refer to 2014 (EU-SILC 2015),
except for Milan (EU-SILC 2014).
For families with children, an income at the level of the poverty threshold is generally more
inadequate, especially in Athens and Budapest. Furthermore, the figure illustrates how
housing costs play a major role. Strikingly, for single persons renting their dwelling on the
private market in Athens and Budapest, the level of the estimated housing cost of an
adequate dwelling alone reaches nearly the level of the poverty threshold. In all cities,
except for Athens, housing costs fall substantially in the case of outright owners, resulting in
more adequate living standards for people with an income at the level of the poverty
threshold. However, for families with children these decreasing housing costs become
relatively less important because of economies of scale in housing (cf. below). Finally, it is
noteworthy that the gap between the reference budgets and the threshold is larger in
Rest and leisure Personal and health care Maintaining social relations
Safe childhood Mobility
15 CSB Working Paper No. 17 / 07
countries where the absolute level of the at-risk-of-poverty threshold is low. Clearly, having
an income at the level of the at-risk-of-poverty threshold means different things in different
countries in terms of the ability to participate adequately in society. In sum, this graph does
not only show how the at-risk-of-poverty threshold represents different living standards
across countries, but also within countries, between households varying in tenure status and
composition.
The ImPRovE budgets may appear to be rather high for some countries. For instance, the
Hungarian team emphasised that the various baskets for Budapest reflected the minimum
necessary for adequate participation in each domain separately, but that, still, for many
Hungarians the sum of all baskets together could be perceived as being relatively high. Yet,
the results above imply that quite some trade-offs between essential goods and services are
to be made with an income at the level of the poverty threshold. Even if we would largely
overestimate the minimum cost of adequate social participation for Athens and Budapest
(even though we have no indication that this is indeed the case), it is clear that households
with an income at the level of the at-risk-of-poverty threshold have a (much) harder time to
make ends meet in the latter two cities as compared to the other cities. In the case of
Athens the relatively high housing costs stand out, partially due to relatively high property
taxes for outright owners in Athens in 2013. It is also worth saying that in Greece between
2009 and 2014 the at-risk-of-poverty threshold declined by nearly 40 per cent in real terms.
If the threshold of 2009 would still apply, the ratio of the reference budgets to the threshold
would be only 60 per cent of its current level, considerably altering the picture.
Within the ImPRovE project, full budgets were developed for only six cities. In another
project, in most of the remaining EU capital cities the minimum cost of a healthy diet was
established in accordance with national dietary guidelines. To give a sense of the meaning of
the at-risk-of-poverty threshold in these EU countries, Figure 4 shows the resulting food
budgets, as a percentage of the threshold (Storms et al., 2015)9. As can be observed from
the graph, the degree to which households with an income at the level of the at-risk-of-
poverty threshold have sufficient income for affording a diet in accordance with the national
food-based dietary guidelines varies substantially across EU Member States. The level of the
9 The methodology for this basket is largely similar to the ImPRovE methodology. For a complete discussion, see Goedemé, Storms, Penne, et al. (2015).
16 CSB Working Paper No. 17 / 07
threshold appears to be very low, especially in Bulgaria and Romania. If households in
Romania and Bulgaria, living in the capital city at the level of the at-risk-of-poverty threshold,
would prefer to eat a healthy diet (or governments would want them to do so), they should
spend their income nearly completely on food, neglecting all other essential expenses,
including housing. Maybe this is why anti-poverty NGOs in these countries are hesitant to
back the at-risk-of-poverty threshold as a benchmark for minimum income protection (cf.
Van Lancker, 2015) and encounter difficulties with explaining the threshold towards their
members: an income at the level of the threshold can barely be considered adequate. Even if
we would overestimate the cost of food in a number of countries, our results indicate that
the at-risk-of-poverty threshold in Bulgaria and Romania is not only much lower than the
one in the richer Member States in terms of purchasing power, but allows at best a very
restricted consumption level.
Figure 4. The low cost food basket expressed as a percentage of the at-risk-of-poverty threshold for a single
person (woman) in 24 countries*, 2013
Note: Price levels refer to the capital city. Food baskets converted to price levels of 2013, making use of the
official food-specific HICP, published by Eurostat. At-risk-of-poverty thresholds taken from Eurostat on
25/08/2016 (EU-SILC 2014). *Data are not available for DK, IE, NL, SK, UK.
0
10
20
30
40
50
60
70
80
90
LU BE AT FR SE FI DE ES IT CZ CY MT SI PT PL EE SK HU LT HR LV EL BG RO
low cost food budget
17 CSB Working Paper No. 17 / 07
4.3 Economies of scale and the poverty risk of children
One of the criticisms of the at-risk-of-poverty indicator is that economies of scale at the
household level are overly simplified, and do not sufficiently take into account the needs and
effective costs that people face. Obviously, reference budgets are not a prerequisite to know
that the relative poverty risk of persons facing special needs is underestimated, e.g. in case
of a disability or very high health care costs. In contrast, it is not very obvious whether this is
also the case for differences in needs across age groups and different household sizes, given
that an equivalence scale is used for capturing these differences.
In Table 1, we express the costs of additional household members as a proportion of the
ImPRovE reference budget for a single person. Given that housing costs are the primary
driver of economies of scale, we make a distinction between tenants and outright home
owners. When housing costs increase, the relative cost of additional household members
decreases, resulting in a flatter implicit equivalence scale. The table shows that the modified
OECD equivalence scale, which is used for calculating the at-risk-of-poverty threshold,
neglects differences in economies of scale by tenure status, and across countries.
Furthermore, it seems to underestimate the additional cost of children, especially for
families with older children and with low housing costs (outright owners or those who
benefit from subsidized rent).10
10 We would like to mention here that the importance of housing costs, or of its complement, the returns to home ownership has been recognized by those responsible for EU-SILC. The proposal was made that imputed rent for home owners and those renting below market rent, should be included in disposable income. Problems with the data quality and the estimation methods of imputed rent made this impossible, unfortunately. See Törmälehto and Sauli (2013).
18 CSB Working Paper No. 17 / 07
Table 1. Implicit equivalence scales of the ImPRovE reference budgets, compared to the
In order to illustrate how the modified OECD scale results most probably in an
underestimation of poverty among children, we have re-estimated the at-risk-of-poverty
rate using an alternative equivalence scale, derived from the reference budgets. Given that
we do not have reference budgets for owner-occupiers with a mortgage, and this is a
common situation in the population, we do not make a distinction by tenure status. Instead,
we take the equivalence scale of households renting on the private market from the table
above, so as to estimate a lower bound on the potential underestimation of child poverty (as
is indicated by Table 1, the relative cost of children can be expected to be higher for other
tenure statuses). For Finland we assume that economies of scale for a child in secondary
education are similar to those for a second adult (similar to previous results of reference
budgets research in Finland). We leave the weight of a child below the age of six unchanged
(i.e. 0.3 as is the case for the modified OECD equivalence scale). Furthermore, we give
students until the age of 25 the same weight as teenagers, even though there are indications
that the cost of students is higher (e.g. Van Thielen et al., 2010). In other words, we
recalculate the at-risk-of-poverty indicator (including the threshold), by only changing the
19 CSB Working Paper No. 17 / 07
equivalence scale used11. Admittedly, this remains a very rough approximation: we start
from a very limited set of hypothetical household types and, for instance, do not correct for
changes in economies of scale as the household size increases further, or for additional
needs not covered by the budgets (e.g. child care or special health care).
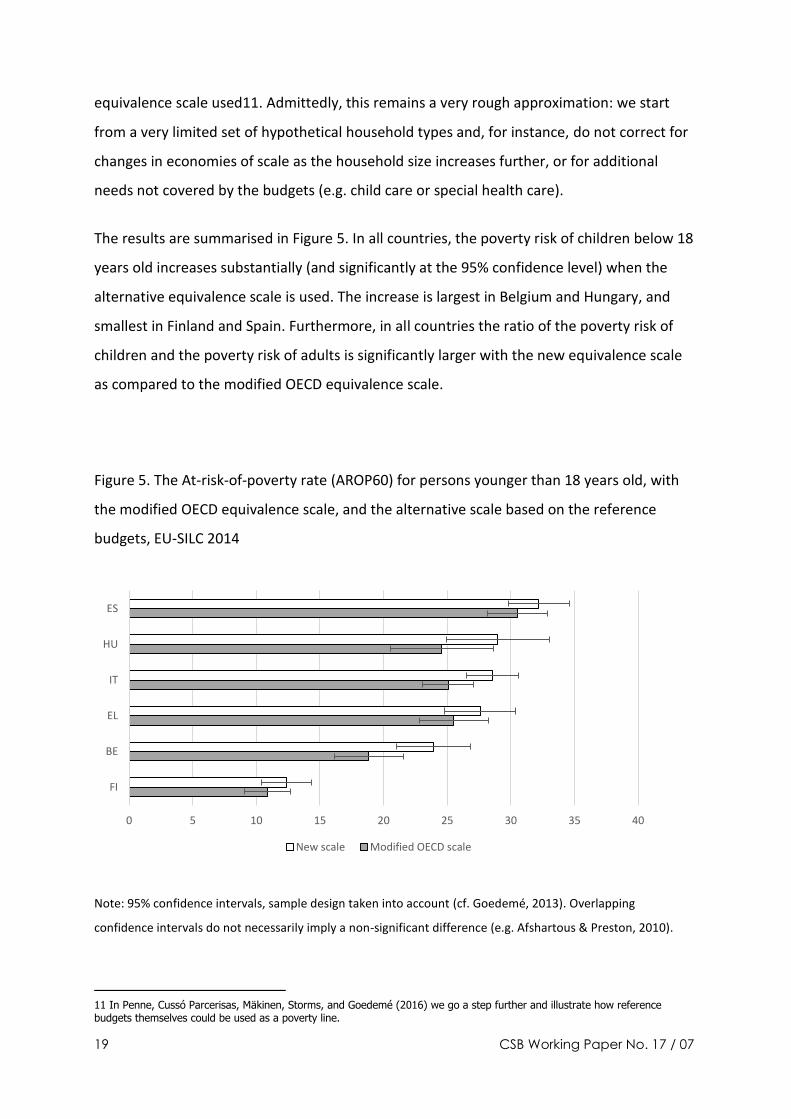
The results are summarised in Figure 5. In all countries, the poverty risk of children below 18
years old increases substantially (and significantly at the 95% confidence level) when the
alternative equivalence scale is used. The increase is largest in Belgium and Hungary, and
smallest in Finland and Spain. Furthermore, in all countries the ratio of the poverty risk of
children and the poverty risk of adults is significantly larger with the new equivalence scale
as compared to the modified OECD equivalence scale.
Figure 5. The At-risk-of-poverty rate (AROP60) for persons younger than 18 years old, with
the modified OECD equivalence scale, and the alternative scale based on the reference
budgets, EU-SILC 2014
Note: 95% confidence intervals, sample design taken into account (cf. Goedemé, 2013). Overlapping
confidence intervals do not necessarily imply a non-significant difference (e.g. Afshartous & Preston, 2010).
11 In Penne, Cussó Parcerisas, Mäkinen, Storms, and Goedemé (2016) we go a step further and illustrate how reference budgets themselves could be used as a poverty line.
0 5 10 15 20 25 30 35 40
FI
BE
EL
IT
HU
ES
New scale Modified OECD scale
20 CSB Working Paper No. 17 / 07
Source: EU-SILC 2014 version 1, own calculations.
5 Conclusion
In this paper we used reference budgets to contextualise the at-risk-of-poverty indicator.
The budgets were developed by making use of an empirical needs-based approach, without
making any ex ante assumption about the appropriate level of the budgets in relation to the
average income in a country. The budgets are fully specified in the sense that they cover
concrete lists of goods and services, representing the minimum resources required for
adequate social participation. They are priced at actual prices faced by households, taking
publicly-provided or subsidised goods and services into account. In addition, they are
developed such as to maximise cross-national comparability. For this reason, they are
somewhat different from the budgets developed for national purposes (eg. Storms, Van
Thielen, Penne, & Goedemé, forthcoming).
The ImPRovE budgets make clear that the at-risk-of-poverty threshold does not only vary
across countries in terms of purchasing power, but with real impacts on the extent to which
a decent living standard can be reached with an income at the level of the threshold. In the
capital cities of Bulgaria and Romania the at-risk-of-poverty threshold is barely sufficient for
having access to a healthy diet in accordance with national guidelines, whereas in Budapest
and Athens an income at the level of the threshold allows for adequate food and clothing,
but remains insufficient to fulfil other essential needs such as housing. In contrast, in
Antwerp and Helsinki it is more realistic to participate adequately in society with an income
at the level of the threshold. To some extent this is the result of differences in the degree to
which households can rely on publicly-provided or subsidised goods and services, even
though differences in the level of the median income across countries seem to be the main
driving factor. In addition, the budgets show that the at-risk-of-poverty indicator is a rather
rough measure, neglecting differences in household economies of scale between groups in
society (notably by tenure status and age) and across countries. As a result, the poverty risk
of children as compared to others is probably underestimated.
By making more concrete which income is necessary for obtaining a certain living standard,
reference budgets help to clarify the actual meaning of being at-risk-of-poverty in countries
21 CSB Working Paper No. 17 / 07
which vary strongly in their average standard of living. In our view, due to their clarity and
empirical character, the reference budgets also provide policy makers and NGOs with a
stronger foothold for assessing the adequacy of minimum income support, and having an
evidence-based debate about an appropriate level of minimum incomes. Furthermore, it is
clear that in some countries there is not only a problem of limited redistribution towards the
bottom, but also of a generally low standard of living in the population. In these cases,
reference budgets could help to define intermediate goals and to select priorities, both for
improving the adequacy of wages and tax-benefit policies. Furthermore, this also raises the
question about the desirability of increased cross-national solidarity in the European Union.
As we emphasised from the outset, we do not think that reference budgets should or could
replace any of the existing indicators of poverty or social exclusion. Reference budgets are
still in development, and more and better data (e.g. on prices and living patterns) as well as
methodologies (e.g. on the consultation of citizens) are required to come up with robust and
comparable reference budgets that are more generalizable than those developed for four
household types in the ImPRovE project. In that sense, much more research is still necessary
for developing reference budgets that are valid, robust, and comparable at the same time. In
our view, ImPRovE has set a very valuable first step and was successful in developing and
applying for the first time a method that resulted in largely comparable reference budgets. It
has led to useful results, and has also shown that considerable cross-national coordination is
required to come up with comparable budgets. The field is open for further exploration,
expansion and improvement in a next project. As we have tried to show, reference budgets
bring in a new type of information which is very helpful for better understanding the limits
of the at-risk-of-poverty indicator when the latter is used for measuring poverty within and
across countries, or as a benchmark for the adequacy of social policies. Combining the
results of reference budgets research with those of other approaches (e.g. the study of
actual spending patterns as documented in household survey budget data) could further
improve our understanding of poverty in Europe, and help to foster an evidence-based
debate on the policies that are required to improve the adequacy of incomes throughout
Europe.
22 CSB Working Paper No. 17 / 07
6 Acknowledgements
We are grateful to Jonathan Bradshaw, Peter Saunders and all members of the ImPRovE
Consortium for valuable comments and suggestions throughout the ImPRovE project. In
particular we would like to thank Bea Cantillon, Anne Van Lancker and Fintan Farrell for the
exchanges we had when developing this book chapter. Our research is financially supported
by the European Union Seventh Framework Programme (FP7/2012-2016) under grant
agreement n° 290613 (ImPRovE project). We make use of anonymised microdata from the
EU Statistics on Income and Living Conditions, provided by Eurostat (175/2015-EU-SILC-
ECHP-LFS). The usual disclaimers apply.
7 References
Afshartous, D., & Preston, R. A. (2010). Confidence intervals for dependent data: Equating non-overlap with statistical significance. Computational Statistics & Data Analysis, 54(10), 2296-2305.
Atkinson, A. B., Cantillon, B., Marlier, E., & Nolan, B. (2002). Social Indicators: The EU and Social Inclusion. Oxford: Oxford University Press.
Bradshaw, J. (Ed.). (1993). Budget Standards for the United Kingdom. Aldershot: Avebury. Bradshaw, J., & Finch, N. (2000). Conclusions and recommendations. In J. Bradshaw, B. Nolan, B.
Maître, & N. Finch (Eds.), The measurement of absolute poverty - Final report for Eurostat (pp. 63-79). York: Social Policy Research Unit, University of York.
Cantillon, B., & Vandenbroucke, F. (2014). Conclusion. In B. Cantillon & F. Vandenbroucke (Eds.), Reconciling work and poverty reduction. How successful are European welfare states? (pp. 319-324). Oxford: Oxford University Press.
Carlson, A., Lino, M., & Fungwe, T. (2007). The low-cost, moderate-cost, and liberal food plans, 2007. Washington, D.C.: U.S. Department of Agriculture, Center for Nutrition Policy and Promotion.
Council of Europe. (1996). European Social Charter (Revised). Strasbourg: Council of Europe. Deleeck, H., Van den Bosch, K., & De Lathouwer, L. (1992). Poverty and the Adequacy of Social Security
in the EC. A Comparative Analysis. Aldershot: Avebury. Doyal, L., & Gough, I. (1991). A Theory of Human Need. Houndmills: Macmillan. Goedemé, T. (2013). How much confidence can we have in EU-SILC? Complex sample designs and the
standard error of the Europe 2020 poverty indicators. Social Indicators Research, 110(1), 89-110.
Goedemé, T., Storms, B., Penne, T., & Van den Bosch, K. (Eds.). (2015). The development of a methodology for comparable reference budgets in Europe - Final report of the pilot project. Brussels: European Commission.
Goedemé, T., Storms, B., Stockman, S., Penne, T., & Van den Bosch, K. (2015). Towards Cross-country Comparable Reference Budgets in Europe: First Results of a Concerted Effort. European Journal of Social Security (EJSS), 17(1), 3-31.
Goedemé, T., Storms, B., & Van den Bosch, K. (2015). Proposal for a method for comparable reference budgets in Europe. Brussels: European Commission.
Hufkens, T., Leventi, C., Rastrigina, O., Manios, K., Van Mechelen, N., Verbist, G., et al. (2016). HHoT: A new flexible Hypothetical Household Tool for tax-benefit simulations in EUROMOD. Leuven: HIVA, KU Leuven.
Hufkens, T., & Verbist, G. (2016). The distributive effects of work-family life policies in European welfare states. Antwerp: Herman Deleeck Centre for Social Policy, University of Antwerp.
Lehtinen, A.-R., Varjonen, J., Raijas, A., & Aalto, K. (2011). What Is the Cost of Living? Reference Budgets for a Decent Minimum Standard of Living in Finland. Helsinki: National Consumer Research Centre.
23 CSB Working Paper No. 17 / 07
OECD. (2016). Average annual wages. Paris: OECD. Penne, T., Cussó Parcerisas, I., Mäkinen, L., Storms, B., & Goedemé, T. (2016). Can reference budgets
be used as a poverty line? Antwerp: Herman Deleeck Centre for Social Policy, University of Antwerp.
Rowntree, B. S. (2000 [1901]). Poverty: A study of town life. Bristol: The Policy Press. Social Protection Committee - Indicators Sub-Group. (2015). Portfolio of EU Social Indicators for the
monitoring of progress towards the EU objectives for social protection and social inclusion. 2015 update. Luxembourg: Publications Office of the European Union.
Storms, B. (2012). Referentiebudgetten voor maatschappelijke participatie [Reference budgets for social participation], . PhD thesis, Antwerp: University of Antwerp.
Storms, B., Goedemé, T., Van den Bosch, K., & Devuyst, K. (2013). Towards a common framework for developing cross-nationally comparable reference budgets in Europe. Antwerp: Herman Deleeck Centre for Social Policy - University of Antwerp.
Storms, B., Goedemé, T., Van den Bosch, K., Penne, T., Schuerman, N., & Stockman, S. (2014). Review of current state of play on reference budget practices at national, regional, and local level. Brussels: European Commission.
Storms, B., Penne, T., Carrillo Alvarez, E., Boeckx, H., Stockman, S., Pintó, G., et al. (2015). The food basket. In T. Goedemé, B. Storms, T. Penne, & K. Van den Bosch (Eds.), The development of a methodology for comparable reference budgets in Europe - Final report of the pilot project (pp. 64-104). Brussels: European Commission.
Storms, B., & Van den Bosch, K. (2009). What income do families need for social participation at the minimum? A budget standard for Flanders. Antwerpen: Herman Deleeck Centre for Social Policy.
Storms, B., Van Thielen, L., Penne, T., & Goedemé, T. (Eds.). (forthcoming). Hoeveel inkomen is minimaal nodig? Referentiebudgetten voor maatschappelijke participatie. Brugge: Die Keure.
Törmälehto, V.-M., & Sauli, H. (2013). The distributional impact of imputed rent in EU-SILC 2007-2010. Luxembourg: Publications Office of the European Union.
UN General Assembly. (1989). Convention on the Rights of the Child. Van den Bosch, K. (2001). Identifying the Poor. Using subjective and consensual measures. Aldershot:
Ashgate. Van den Bosch, K., Goedemé, T., Schuerman, N., & Storms, B. (2016). Reference housing costs for
adequate dwellings in ten European capitals. Critical Housing Analysis, 3(1), 1-9. Van Lancker, A. (2015). Toward adequate and accessible Minimum Income Schemes in Europe -
Synthesis report. Brussels: European Commission. Van Thielen, L., Deflandre, D., Baldewijns, K., Boeckx, H., Leysens, G., Storms, B., et al. (2010).
Minibudget. Wat hebben gezinnen nodig om menswaardig te leven in België? Geel: Katholieke Hogeschool Kempen.