What drives competition between banks? Cross-country analysis of liberalised Greek and Cypriot banking Maksim Belitski 1 Department of Economics, University of Leicester, United Kingdom Abstract This study offers an application of Infinite dimension VAR technique in measuring the performance of Greek and Cypriot financial market efficiency. The model aims to explore the forces driving the performance of a large banks proxy by returns on FTSE/ATHEX20 and FTSE/ATHEX BANKS stock indices during the period of 1997–2009. IVAR analysis can be used as either an alternative or complement to ratio or panel data analysis for the evaluation of financial market liberalisation effect on banking sector performance and economic growth, especially when the direction of causation is uncertain. We reveal the heterogeneity in responses of stock market indices to shocks in net interest spread and output gap between Greece and Cyprus as well as show that the increase in returns on FTSE/ATHEX 20 and FTSE/ATHEX BANKS is accompanied with a considerable increase in output gap. Finally, we come up with a modified ―liberalisation date‖ static approach which allowed us to capture positive effects of liberalised financial market on its efficiency. Keywords: Banking sector; financial market liberalisation; vector autoregressive analysis, output gap, net interest spread JEL Classification: C10, C33, E44, G10, G38 1. Introduction In the Greek and Cypriot financial systems, the commercial banks play an important role and contribute substantially to the finance of the national economy. The Greek and Cypriot banking industry have undergone a substantial development over the last decades. The main changes in the Greek banking system after 1992 include among others the abolition of various credit rules, the liberalisation of interest rate, the free movement of capital and the increased competition from banks of the European Union (Noulas, 1999). As a result, banks have been free to determine their interest policy for deposits and loans. In the same year, banks were allowed to follow their own investment policy without the restriction of investing a certain percentage in government bonds. In fact, the competition among banks has increased considerably due to market liberalization, technological improvements and the entrance of non-bank banks providing banking services in the form of non-intermediation. The competition has strengthened with the emergence of banking institutions across the EU as well as the competition from other credit institutes such as cooperative banks in Greece. The development of financial markets demands the development of a consistent methodology of its assessment. The measurement of efficiency uses financial ratios are frequently applied in the banking 1 Corresponding author: Department of Economics, University of Leicester, University Road, Leicester, LE1 7RH, UK e-mail: [email protected]2 See Vasiliou (1993), Mathioudaki (1995). 3 Henry (2000b) reveals that the mean growth rate of private investment in the 3 years following stock market liberalizations exceeds the sample mean by 22%. 4 Liberalization dates are usually static and in general it may take a long time for a liberalization process to take place. Therefore, evaluating dynamics statistics may prove fruitful as the assessed impacts are not dependent on the a priori chosen liberalization date. e-mail: [email protected]
Transcript
What drives competition between banks? Cross-country analysis of
liberalised Greek and Cypriot banking
Maksim Belitski1
Department of Economics, University of Leicester, United Kingdom
Abstract
This study offers an application of Infinite dimension VAR technique in measuring the performance of
Greek and Cypriot financial market efficiency. The model aims to explore the forces driving the performance of a large banks proxy by returns on FTSE/ATHEX20 and FTSE/ATHEX BANKS stock
indices during the period of 1997–2009. IVAR analysis can be used as either an alternative or complement to ratio or panel data analysis for the evaluation of financial market liberalisation effect on banking sector performance and economic growth, especially when the direction of causation is uncertain. We reveal the
heterogeneity in responses of stock market indices to shocks in net interest spread and output gap between Greece and Cyprus as well as show that the increase in returns on FTSE/ATHEX 20 and FTSE/ATHEX
BANKS is accompanied with a considerable increase in output gap. Finally, we come up with a modified ―liberalisation date‖ static approach which allowed us to capture positive effects of liberalised financial market on its efficiency.
In the Greek and Cypriot financial systems, the commercial banks play an important role and
contribute substantially to the finance of the national economy. The Greek and Cypriot banking industry have undergone a substantial development over the last decades.
The main changes in the Greek banking system after 1992 include among others the abolition of
various credit rules, the liberalisation of interest rate, the free movement of capital and the increased competition from banks of the European Union (Noulas, 1999). As a result, banks have been free to
determine their interest policy for deposits and loans. In the same year, banks were allowed to follow their own investment policy without the restriction of investing a certain percentage in government bonds.
In fact, the competition among banks has increased considerably due to market liberalization,
technological improvements and the entrance of non-bank banks providing banking services in the form of non- intermediation. The competition has strengthened with the emergence of banking institut ions across the
EU as well as the competition from other credit institutes such as cooperative banks in Greece. The development of financial markets demands the development of a consistent methodology of its
assessment. The measurement of efficiency uses financial ratios are frequently applied in the banking
1 Corresponding author: Department of Economics, University of Leicester, University Road, Leicester, LE1 7RH, UK e-mail: [email protected] 2 See Vasiliou (1993), Mathioudaki (1995).
3 Henry (2000b) reveals that the mean growth rate of private investment in the 3 years following stock market liberalizations exceeds the sample
mean by 22%. 4 Liberalization dates are usually static and in general it may take a long time for a liberalization process to take place. Therefore, evaluating
dynamics statistics may prove fruitful as the assessed impacts are not dependent on the a priori chosen liberalization date.
sector2. It is also generally accepted among analysts of the banking sector, that the efficiency of a bank is multidimensional from its nature. Specifically the efficiency of a bank is measured by using ratios such as
return on equity, return on total assets, the difference of interest bearing elements of assets and liabilities, profit/loss per employee, the efficiency ratio and the net interest margin ratio (Cajueiro et. al., 2009). This
modelling follows that of Lovell (1995), who took standard measures of macroeconomic performance and used a modified DEA model to derive a composite index of performance.
Recent research, such as (Henry, 2000a; Bekaert and Harvey, 2000) has suggested the following
benefits from stock market liberalisation: it may reduce the country's cost of equity capital by allowing for risk sharing between domestic and foreign agents; capital account liberalization may have a positive impact
on investment3. Therefore, an important topic has become to understand the impact of financial market liberalisation on the banking sector performance, volatility and returns on assets.
We aim to understand the way financial liberalisation in a form of institutional changes, fiscal and
monetary policy reforms induces the development of East Mediterranean stock markets and economic performance. The Greek and Cypriot stock market presents an interesting opportunity for such tests, since
Greek financial market has been liberalised in the beginning of 1990s and all over again in the beginning of 2000s along with the Cypriot financial market and fiscal reforms in Cyprus in the beginning of 2000s.
In the first place we employ a recently introduced methodology (Chudik and Pesaran, 2007; Pesaran
and Tosetti, 2007; Pesaran et al., 2008) to test for the structural changes in financial market liberalisation and reveal the impact of net interest spread and foreign asset inflow on banking sector performance.
Secondly, we innovate in using a ―cross-section augmentations‖ approach, instead of Bayesian VAR models or a scope of countries having impact on Greek and Cypriot financial markets separately tackling the ―curse of dimensionality‖. Including in a model such variables as net interest spread and foreign assets we
therefore, trying to compare and balance a ―liberalisation date‖ approach using binary variables which is always subject to a criticism4.
As shown in (Cajueiro et. al., 2009) studies, which concentrate on a period of 3 years where significant changes occurred in the Greek banking system due to the transfer of publicly owned banks to the private sector, and mergers and acquisitions. Modified ―liberalisation date‖ static approach will enable us to draw
robust conclusions over the efficiency of changes taken place in the Greek and Cypriots financial markets along the time.
Finally, we relate structural changes in foreign asset inflows; net interest spread change to banking sector performance due to liberalisation as well as to economic development and find a positive association between these variables. Our main findings suggest that financial markets liberalisation plays an important
role in enhancing the banking sector development and competition, decreasing in the cost of capital and increases in the productivity of capital. Nevertheless, the effect of financial sector liberalisation takes longer
time for Greek stock market and provides instant response for a Cypriot one. We could have shown that financial accounting ratios and non-parametric techniques can be used as a
complement to each other for the evaluation of banking sector performance and employ both ratio analysis
and data envelopment analysis techniques (Rouse et al., 2002), however we find vector autoregressive technique performing
better as it treats all the variables including in a model as endogenous allowing cross-correlation and bivariate causalities among them.
The remainder of the paper is organized as follows. In Section 2 we provide a brief literature review of
similar studies. Then in Section 3 the suggested Infinite vector autoregressive technique with cross-section augmentations is described and the research hypothesis is formulated. Section 4 describes the data followed
by the empirical results on present-day dynamics and a comparative analysis between the Greek and Cypriot banking sector performance. The last Section 5 presents the conclusions, policy implications from the results obtained, underlines the future research perspectives. There is one appendix in the paper contains impulse
response functions for Greece and Cyprus used for solving our backward-looking IVAR model.
2 See Vasiliou (1993), Mathioudaki (1995).
3 Henry (2000b) reveals that the mean growth rate of private investment in the 3 years following stock market liberalizations exceeds the sample
mean by 22%. 4 Liberalization dates are usually static and in general it may take a long time for a liberalization process to take place. Therefore, evaluating
dynamics statistics may prove fruitful as the assessed impacts are not dependent on the a priori chosen liberalization date.
2. Brief literature review
Liberalised banking and financial markets have been pervasive amongst many countries in the 1990s
and 2000s. A particular attention has been given to equity markets liberalisation and foreign assets inflows which are believed to have important implications on economic growth and financial market performance.
Banking sector liberalisation is often seen as a decision to allow foreign companies to be presented in a country's stock market and in banking sector along with the home financial institutions, repatriate their gains. This policy may lead to an increase in a competition in a banking sector which will disable domestic
companies to have high profits playing with the net interest spread as a difference between a lending and a deposit rate and in the other ways. Increased competition will extract a market power from domestic
financial intermediates and should theoretically drive the market to a monopolistic competition. Assessing the impact of liberalisation in Greece and Cyprus is important as it leads to important
changes in both the financial sector proxy by FTSE/ATHEX 20 and FTSE/ATHEX BANKS indices and the
real economy proxy by output gap. Kim and Singal (2000) study the impact of market opening in emerging markets and find that the
benefits are likely to outweigh the perceived risks associated with foreign asset flows. Stock markets seem to be less auto-correlated subsequent to market openings, rendering markets more efficient.
Recently, Garas and Argyrakis (2007) using daily closing prices from the Athens stock exchange find
that correlations between stocks during a crisis period become stronger. Henry (2000a, b) analyses the effects of liberalisation on emerging market equity prices and presents evidence that liberalization allows for
risk sharing between domestic and foreign agents and makes financial market more heterogeneous. Some of the studies use panel data techniques both from the developed from developing countries looking for the evidence that banking sector and corporate law liberalisation is associated with higher efficiency of capital
allocation ( e.g. Galindo, Schiantarelli, and Weiss, 2007; Abiad, Oomes, and Ueda, 2008). Quinn and Toyoda (2008) use data for 94 nations and a period 1954-2004 and find positive association
of capital liberalisation with economic growth, but not with the banking performance in both developed and
emerging markets. Grilli and Milesi-Ferretti (1995) using lagged values of financial openness indicators as instruments and find little evidence of an effect of liberalisation.
Iwata and Wu (2009) find that financial liberalisation increases international risk sharing resulting in reduced equity premium and cost of capital. Furthermore, Bekaert, Harvey and Lundblad (2001) study the impact of financial liberalisation on economic growth and suggest that the former is associated with
significant increases in real economic growth. Klein and Olivei (2008) use a cross-section of both developed and developing countries finding a significant effect of open capital accounts to financial depth and
economic growth. Yang and Yi (2008) applying tests of special exogeneity to annual Korean data find that financial development control causes economic growth and the opposite is not true.
Several studies though find little to no effect of liberalization to growth (e.g., Bekaert and Harvey,
2000). They would expect that after liberalisation has taken place in financial markets, both investors base and liquidity increase, thereby increasing foreign speculative activity. This foreign speculative activity may
be important for emerging markets, because in most emerging markets liquidity is poor, foreign speculation may reduce the degree of market manipulation.
A problem that arises and is previously mentioned is that the impact of financial liberalisation
evaluating changes in specific variables using liberalization fixed dates approach. Bekaert, Harvey, and Lundblad (2003) argue that there is a considerable variation in liberalisation initiatives, which suggests that
evaluating the sequencing of liberalisations and not a one-time event. Nevertheless, financial liberalisation is considered as a complex process and may take many years to
provide a considerable response. An challenging paper of Odabasi, Aksu, and Akgiray (2004), that have
shown that the Turkish stock exchange has become more efficient over time using both parametric and non-parametric tests.
There are a number of papers that use non-parametric methods for assessment of the bank efficiency as a result of liberalisation (Berg et al., 1991; Berg et al., 1993; Fucuyama, 1993). Many papers introduce
financial ratios that help the evaluation of bank performance and find out two main reasons for using ratios as a tool of analysis. Ratio analysis allows comparison among different sized bank and to control for sector
characteristics permitting the comparison of individual bank‘s ratios with some benchmark for the sector. As far as we can see from their papers the usage of non-parametric and panel data methods is worth implementing when a micro data for the banks is used. The use of these accounting-based financial ratios to
measure cross-country bank performance still has been criticised, (e.g. Kohers et al., 2000); Berger and Humphrey, 1992).
Due to some difficulties which we are not going to mention in this paper, Berger and Humphrey (1997) conclude that efficient frontier approaches seem to be superior compared to traditional financial ratios analysis in terms of measuring performance. They claim that the frontier approach offers an overall
objective numerical score and ranking, and an efficiency proxy. The causal interrelations between the financial markets and economic performance was also studied by
Levine et al. (2000), using a sample of 74 developed and developing countries over the period 1960–1995, go beyond previous studies recognising the potential biases induced by simultaneity, omitted variables and unobserved country-specific effect on the finance growth nexus. According to these authors, this issue is of
paramount importance for settling the question of causality. To deal effectively with these problems, they suggest the panel data analysis and the use of estimators appropriate for dynamic panels like GMM as well
as cross-sectional instrumental variable estimators. They interpreted their findings as supportive of the growth-enhancing hypothesis of financial development, which is also in line with those reported by Levine (1999) in a sample of 49 countries over the period 1960–1989 where GMM procedures are used to find that
the exogenous components of financial development on economic performance. On the other hand, Leahy et al. (2001) use alternative techniques to analyse the data for 19 OECD
countries for the years between 1970 and 1997 and Bassanini et al. (2001) with the data for 24 OECD countries just with one year difference demonstrate the influence of financial variables, such as liquid liabilities, stock market capitalisation, private credit from deposit banks to GDP on real per-capita output
growth. Ayhan at al. (2009) identify openness to international financial flows as the main indicator driving banking sector development, leaving market power, competition and bank sector efficiency in the home
market. They show that openness to international financial flows can both raise productivity growth and contribute to economic performance.
Finally, Rajan and Zingales (1998) examine whether financial development facilitates economic
growth by scrutinising one rationale for such a relationship: that financial development reduces the costs of external finance to firms. They have answer a question whether industrial sectors that are relatively more in
need of external finance develop disproportionately faster in countries with more-developed financial markets and its true in a large sample of countries over the 1980's.
The financial literature has shown that the Greek stock market may have long range dependence.
Conversely, the Cypriot stock market may have short range dependence. For example, Barkoulas, Baum, and Travlos (2000) find significant evidence of positive long-term persistence in the Greek stock market.
Panas (2001) also finds evidence of long memory in the Athens stock exchange and speaks about the possible limitations for Cyprus Stock market. Apergis and Eleptheriou (2001) study the period 1990–1999 and find persistence in volatility clustering which they interpret as evidence of inefficiency of the Athens
stock exchange. On the contrary, Laopodis (2004) tests for changing degree of market efficiency in Greece due to financial liberalisation, suggesting variance ratio statistics and tests for short-term autocorrelation in
both local currency and dollar-equivalent returns, and could not reject the null hypothesis of a random walk. To the best of our knowledge Cajueiro et. al. (2009) searches for breaks in market inefficiency using a
long range dependence parameter, global Hurst exponents, that were introduced by Barabási and Vicsek
(1991) and measure of stock market efficiency due to financial liberalisation. In this paper we shall search for the impact of financial market liberalisation in Cyprus and Greece on
economic performance between those countries and the behaviour of stock market indices such as FTSE/ATHEX 20 and FTSE/ATHEX BANKS as a proxy for banking sector performance. Cyprus and Athens Stock market indices, foreign assets inflows, net interest spread and macroeconomic performance are
included in the Infinite Dimensional VAR model currently introduced by Chudik and Pesaran (2007) and considered by Pesaran et al. (2008) new research findings.
We also take into consideration the current findings by Charemza et al. (2007, 2008) implying Monte-Carlo simulations have proved on the basis of Chudik and Pesaran (2007) methodology the consistency of
the cross-country augmentations in case where the number of countries is even small and there is one dominant country in the panel as in the case of Cyprus and Greece.
3. Methodology
3.1. General description of the model
Following the work Leeper (1997), Forni and Lippi (2001), Charemza at all. (2007), Chudik and Pesaran (2007), vector autoregressive models (VARs) are widely used in stock markets and banking performance analysis. VARs provide a flexible framework for the analysis of complex dynamics and
interactions that exist between variables in the country and across the integrated group of countries. Although the approach has drawbacks, such as a lack of economic restrictions on the dynamics of the
system (Cooley and Dwyer, 1998) and sensitivity to identifying restrictions (Pagan and Robertson, 1998; Faust and Leeper, 1997), it has the advantage of being able to capture general dynamic relationships and identifying economic interactions without the imposition of too much structure. However, one of the weak
points of this approach in practice is limited number of endogenous and exogenous variables which could lead to omitted bias. As the number of parameters to be estimated grow at the quadratic rate with the number
of variables is limited by the size of typical country datasets. In the macroecono mic and international economics empirical applications this is not enough. As the number of cross-sectional units increases and we are facing so-called ―curse of dimensionality‖, a certain restrictions must be imposed for the analysis.
In spite of the fact of two countries in our analysis we would like to evaluate the impact of the other countries cross-correlated with Greece and Cyprus in a number of endogenous variables, such as interest rate
spread, output gap and foreign assets inflow. Therefore the number of cross section unit increases. Two different approaches have been suggested in the literature: (i) shrinkage of the parameter space
and (ii) shrinkage of the data. They consider a parameter space can be shrunk by imposing a set of
restrictions, which could be for instance obtained from a theoretical structural model, directly on the parameters.
We could use techniques, where prior distributions are imposed on the parameters to be estimated as proposed by Leeper, Sims, and Zha (1996) in their large-scale BVAR, nonetheless, our focus is mainly backward- looking, than forward-looking.
The second approach to deal with ―curse of dimensionality‖ is to shrink the data, along the lines of index models proposed by Sargent and Sims (1977) in their dynamic factor model. Their finding has been
currently extended allowing for weak cross sectional dependence by Forni et al. (2004)5. Our model proposes to deal with the curse of dimensionality by shrinking the data as the number of
endogenous variables and a cross section units increases. Under this set up, Chudik and Pesaran (2007)
IVAR could be approximated by a set of two finite-dimensional small-scale models for the Cypriot and Greece banking sector, that can be consistently estimated separately in the spirit of global VAR (GVAR)
models proposed in Pesaran, Schuermann and Weiner (2004). By imposing a certain restrictions on the parameters of IVAR model that are binding only in the limit,
we end up with shrinking of the data. This paper provides a link to mitigating the curse of dimensionality
and implements on the macroeconomic data over Greece, Cyprus and other EU Member states correlated with Greece and Cyprus respectively, the conditions under which it is appropriate to shrink the data on the
basis of presence / absence of dominance effects. We consider an application of the Infinite VAR methodology to one of the present day standing
questions in the growth and finance literature: does financial market liberalisation causes (predicts) higher
performance of banking sector and growth, or does the direction of causality (predictability) run both ways across the countries?
5 Few more examples include Chudik and Pesaran (2007).
Let‘s start the description of a model with straightforward definitions. We define the output gap for the
i-th country in the model, i=1,2…. in time t as: 𝑦𝑖𝑡 = ln 𝑌𝑖𝑡 − ln 𝑌𝑖𝑡𝑃 , where 𝑌𝑖𝑡
𝑃is the potential output if
the i-th country established outside the model. Potential output is obtained by using Hedrick-Prescott filter
on GDP nominal series. We define the quarterly return on FTSE/ATHEX 20 and FTSE/ATHEX BANKS for the i-th country
in the model, at time t using the following equations: ret_ftse/athex = log(ftse/athexit)t − log(ftse/athexit)t-1,
where ftse/athexit is the value of the FTSE/ATHEX index in USD for the i-th country in time t.
Net interest spread describes the efficiency of a process of transforming saving into investment as banking sector absorbs resources, so that a currency unit saved by households generates less than one unit worth of investment, let call it fraction 𝛷 as it is presented in Pagano (1993). The remaining fraction 1 – 𝛷
goes to banks in a form of a spread between lending and borrowing rates, and to securities brokers and dealers as commissions, fees and so on. The change in a share of 1 – 𝛷, which goes to banks as the net
interest spread between lending and borrowing rates is included in the model as 𝑟𝑖𝑡 .
The foreign assets, π is the value of the domestic assets owned by foreigners. Foreign assets inflows influence the degree of indebtedness of that country. Along with net interest spread, foreign assets change
are considered to be significant indicators of 8 years changes occurring in Greek and Cypriot banking system, as well as in the banking systems of the countries correlated with Cypriot and Greek financial
sectors. All variables, except of stock market indices are taken in logarithms. In spite of a ―liberalisation date‖ analysis critique we imply a binary variables controlling for a
structural break in the first, second and third quarters of 2003 both for Greece and Cyprus. In this way, we to
analyse the impact of exogenous factors as fiscal, institutional and investment policy reforms introduced by Greek and Cypriot government within the first and second quarters of 2003. Should the effect of the reform
be statistically significant we use it as an additional prove to the effect of banking sector and financial market liberalisation to interest rate shrinkage and an increase in a Cypriot and Greek assets owned by the foreign firms.
Our theoretical framework allows us to investigate the presence of dominant effects allowing to decide the inclusion of an exogenous variable in a form if cross-section augmentation (CSA) in a model. The
presence of dominant effects is tested by a null of joint significance of the ―star‖ variables in the relationships between 𝑧1𝑖𝑡 ,𝑧2𝑖𝑡 , … … … . , 𝑧𝑁𝑖𝑡 , as well as the testing whether, after controlling for the
dominant effects, idiosyncratic innovations to 𝑧1𝑖𝑡 can help forecast future values 𝑧2𝑖𝑡 , 𝑧3𝑖𝑡 , 𝑧4𝑖𝑡 and vice
versa.
It is initially assumed in Chudik and Pesaran (2007), that 𝑧𝑖𝑡 𝑖=1𝑁 are endogenously determined in a
VAR model with up to one unobserved common factor where𝑥𝑡 = 𝑦1𝑡 , 𝑦2𝑡 , … . 𝑦𝑁𝑡 . The following cross
section augmented regressions can be estimated consistently by least squares for each country i for each variable:
𝑧𝑖𝑡 = α + Γ𝑝𝑖𝑝𝑖𝑙=1 𝑧𝑖𝑡−𝑙 + 𝜃𝑞𝑖
𝑞𝑖𝑙=0 𝑧𝑡−𝑙
∗ + 𝜂𝑖𝑡 (1)
where 𝑧𝑙−𝑙∗ is a cross section weighted average of a macroeconomic variable. Presence of dominance effects
is tested by conducting Wald tests of the joint significance of the coefficients for the star variables in ( 1), namely
𝐻0𝑧 : 𝜃𝑞𝑖 = 0 𝑓𝑜𝑟 𝑙 𝜖 0,… . , 𝑞 (2)
Following Pesaran, Schuermann and Weiner (2004) if N is sufficiently large, the null hypothesis (2) holds only for countries with zero factor loadings6.
The same exercise is carried out for all the endogenous variables based on the same type of regressions. There may be two options considered for the star variables: (i) country specific simple cross section averages constructed as the arithmetic average of foreign variables, as
6 see Chudik and Pesaran (2007, pp. 35-36)
𝑍𝑠 ,𝑖𝑡∗ = 𝑁 − 1 −1 𝑦𝑗𝑡
𝑁𝐽 =1,𝐽≠𝐼 (3)
and ii) country specific trade weighted cross section averages constructed for example as
𝑍𝑤 ,𝑖𝑡∗ = 𝜔𝑖𝑗 𝑦𝑗𝑡
𝑁𝐽 =1 , with 𝜔𝑖𝑖 = 0 (4)
where 𝜔𝑖𝑗 is the share of country jth trade in country ith foreign trade, estimated as the average based
on the amount of export (FOB prices) and import (CIF prices) taken from IMF Direction of Trade Statistics
and Datastream databases. Trade weighted cross section averages are more reliable and hence appropriate in small samples. We
have extended Chudik and Pesaran (2007) approach, calculating the annual country specific trade weighted cross section averages across the countries. This, to some extent, allowed us to achieve more precise empirical estimations of CSA.
Computing test statistics based on unrestricted regression we measure how close the unrestricted estimates come to satisfy the restrictions under the null hypothesis. Country specific CSAs (4) are
calculated as a sum of a trade weighted cross section averages across the CSAs and are included in a VARs
model as exogenous should the value of 𝜃𝑞𝑖 be more than zero for 𝑙 𝜖 0, … . , 𝑞 7 . We are aware that the
numbers of degrees of freedom becomes very large as the number of explanatory variables in a model increases. Thus, saving degrees of freedom we shall not include in a VAR mode l the CSAs proved to be
insignificant as a result of Wald test. We include CSAs following the null of no dominance at 5% and 10% level of significance in order to increase the power of a model.
It is assumed that the variables been used to calculate cross section group augmentations are covariance stationary8. Granger causality tests not augmented with cross section weighted averages applied to 𝑧𝑖𝑡 , are conducted9.
As aforementioned in Chudik and Pesaran (2007) IVAR allowed us to set up two finite-dimensional small-scale models for the Cypriot and Greece banking sectors, that can be consistently estimated separately
in the spirit of Global VAR (GVAR) models. Cross section augmentations for net interest spread, output gap and foreign assets are included in a model as exogenous variables in order to balance the IVAR. It enabled
us to access possible effects in the European neighbourhood financial markets on the banking sector performance and economic development.
For Greece and Cyprus, which separately can be regarded as the small open economies, the
micorfoundations of these equations are identical to those derived by Gali and Monacelli (2005) and Benigno and Benigno (2006).
3.2. Propositions and model specification
Let 𝑥𝑖𝑡 denote the realization of a random endogenous variable belonging to cross section unit i in
period t, and assume that 𝑥𝑡 = (𝑥1𝑡 , … . . , 𝑥27𝑡 ) is generated according to the following VAR (p) model:
𝑥𝑖𝑡 = α + δ + Γ𝑝𝑝𝑙=1 𝑥𝑡−𝑙 + 𝜃𝑞
𝑞𝑙=1 𝑥𝑡−𝑙
∗ + 𝜇𝑡 (5)
where, α vector of intercept term, δ – vector of binary variables controlling for a structural break, Γ𝑝
is N x N dimensional matrix of unknown coefficients of the endogenous variables, 𝜃𝑞 is N x N dimensional
7 Shares of country jth trade in country ith t rade statistics and country specific trade weighted cross section averages are available
from the author on request. 8 This assumption is supported by the CIPS panel unit root test recently proposed in Pesaran (2007) that allows for cross section
dependence. 9 We followed the methodology given for constructing Granger non-causality tests without cross section augmentation. The results
of Granger non-causality tests with and without cross section augmentations are summarized in Granger causality tes ts with
bivariate VAR models by Pesaran and Chudik, 2007, pp. 36-37. Authors conclude, that Granger causality tests without (with)
cross section augmentation the null hypothesis that investment-output ratio does not Granger cause output is rejected in the case of
23.5% (26,5%) considerably of countries at the 10% nominal level.
matrix of unknown coefficients of CSA, significant in a group cross- section augmented regressions, 𝑢𝑡 = 𝑢1𝑡 ,𝑢2𝑡 , … …… , 𝑢𝑁𝑡 is the N x 1 vector of disturbances.
To define CSAs in a model and tackle the problem of multicollinearity we identify a group of
countries within the 27 EU member States and instead of calculating multivariate correlation coefficients we do calculate bivariate one as the cross-correlation matrix (6) allows.
The interpretation of a correlation coefficient depends on the context and purposes. Should the value
of correlation coefficient appear in the interval below 0.7 we assume a weak correlation and do not include a country variable in a CSA; on the contrary, we assume strong correlation should the value of the correlation
Matrix (6) is symmetric and has unity on its main diagonal as the correlation between any πi and ri
is same as the correlation between ri and πi , where i=1,2,….,27. The model generates three main propositions:
Proposition 1: Size of the economy is irrelevant to the time it takes for the market to experience the
effect of liberalization process. At the same time, size of the economy is more sensitive to structural shocks
as the larger economy is expected to be less sensitive. Proposition 2: Banking sector liberalisation increases the degree of financial market efficiency, i.e.
increases the returns on stock market indices and economic growth. Proposition 3: Output gap is sensitive to banking sector performance proxy by stock market indices:
shock on returns of FTSE/ATHEX indices on Cyprus and Athens Stock Exchange will lead to an increase in
output gap.
Particular attention in a paper is paid to Proposition 2, related to financial market liberalisation in Greece and on Cyprus following Euro-Mediterranean Declaration and Cyprus Off-shore development. Furthermore, the introduction of the fiscal and institutional reforms both in Greece and in Cyprus is a steady
process taking some time to mature, depending on the size of the economy, its financial and trade openness, etc. One of vivid examples of that could be the introduction of Cyprus Scope of Corporation Tax in July,
2002, as part of the Income Tax Act No. 118(I) of 2002. A uniform 10% corporate tax rate applies to both onshore and offshore companies, plus a 2% levy on wage bills (meant to subsidise pensioners), and a 'Special Contribution' related to defence which in effect applies the 10% corporate tax rate to inter-company
dividend and interest payments. An additional tax of 5% was imposed on company profits exceeding CYP 1,000,000 for the years 2003 and 2004.
However, profits from activities of a permanent establishment situated outside Cyprus are completely exempt. Any company can be registered 100% anonymously and have a Cyprus bank Account with advanced English language Internet banking in multi currency. The registration of a Cyprus company takes
only a few days and don‘t require notarized ID nor corporation documents.
This study uses quarterly prices for the general indexes of the Athens and Cyprus stock exchanges.
The period under examination is from 01/10/1997 to 30/03/2009, for a total of 46 observations of each variable. We employ data provided by the DataStream and Economic and Social Service databases. We have also used Central bank of Cyprus, Cyprus Stock Exchange, Athens Exchange and Bank of Greece data.
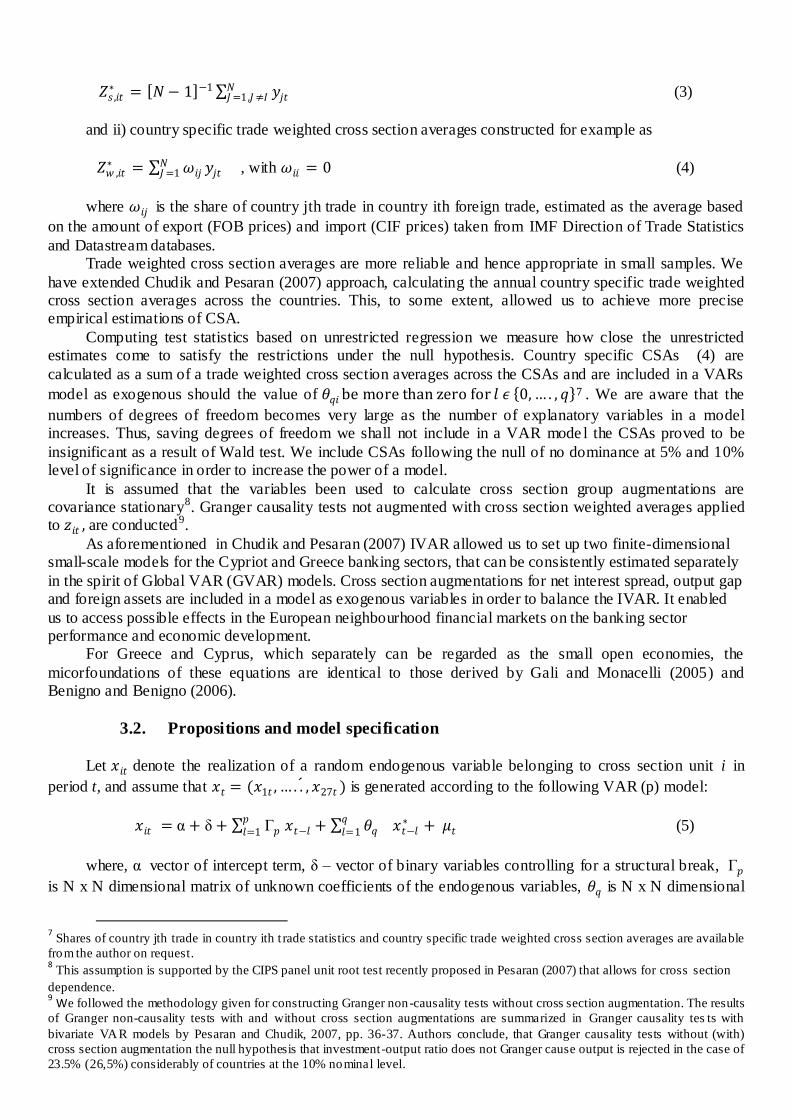
The analysis is carried using dollar-equivalent returns, due to interest from international investors in emerging markets stocks. Figure 1 demonstrates the dynamics of stock indices FTSE/ATHEX 20,
FTSE/ATHEX MID 40, FTSE CYPRUS SE2O, FTSE/ATHEX BANKS and FTSE/MED 100 originally in Euro currency, although just two of the indices FTSE/ATHEX 20 and FTSE/ATHEX BANKS are included in a VAR model. Figure 1 shows the index‘s volatility within the period 1997-2009 and provides an intuition
of the choice of 1997 Q4 is consistent with the introduction the most important index FTSE/ATHEX 20 in the Athens Exchange. The choice of the indexes is explained by the subject of a research as FTSE/ATHEX
20 includes the top 20 companies by market capitalisation and index futures became the first products to trade on the Athens Derivatives Exchange. FTSE/ATHEX BANKS index is tradable and designed to represent the performance of the largest banks in the Eastern Mediterranean region‘s markets. It comprises
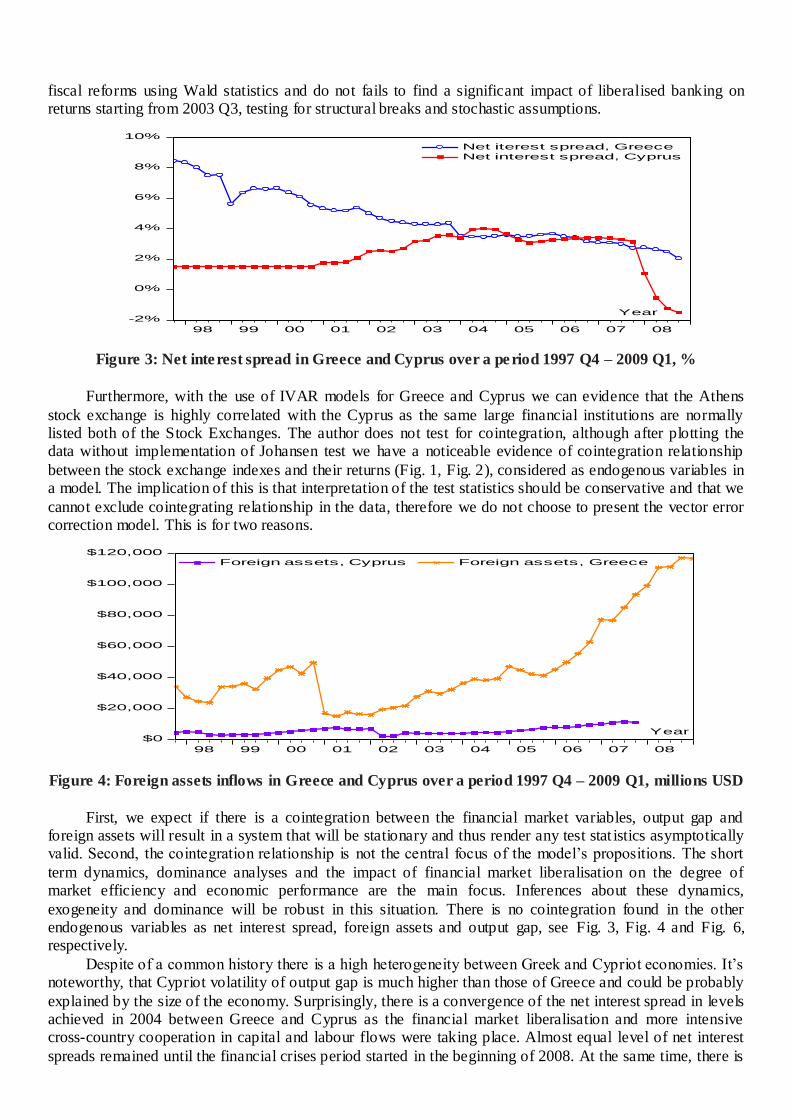
the largest and most liquid banks in the region that are quoted on the Cyprus Stock Exchange and Athens Exchange. The returns on FTSE/ATHEX 20 and FTSE/ATHEX BANKS are presented in Figure 2. One can
see that the returns on both indices are highly correlated within the time. However, starting from 2003 returns on FTSE/ATHEX Banks seem to be slightly higher than those of FTSE/ATHEX 20, hypothetically due to financial market liberalisation and inflow of foreign assets. Nevertheless, the returns of
FTSE/ATHEX Bans seem to fall faster than FTSE/ATHEX 20 returns in the time of financial crises being more dependent upon financial markets.
Figure 1: Athens and Cyprus stock exchange indexes in Euro, 1997 Q4 – 2009 Q1.
The period under analysis is of major importance because it was associated with major changes in the
financial market liberalisation in Greece and Cyprus. Laopodis (2004) suggest that specifically, three events highlight this period: first, the announcement by the European Union (on 12/21/1992) that Greece would have to abolish currency restrictions; second, the enactment of the Greek legislation (on 3/23/1993) adopting
the above EU directive; and third, the announcement by the government (on 5/14/1994 but taking effect on 5/16/1994) that it would liberalize all foreign currencies (see Chortareas, Ritsatos, & Sfiridis, 2000). He tests all three dates in order to examine ASE‘s degree of efficiency before and after these dates. The tests entail
the graphical examination of the recursive parameters (i.e., constant and slope) and the residuals. Finally, two tests for structural change, the Chow and the Wald tests are performed.
We shall impose a dummy variable looking for a structural break in the first, second and third quarters of 2003 resulting the adoption of corporation tax on 'companies' and residence-based taxation regime in 2003. Binary variable (dummy) are included both for Greece and Cyprus. Anyway, keeping in mind heavy
€0
€2,000
€4,000
€6,000
€8,000
€10,000
€12,000
€14,000
98 99 00 01 02 03 04 05 06 07 08
FTSE/ATHEX 20 FTSE/ATHEX BANKS
FTSE/ATHEX MID40 FTSE/CYPRUS SE20
FTSE/MED100
Year
criticism on ―liberalisation dates‖ approach which is static, we compare our findings with the dynamics in foreign assets inflows and net interest spread convergence between Greece and Cyprus.
Figure 2: Returns on FTSE/ATHEX 20 and FTSE/ATHEX Banks indexes, 1997 Q4 – 2009 Q1.
We believe that the process of financial liberalisation to be mature takes some time and is not less than one quarter. This reasoning may be true as the binary variables appeared to be statistically and economically
significant starting from the second quarter after the liberalisation process had taken place (see results below).
4.2. Infinite Dimensional VAR models: introductory data
This section presents the estimates of banking sector liberalisation for quarterly returns on FTSE
indexes in Athens and Cyprus stock exchanges using the Infinite Dimension VAR approach. Table 1 presents a descriptive statistics for the endogenous variables: returns on FTSE/ATHEX20 and FTSE/ATHEX BANKS indexes, output gap, net interest spread and foreign assets inflow, respectively. The
main characteristic of this time-series is that with financial liberalisation in Greece and Cyprus there is a clear upward trend for Athens and Cyprus stock exchange indexes.
Table 1: Descriptive statistics for endogenous variables
Foreign
assets, Cyprus
Foreign
assets, Greece
Returns on
FTSE/ ATHEX20
Returns on
FTSE/ ATHEX
BANKS
Net
interest spread,
Cyprus
Net interest
spread, Greece
Output gap,
Cyprus
Output gap,
Greece
Mean 5798.951 47086.01 -0.002392 0.000637 2.297638 4.676444 -0.000525 -0.000678
Median 5052.483 39178.95 0.023324 0.033909 2.500000 4.296670 -0.003160 -0.001786
* The Jarque–Bera statistic tests the null of normal distribution.
Source: Author’s calculations
We start by constructing a multiple cross-correlation matrix to identify our local units (groups) to be
included as a CSA in a model, and then we test for the presence of dominance effects, continuing by CSA cross-country short run dynamic. We test the structural changes due to financial market liberalisation and
%-.8
%-.6
%-.4
%-.2
%.0
%.2
%.4
%.6
98 99 00 01 02 03 04 05 06 07 08
Return on FTSE/ATHEX20
Return on FTSE/ATHEXBANKS Year
fiscal reforms using Wald statistics and do not fails to find a significant impact of liberalised banking on returns starting from 2003 Q3, testing for structural breaks and stochastic assumptions.
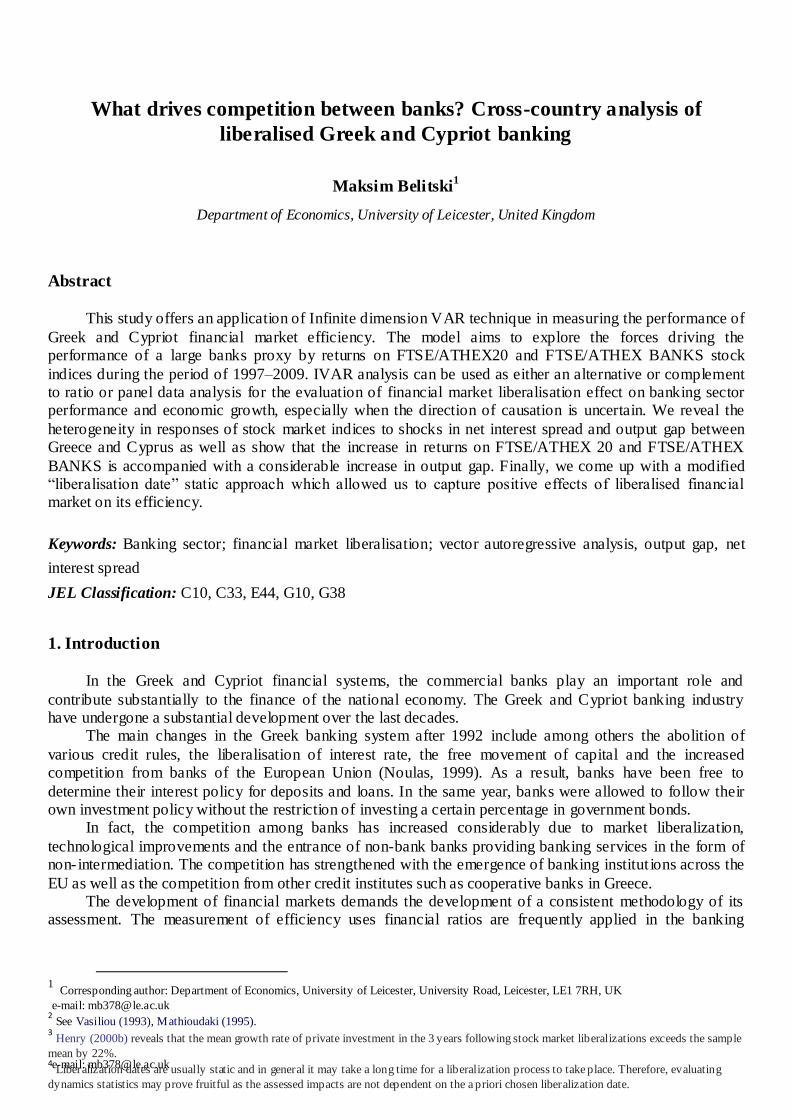
Figure 3: Net interest spread in Greece and Cyprus over a period 1997 Q4 – 2009 Q1, %
Furthermore, with the use of IVAR models for Greece and Cyprus we can evidence that the Athens
stock exchange is highly correlated with the Cyprus as the same large financial institutions are normally listed both of the Stock Exchanges. The author does not test for cointegration, although after plotting the data without implementation of Johansen test we have a noticeable evidence of cointegration relationship
between the stock exchange indexes and their returns (Fig. 1, Fig. 2), considered as endogenous variables in a model. The implication of this is that interpretation of the test statistics should be conservative and that we
cannot exclude cointegrating relationship in the data, therefore we do not choose to present the vector error correction model. This is for two reasons.
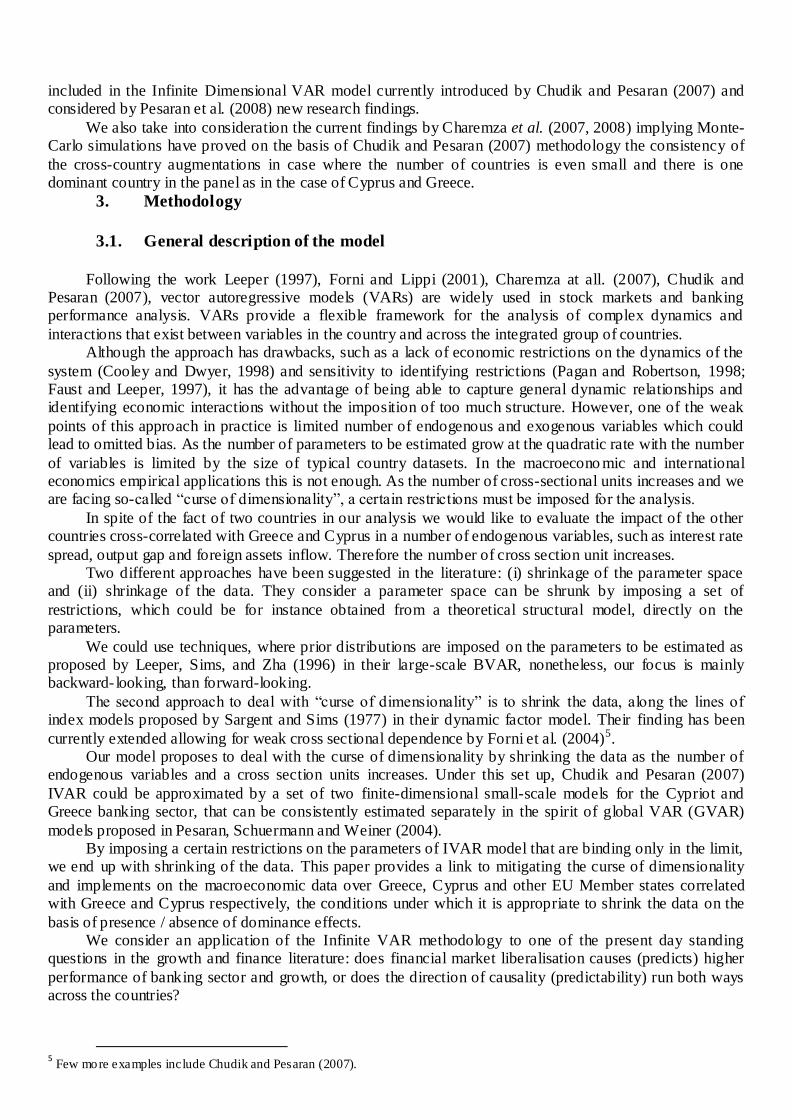
Figure 4: Foreign assets inflows in Greece and Cyprus over a period 1997 Q4 – 2009 Q1, millions USD
First, we expect if there is a cointegration between the financial market variables, output gap and foreign assets will result in a system that will be stationary and thus render any test stat istics asymptotically valid. Second, the cointegration relationship is not the central focus of the model‘s propositions. The short
term dynamics, dominance analyses and the impact of financial market liberalisation on the degree of market efficiency and economic performance are the main focus. Inferences about these dynamics,
exogeneity and dominance will be robust in this situation. There is no cointegration found in the other endogenous variables as net interest spread, foreign assets and output gap, see Fig. 3, Fig. 4 and Fig. 6, respectively.
Despite of a common history there is a high heterogeneity between Greek and Cypriot economies. It‘s noteworthy, that Cypriot volatility of output gap is much higher than those of Greece and could be probably
explained by the size of the economy. Surprisingly, there is a convergence of the net interest spread in levels achieved in 2004 between Greece and Cyprus as the financial market liberalisation and more intensive cross-country cooperation in capital and labour flows were taking place. Almost equal level of net interest
spreads remained until the financial crises period started in the beginning of 2008. At the same time, there is
-2%
0%
2%
4%
6%
8%
10%
98 99 00 01 02 03 04 05 06 07 08
Net iterest spread, Greece
Net interest spread, Cyprus
Year
$0
$20,000
$40,000
$60,000
$80,000
$100,000
$120,000
98 99 00 01 02 03 04 05 06 07 08
Foreign assets, Cyprus Foreign assets, Greece
Year
a divergence in foreign asset inflows in levels (see Fig 4) it seems that the rates o f change in foreign assets inflows between Cyprus and Greece are cointegrated (Figure 5).
Figure 5: Net interest spread and foreign assets rates in Greece and Cyprus, 1997 Q4 – 2009 Q1, %
Figure 6: Greek and Cypriot output gap 1997 Q4 – 2009 Q1, % deviation
Our attention is drawn to the distinctive drop in the rate of foreign assets inflows in Greece and almost
the same decline in the rate of foreign assets inflows in Cyprus just with a 5 quarters delay. Figure 5 is
particularly important in understanding of driving forces between two economies. Furthermore, the rates of foreign assets inflow in Greece are slightly higher than in Cyprus, starting from 2001-2002 and is ongoing. Both for Greece and Cyprus stock indices have little skewness or symmetric distribution like the bell-shaped
normal curve for FTSE/ATHEX 20 (0.33) and less for FTSE/ATHEX BANKS (0.23). Right tails for Greece and Cyprus are noticeable 1.73 and 0.75 accordingly, which proves the aforementioned observations.
Kurtosis behaves even which shows a small variance due to infrequent extreme deviations. Figure 6 shows the volatility of output gap and a sequence of relevant historical events. Hypothetically
aforementioned events such as political decisions, institutional reforms, wars, tax reforms, elections,
financial crises, etc. might have affected the dynamics of output gap. They could have also been an indirect forces driving output gap volatility through the monetary policy instruments and financial liberalisation in
Greece and Cyprus between 1997 and 2009.
4.3. Testing for dominance effects and cross-country augmented regressions
Matrix (6) enabled us to identify the number of cross-correlated groups to be included in a calculation of cross-section augmented regressions and finally answer the ambiguous question: do Greece and Cyprus
financial sectors experience dominance effect over the rest of EU member States or the banking sector performance of Greek and Cypriot largest banks depends exclusively on endogenous shocks?
𝐺𝑅𝑦𝑡,𝐺𝑅𝑟𝑖𝑡,𝐺𝑅𝜋𝑖𝑡 – Cross-section augmented groups for Greece in output gap, net interest spread and foreign assets, respectively;
𝐶𝑈𝑦𝑡 , 𝐶𝑈𝑟𝑖𝑡,𝐶𝑈𝜋𝑖𝑡 – Cross-section augmented groups for Cyprus in output gap, net interest sp read and foreign assets, respectively;
Source: Author’s calculations
It‘s noteworthy, that the non-neighbourhood countries as well as the countries with a negligible share
of foreign trade (0.02-0.30%) are often highly correlated in foreign assets inflows and net interest spread, for instance, Denmark, Latvia, Netherlands, Estonia and Portugal are correlated in net interest spread with Greece having a low share in foreign trade with this country. The same tendency is true for Cyprus
correlated with Lithuania, Estonia, and Belgium in foreign assets. This proves the fact that the distance does not matter for the financial market development as well as liberalisation which lifts up a gravity concept in
international economics. The results of the table 2 also support the statement of a higher cross-country correlation in a banking
sector and financial markets rather than in the output gap.
Taking into account the data limitations (46 observations) and in order to deal the most effectively with the ―curse of dimensionality‖ by shrinking the data, country specific cross-country augmentations were
calculated on the basis of bivariate cross-country correlation coefficients. Finally, we deal with a unique CSA in output gap, net interest spread and foreign assets inflows for Greece and Cyprus. Each endogenous variable, except of stock indices in a VAR model is attributed with its ―tailor-made‖ CSA. We do not
calculate the CSAs for a stock indices even thou we believe there is possib ility of a correlation between FTSE/Athex 20 and, for instance, FTSE 100, FTSE 250, CAC 40, PTC, Dax, etc. The value of the trade
weighted cross section averages coefficient on the assessment of equation (1) provides us with information on the presence of dominance effect for a specific variable across the countries. Should 𝜃𝑞𝑖 = 0 for 𝑙 𝜖 0,… . , 𝑞 we conclude on absence of dominance effect (no domination). On the contrary,
we conclude on the country been dominated should there the value of 𝜃𝑞𝑖 for 𝑙 𝜖 0,… . , 𝑞 be
slightly/significantly different from zero. Indeed, the degree of dominance / domination depends on a weak or a strong dominance effect in a specific variable.
Table 3: Country specific cross-section group augmentations and Wald dominance test*
* Results for lag orders equal to zero are reported.
(*), (**), (***) significant at 1%, 5% and 10% level, respectively
Source: Author’s calculations
The results for the Wald dominance test and the values of trade weighted cross section augmented coefficients and t-statistics, resulted at lag order equal to zero are displayed in Table 3, which allows us to
conclude the following. Dominance effect in the output gap is registered both for Greece and Cyprus; dominance effect in net interest spread is 10% statistically significant for Cyprus; dominance effect in
foreign assets inflows is statistically significant for Greece, but not for Cyprus. The later result is surprising as the dependence of Cyprus over foreign investments should be higher than for the Greece as the size of Greek economy is larger.
The results of stochastic assumptions tests of CSA regression disturbances follow the GM conditions and allow to the OLS estimator to be efficient and consistent. Should the CSA be included in a VAR model
as an exogenous variable, the residual autocorrelation and heteroskedasticity are of primary concern and is interpreted as an indication of specification errors of a country models.
Whenever autocorrelation and heteroskedasticity are found in the residuals we respecify the systematic
part of a model looking at the behaviour of autocorrelation and partial autocorrelation functions of a dependent variable to get well-behaved residuals.
4.4. Static and dynamic approaches to Liberalised financial market analysis
There are two possible ways to analyse the affect of financial market liberalisation on banking sector
performance and economic growth: ―liberalisation date‖ approach and impulse response functions comparative analysis. In this paper we do both of them.
Table 4 presents the results of binary variable coefficients fixed in the first, second and a third quarter of 2003, respectively, controlling for a structural break as s result of financial market liberalisation and institutional reforms in Cyprus and Greece.
Table 4: The effect of financial market liberalization in Greece and Cyprus (static approach)₣
(*), (**), (***) significant at 1%, 5% and 10% level, respectively ₣𝛿𝑞𝑖 is a country specific matrix of a binary variable coefficients controlling for the effect of financial market liberalisation in
2003.
Source: Author’s calculations
As far as we can see from the table ―Liberalisation dates‖ approach itself is reliable, however is static. That‘s why is unlikely to capture the effect of monetary, institutional and fiscal policy changes as it
normally takes a long time for the process to mature. Taking into account this fact and in order to demonstrate the rationality of our approach we have implemented a dynamic approach to a binary variable of interest moving it forward between the first and a third quarters in 2003, the time lag when the reform
took place. It‘s noteworthy, one of the ways to make binary variable work checking for structural a break is get rid of static approach and play with the binary variables across the time span. Indeed, it took at least two
quarters both for Cyprus and Greece to experience the effect of liberalisation on the banking sector performance at 5% level of statistical significance when we can tell that the results are robust (see Table 4). Cross section augmentations in the model are used as the weights identifying the impact of correlated group
of countries on the endogenous variables.
Table 4 demonstrates the absence of liberalised banking effect on output gap, net interest spread and foreign assets inflows. It also support the proposition one made in Section 3 as the size of the economy, on
the example of Greece and Cyprus did not have an impact on time it took for a financial market liberalisation process to mature. Static analysis proved the proposition two partially, as the liberalised
financial markets had an impact on the degree of market efficiency, i.e. pushed up the returns on stock market indices, and had no impact on economic growth.
Furthermore to determine the dynamics of the system of equations, we employ the same five-variable
VAR as in the previous sub section. The VAR is unrestricted —that is, we impose no structural or exogeneity assumptions. This is critical, because the VAR approach is not based on using the exogeneity test
to restrict a model and such restrictions may not be valid for the structural model. To understand which dynamic relationship may be part of the model, we analyse the model‘s impulse respo nses. These are computed from the estimated, unrestricted VAR. The estimated VAR is inverted and its moving average
response is presented for Greece and Cyprus. To support the inferences about the direction of relationship between the financial market liberalisation,
economic performance and returns on FTSE/ATHEX indices we summarise the structural shocks in Appendix 1. To be sure, that the results are robust we look at 95% confidence intervals. Thus, confidence intervals in our IVAR model are used to indicate the reliability of impulse response functions estimate.
The main findings of impulse response functions are the following: 1. The principle differences in the behaviour of returns on FTSE/ATHEX20 and FTSE/ATHEXBANKS
(see Figures A and B) for Greece and Cyprus are: a) A shock to net interest spread leads to an increase in the returns on FTSE/ATHEX20 and
FTSE/ATHEXBANK for Greece and leads to a decrease in the same returns for Cyprus. Moreover the
shock is transitory for Greece dyeing out after two quarters, whenever the shock for Cyprus is more permanent lasting for about 9 quarters for FTSE/ATHEX20 and 11 quarters for FTSE/ATHEXBANKS.
b) The response of a shock to itself is higher in returns on FTSE/ATHEX20 for Cyprus and lower for Greece, on the contrary for FTSE/ATHEXBANK index.
c) A shock to returns on FTSE/ATHEXBANKS leads to an increase in returns on FTSE/ATHEX20 for
both countries, but not vice versa. A shock to returns on FTSE/ATHEX20 leads to a decrease in returns on FTSE/ATHEXBANKS for Greece.
d) Decrease in the rates of net interest spread both for Greece and Cyprus as a result of financial market liberalisation, minimisation of global risks and growing competition in the banking sector lead to an increase in banking sector performance through proxy by the returns on FTSE/ATHEX20 and
FTSE/ATHEXBANK indexes for Cyprus, but not for Greece. A steady growth in foreign assets inflows has a weak impact on the banking sector performance between two countries. This partially support the
hypothesis two underlined in Section 3. 2. Figures B and A generally support the proposition one claiming that the larger economies are more
sensitive to a shocks than the smaller one on the example of Greece and Cyprus. Indeed, the response of
output gap to a shock in itself is about triple higher for Greece than for Cyprus, albeit crosses zero after 2 quarters. A shock to returns on FTSE/ATHEX 20 is double higher for Greek economic performance than
for Cypriot. Greek output gap responds more consistently to a shock in foreign assets diving it upwards on 0.02%. Hence, Figure C confirms the proposition 3 of a model: output gap is sensitive to banking sector performance proxy by returns on stock market indices. In fact, a shock to returns on
FTSE/ATHEX20 both for Cyprus and Greece leads to an increase in output gap, albeit crosses zero after two quarters.
3. Conclusions
This paper presents empirical evidence of financial market liberalisation in Greece and Cyprus and its impact on the banking sector efficiency and economic performance during the period of 1997-2009.
We performed an application of Infinite Dimension VAR model currently introduced by Chudik and
Pesaran (2007) based on inclusion the cross-section augmentations accounting for ―curse of dimensionality‖
problem. The model was empirically tested by Charemza et al (2008) on the small group of countries which made it applicable for Greece and Cyprus.
Other significant findings of this study are the following: (a) A wide variation in performance of the Greek and Cypriot banking system is observed through the
period of 1997-2009. A decrease in banking sector performance proxy by returns on FTSE/ATHEX20 and FTSE/ATHEXBANKS in 2000-2003 is followed by a significant increase in the mid. 2003 as a result of financial market liberalisation.
(b) There is a positive relationship between size of the economy and performance. Greece which is larger economy than a Cypriot continuous to increase the economic performance proxy by output gap,
demonstrates a higher level of foreign assets inflows and a higher degree of competition in banking experiencing significant decrease in net interest spread within 1999-2009.
(c) The convergence of interest rate spreads, increase in foreign assets inflows, fiscal, institutional and
monetary policy reforms currently introduced in Cyprus provide an empirical evidence of the benefits of liberalised financial markets allowing for portfolio flows and stimulating higher competition in a banking
sector. (d) Financial markets may evolve and converge to more mature markets, increasing their degree of
efficiency and competitiveness across the countries. These effects may reduce the cost of capital for
companies that are listed in Athens and Cyprus Stock Exchange, providing a better economic environment and growth.
(e) Complex implementation of ―static‖ and ―dynamic‖ approaches to analyse the impact of liberalised financial market on the degree of market efficiency may be seen as the efficient evidence to the ongoing criticism on ―liberalisation date‖ static process as author attempts to find a possible efficient solutions to this
problem. Our results suggest that Greek and Cypriot returns on stock indices follow complex patterns and are characterised by heterogeneity in responses to a structural shocks.
(f) Greek and Cypriot stock markets are found to be highly correlated as the same companies are included both in FTSE/ATHEX20 and FTSE/ATHEX BANKS stock exchanges indices. Furthermore, the returns on aforementioned indices representing the performance of Greek and Cypriot largest banks as well
as output gap of the country are found to be sensitive to liberalisation policy toolbox. Further research could focus on specification of composite shocks in foreign assets inflows, output
gap, interest rates on lending and borrowing across the 27 EU Member states as well as a practical approach to design monetary and fiscal policy toolboxes. Impulse response analyses might be helpful to understand the possible consequences of the monetary policy instruments implementation in different size economies as
we see they respond heterogeneously to the same type of shocks. It‘s worth analysing the empirical facts of financial liberalisation policy during the financial crises and an optimum time when banking sector
liberalisation policy should be applied. References
Abiad, A., Oomes, N., Ueda, K. (2008), ‗The quality effect: Does financial liberalization improve the
allocation of capital?‘, Journal of Development Economics, 87, 270−282.
Apergis, N., Eleptheriou, S. (2001), ‗Stock returns and volatility: Evidence from the Athens stock market index‘, Journal of Economics and Finance, 25, 50−61.
Arellano, M., Bond, S. (1991), "Some tests of specification for panel data: Monte Carlo evidence and an application to employment equations", The Review of Economic Studies, Vol. 58 pp.277-97.
Ayhan Kose, M. et al. (2009), ―Does openness to international financial flows raise productivity growth‖,
Journal of International Money and Finance, Vol. 28, No. 4, pp. 554-80. Barabási, A. L., Vicsek, T. (1991), ‗Multifractality of self-affine fractals‘, Physical Review, 44,
2730−2733. Barkoulas, J. T., Baum, C. F., Travlos, N. (2000), ‗Long memory in the Greek market‘, Applied Financial
Economics, 10, 177−184.
Bassanini, A., Scarpetta, S., Hemings, P. (2001), "Economic growth: the role of policies and institution: panel data evidence from OECE countries", Working Paper No. 283, OECE Economics Department,
Paris. Bekaert, G. and Harvey, C. R. (2000), ‗Foreign speculators and emerging equity markets‘, The Journal of
Finance, 55, 565−612. Bekaert, G., Harvey, C. R., Lundblad, C. (2001), ‗Emerging equity markets and economic development,
Journal of Development Economics, 66, 465−504. Bekaert, G., Harvey, C. R., Lundblad, C. (2003), ‗Equity market liberalization in emerging equity markets‘,
Journal of Financial Research, 26, 275−299.
Benigno, P. and G. Benigno (2006), ‗Designing targeting rules for international monetary policy cooperation, Journal of Monetary Economics, 53, 473-506.
Berg, A., Forsund, F., Jansen, E. (1991), ‗Technical efficiency in Norwegian banks: a non parametric approach to efficiency measurement‘, J. Prod. Anal., 2, 127–142.
Berg, S.A., Forsund, F.R., Hjalmarsson, L., Souminen, M. (1993), ‗Banking efficiency in the Nordic
countries‘, Journal of Banking and Finance, 17 (2/3), 371–388. Berger, A.N., Humphrey, D.B. (1992), ‗Measurement and efficiency issues in commercial banking‘. In:
Griliches, Z. (Ed.), Output Measurement in the Service Sectors. University of Chicago Press, Chicago, pp. 245–279.
Berger, A.N., Humphrey, D.B. (1997), ‗Efficiency of financial institutions: international survey and
directions for future research‘, Eur. J. Operational Res. (special issue), www.http://papers.ssrn.com/paper.taf?ABSTRACT ID=2140.
Cajueiro, D., Gogas, P., Tabak, B. (2009), ‗Does financial market liberalization increase the degree of market efficiency? The case of the Athens stock exchange‘, International Review of Financial Analysis, 18, pp. 50–57.
Chortareas, G., Ritsatos, T., & Sfiridis, J. (2000). Capital outflow liberalization and stock market reaction in an emerging market: Experience from Greece. Journal of Economics and Finance, 24, 77– 89.
Charemza, W. and S. Makarova (2008), ‗FLEA: The forward looking econometric algorithms for Gauss‘, University of Leicester, mimeo
Charemza, W., Yu. Kharin, S. Makarova, V. Malugin, V. Majkowska, Yu Raskina, Yu. Vymyatnina and A.
Huryn (2007), ‗Inter-country econometric models of the economies of Belarus, Russia and Ukraine‘, paper presented at the conference Computer Data Analysis and Modelling, Minsk
Chudik, A. and M.H. Pesaran (2007), ‗Infinite-dimensional VAR‘s and factor models‘, IZA DP No. 3206. Cooley, T.F., Dwyer, M. (1998), ―Business cycle analysis without much theory. A look at Structural vars‖,
journal of Econometrics, Vol. 83, No. 1-2, pp.57-88.
Faust, J., Leeper, E.M. (1997), ‗When do long run identifying restrictions give reliable results‘, Journal of Business and Economic Statistics, 15 (3), 345-353.
Forni, M, Lippi, M. (2001), ‗The generalized dynamic factor model: Representation theory‘, Econometric theory, 17 (6), 1113-1141.
Fucuyama, H. (1993), ‗Technical and scale efficiency of Japanese commercial banks: a non parametric
approach‘, Appl. Econ., 25, 1101–1112. Gali, J. and T. Monacelli (2005), ‗Monetary policy and exchange rate volatility in a small open economy‘,
Review of Economic Studies. 75, 707-734. Garas, A. and Argyrakis, P. (2007), ‗Correlation study of the Athens stock exchange‘, Physica A, 380, 399−410.
Galindo, A., Schiantarelli, F., Weiss, A. (2007), ‗Does financial liberalization improve the allocation of investment? Micro-evidence from developing countries‘, Journal of Development Economics, 83,
562−587. Grilli, V., Milesi-Ferretti, G. M. (1995), ‗Economic effects and structural determinants of capital controls‘,
IMF Working Paper, 95/31.
Henry, P. B. (2000), ‗Stock market liberalization, economic reform and emerging market equity prices‘, The Journal of Finance, 55, 529−564.
Henry, P. B. (2000), ‗Equity prices, stock market liberalization, and investment‘, Journal of Financial Economics, 58, 301−334.
Iwata, S., Wu, S. (2009). Stock market liberalization and international risk sharing, Journal of International
Financial Markets Institutions and Money.
Kim, E. H. and Singal, V. (2000), ‗Stock market openings: Experience of emerging economies‘, Journal of Business, 73, 25−66.
Klein, M. W., Olivei, G. P. (2008), ‗Capital account liberalization, financial depth, and economic growth‘, Journal of International Money and Finance, 27, 861−875.
Kohers, T., Huang, M., Kohers, N. (2000), ‗Market perception of efficiency in bank holding company mergers: the roles of the DEA and SFA models in capturing merger potential‘, Rev. Financial Econ. 9, 101–120.
Laopodis, N. (2004), ‗Financial market liberalization and stock market efficiency: Evidence from the Athens stock exchange‘. Global Finance Journal, 15, 103−123.
Leahy, M., Schich, S., Wehinger, G., Pelgrin, F., Thorgeirsson, T. (2001), ―Co ntribution of financial systems to growth in OECD countries‖ OECD Economics Department Working Paper, No. 280, Paris.
Leeper, E.M. (1997), ‗Narrative and VAR approaches to monetary policy: Common identification
problems‘, Journal of Monetary Economics, 40 (3), 641-657. Leeper, E.M., Sims, C.A., Zha, T. (1996), What does monetary policy do?‘, Brookings Papers on Economic
Activity, 2, 1-63. Levine, R. (1999), ‗Law, Finance, and Economic Growth‘, Journal of Financial Intermediation,
8 (1-2), 8-35.
Levine, R. et al. (2000), ‘Financial intermediation and growth: Causality and causes‘, Journal of Monetary Economics, 46 (1), 31-77.
Lovell, C.A.K. (1995), ‗Measuring the macroeconomic performance of the Taiwanese economy‘, Int. J. Prod. Econ. 39 (1/2), pp. 165–178.
Mathioudaki, S. (1995), ‗The efficiency of the Greek Banks in the decade 1985–1994‘, Econ. Rev.
(Commercial Bank of Greece), 3, 32–39. Noulas, A., 1994. Operating efficiency in the Hellenic bank industry: a data envelopment analysis approach.
In: Proceedings of 40th International Atlantic Economic Conference in Williamsburg. Odabasi, A., Aksu, C., Akgiray, V. (2004), ‗The statistical evolution of prices on the Istanbul stock
exchange‘, European Journal of Finance, 10, 510−525.
Pagan, A. R, Robertson, J. C. (1998), ‗Structural models of the liquidity effect‘, Review of Economics and Statistics, 80 (2), 202-216.
Pagano, M. (1993), ―Financial markets and growth‖. An overview, European Economic Review, Vol. 37, No. 2-3, pp. 613-622.
Panas, E. E. (2001), ‗Estimating fractal dimension using stable distributions and exploring long memory
through ARFIMA models in the Athens stock exchange‘, Applied Financial Economics, 11, 395−402. Pesaran, M.H., Schuermann, T. and Weiner, S.M. (2004), ‗Modelling Regional Interdependencies Using A
Global Error-Correcting Macroeconometric Model‘, Journal of Business and Economics Statistics, 22, 129-162.
Pesaran, M.H. and Tosetti, E. (2007), ‗Large Panels with Common Factors and Spatial Correlations‘, IZA
Discussion Paper No. 3032, September 2007. Pesaran, M. H., T. Schuermann and L.V. Smith (2008), ‗Forecasting economic and financial variables with
global VAR‘s‘, CESifo Working Paper No. 2263 Rajan, R.G., Zingales, L. (1998), ―Financial Dependence and Growth‖, ―American Economic Review‖, Vol.
88, No. 3, pp. 559-86.
Quinn, D. P., Toyoda, A. M. (2008), ‗Does capital account liberalization lead to growth?‘, Review of Financial Studies, 21, 1403−1449.
Rouse, P., Putterill, M., Ryan, D. (2002), ‗Integrated performance measurement design: insights from an application in aircraft maintance‘, Manag. Account. Res. 13, 229–248.
Sargent, T.J., and Sims, C.A. (1977). Business cycle modeling without pretending to have too much a-priori
economic theory., in: C. Sims et al. (eds.), New Methods in Business Cycle Research, Federal Reserve Bank of Minneapolis, Minneapolis.
Vasiliou, D., (1993), ‗Exploring the profitability of the Greek banking market‘. Bull. Union Greek Banks 37/38 (A), 95–98.
Yang, Y., Yi, M. H. (2008), ‗Does financial development cause economic growth? Implication for policy in
Korea‘, Journal of Policy Modeling, 30, 827−840.
APPENDIX 1
Impulse response analysis
Figure A: Impulse responses of returns on FTSE/ATHEX20 to innovations in itself (small cap); FTSE/ATHEX banks index (tilted); output gap (strikethrough); net interest spread (dotted line underlined), foreign assets (heavy line underlined)
Figure B: Impulse responses of returns on FTSE/ATHEXBANKS to innovations in itself (small cap); FTSE/ATHEX 20 index (tilted); output gap (strikethrough); net interest spread (dotted line underlined), foreign assets (heavy line underlined)
Figure C: Impulse responses of output gap to innovations in itself (small cap); FTSE/ATHEX 20 index
(tilted); returns on FTSE/ATHEXBANKS (strikethrough); net interest spread (dotted line underlined), foreign assets (heavy line underlined)