WORKING PAPER SERIES NO 677 / SEPTEMBER 2006 WHAT DRIVES EU BANKS’ STOCK RETURNS? BANK-LEVEL EVIDENCE USING THE DYNAMIC DIVIDEND-DISCOUNT MODEL by Olli Castrén, Trevor Fitzpatrick and Matthias Sydow
Transcript
ISSN 1561081-0
9 7 7 1 5 6 1 0 8 1 0 0 5
WORKING PAPER SER IESNO 677 / SEPTEMBER 2006
WHAT DRIVES EU BANKS’ STOCK RETURNS?
BANK-LEVEL EVIDENCE USING THE DYNAMICDIVIDEND-DISCOUNT MODEL
by Olli Castrén, Trevor Fitzpatrick and Matthias Sydow
In 2006 all ECB publications
feature a motif taken
from the €5 banknote.
WORK ING PAPER SER IE SNO 677 / S EPTEMBER 2006
This paper can be downloaded without charge from http://www.ecb.int or from the Social Science Research Network
electronic library at http://ssrn.com/abstract_id=929447
1 The views expressed in this article are the authors’ only and do not necessarily reflect those of the European Central Bank or the European System of Central banks. We thank Chiara Osbat and the members of the ESCB Banking Supervision Committee for
helpful comments. All remaining errors are ours.
WHAT DRIVES EU BANKS’ STOCK RETURNS?
BANK-LEVEL EVIDENCE USING THE DYNAMICDIVIDEND-DISCOUNT
MODEL 1
2 Corresponding address: European Central Bank, Kaiserstrasse 29, 60311 Frankfurt am Main, Germany; e-mail: [email protected]
by Olli Castrén 2, Trevor Fitzpatrick 2 and Matthias Sydow 2
AddressKaiserstrasse 2960311 Frankfurt am Main, Germany
Postal addressPostfach 16 03 1960066 Frankfurt am Main, Germany
Telephone+49 69 1344 0
Internethttp://www.ecb.int
Fax+49 69 1344 6000
Telex411 144 ecb d
All rights reserved.
Any reproduction, publication andreprint in the form of a differentpublication, whether printed orproduced electronically, in whole or inpart, is permitted only with the explicitwritten authorisation of the ECB or theauthor(s).
The views expressed in this paper do notnecessarily reflect those of the EuropeanCentral Bank.
The statement of purpose for the ECBWorking Paper Series is available fromthe ECB website, http://www.ecb.int.
ISSN 1561-0810 (print)ISSN 1725-2806 (online)
3ECB
Working Paper Series No 677September 2006
CONTENTSAbstract 4
Non-technical summary 5
1 Introduction
2 Potential determinants of bank levelstock returns
3 Data 11
4 EU banks’ stock return decomposition 12
5 Empirical implementation using vectorautoregression approach 13
6 Results from the VAR analysis 15
6.1 Impulse responses 15
6.2 Variance decomposition 16
7stock returns? 17
8 Conclusions 19
References
Tables and figures
European Central Bank Working Paper Series
Can cash-flow proxies explain EU banks’
7
9
21
23
27
4ECBWorking Paper Series No 677September 2006
Abstract
We combine the dynamic dividend-discount model with an accounting-based vector autoregression framework that allows for a decomposition ofEU banks�stock returns to cash-�ow and expected return news compo-nents. The main �ndings are that while the bulk of the variability ofEU banks�stock returns is due to cash �ow shocks, the expected returnshocks are relatively more important for larger than for smaller banks.Moroever, variables used in the literature as cash-�ow proxies explain ahigher share of the cash-�ow component of the total excess returns forsmaller than for larger EU banks. This suggests that large banks couldbe more prone to market wide news and events - that in the literature areassociated with the expected return news component - as opposed to thebank-speci�c news, typically assumed to be incorporated in the cash-�owcomponent.
Key words: Bank stock return predictability, return decomposition,panel VAR estimation, cash �ow news.
JEL classi�cation: C33, G12, G21
5ECB
Working Paper Series No 677September 2006
Non-technical summary
The market prices of bank securities, such as equities, provide important in-formation for market participants, for central banks with �nancial stability re-sponsibilities, and for bank supervisors, from at least �ve di¤erent perspectives.First, a bank�s equity price may e¤ectively summarise all the public informa-tion available from the bank, including potential risks, in one number. Second,when working under the e¢ cient-market hypothesis, banks�securities prices atany point in time have a forward looking component in that they incorporateexpectations of both positive and negative future earnings prospects. Third, thebanks�share price information is available at much higher frequency comparedwith accounting information. Fourth, as �nancial disturbances in one bank havethe capacity to spread through various channels and this may be re�ected instock markets, it is important to know to what extent the variability in individ-ual banks�stock prices are driven by common versus bank speci�c components.Finally, as part of the implementation of the Basel II rules and regulations,one of the pillars of the accord introduces market discipline to the supervisoryand oversight process, thus accentuating the role of market information in theprudential monitoring process.The main contribution of this paper is to provide a better understanding of
the factors that may drive the unexpected variability in banks�equity prices byincorporating �nancial accounting data in an econometric model of bank stockreturns. To this end, the empirical method developed by Campbell and Shiller(1988) and Campbell (1991) that is applied in the analysis below explicitlydistinguishes between changes in rational expectations of future dividends andchanges in rational expectations of future returns. The literature frequently callsthe former �news about future dividends�, or �cash-�ow news�, and the latter�news about future returns�, or �expected return news.�We will investigatethe behaviour of EU banks�unexpected stock returns by separating them intocomponents that are in�uenced by these two types of news.Our analysis also contributes to assessing market e¢ ciency in a way that
it investigates how the markets price in information about banks and how thisprocess may di¤er across di¤erent types of banks. To that end, we apply alarge panel of 53 EU banks using a stationary vector autoregressive (VAR) sys-tem that allows us to focus on such �rm-level e¤ects. A further contributionto the literature is provided by the fact that we also want to analyse whetherlarge banks�stock prices could be a¤ected by di¤erent factors than small banks�stock prices. This could have important implications from the point of viewof �nancial stability analysis in so far as the relative importance of stock mar-ket volatility as an indicator either for bank-speci�c distress or an indicator formarket-wide disturbances may be di¤erent for di¤erent sizes of institutions. Wealso consider the potential e¤ect of leverage on stock returns as this has previ-ously been found to positively a¤ect bank stock returns (see Cooper, Jackson,and Patterson (2003)).In line with earlier work based on US �rm-level stock market data, our
results con�rm that EU banks�stock returns exhibit a short-term momentum
6ECBWorking Paper Series No 677September 2006
e¤ect while the return gains tend to be reversed in the long-term. The main�ndings of our study are, however, that using bank-level data, news on cash-�owfundamentals tends to dominate news on expected returns as a driver for stockreturns variability for these EU banks. Campbell (1991) and Vuolteenaho (2002)have interpreted the two returns news components so that the cash-�ow, ordividend, component is more likely to re�ect the �rm-speci�c, or idiosyncratic,news. The expected return news component, in turn, is more likely to re�ect thesystematic, or macroeconomic, news. Indeed, in an accounting-based model, thecash-�ow news can be shown to equal the expected changes in the bank�s returnon equity, while the expected return news can be shown to equal the expectedchanges in the bank�s excess log stock return and in the common discount rate.Moreover, since unexpected changes in a banks�stock return are, by de�nition,associated with simultaneous o¤setting movement in future expected returns,expected return news have a transitory impact on value. Cash-�ow shocksinstead have permanent e¤ects on value as they do not result in a change infuture expected returns.We also �nd that the size of the cash-�ow news component relative to the
expected return news component is substantially stronger for small banks thanfor large banks. A possible reason behind this �nding is that larger EU banksare more diversi�ed across business lines and geographical regions which couldmake them more sensitive to market wide developments. On the other hand,smaller banks typically have exposures to more local projects. In addition,we �nd that �rm-level earnings variables that have often been used to proxycash-�ow information in single-equation regressions with total returns as theleft-hand side variable (see for example Collins, Kothari, Shanken, and Sloan(1994)) are indeed typically associated with the cash-�ow news component ofthe total returns. However, the earnings measures are simultaneously also asso-ciated with the negative of the expected return news component, which reducesthe explanatory power of these variables in the total return regressions. Theassociation of the earnings variables with the cash-�ow news is, interestingly,also more signi�cant for small rather than for large EU banks. All in all, theseresult suggests that, among other things, smaller banks could be less prone tosystemic shocks, the results of which are transmitted through the stock market.
7ECB
Working Paper Series No 677September 2006
1 Introduction
The market prices of bank securities, such as equities, provide important in-formation for market participants, for central banks with �nancial stability re-sponsibilities, and for bank supervisors, from at least �ve di¤erent perspectives.First, a bank�s equity price may e¤ectively summarise all the public informa-tion available from the bank, including potential risks, in one number. Second,when working under the e¢ cient-market hypothesis, banks�securities prices atany point in time have a forward looking component in that they incorporateexpectations of both positive and negative future earnings prospects. Third, thebanks�share price information is available at much higher frequency comparedwith accounting information. Fourth, as �nancial disturbances in one bank havethe capacity to spread through various channels and this may be re�ected instock markets, it is important to know to what extent the variability in individ-ual banks�stock prices are driven by common versus bank speci�c components.Finally, as part of the implementation of the Basel II rules and regulations,one of the pillars of the accord introduces market discipline to the supervisoryand oversight process, thus accentuating the role of market information in theprudential monitoring process.The main contribution of this paper is to provide a better understanding of
the factors that may drive the unexpected variability in banks�equity prices byincorporating �nancial accounting data in an econometric model of bank stockreturns. To this end, the empirical method developed by Campbell and Shiller(1988) and Campbell (1991) that is applied in the analysis below explicitlydistinguishes between changes in rational expectations of future dividends andchanges in rational expectations of future returns. The literature frequently callsthe former �news about future dividends�, or �cash-�ow news�, and the latter�news about future returns�, or �expected return news.�We will investigatethe behaviour of EU banks�unexpected stock returns by separating them intocomponents that are in�uenced by these two types of news.Our analysis also contributes to assessing market e¢ ciency in a way that
it investigates how the markets price in information about banks and how thisprocess may di¤er across di¤erent types of banks. To that end, we apply alarge panel of 53 EU banks using a stationary vector autoregressive (VAR) sys-tem that allows us to focus on such �rm-level e¤ects. A further contributionto the literature is provided by the fact that we also want to analyse whetherlarge banks�stock prices could be a¤ected by di¤erent factors than small banks�stock prices. This could have important implications from the point of viewof �nancial stability analysis in so far as the relative importance of stock mar-ket volatility as an indicator either for bank-speci�c distress or an indicator formarket-wide disturbances may be di¤erent for di¤erent sizes of institutions. Wealso consider the potential e¤ect of leverage on stock returns as this has previ-ously been found to positively a¤ect bank stock returns (see Cooper, Jackson,and Patterson (2003)).In line with earlier work based on US �rm-level stock market data, our
8ECBWorking Paper Series No 677September 2006
results con�rm that EU banks�stock returns exhibit a short-term momentume¤ect while the return gains tend to be reversed in the long-term. The main�ndings of our study are, however, that using bank-level data, news on cash-�owfundamentals tends to dominate news on expected returns as a driver for stockreturns variability for these EU banks. Campbell (1991) and Vuolteenaho (2002)have interpreted the two returns news components so that the cash-�ow, ordividend, component is more likely to re�ect the �rm-speci�c, or idiosyncratic,news. The expected return news component, in turn, is more likely to re�ect thesystematic, or macroeconomic, news. Indeed, in an accounting-based model, thecash-�ow news can be shown to equal the expected changes in the bank�s returnon equity, while the expected return news can be shown to equal the expectedchanges in the bank�s excess log stock return and in the common discount rate.Moreover, since unexpected changes in a banks�stock return are, by de�nition,associated with simultaneous o¤setting movement in future expected returns,expected return news have a transitory impact on value. Cash-�ow shocksinstead have permanent e¤ects on value as they do not result in a change infuture expected returns.We also �nd that the size of the cash-�ow news component relative to the
expected return news component is substantially stronger for small banks thanfor large banks. A possible reason behind this �nding is that larger EU banksare more diversi�ed across business lines and geographical regions which couldmake them more sensitive to market wide developments. On the other hand,smaller banks typically have exposures to more local projects. In addition,we �nd that �rm-level earnings variables that have often been used to proxycash-�ow information in single-equation regressions with total returns as theleft-hand side variable (see for example Collins, Kothari, Shanken, and Sloan(1994)) are indeed typically associated with the cash-�ow news component ofthe total returns. However, the earnings measures are simultaneously also asso-ciated with the negative of the expected return news component, which reducesthe explanatory power of these variables in the total return regressions. Theassociation of the earnings variables with the cash-�ow news is, interestingly,also more signi�cant for small rather than for large EU banks. All in all, theseresult suggests that, among other things, smaller banks could be less prone tosystemic shocks the results of which are transmitted through the stock marketchannel.The paper proceeds as follws. Section 2 discusses the relevant literature.
Section 3 provides an overview of the data. Section 4 �rst introduces the theorymodel for the stock return decomposition and then illustrates the emirical imple-mentation using a vector autoregression (VAR) framework. Section 5 presentsthe estimation results. Section 6 concludes.
9ECB
Working Paper Series No 677September 2006
2 Potential Determinants of Bank Level StockReturns
There is a growing literature that directly investigates the value of equity andbond market indicators for predicting distress in �nancial institutions. Curry,Elmer, and Fissel (2001) provide an analysis based on US institutions. For EUbanks, Gropp, Vesala, and Vulpes (2006) �nd some indications that equity pricedevelopments and subordinated debt spreads help to predict banking distressas de�ned by rating agency downgrades. Vennet, de Jonghe, and Baele (2004)assess the e¤ect of business cycle variables on bank stocks and conclude thatreturns can di¤er across countries and types of banks and that better capitalisedbanks produce higher stock returns during downturns. However, all these stud-ies say little about how the bank-speci�c �nancial information actually getsincorporated in the stock returns.The dividend-discount model of equity pricing states that a �rm�s stock
returns can be high either if its future earnings growth (the �fundamental�,often measured by dividends) is high, its expected returns are low, or in case ofany combination of these two efects. This workhorse model for analysing equitymarket developments has lent itself to a substantial research on determinantsof �rm�s stock prices.The literature based on the dividend-discount model can be divided roughly
into two main avenues. The �rst line of research is based on the static version ofthe model and tries to relate bank stock returns to contemporaneous bank riskor some other bank-speci�c characteristics. This work on empirical predictabil-ity of stock returns has produced several important and widely quoted results.Among these, the most prominent �ndings are that small �rms�average stock re-turns tend to outperform large �rms�returns (size e¤ect, see Banz (1981)), thatpast longer-term losers tend to outperform past longer-term winners (long-termreversal, see Bondt and Thaler (1985)), and that past short-term winners tendto outperform past short-term losers (momentum, see Jegadeesh and Titman(2001)). Other �ndings include the fact that �rms with past high pro�tabil-ity have generally had higher than average stock returns (Haugen and Baker(1996)), and that �rms with higher leverage tend to have outperformed �rmswith lower leverage (Bhandari (1988)). Similar results for European marketshave been presented by Rouwenhorst (1998).However, the contemporaneous analysis cannot tell whether a bank�s stock
return reacts to news either because market participants�expectations of futuredividends change or because their expectation of future returns change. Thesecond research tradition, broadly based on the seminal work by Campbell andShiller (1988), tries address this issue by explaining the empirical predictabilityof stock returns in a dynamic context and then to split the returns into its com-ponents. To this end, the present value formulation of the dividend-discountmodel where expected returns are assumed to remain constant has had to beaugmented by a log-linear approximation that is tractable even when expectedreturns vary through time. This method enables an analysis of the relative
10ECBWorking Paper Series No 677September 2006
importance of the cash-�ow and expected return components as drivers of ag-gregate stock returns. Using market index level stock returns data, Campbell(1991) found that expected return news accounts for about 50 to 60% of vari-ability in unexpected stock index returns. By contrast, cash-�ow news onlyexplains about one third of the variance of unexpected returns.Until recently, however, the dynamic models have provided little evidence of
what determines stock returns at the �rm level. The ability to categorize thenews to �rm-speci�c and market-wide components can, however, tell us whetherindividual �rms are more sensitive to common, or systemic, shocks relative toshocks that are speci�c to their own cash-�ow fundamentals. Vuolteenaho (2002)and Cohen, Gompers, and Vuolteenaho (2002) apply �rm-level data using thereturn de-composition technique and arrive at two important results. The �rstis that while expected return news tend to drive stock indices, variability in�rm-level stock returns is mostly associated with shocks to cash-�ow news. Thesecond �nding is that the dependence of �rm-level returns tends to vary bysize of the �rm, with large �rms being relatively more sensitive to �rm-speci�ccash-�ow news.There are some reasons why banks�stock returns could be expected to behave
di¤erently than non-�nancial �rms�stock returns. Indeed, the stock return lit-erature sometimes excludes �nancial �rms because �banks are di¤erent�. Banksdi¤er from most non-�nancial �rms in two main respects. First, the majorityof banks�assets are long-term �nancial claims - such as loans - on householdsand �rms. Banks �nance these assets by selling their own debt and equity aswell as receiving a majority of their funds in the form of short-term deposits.The main di¤erence between banks and non-�nancial �rms in this case is thatbanks tend to be more highly leveraged. Second, because banks tend to holdtheir liquid deposits against relatively illiquid loans, and since they are highlyleveraged, banks are vulnerable to runs. Since there is a high social cost of bankfailures, the banking industry is highly regulated. For example, the EU reg-ulatory instruments include minimum deposit insurance and minimum capitalrequirements to reduce the risk of bank failure. These regulatory instrumentscombined with various restrictions on entry to the banking industry at nationallevel may increase the ability of �rms in the industry to earn rents. For thesereasons, banks�stock returns could behave di¤erently than non-�nancial �rms�stock retruns.Empirical work using individual bank data needs to consider these factors.
Given that the European regulatory framework for �nancial institutions, in-cluding deposit insurance, is harmonised at the EU level, and the Basel accordfor capital requirements is rather widely applied, it is unlikely that regulatoryfactors can account for systematic di¤erences in returns.1 This leaves size andleverage as relevant variables to consider in our analysis. Cooper, Jackson,and Patterson (2003), using di¤erent methodologies and a cross-section of USbanks, found that information about earnings, leverage, and non-interest in-
1For more on the introduction of deposit insurance in the EU level see Gropp and Vesala(2004).
11ECB
Working Paper Series No 677September 2006
come can predict a cross-section of future bank stock returns. Brewer, Jack-son, and Moser (1996) use another approach based on cross-section time-seriesestimation. They investigate the relationship between stock return volatility,asset mix, and derivative activity for US Savings and Loans (S&L) institutions.Among other results, they �nd a positive relationship between leverage and thevolatility of stock returns for S&L institutions. This may suggest a more com-plicated relationship between their measure of leverage and returns. Finally,there is some evidence that bank stock returns may vary with the business cy-cle. Baele, Vennet, and Landschoot (2005) use European data and �nd evidenceof cyclical variation in bank stock returns and that banks that are better cap-italised (higher equity to loan ratio) and more diversi�ed have higher returnsthan poorly capitalised less diversi�ed banks.
3 Data
Bank-level analysis requires the use of an accounting-based present-value model.Our model, to be introduced in the next section, consists of a system of fourequations. The variables to be considered are log excess stock returns, log excessreturn on equity (RoE), log leverage and log book-to-market ratio. Vuolteenaho(2002) listst three assumptions that are necessary to replace dividends by RoEin the return decomposition framework. First, RoE, book equity and marketequity need to be strictly positive. Second, the di¤erence between log RoEand log book equity and the di¤erence between log book equity and log marketequity have to be stationary. Third, the clean-surplus identity is assumed tobe satis�ed, i.e. book equity in the current year equals book equity in the lastyear plus earnings less dividends. We avoid modelling corporate dividend policyby excluding any dividend-based variables from the model due to the lack oftime-series stability of banks�dividend policy variables.The banks that are selected for this study are listed EU banks that show
a consistent time series of annual data from 1991 to 2004 for all variables thatare used in the estimation. The data set consists of accounting and marketinformation for a pooled time series of 53 EU banks. In total, this amounts to753 bank year observations. The accounting data such as return on equity, bookvalue of equity, book debt variables, as well as the equity price series and theearnings per share series, are taken from Datastream. A total of 7 observationswere missing (2 for RoE, 2 for book equity and 3 for book debt). These missingobservations were linearly interpolated. The risk free short-term interest rate isthe 1-month bid rate in the euro currency market taken from the BIS database.Various transformations are made to the data. The equity prices and the risk
free rate are continuously compounded.2 The excess stock return is constructed
2The data for the UK, Sweden and Denmark were converted to euros using the relevantmarket exchange rate. Data for the UK were also converted to euro units as they are quotedon Datastream in GBP pence. The compounding for UK data was done on a April to Aprilrather than calendar year basis in order to coincide with the UK �scal year which runs fromApril to April.
12ECBWorking Paper Series No 677September 2006
as the di¤erence between the two series. Due to the panel estimation techniquein our empirical application, the excess return series is then cross-sectionallydemeaned and normalised by dividing by its standard deviation. In a last stepthe series is annualised. The excess RoE variable is created by subtracting thecompounded risk free rate from the logged RoE. Leverage is de�ned as bookequity divided by book equity plus book debt. The annual book-to-marketratio is de�ned as the ratio of book value of equity to market value of equity.The market value of equity is calculated by multiplying the monthly equityprice with the monthly amount of shares outstanding; the series is annualizedafterwards, to allow for consistency with the annual accounting-based variables.The earnings growth variables used as cash-�ow proxies in the last part of ourempirical analysis are computed as the log of earnings per share divided by itslagged value (log(EPSt/EPSt�1)).
4 EU Banks�Stock Return Decomposition
Our model builds on Campbell and Shiller (1988) and Campbell (1991) who in-troduced the return decomposition based on the log-linear dynamic approxima-tion of the dividend-discount model. Vuolteenaho (2002) extends the Campbell-Shiller framework by incorporating accounting-based variables. In what follows,we apply that version of the dynamic dividend-discount model.We assume �rst that the price of a stock, measured by the log book-to-
market ratio �; can be expressed as a function of the excess log stock return, rt,the return on equity (RoE), et,the discount rate, �; the risk-free interest rate, f t;and the approximation error, �; that results from the Taylor-series expansion:
(1) �t�1 = �t�1 +
1Xj=0
�jrt+j �1Xj=0
�j(et+j � ft+j)
In the spirit of the original Campbell-Shiller model, the book-to-market ratiocan be low if future cash �ows (RoE) are high and/or if future excess stockreturns are low. Equation (1) allows the decompositon of the unexpected stockreturn into an expected retrun component and cash-�ow component. Takingthe change in expectations of (1) from t-1 to t and rearranging yields
(2) rt � Et�1rt = 4Et1Xj=0
�j(et+j � ft+j)�4Et1Xj=0
�jrt+j + �;
where 4Et denotes the change in expectations form t-1 to t. The two returncomponents can now be re-de�ned as cash �ow news (N cf ) and expected-returnnews (N r). We can then write
(3) Ncf;t � 4Et1Xj=0
�j(et+j � ft+j) + �; Nr;t � 4Et1Xj=0
�jrt+j :
13ECB
Working Paper Series No 677September 2006
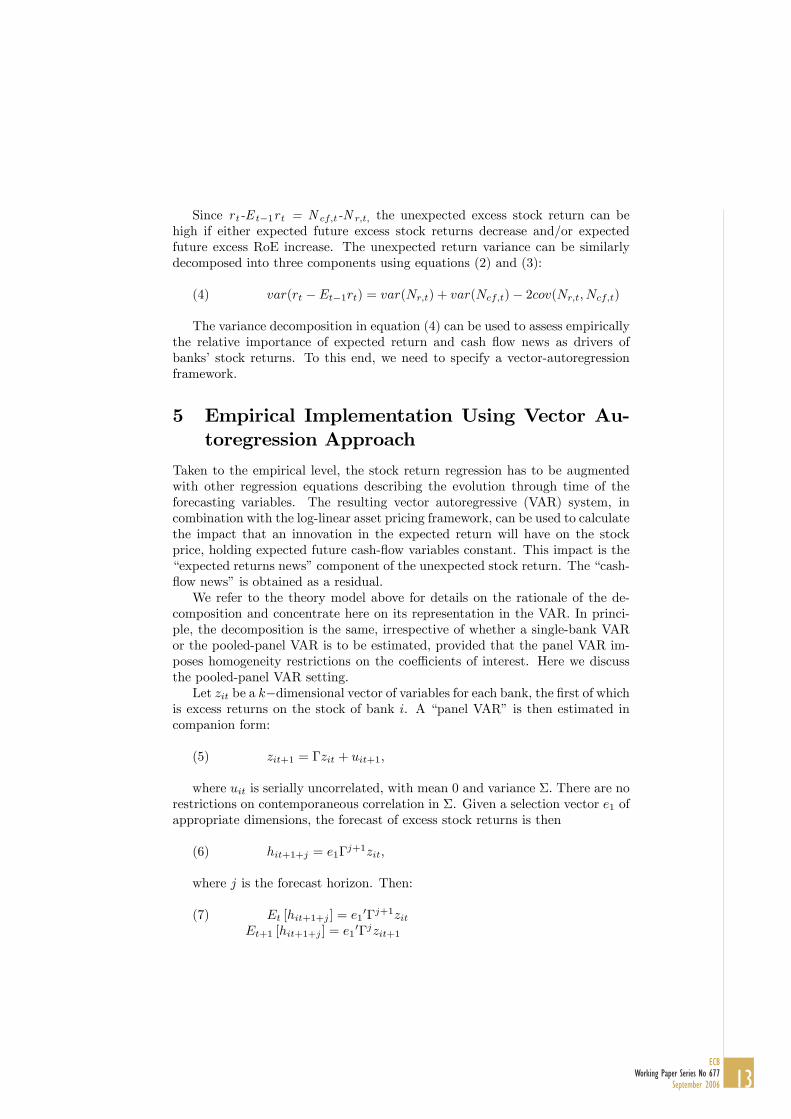
Since r t-E t�1r t = N cf;t-N r;t; the unexpected excess stock return can behigh if either expected future excess stock returns decrease and/or expectedfuture excess RoE increase. The unexpected return variance can be similarlydecomposed into three components using equations (2) and (3):
The variance decomposition in equation (4) can be used to assess empiricallythe relative importance of expected return and cash �ow news as drivers ofbanks�stock returns. To this end, we need to specify a vector-autoregressionframework.
5 Empirical Implementation Using Vector Au-toregression Approach
Taken to the empirical level, the stock return regression has to be augmentedwith other regression equations describing the evolution through time of theforecasting variables. The resulting vector autoregressive (VAR) system, incombination with the log-linear asset pricing framework, can be used to calculatethe impact that an innovation in the expected return will have on the stockprice, holding expected future cash-�ow variables constant. This impact is the�expected returns news�component of the unexpected stock return. The �cash-�ow news�is obtained as a residual.We refer to the theory model above for details on the rationale of the de-
composition and concentrate here on its representation in the VAR. In princi-ple, the decomposition is the same, irrespective of whether a single-bank VARor the pooled-panel VAR is to be estimated, provided that the panel VAR im-poses homogeneity restrictions on the coe¢ cients of interest. Here we discussthe pooled-panel VAR setting.Let zit be a k�dimensional vector of variables for each bank, the �rst of which
is excess returns on the stock of bank i. A �panel VAR� is then estimated incompanion form:
(5) zit+1 = �zit + uit+1;
where uit is serially uncorrelated, with mean 0 and variance �: There are norestrictions on contemporaneous correlation in �. Given a selection vector e1 ofappropriate dimensions, the forecast of excess stock returns is then
The discounted sum of forecast revisions of returns, assuming a discountfactor equal to one, is then given by
(9) (Et+1 � Et)P1
j=1 [hit+1+j ] = e01
P1j=1 �
juit+1:
If the eigenvalues of the companion matrix � are inside the unit circle, thenthe (discounted) sum of revisions in forecast returns is given by:
(10) N r;t = (Et+1 � Et)P1
j=1 [hit+1+j ]
= e01�(I � �)�1uit+1= �0uit+1;
where � = e01� (I � �)�1:
As shown above in equations 2 and 3, the unexpected return can be de-composed as the di¤erence between cash-�ow news (Ncf;t) and expected returnnews (Nr;t). In terms of the VAR parameterisation we then get:
(11) e01uit = Ncf;t �Nr;t:
The cash-�ow news component can be written simply as:
(12) N cf;t = e�1uit + N r;t
= e01(I + �(I � �)�1)uit:
To construct impulse response functions, we de�ne the innovation in cumu-lative expected future stock return changes k > 1 periods forward as:
(13) e01� (k)uit = e01
��� �k+1
�(I � �)�1 uit;
and the total impulse response as the shock itself plus the cumulative sumabove:
(14) e01(k)uit = e01 (I +�(k))uit
= e01
�I +
��� �k+1
�(I � �)�1
�uit:
15ECB
Working Paper Series No 677September 2006
Looking back at the return decomposition, we see that the in�nite-horizontotal impulse response is equal to the cash-�ow news, while the in�nite-horizoninnovation in cumulative expected changes equals the expected return news.For empirical purposes, we calculate the impulse response of returns to an
unexpected return, u1t; by setting the return shock (somewhat arbitrarily) tobe equal to 50 basis points while the other elements of the error vector areset equal to their conditional value given that u1t = 0:50: To calculate theimpulse response of returns to a 50 basis points cash-�ow shock the normalisedsum of squared errors from the VAR is minimised, subject to the constraint
that e01�I + � (I � �)�1
�uit = 0:50: Impulse responses of the other variables
included in the VAR to shocks in expected return news and cash-�ow news canbe derived similarly, using di¤erent selection vectors.
6 Results from the VAR analysis
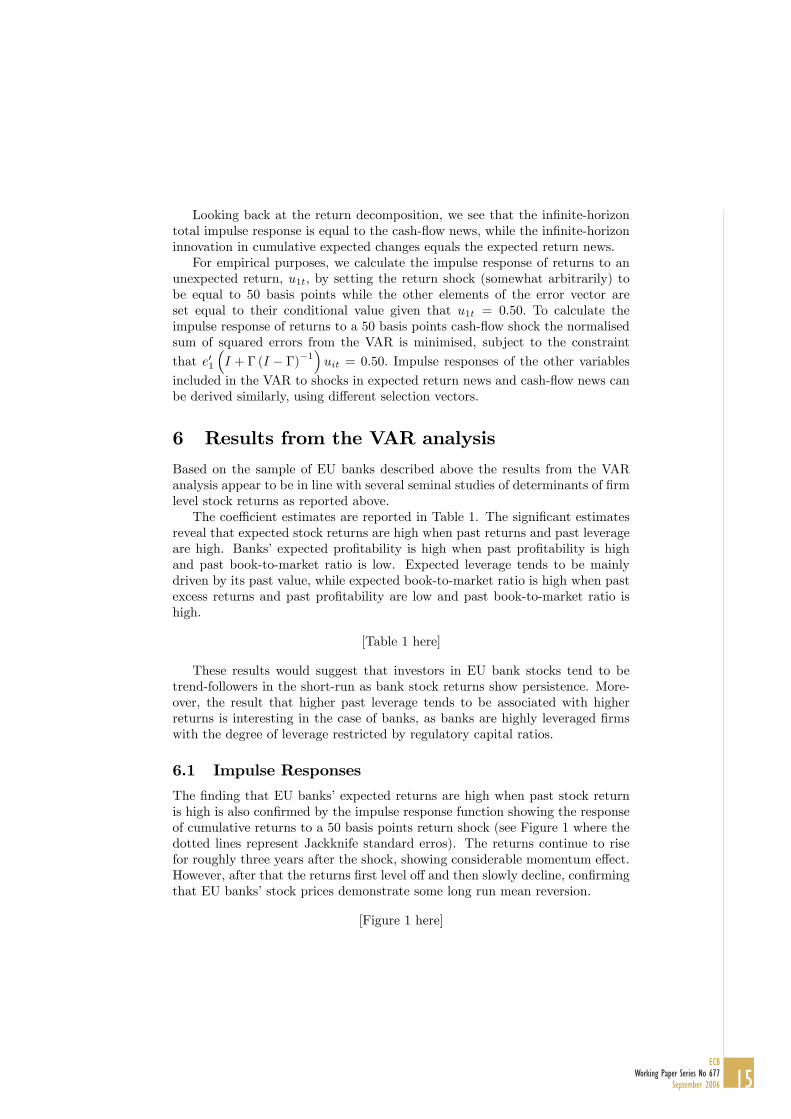
Based on the sample of EU banks described above the results from the VARanalysis appear to be in line with several seminal studies of determinants of �rmlevel stock returns as reported above.The coe¢ cient estimates are reported in Table 1. The signi�cant estimates
reveal that expected stock returns are high when past returns and past leverageare high. Banks�expected pro�tability is high when past pro�tability is highand past book-to-market ratio is low. Expected leverage tends to be mainlydriven by its past value, while expected book-to-market ratio is high when pastexcess returns and past pro�tability are low and past book-to-market ratio ishigh.
[Table 1 here]
These results would suggest that investors in EU bank stocks tend to betrend-followers in the short-run as bank stock returns show persistence. More-over, the result that higher past leverage tends to be associated with higherreturns is interesting in the case of banks, as banks are highly leveraged �rmswith the degree of leverage restricted by regulatory capital ratios.
6.1 Impulse Responses
The �nding that EU banks�expected returns are high when past stock returnis high is also con�rmed by the impulse response function showing the responseof cumulative returns to a 50 basis points return shock (see Figure 1 where thedotted lines represent Jackknife standard erros). The returns continue to risefor roughly three years after the shock, showing considerable momentum e¤ect.However, after that the returns �rst level o¤ and then slowly decline, con�rmingthat EU banks�stock prices demonstrate some long run mean reversion.
[Figure 1 here]
16ECBWorking Paper Series No 677September 2006
The second impulse response function plots the reaction of EU banks�stockreturns to a 50 basis points cash-�ow shock (see Figure 2). If expected returnswere constant, like in the static dividend-discount model, the shock would resultin exactly 50% increase in realised returns. Instead, the analysis based on thedynamic dividend-discount model reveals that the initial response is only 44%,increasing only gradually towards 50%. This suggests that investors initiallyunder-react to news, and that it could typically take the market up to severalyears to fully incorporate the positive fundamental shock into the stock prices.This is in line with the �ndings from US stock markets by Vuolteenaho (2002).
[Figure 2 here]
6.2 Variance Decomposition
The main focus of our analysis is, however, on the relative importance of cash�ow, or �rm-speci�c, versus expected return, or macro-level, news. The vari-ance decomposition resulting from the VAR model reveals that the cash-�ownews component is the main driving force of EU banks�stock returns. Indeed,the coe¢ cient of the bank-speci�c cash-�ow news component is more than tentimes larger than the coe¢ cient of the expected return news component (seeTable 2). Moreover, there is a relatively strong positive covariance between thetwo return news components. Previous literature has shown that this positiveinterrelation between the two return components in fact is the factor driving theobserved under-reaction by markets to the positive fundamental news. This isbecause part of the impact of cash �ow shocks to returns is o¤set by the instan-taneous opposite movement in the expected return component as prescribed bythe underlying theoretical model.
[Table 2 here]
It is possible that the results of the variance decomposition could di¤erdepending on bank size. The second and third columns of Table 2 con�rm thatthis indeed is the case for EU banks, although the outcome is somewhat di¤erentthan what has been reported for non-�nancial �rms. While both large and smallbanks are more substantially a¤ected by the cash �ow news component, the ratioof cash-�ow to expected return news is two times higher for small banks than forlarge banks. This suggests that the idiosyncratic, or bank-speci�c, componentcould actually be relatively more important for small banks.Why might the bank-speci�c component be relatively more dominant for
small rather than large listed EU banks? It could be that due to the morewidespread activities of large banks both across borders and across businesslines the market-wide information becomes more relevant for large banks, whilebank-speci�c information could still be perceived relatively more valuable forsmaller banks that are more specialised both geographically and regarding theirbusiness models. Small banks are also more often characterised by an ownershipstructure whereby the investors�portfolios are less diversi�ed. In such cases,
17ECB
Working Paper Series No 677September 2006
news that is more typically associated with bank-speci�c fundamentals couldhave a more profound impact on the banks�stock returns via investor reactions.Moreover, the typically less frequent disclosure of �nancial results by smallbanks could increase the relative role of published bank-speci�c information forthe determination of their stock prices. Finally, at times banks�stock returnsalso tend to be a¤ected by perceptions of future takeover activity, which istypically a bank speci�c factor. In so far as M&A activity among EU bankshas tended to be more, albeit by no means exclusively, concentrated amongthe smaller banks, it could also explain the relative sensitivity of these types ofbanks�stock returns to �rm-speci�c news.It may also be the case that the size split is picking up di¤erences in leverage
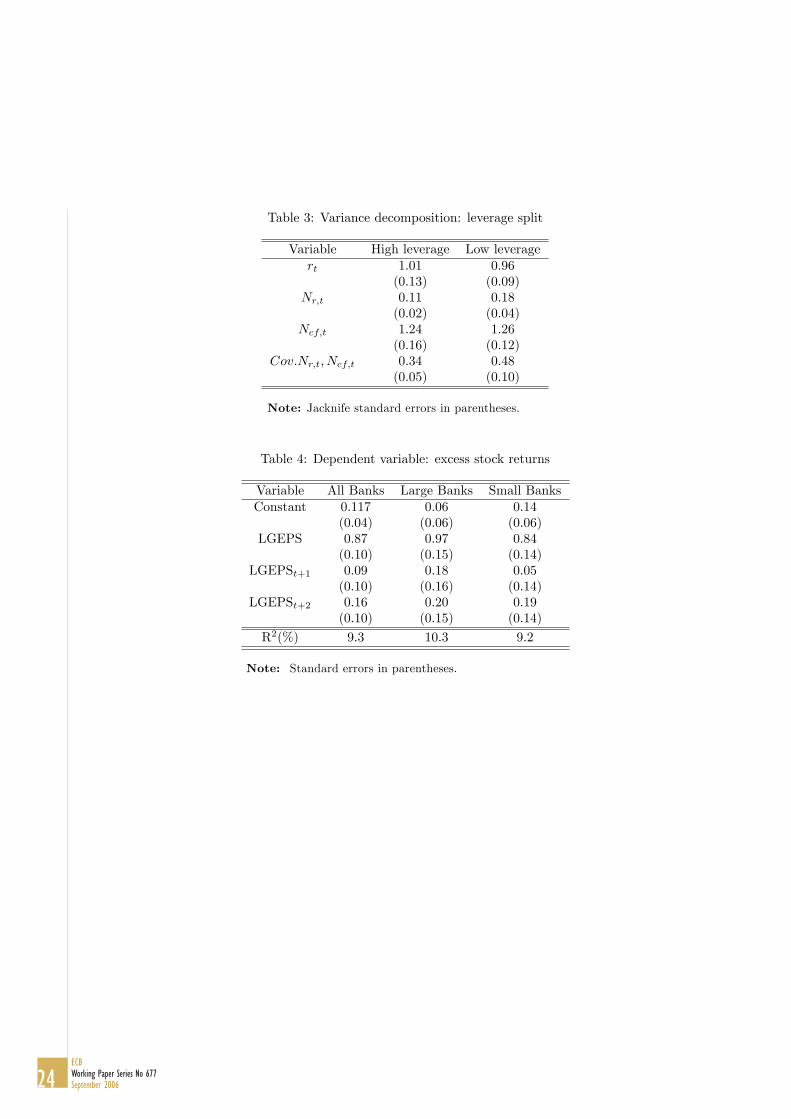
between big and small banks to the extent that size is positively correlated withleverage. To check for this e¤ect, we split the sample by the leverage into banksthat are more or less leveraged than the median value for the sample. Thevariance decomposition results for this split are reported in table 3.
[Table 3 here]
The results suggest that behaviour of both sub-samples (high/low leveragesplit) is broadly similar compared to the overall (no-split) sample. Cash �ownews remains the most important component for both high and low leveragebanks. Expected return news appears to be marginally less important for highleverage banks compared to low leverage banks.
7 Can cash-�ow proxies explain EU banks�stockreturns?
The decomposition of EU banks�stock returns to cash-�ow and expected returnnews yields several interesting results. However, from an analyst�s perspective,cash �ows must be measured using some observable variables that do not dependon a complex estimation of an approximated return generation process. Thequestion then arises to what extent such "cash-�ow proxies" actually can explainthe excess returns and whether the return decomposition procedure could shedsome light on that issue.In this section we revisit some of the results from earlier studies that are
based on the static version of the dividend-discount model. We recall that thestatic model treats the expected returns as constant, and therefore does notallow for a decomposition of the total returns to time varying news on cash�ows and future expected retruns. Based on the static approach, Fama (1990),Kothari and Shanken (1992) and Liew (1995) regress aggregate stock returns onvarious cash-�ow proxies. The relatively strong relationships that are unearthedin these regressions encourages the authors to argue that cash-�ow news are animportant source of observed return variation. In contrast, authors using modelsbased on accounting literature, such as Beaver, Lambert, and Morse (1980),
18ECBWorking Paper Series No 677September 2006
Easton and Harris (1991) and Collins, Kothari, Shanken, and Sloan (1994), �ndthat earnings variables typically explain only a small fraction of stock returnvariability. These studies typically conclude that the low explanatory powerstems from lack of timeliness or noisiness of the earnings data.However, as recently suggested by Hecht and Vuolteenaho (2006), the dy-
namic dividend-discount model allows for an investigation of whether the ex-planatory power of cash-�ow proxies actually arises from the correlation of theseproxies with one-period expected returns, cash-�ow news, or expected returnnews. More speci�cally, if expected return variation is responsible for the highexplanatory power of the aggregate regressions, this should not be interpretedas evidence of cash-�ow news driving the returns. Similarly, if expected returnnews is highly variable and positively correlated with cash-�ow news, the lowexplanatory power in regressions of �rm-level returns on earnings do not nec-essarily imply that earnings are a noisy measure of the cash-�ow generatingability of the �rm. Even in the case where earnings are a clear signal of cash�ow news, expected return e¤ects can blur the earnings-returns relation.Following Hecht and Vuolteenaho (2006), we use the bank level stock retrun
de-composition framework above to split the regression of total excess stockreturns on cash �ow proxies into three separate regressions, each correspondingto one component of return. We thus arrive at equations for total excess returnand its three aprroximate components:
(15) r t = Xt(�T )� + "tE t�1r t = Xt(�T )�Er + "Er;tN cf;t = Xt(�T )�Ncf
+ "Ncf ;t
N r;t = Xt(�T )��Nr+ "�Nr;t
The regressions using the full sample are then repeated for the two sizegroups of banks. The regressions as speci�ed in equation 15 explain returnswith cash-�ow proxies Xt(�T ); where �T denotes the information set at the endof the world allowing for the possibility that some of the variables may not beknown at the end of the return period. In particular, relative to r t, X t cancontain contemporaneous and future relationships.To illustrate the di¤erence that return decomposition can make compared
to the regressions based on the static dividend-discount model, we concentrateon a speci�cation by Collins, Kothari, Shanken, and Sloan (1994) who regressedthe total returns on contemporaneous and leads of future log earnings growthrate, de�ned as log(EPSt/EPSt�1). Using the full sample of EU banks, we �ndthat the regression of total excess returns on these explanatory variables yieldsan R2 of over 9% (see Table 4). However, when we regress the estimated cash-�ow news on the same earnings variables, we get a somewhat higher R2 of 12%(Table 6). The lower explanatory power for the total excess return varibaleis due to the fact that although the log earnings growth variables do track apart of the cash �ow news, they also track the negative of excpected return
19ECB
Working Paper Series No 677September 2006
news with R2 of 5% (see Table 7) and the level of expected returns with anR2 of 3.5% (see Table 5) Overall, the association of the earnings variables withboth cash-�ow and expected return news partially cancel each other, leaving theaggregate-return speci�cation with a lower explanatory power. These results arevery much in line with those obtained by Hecht and Vuolteenaho (2006) for alarge sample of US non-�nancial �rms, both qualitatively and quantitatively interms of the sizes of R2s.
[Tables 4-7 here]
How do these results vary with the size of banks? The remaining columns ofTables 4-7 illustrate the above regressions performed on the two subsamples oflarge and small listed EU banks. It turns out that for small banks, the earningsvariables are capable of explaining up to 14% of the cash-�ow news (Table 6last column). However, the fact that the earnings variables also explain 8% ofthe negative of the expected return news implies that the R2 from the equationwith total excess returns as left-hand side variable is lower than the R2 from thecash-�ow regression. For large banks, we get the opposite result as the earningsvariables we use as cash-�ow proxies show practically no relationship with eitherthe level of or the news on expected returns. Expected return componentsdo therefore not blur the relationship between cash-�ow proxies and cash-�ownews in the total excess return regression. Consequently, for large banks, theexplanatory power of the earnings variables is higher for the total excess returnsthan for the cash-�ow news component.The main contribution of this excercise is to con�rm that the success or
failure of cash-�ow proxy variables, such as contemporaneous and future logearnings growth, can be quite strongly dependent on the association of thesevariables with the various components of the banks�excess stock returns. More-over, the relationships between the various return components and the cash-�owproxies also vary with the size of the bank, as the ability of the log earningsgrowth variables to track cash-�ow news is stronger for small banks than for largebanks. We have therefore arrived at a conclusion that not only are cash-�ownews relatively more important in explaining smaller EU banks� total excessstock returns, but variables that are typically used to proxy such cash �owsseem also to be relatively more strongly associated with the actual cash-�ownews component in the case of smaller rather than larger EU banks.
8 Conclusions
This paper combined the dynamic dividend-discount model with an accounting-based bank-level vector autoregression framework to analyse the driving forcesof EU banks�stock returns. It was found that while in the short term expectedreturns are mainly driven by the momentum of past returns and past leverage,over longer term returns show some mean reversion to shocks. At the same
20ECBWorking Paper Series No 677September 2006
time, the positive covariance between the return news components shows thatthe market tends to initially underreact to positive news on bank-speci�c funda-mentals and only gradually incorporate such information into the prices. Suchcash-�ow news is, however, found to be the main driving force of bank levelstock returns. Finally, we found that the cash-�ow news component is rela-tively more important for small banks than for large banks, and that for smallerbanks variables typically used as cash-�ow proxies are better able to track thecash-�ow news component of total excess returns. Several explanations can beidenti�ed to account for these results, with the key implication that movementsin large banks�stock prices are likely to be more prone to market-wide shocksthat are realised through the stock market.
21ECB
Working Paper Series No 677September 2006
References
Baele, L., R. V. Vennet, and A. V. Landschoot (2005): �Bank RiskStrategies and Cyclical Variation in Bank Stock Returns,�Discussion paper,University of Ghent.
Banz, R. W. (1981): �The Relationship Between Return and Market Value ofCommon Stocks,�Journal of Financial Economics, 9, 3�18.
Beaver, W. R., R. Lambert, and D. R. Morse (1980): �The InformationContent of Securities Prices,�Journal of Accounting and Economics, 2, 3�28.
Bhandari, L. C. (1988): �Debt-equity Ratio and Expected Common StockReturns,�Economic Journal, 43, 507�528.
Bondt, W. F. D., and R. H. Thaler (1985): �Does the Stock Market Over-react?,�Journal of Finance, 40, 557�581.
Brewer, E., W. E. Jackson, and J. T. Moser (1996): �Alligators in theswamp: the impact of derivatives on the �nancial performance of depositoryinstitutions,�Journal of Money, Credit, and Banking, 28(3), 482�497.
Campbell, J. Y. (1991): �A Variance Decomposition for Stock Returns,�Economic Journal, 101(127), 157�79.
Campbell, J. Y., and R. Shiller (1988): �The Dividend-Price Ratio andExpectations of Future Dividends and Discount Factors,�Review of FinancialStudies, 1, 195�227.
Cohen, R. B., P. A. Gompers, and T. Vuolteenaho (2002): �Who Un-derreacts to Cash-Flow News? Evidence from Trading Between Individualsand Institutions,�Journal of Financial Economics, 66, 409�462.
Collins, D. W., S. Kothari, J. Shanken, and R. G. Sloan (1994): �Lackof Timeliness versus Noise as Explanations for Low Contemporaneous Return-Earnings Association,�Journal of Accounting and Economics, 18, 289�324.
Cooper, M. J., W. E. Jackson, and G. A. Patterson (2003): �Evidenceof Predictability in the Cross-Section of Bank Stock Returns,� Journal ofBanking and Finance, 27, 817�850.
Curry, T. J., P. J. Elmer, and G. S. Fissel (2001): �Regulator use ofmarket data to improve identi�cation of bank �nancial distress,� WorkingPaper 01, FDIC.
Easton, P., and T. Harris (1991): �Earnings as an Explanatory Variable forReturns,�Journal of Accounting Research, 29, 19�26.
Fama, E. F. (1990): �Stock Returns, Expected Returns, and Real Activity,�Journal of Finance, 45, 1089�1108.
22ECBWorking Paper Series No 677September 2006
Gropp, R., and J. Vesala (2004): �Deposit Insurance, Moral Hazard, andMarket Monitoring,�Review of Finance, 8(4).
Gropp, R., J. Vesala, and G. Vulpes (2006): �Equity and Bond MarketSignals as Leading Indicators of Bank Fragility,� Journal of Money, Credit,and Banking, 38(2), 399�428.
Haugen, R. A., and N. L. Baker (1996): �Commonality in the Determinantsof Expected Stock Returns,�Journal of Financial Economics, 41, 401�439.
Hecht, P., and T. Vuolteenaho (2006): �Explaining Returns with Cash-Flow Proxies,�Review of Financial Studies, 19(1), 159�194.
Jegadeesh, N., and S. Titman (2001): �Pro�tability of Momentum Strate-gies: An Evaluation of Alternative Explanations,�Journal of Finance, 56(2),699�720.
Kothari, S., and J. Shanken (1992): �Stock Return Variation and ExpectedDividends: A Time Series and Cross-Sectional Analysis,�Journal of FinancialEconomics, 31, 177�210.
Liew, J. M. (1995): �Global Stock Returns, Money, and In�ation,� Ph.D.thesis, University of Chicago, Graduate School of Business, Dissertation.
Rouwenhorst, K. G. (1998): �International Momentum Strategies,�Journalof Finance, 53(1), 267�284.
Vennet, R. V., O. de Jonghe, and L. Baele (2004): �Bank Risks and theBusiness Cycle,�Working Paper 264, University of Ghent.
Note: The dotted lines show confidence bands representing Jackknife standard errors.
27ECB
Working Paper Series No 677September 2006
European Central Bank Working Paper Series
For a complete list of Working Papers published by the ECB, please visit the ECB’s website(http://www.ecb.int)
635 “Identifying the role of labor markets for monetary policy in an estimated DSGE model” byK. Christoffel, K. Kuester and T. Linzert, June 2006.
636 “Exchange rate stabilization in developed and underdeveloped capital markets” by V. Chmelarovaand G. Schnabl, June 2006.
637 “Transparency, expectations, and forecasts” by A. Bauer, R. Eisenbeis, D. Waggoner and T. Zha,June 2006.
638 “Detecting and predicting forecast breakdowns” by R. Giacomini and B. Rossi, June 2006.
639 “Optimal monetary policy with uncertainty about financial frictions” by R. Moessner, June 2006.
640 “Employment stickiness in small manufacturing firms” by P. Vermeulen, June 2006.
641 “A factor risk model with reference returns for the US dollar and Japanese yen bond markets”by C. Bernadell, J. Coche and K. Nyholm, June 2006.
642 “Financing constraints and firms’ cash policy in the euro area” by R. Pál, A. Ferrando, June 2006.
643 “Inflation forecast-based-rules and indeterminacy: a puzzle and a resolution” by P. Levine,P. McAdam and J. Pearlman, June 2006.
644 “Adaptive learning, persistence, and optimal monetary policy” by V. Gaspar, F. Smets andD. Vestin, June 2006.
645 “Are internet prices sticky?” by P. Lünnemann and L. Wintr, June 2006.
646 “The Dutch block of the ESCB multi-country model” by E. Angelini, F. Boissay and M. Ciccarelli,June 2006.
647 “The economic effects of exogenous fiscal shocks in Spain: a SVAR approach”by F. de Castro Fernández and P. Hernández de Cos, June 2006.
648 “Firm-specific production factors in a DSGE model with Taylor price setting” by G. de Walque,F. Smets and R. Wouters, June 2006.
649 “Monetary and fiscal policy interactions in a New Keynesian model with capital accumulation andnon-Ricardian consumers” by C. Leith and L. von Thadden, June 2006.
650 “A structural break in the effects of Japanese foreign exchange intervention on Yen/Dollarexchange rate volatility” by E. Hillebrand and G. Schnabl, June 2006.
28ECBWorking Paper Series No 677September 2006
651 “On the determinants of external imbalances and net international portfolio flows: a globalperspective” by R. A. De Santis and M. Lührmann, July 2006.
652 “Consumer price adjustment under the microscope: Germany in a period of low inflation” byJ. Hoffmann and J.-R. Kurz-Kim, July 2006.
653 “Acquisition versus greenfield: the impact of the mode of foreign bank entry on information andbank lending rates” by S. Claeys and C. Hainz, July 2006.
654 “The German block of the ESCB multi-country model” by I. Vetlov and T. Warmedinger,July 2006.
655 “Fiscal and monetary policy in the enlarged European Union” by S. Pogorelec, July 2006.
656 “Public debt and long-term interest rates: the case of Germany, Italy and the USA” by P. Paesani,R. Strauch and M. Kremer, July 2006.
657 “The impact of ECB monetary policy decisions and communication on the yield curve” byC. Brand, D. Buncic and J. Turunen, July 2006.
658 “The response of firms‘ investment and financing to adverse cash flow shocks: the role of bankrelationships” by C. Fuss and P. Vermeulen, July 2006.
659 “Monetary policy rules in the pre-EMU era: Is there a common rule?” by M. Eleftheriou,D. Gerdesmeier and B. Roffia, July 2006.
660 “The Italian block of the ESCB multi-country model” by E. Angelini, A. D’Agostino andP. McAdam, July 2006.
661 “Fiscal policy in a monetary economy with capital and finite lifetime” by B. Annicchiarico,N. Giammarioli and A. Piergallini, July 2006.
662 “Cross-border bank contagion in Europe” by R. Gropp, M. Lo Duca and J. Vesala, July 2006.
663 “Monetary Conservatism and Fiscal Policy” by K. Adam and R. M. Billi, July 2006.
664 “Fiscal convergence before entering the EMU” by L. Onorante, July 2006.
665 “The euro as invoicing currency in international trade” by A. Kamps, August 2006.
666 “Quantifying the impact of structural reforms” by E. Ernst, G. Gong, W. Semmler andL. Bukeviciute, August 2006.
667 “The behaviour of the real exchange rate: evidence from regression quantiles” by K. Nikolaou,August 2006.
668 “Declining valuations and equilibrium bidding in central bank refinancing operations” byC. Ewerhart, N. Cassola and N. Valla, August 2006.
669 “Regular adjustment: theory and evidence” by J. D. Konieczny and F. Rumler, August 2006.
ECBWorking Paper Series No 677
September 2006 29
670 “The importance of being mature: the effect of demographic maturation on global per-capitaGDP” by R. Gómez and P. Hernández de Cos, August 2006.
671 “Business cycle synchronisation in East Asia” by F. Moneta and R. Rüffer, August 2006.
672 “Understanding inflation persistence: a comparison of different models” by H. Dixon and E. Kara,September 2006.
673 “Optimal monetary policy in the generalized Taylor economy” by E. Kara, September 2006.
674 “A quasi maximum likelihood approach for large approximate dynamic factor models” by C. Doz,D. Giannone and L. Reichlin, September 2006.
675 “Expansionary fiscal consolidations in Europe: new evidence” by A. Afonso, September 2006.
676 “The distribution of contract durations across firms: a unified framework for understanding andcomparing dynamic wage and price setting models” by H. Dixon, September 2006.
677 “What drives EU banks’ stock returns? Bank-level evidence using the dynamic dividend-discountmodel” by O. Castrén, T. Fitzpatrick and M. Sydow, September 2006.