What have we learned from European Economic Integration? University of Sussex , 16-17 July 2007. Where next on the Single Market? Adriaan Dierx Fabienne Ilzkovitz European Commission European Commission and Université Libre de Bruxelles. Where next on the Single Market?. - PowerPoint PPT Presentation
57
DG ECFIN 1 What have we learned from What have we learned from European Economic Integration? European Economic Integration? University of Sussex University of Sussex , 16-17 July , 16-17 July 2007 2007 Where next on the Single Market? Where next on the Single Market? Adriaan Dierx Fabienne Ilzkovitz Adriaan Dierx Fabienne Ilzkovitz European Commission European Commission and European Commission European Commission and Université Libre de Bruxelles Université Libre de Bruxelles
Transcript
DG ECFIN
1
What have we learned from What have we learned from European Economic Integration?European Economic Integration?
University of Sussex University of Sussex, 16-17 July 2007, 16-17 July 2007
Where next on the Single Market?Where next on the Single Market?
Adriaan Dierx Fabienne IlzkovitzAdriaan Dierx Fabienne IlzkovitzEuropean Commission European Commission andEuropean Commission European Commission and
Université Libre de Bruxelles Université Libre de Bruxelles
DG ECFIN
2
Where next on the Single Market?
1. The latest empirical evidence on the economic impact of the Single Market
2. The Single Market Review
3. Market monitoring as a tool to improve the governance of the Single Market
DG ECFIN
3
Where next on the Single Market?
1. The latest empirical evidence on the economic impact of the Single Market (DG ECFIN Economic Paper nr. 271 http://ec.europa.eu/economy_finance/publications/economic_papers/2007/economicpapers271_en.htm
)
2. The Single Market Review
3. Market monitoring as a tool to improve the governance of the Single Market
DG ECFIN
4
Why an Internal Market?The Cecchini Report
Source: European Commission - Cecchini Report (1988)If not indicated data refer to the year 1985
European Union
22%
48%
30%
Sectors with high growthpotential
Sectors with moderate growthpotential
Sectors with weak growthpotential
United States
27%
48%
25%
Sectors with high growthpotential
Sectors with moderate growthpotential
Sectors with weak growthpotential
Productivity (US = 100)
0
50
100
Sectors with high growthpotential
Sectors with moderategrowth potential
Sectors with weak growthpotential
Market share losses in high-technology products(1980-1984)
-14-12-10-8-6-4-202
Che
mic
al p
rodu
cts
Indu
stria
lm
achi
nes
elec
tric
alm
achi
nes
prec
isio
nin
stru
men
ts
phar
mac
eutic
alpr
oduc
ts
tele
com
mun
icat
ion
equi
pmen
t
elec
tron
ical
equi
pmen
tCh
ang
e o
f EU
sh
are
in
wor
ld e
xpo
rts
DG ECFIN
5
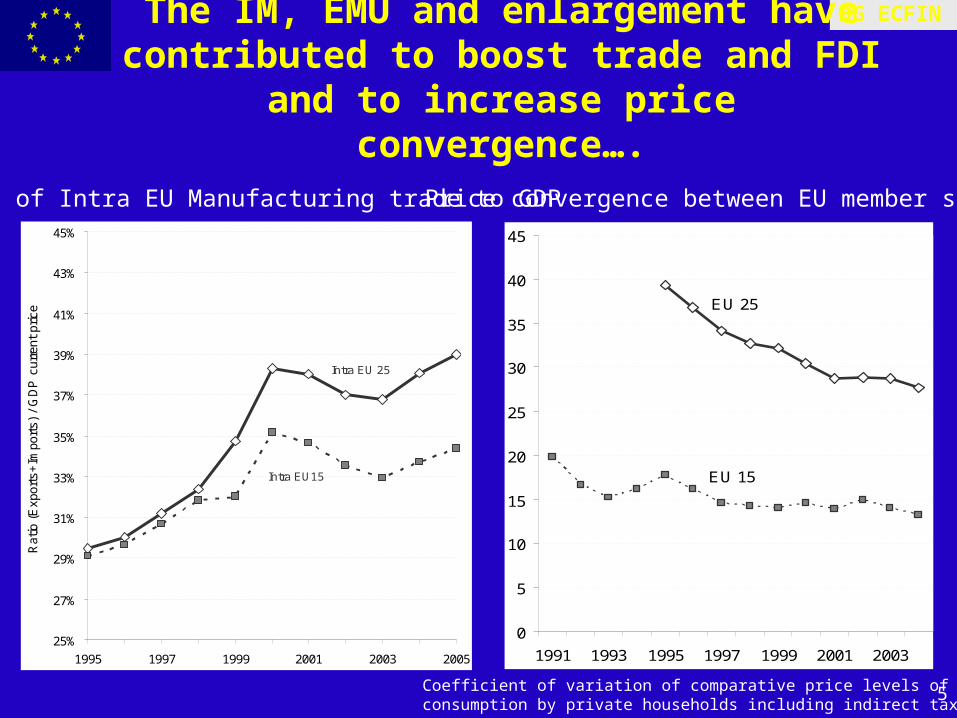
The IM, EMU and enlargement have contributed to boost trade and FDI and to
increase price convergence….Ratio of Intra EU Manufacturing trade to GDP Price convergence between EU member states
Coefficient of variation of comparative price levels of final consumption by private households including indirect taxes
Intra EU 25
Intra EU15
25%
27%
29%
31%
33%
35%
37%
39%
41%
43%
45%
1995 1997 1999 2001 2003 2005
Rat
io (
Exp
orts
+Im
port
s) /
GD
P c
urre
nt p
rices EU 25
EU 15
0
5
10
15
20
25
30
35
40
45
1991 1993 1995 1997 1999 2001 2003
DG ECFIN
6
20.219.0
33.0
0
5
10
15
20
25
30
35
EU25 euro area United States0.00
0.05
0.10
0.15
0.20
0.25
1990 1992 1994 1996 1998 2000
All Europe
U.S.
But the EU remains a less integrated market than the US
Lower degree of price dispersion for tradeables between main US cities than that between EU capitals
Lower degree of trade integration in the EU than in the US
Intra-trade in manufactured products 2002
(intra exports as a percentage of GDP)
CPI-weighted
Price dispersion in tradeables
DG ECFIN
7
The Internal Market has contributed to improve the business environment
More competition mark-ups in sectors more affected by NTB– Turbulence in market leadership
Increased size and multinationality of firms
0 1 2 3 4 5 6 7
Firm Size (€ bn)
Number of EUcountries
1987
1993
1997
2000
Multinationality and firm size
DG ECFIN
8
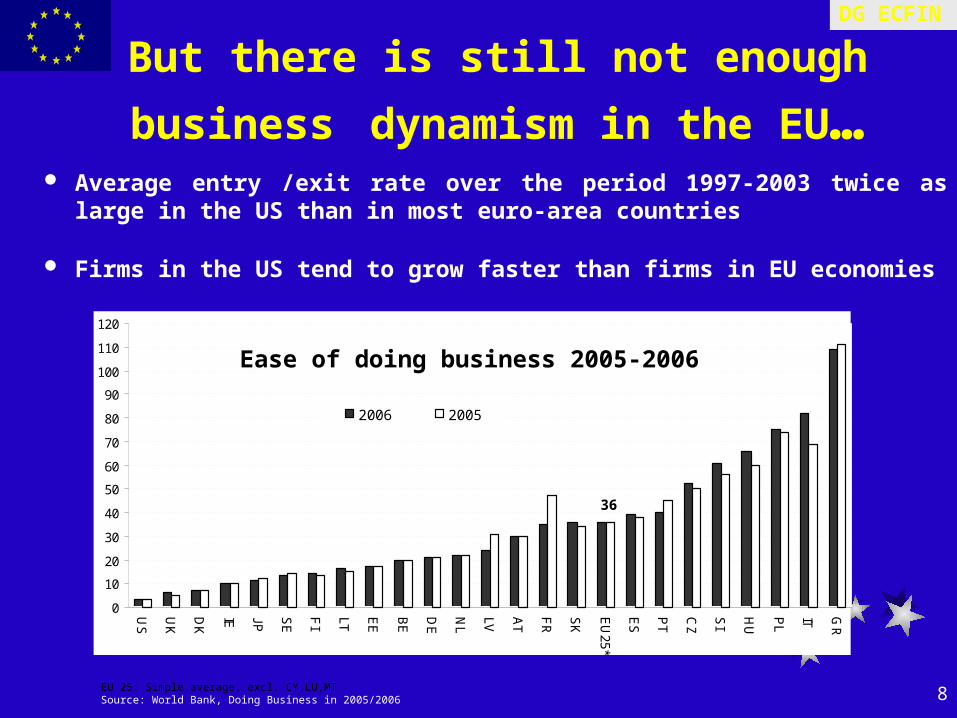
But there is still not enough business dynamism in the EU…
Average entry /exit rate over the period 1997-2003 twice as large in the US than in most euro-area countries
Firms in the US tend to grow faster than firms in EU economies
36
0
10
20
30
40
50
60
70
80
90
100
110
120
US
UK
DK
IE JP SE
FI
LT EE
BE
DE
NL
LV AT
FR
SK
EU
25*
ES
PT
CZ
SI
HU
PL
IT GR
2006 2005
EU 25: Simple average, excl. CY,LU,MTSource: World Bank, Doing Business in 2005/2006
Ease of doing business 2005-2006
DG ECFIN
9
Main Productivity Developments in the EU and the US
Total hours worked GDP Average % change previous year
EU15 US EU15 US EU15 US 1974-1984 3.1 1.3 -0.9 1.5 2.1 2.7
1985-1995 2.2 1.4 0.3 1.7 2.4 2.9
1996-2006 1.6 2.1 1.1 1.4 2.5 3.3
DG ECFIN
10
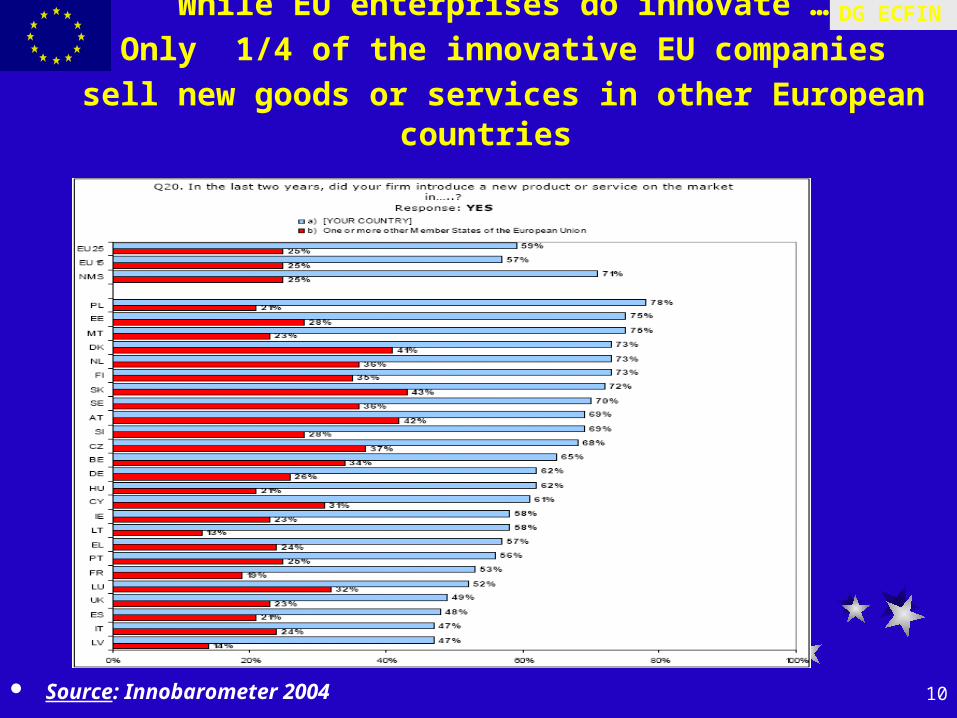
While EU enterprises do innovate …
Only 1/4 of the innovative EU companies sell new goods or services in other European countries
Source: Innobarometer 2004
DG ECFIN
11
World export market shares by skill intensity of sectors (%)
High Technology
ICTMedium
TechnologyLow
Technology
1998-20031998-2003
1998-2003 1998-2003
EU15 (Extra)
13.1 10.4 37.2 14.0
EU10 0.8 1.0 4.3 2.6
US 19.9 16.6 23.8 8.4
Japan 11.8 12.8 18.2 1.6
China 2.8 3.0 4.5 7.4
The Internal Market has not sufficiently promoted a shift towards the faster growing high tech sectors
DG ECFIN
12
Potential of the Internal Market not yet fully exploited
1. Problems with implementation of IM rules
2. Some of the instruments are not fully adequate
3. Remaining barriers Services Fiscal barriers
4. Barriers to the diffusion of knowledge (IPRs)
Macro-economic gains of the Internal Market
could be doubled
DG ECFIN
13
Estimated gains from the Single Market (as a percentage of GDP)
Already achieved: +2.2% in 2006
Potential for further benefits
1. Services Directive (0.5-1%)
2. Financial integration (1.1%)
3. Liberalisation of energy sector (0.8%)
4. Corporate tax harmonisation (0.2%)
DG ECFIN
14
Where next on the Single Market?
1. The latest empirical evidence on the economic impact of the Single Market
2. The Single Market Review
3. Market monitoring as a tool to improve the governance of the Single Market
DG ECFIN
15
Single Market Review
Process
– March 2007: Interim report (vision paper)
– Autumn 2007: Final report by Commission
– Spring 2008: Decision by European Council
Main elements
– Concrete policy actions
– Improved governance
DG ECFIN
16
Concrete policy actions aimed at creating a Single Market :
Citizens and consumers Increase the benefits for consumers
An integrated economy Develop synergies between the SM and EMU
Knowledge society Encourage use and diffusion of new technologies
A well regulated SM Make the environment more business-friendly
A sustainable Europe Accompany the SM with social and environmental policies
Open to the world Make Europe attractive to foreign investors and export our rules and standard at world level
DG ECFIN
17
Improved governance aimed at:
More decentralised and network-based
More responsive to the global context
Improving the communication
More impact-driven and result oriented policies based on a better understanding of markets
DG ECFIN
18
Improved governance aimed at more impact-driven and result
oriented policies
Act where it will have a maximum impact
Act when market do not deliver
Assess consequences of policy interventions
Identify synergies between policy instruments
Proposal for market monitoring
DG ECFIN
19
Where next on the Single Market?
1. The latest empirical evidence on the economic impact of the Single Market
2. The Single Market Review
3. Market monitoring as a tool to improve the governance of the Single Market
DG ECFIN
20
Proposed two-stage approach
A. Sectoral screening on basis of readily available indicators
B. In-depth investigation of market(s) in selected sectors
Why?Market monitoring is very time and
resource intensive
DG ECFIN
21
Criteria for sectoral screening1. Economic importance of the sector
2. Importance of the sector for the adjustment capacity of the EU economy
3. Signs of market malfunctioning from the perspective of businesses and consumers
DG ECFIN
22
1. Economic importance of the sector
Static perspective Sector share in total EU25 value added in
2004
Sector share in total EU25 employment in 2004
Dynamic perspective Sector average annual world export
growth in 1999-2005
DG ECFIN
23
Manufacturing and tradable services % total % total World
value added employment export growth
Food and beverages 15 1,86 2,25 7,3
Chemicals 24 1,94 1,67 12,2
Rubber and plastics 25 0,99 0,61 8,2
Basic metals 27 0,73 0,83 12
Fabricated metal 28 1,82 1,58 8
Machinery 29 2,08 0,97 8
Electrical machinery and apparatus, nec 31 0,9 0,6 7,5
Radio, television and comm. equip. 32 0,52 0,31 8,5
Medical, precision and optical instruments 33 0,57 0,18 10,6
Motor vehicles 34 1,42 1,13 7,5
Electricity, gas and water supply E 2,17 0,59 20,8
Other business activities 74 6,97 13,09 7,2
Other service activities 93 0,72 1,28 70,7
DG ECFIN
24
Non tradeable services% total
value added% total
employment
Construction F 6,17 5,66
Sale, maint. and repair of motor vehicles 50 1,71 1,83
Wholesale trade 51 3,61 5,15
Retail trade 52 4,31 7,21
Hotels and restaurants H 2,21 3,46
Other inland transport 60 2,64 3,09
Other supp. and aux. transport activities… 63 1,76 1,81
Post and telecommunications 64 2,37 1,93
Financial intermediation 65 4,11 1,91
Insurance and pension funding 66 1 0,6
TOTAL SELECTED SECTORS 52,58 57,74
DG ECFIN
25
2. Importance of the sector for adjustment
Strong interlinkages with rest of the economy
Adoption and diffusion of new technologies
Transmission of price shocks (especially relevant for adjustment within the euro area)
DG ECFIN
26
2. Importance of the sector for adjustment
Interlinkages with the rest of the economy
Symmetric input-output table for the EU27 for the year 2000
Backward multipliers and forward multipliers (suppliers of essential inputs)
Identification of KEY SECTORS
DG ECFIN
27
FORWARD ORIENTEDNO RELEVANT FORWARD
EFFECTS
BACKWARD ORIENTED
Key sectors with widely spread effects
Key sectors but with forward effects concentrated
Backward oriented sectors with widely spread effects
Key sectors but with backward
effects concentrated
Key sectors without widely spread effects
Backward oriented sectors without widely spread effects
NO RELEVANT BACKWARD
EFFECTS
Forward oriented sectors with widely spread effects
Forward oriented sectors without widely spread effects
Sectors with weak interlinkages with rest of economy
DG ECFIN
28
FORWARD ORIENTED NO RELEVANT FORWARD EFFECTS
BACKWARD ORIENTED
24, F, 51 15, 29, 34, 50, H, 66
52, 92
NO RELEVANT BACKWARD
EFFECTS
20, 21, 22, 25, 27, 28, 37, E, 60, 63,
64, 65, 67, 71, 72
26, 7416, 17, 18, 19, 23, 30,
31, 32, 33, 35, 36, 41, 61, 62, 73, 90, 91, 93
DG ECFIN
29
Key sectors (forward and backward oriented)
24 - Chemicals and chemical products 51 - Wholesale trade 52 - Retail trade F - Construction 92 - Recreational, cultural and sporting activities
DG ECFIN
30
Forward oriented sectors
20 - Wood and cork 21 - Pulp and paper 22 - Printing, 25 - Rubber and plastics 26 - Other non-metallic mineral 27 - Basic metals 28 - Fabricated metal 37 - Recycling E - Electricity, gas and water supply 60 - Other Inland transport 63 - Other supporting and auxiliary transport activities 64 - Post and telecommunications 65 - Financial intermediation, 67 - Activities related to financial intermediation 71 - Renting of machinery and equipment 72 - Computer and related activities 74 - Other business activities
DG ECFIN
31
Backward oriented sectors
15 - Food and beverages 29 - Machinery 34 - Motor vehicles 50 - Sale, maint. and repair of motor vehicles H - Hotels and restaurants 66 - Insurance and pension funding
DG ECFIN
32
Adoption and diffusion of new technologies
• Focus on ICT- related sectors, given that ICT has become a “general purpose technology”, i.e. a technology that is increasingly used in all activities and all sectors of the economy.
• ICT diffusion also leads to important positive spillover on market functioning and performance in other sectors, namely by allowing firms to improve their productive efficiency and their ability to respond to changing market conditions.
2. Importance of the sector for adjustment
DG ECFIN
33
ICT- related sectors Industry categorisation provided by the Groningen's Growth and
Development Centre
ICT - producing
30 - Office, accounting and computing machinery 31 - Electrical machinery and apparatus, nec 32 - Radio, television and communication equipment 33 - Medical, precision and optical instruments 64 - Post and telecommunications
DG ECFIN
34
ICT- users
18 - Wearing apparel 22 - Printing and publishing 29 - Machinery 35 - Other transport equipment 36t37 - Manufacturing nec 51 - Wholesale trade 52 - Retail trade 65 - Financial intermediation 66 - Insurance and pension funding 67 - Activities related to financial intermediation 71 - Renting of machinery and equipment 72 - Computer and related activities 73 - Research and development 74 - Other business activities
DG ECFIN
35
DATA Evidence on price stickiness
OBJECTIVE
Identification of bottlenecks for transmission of price adjustment
WHY?
Necessary for the reallocation of factors and in particular for the functioning of the competitiveness channel within the euro area (given the absence of
independent monetary and exchange rate policies)
2. Importance of the sector for price adjustment
DG ECFIN
36
Sectors with some evidence of sticky prices 17 - Textiles 18 - Wearing apparel 28 - Fabricated metals 50 - Sale, maintenance and repair of motor vehicles 52 - Retail trade 92 - Recreational, cultural and sporting activities H - Hotels and restaurants 93 Other service activities
Sectors with more flexible prices 15 - Food and beverages 23 - Coke, refined petroleum 24 - Chemicals 30 - Office, accounting and computing machinery 32 - Radio, television and communication equipment
DG ECFIN
37
3. Signs of market malfunctioning
Economic efficiency– Labour productivity growth
Consumer and business satisfaction
Scope for policy intervention based on first analysis of causes of market malfunctioning:– Integration/openness– Competition– Innovation– Regulation
DG ECFIN
38
3. Signs of market malfunctioning
From the point of view of economic efficiency
Labour productivity growth (gross value added per hour worked)
- period 1995-2004
- benchmark: US
DG ECFIN
39
-11,1460
26
34
2527
29
51
28
36t37
63
73
7466 15
91
H74
23
22
60 20
32
24E
52
61
66
92
1819
F
21
24 64
72
90
17
E
16
63
30t33
31
-100
-50
0
50
100
150
200
250
300
350
-100 -50 0 50 100 150 200 250 300 350
EU 25
US
US outperforms the EU in most sectors in terms of labour productivity
DG ECFIN
40
Labour productivity performance (growth during period 1995-2004 in %)
EU25 US
17 - Textiles 22,9 94,9
18 - Wearing apparel 13,9 82,2
19 - Leather and footwear 6,1 81,3
21 - Pulp and paper 32,4 75,8
22 - Printing and publishing 14,3 29,7
25 - Rubber and plastics 32,3 58,4
26 - Other non-metallic mineral 33,5 38,8
27 - Basic metals 28,9 55,6
28 - Fabricated metal 19,3 41,3
29 - Machinery 25,1 48,9
30t33 - Electrical and optical equipment 64,2 268,9
31 - Electrical machinery and apparatus, nec 24,7 219,7
32 - Radio, television and communication equipment 154,2 312,8
34 - Motor vehicles 26,7 88,4
35 - Other transport equipment 35,8 36,9
36t37 - Manufacturing, nec ; Recycling 10,1 51,4
DG ECFIN
41
Labour productivity performance (growth during period 1995-2004 in %)
EU25 US
50 - Sale, maint. and repair of motor vehicles 7,2 75,5
51 - Wholesale trade 27,2 52,8
52 - Retail trade 14,6 58,1
H – Hotels and restaurants -1,3 11,8
62 - Other air transport 6,6 57,9
63 - Other supporting and auxiliary transport activities -2 42,2
65 - Financial intermediation 46,7 69,4
66 - Insurance and pension funding -13,4 10,3
73 - Research and development -1,6 46,4
74 - Other business activities -7,7 17,1
90 - Sewage and refuse disposal -5,1 37,6
92 - Recreational, cultural and sporting activities 4,3 21,7
93 - Other service activities -11,1 11,8
DG ECFIN
42
Performance gap in terms of L- productivity vis-à-vis the US
-50,00
0,00
50,00
100,00
150,00
200,00
250,00
300,00
350,00
17
18
19
21
22
25
26
27
28
29
30t3
3
31
32
34
35
36t3
7
50
51
52
H 62
63
65
66
73
74
O 90
92
93
EU25
US
DG ECFIN
43
From the point of view of consumers and businesses satisfaction
2006 Consumer Satisfaction Survey
DG MARKT 2006 Public Consultation on future Single Market policy
DG ECFIN
44
AVERAGE SATISFACTION SCORE BY SERVICE
SECTORS AVERAGE SCORESAir Transport 7.69
Mobile Telephony 7.91
Insurance Services 7.92
Retail Banking 7.82
Water Distribution 7.73
Gas Supply 7.64
Electricity Supply 7.61
Postal Services 7.42
Fixed Telephony 7.3
Extra-urban Transport 7.05
Urban Transport 7.04
DG ECFIN
45
Selected sectors on the basis of economic importance, contribution to adjustment and
productivity performance
29 - Machinery
51 - Wholesale trade 52 - Retail trade 65 - Financial intermediation 66 - Insurance and pension funding 74 - Other business activities
DG ECFIN
46
SECTORS
Contribution to EU25
employment
Contribution to EU25 value added
EU25
Productivity growth
1995-2004Interlinkages (1) ICT (2)
29 - Machinery 1% 2.1% 25,1% B U
51 - Wholesale trade 5.2% 3.6% 27,2% B/F U
52 - Retail trade 7.2% 4.3% 14,6% B/F U
65 - Financial intermediation
1.9% 4.1% 46,7% F U
66 - Insurance 0.6% 1% -13,4% B U
74 - Other business activities
13.1% 7% -7,7% F U
ACCUMULATED TOTAL
29% 22.1%
(1) - “B” for backward linkages and “F” for forward linkages
(2) - “U” for ICT-user and “P” for ICT-producer
DG ECFIN
47
Alternative selection strategies
Signs of market malfunctioning
+
Economic importance OR important for adjustment
DG ECFIN
48
SELECTED SECTORS
Criteria for selectionEconomic importance
Contribution to adjustment
22 - Printing and publishing X
25 - Rubber and plastics X
27 - Basic metals X
28 - Fabricated metal X
29 - Machinery X X
31 - Electrical machinery and apparatus, nec X
32 - Radio, television and communication equipment X
34 - Motor vehicles X
50 - Sales, maintenance and repair X
51 - Wholesale trade X X
52 - Retail trade X X
H - Hotels and restaurants X
63 - Other supporting and auxiliary transport activities X
65 - Financial intermediation X X
66 - Insurance X X
74 - Other business activities X X
93 - Other service activities X
DG ECFIN
49
First analysis of causes of market malfunctioning in selected sectors
INTEGRATION- Market thickness- Import penetration- Contribution of FDI inflows to total investment - Coefficient of variation of prices across countries
Little evidence of problems in terms of integration with rest of the economy
But
Less competition than in US Less innovation than in US No major differences in regulatory barriers vis-à-vis the US but wide variation across Member States
Alternative view: McKinsey
Stronger emphasis put on the role of regulation in explaining productivity gap