What Hinders Investment in the Aftermath of Financial Crises: Balance-Sheet Mismatches or Access to Finance? Sebnem Kalemli-Ozcan University of Houston and NBER Herman Kamil International Monetary Fund Carolina Villegas-Sanchez University of Houston Paper presented at the 10th Jacques Polak Annual Research Conference Hosted by the International Monetary Fund Washington, DC─November 5–6, 2009 The views expressed in this paper are those of the author(s) only, and the presence of them, or of links to them, on the IMF website does not imply that the IMF, its Executive Board, or its management endorses or shares the views expressed in the paper. 10 TH J ACQUES P OLAK A NN UAL R ESEARCH C O N FERE N CE N OVEMBER 5-6,2009
Transcript
What Hinders Investment in the Aftermath of Financial Crises: Balance-Sheet Mismatches
or Access to Finance?
Sebnem Kalemli-Ozcan
University of Houston and NBER
Herman Kamil International Monetary Fund
Carolina Villegas-Sanchez
University of Houston
Paper presented at the 10th Jacques Polak Annual Research Conference Hosted by the International Monetary Fund Washington, DC─November 5–6, 2009 The views expressed in this paper are those of the author(s) only, and the presence
of them, or of links to them, on the IMF website does not imply that the IMF, its Executive Board, or its management endorses or shares the views expressed in the paper.
What Hinders Investment in the Aftermath of Financial Crises:
Balance-Sheet Mismatches or Access to Finance? ∗
Sebnem Kalemli-OzcanUniversity of Houston and NBER
Herman KamilInternational Monetary Fund
Carolina Villegas-SanchezUniversity of Houston
October 2009
Abstract
We utilize a new firm-level database from six Latin American countries between 1991 and2004 to study the effect of financial crises on firms’ performance. The depreciated currencyprovides new investment opportunities in the tradeable sector. Yet firms may not exploit theseprospects given decreased supply of credit as a result of failing banks and fleeing foreign investors.Firms might also become credit constrained if their reliance on foreign currency denominateddebt before the crisis (and the associated currency mismatch on their balance-sheets) reducestheir net worth after the depreciation. In contrast to the previous studies, we are able todifferentiate between these two main sources of financial constraints. We do so by relyingon firm level information not only on the share of debt denominated in foreign currency, butalso on the export orientation and the ownership structure of the firm. Using a differences-in-differences methodology, we show that foreign owned firms do better both in terms of sales andinvestment than the domestic firms in the post-crisis period. This result holds for the foreignowned firms who are exporters and also who hold short-term foreign currency denominateddebt. We conclude that limited access to finance plays a critical role in hindering investmentduring crises.
JEL Classification: E32, F15, F36, O16
Keywords: foreign ownership, depreciations, credit crunch, maturity, exports, dollar debt
∗We thank Aimee Chin for numerous conversations and suggestions and the participants at the COST Workshop
on Firm-Level Data Analysis in Transition and Developing Economies.
1 Introduction
The emerging-market crises of the 1990s and early 2000s have put firm performance during a credit
crunch at the center stage. According to conventional wisdom, large scale depreciations resulting
from currency crises should have an expansionary effect on output due to increased competitiveness.
The studies that use country-level data produce mixed results ranging from a contraction to an
expansion (see Agenor and Montiel (1996), Gupta, Mishra, and Sahay (2000)). Calvo and Reinhart
(2002) show that the contractionary effects are more likely to appear in the emerging market
countries, since these countries suffer from capital market imperfections.
The theoretical literature proposes two different mechanisms that can aggravate financial con-
straints during a financial crises. On the one hand, deteriorating access to liquidity can hinder
investment and may cause output collapses. Liquidity decreases since domestic banks cannot pro-
vide credit, especially when the currency crisis is accompanied with a banking crisis. At the same
time capital flows come to a halt and foreigners exit from the crisis economy, the so-called “sudden
stop,” leading to a decline in foreign credit. The liquidity constrained firms decrease investment
and production either because they cannot re-finance their short-term debt via domestic or foreign
sources and/or they cannot import intermediate inputs which are important for their production
(e.g. Aghion, Bacchetta, and Banerjee (2001); Chang and Velasco (2001); Caballero and Krishna-
murty (2001); Mendoza and Smith (2006)). On the other hand, foreign currency denominated debt
can cause a mismatch on firms’ balance-sheets. The key idea here is that depreciation inflates the
domestic currency value of the foreign currency debt, which causes a weakening of firms balance-
sheets and decreases net worth. This, in turn, prevents firms from expanding their production,
since they cannot borrow. As a result, even the non-constrained firms before the crisis may become
credit constrained during depreciations, a mechanism that can lead to decline in investment and
an output collapse (e.g. Bernanke and Gertler (1989); Krugman (1999); Cespedes, Chang, and
Velasco (2000); Eichengreen and Hausman (1999)).
The empirical literature so far cannot account for these channels simultaneously and hence fails
to differentiate among them. The main reason for this is the lack of data on both the currency
denomination of debt and good measures of “access to finance.” Hence, the literature evolved in
two separate tracks testing for the existence of credit constraints while having an omitted variables
problem. The firms who do not have a weak balance sheet can be the ones with better access
to capital such as foreign owned firms or the reason that foreign owned firms do better might be
because they match the currency denomination of their liabilities and assets.
2
We use a new panel data set that allow us to overcome this omitted variables problem in the
literature, which in turn help us to identify the effect of financial crises on firms performance ac-
counting for both sources of financing constraints. Our database has annual accounting information
for over 1,200 listed non-financial companies in six Latin American countries, spanning the period
1991 to 2004. We have data on the currency denomination of both debt and assets and we know if
the firms are foreign owned or not. Our data allows us to explicitly investigate the role of balance-
sheet mismatch together with access to credit since foreign owned firms have better access to global
finance. We can also investigate the role of banking crises since most of our countries experienced
a banking crises the year before the currency crisis. As shown by Kaminsky and Reinhart (1999),
currency crisis accompanied by banking crisis can be much more devastating than a single exchange
rate crisis. In addition, we also have information on the maturity of the debt and amount of exports,
the variables that are shown to be important (Chang and Velasco (2001)).
The existing empirical studies try to use different identification strategies.1 The first group of
papers search for financial constraints using measures of “access to finance” to identify the dif-
ferential impact. Desai, Foley and Forbes (2008) investigates the response of sales, assets, and
investment for U.S. multinational affiliates and domestic firms in the aftermath of currency crises
from 25 emerging market countries and find that the affiliates perform much better in all these out-
comes compared to their local counterparts. Their interpretation is that local firms are constrained
due to their limited access to finance. However, as they acknowledge, they are unable to document
the exact mechanism by which currency depreciations differentially intensify financing constraints
since they lack data on the currency denomination of the debt. The paper by Blalock, Gertler,
and Levine (2007) extend the above analysis by focusing solely on exporting plants and investigate
the role of foreign ownership for this group of establishments in Indonesia. This strategy allows
identification of the local firms who would benefit most from the currency devaluations.2 They
reinforce the conclusion of Desai, Foley and Forbes (2008) by showing that foreign owned exporters
clearly increase investment relative to domestic exporters. Once more this result is consistent with
existence of liquidity constraints but the source of the constraint is not clear since it is possible
that exporters and foreign owned firms may have more dollar denominated debt but they might
also have matching revenue or assets.3
1See Galindo, Panizza, and Schiantarelli (2003) for a survey of the firm-level literature.2Note that Desai, Foley, and Forbes (2008) also investigate the differential impact of depreciation on multina-
tionals that are export-oriented by proxying exports with foreign sales. They did not find a stronger effect though.
Multinational affiliates do better than local firms, regardless of the fact that they are export-oriented.3The authors argue that one of the main reason to focus on a sample exporters is that this sample must be least
3
The second group of papers focus solely on weak balance sheets as the main source of the liq-
uidity constraints again suffering from a similar omitted variables problem. Aguiar (2005) shows
that firms with heavy exposure to short term foreign currency debt before the Mexico crisis de-
creased investment compared to the firms who were not exposed. He shows an increase in sales for
both groups but a decrease in investment for the exposed group. Hence his results supports the
idea that weak balance sheets can hinder investment. However in a very similar study using more
countries instead of only Mexico, Bleakley and Cowan (2008) show the opposite result where firms
with dollar debt invest more. Bleakley and Cowan (2008) argue that firms who hold dollar debt
will never have a mismatch since holding dollar debt is endogenous to the fact that these firms have
matching revenue from their exports or matching assets.4
Our empirical methodology is differences-in-differences, where we can investigate the effect of
crisis, an exogenous event, differentially across type of firms, accounting for the firm-level hetero-
geneity. The depreciation resulting from the crisis is expected to improve investment opportunities
in the exporting sectors, while financial constraints are increasing through various mechanisms.
The firms might get affected differentially depending on various facts, such as whether or not there
is also a banking crisis; having currency mismatches on liability and asset sides of their balance
sheets; and also whether or not their access to foreign finance is limited. Thus, firm performance
will differ not only across foreign owned and domestic firms, exporters and non-exporters but also
across the firms with dollar debt that have no matching income and/or assets compared to the ones
who have matched dollar liabilities and assets.
Our results show that foreign owned firms do better than the domestic firms in the post-crisis
period both in terms of sales and investment. This result holds regardless of being an exporter
or holding short-term dollar debt. Hence having dollar denominated liabilities (both long or short
affected from holding dollar denominated debt since most likely these firms also have matching revenue in foreign
currency. They try to proxy balance-sheet weakness by controlling debt-to-asset ratio which has many limitations.
Unfortunately when they use this measure, their result that foreign exporters increase investment becomes fragile.4Both these paper will suffer from the fact that they cannot account for “access to finance” channel since they
cannot tell if the firms who hold the dollar debt are also suffering from a credit crunch differentially less than
their counterparts. Bleakley and Cowan (2008) attempt to proxy foreign ownership with two variables. First, they
construct a dummy for whether the firm has a parent company. However, they do not have information on the
nationality of the parent company. Second, they construct a variable that indicates whether the firm’s shares were
listed in a foreign stock exchange in the form of American depositary receipts (ADRs). However, issuing shares in
a foreign stock market does not necessarily imply that the firm’s operations and finance decisions are controlled by
foreigners. In our sample only 40% of the firm/year observations in which the firm cross-listed shares in the foreign
exchange market would be classified as foreign owned.
4
term) stops being a source of financial constraint if you are foreign owned and have access to global
capital markets. The reason for this finding seems to be the fact that foreign firms have better access
to global finance and not because firms who choose to hold foreign currency debt are happened
to be the foreign owned ones. Thus, our results can bridge the studies that evolved separately so
far, where one set of papers test the existence of financial constraints using foreign ownership as
the key identifier and the other group of studies examine the financial constraints created by the
currency mismatch of debt and assets on the firms’ balance-sheets. Our findings also provide an
explanation for the conflicting results found in the latter set of studies. Failing to control for the
ownership structure during the investigation of the balance-sheet effects might deliver a positive
effect of dollar debt on firms’ performance since the treatment sample of the firms with dollar debt
might be the foreign owned ones.
The difference in difference estimation strategy together with firm fixed effects, country-year
and sector-year fixed effects should address some of the potential endogeneity concerns. There
might still be some other relevant time-varying firm specific factors though it is hard to come up
with a consistent story that will explain all our findings. One exception is the selection problem
and the possibility that foreigners might be buying more productive firms to begin with and the
increase their productivity even more, so these firms do well in the aftermath of the financial crisis
no matter what. The evidence so far in the literature points more towards the causality running
from foreign ownership to productivity (see Arnold and Javorcik (2009)). For the specific case of
crisis, Aguiar and Gopinath (2005) show that foreign investors buy inferior firms at fire-sale prices.
Hence, our results most likely are not driven by this type of selection issues.
Our paper also relates to the literature on financial constraints, investment and growth. The
empirical literature mostly finds a negative effect of financial constraints on investment (e.g. Fazzari,
Hubbard, and Peterson (1998, 2000); Kaplan and Zingales (1997, 2000); Lamont (1997)), however
this literature suffers from the typical identification problem since the basic approach is to test
if there is a relationship between cash flow and investment and interpret this as the evidence of
financing constraints. We follow the work by Aguiar (2005), Blalock, Gertler and Levine (2007)
and Desai, Foley and Forbes (2008) and use the crisis episodes as an exogenous determinant of
financial constraints and document a fall in investment as in those papers. On the other hand,
Mendoza (2006) finds that, in Mexico during the sudden stop of 1995, a fall in the imports of
intermediate inputs can explain almost half of the decline in TFP.5 We argue that whether the5Basu and Fernald (1999) critiques Solow residual as a measure for TFP. Meza and Quintin (2006) show that
capacity utilization and labor hoarding can also have a role in explaining declining TFP since during crises productive
5
effect of financial constraints go through via investment or TFP or both it is important to know
why currency depreciations combined with credit crunches aggravate the financial constraints at
the first place, a task we undertake in this paper. Without knowing the exact mechanism through
which the financial crises affect credit constraints, it is hard to link these crises to output collapses,
which has utmost policy priority given the current global crisis.
We proceed as follows. Section 2 presents our identification strategy and discusses our data.
Section 3 presents the empirical results. Section 4 concludes.
2 Empirical Analysis
2.1 Identification and Estimation
Our objective is to identify how a financial crisis affects firm performance. The main question is
what is the channel through which crises aggravate credit constraints. Hence by using a differences-
in-differences methodology we test various hypothesis in order to understand what type of firms
outperform during the crisis and consequently are not credit constraint. We start by looking at
the traditional channels proposed in the balance sheet literature that are thought to mitigate or
aggravate financial constraints. In theory, the depreciation rises investment opportunities in the
exporting sector and therefore we would expect exporters to increase investment in the aftermath
of the exchange rate crisis. In order to test this hypothesis we estimate the following equation:
where again yi,c,j,t is the outcome of firm i, in country c, in sector j at time t and DDebt measures
dollar denominated liabilities. As in the previous specifications, Post is the depreciation dummy
and equals to one in the year of depreciation and one year after. φj,t controls for sector-year fixed
effects, ϕc,t captures country-year fixed effects, τt are year dummies, αi are firm-specific effects,
and ξi,c,j,t is the error term. Size and debt exposure are accounted for following the same strategy
as in (1) and (2).
7
If as it has been suggested in the literature, firms match their dollar debt holdings with export
revenue we expect the coefficient on the interaction term to be positive and significant. However,
this coefficient might still be upward bias if foreign companies are more likely to hold dollar debt.
As we also argued in the introduction, the part of the literature that has been focusing on the access
to finance channel instead of the mismatch channel has found that foreign companies outperform
domestic companies during depreciation episodes. They interpret this finding as better access to
credit. On the other hand, the fact that the firm is foreign owned might proxy other channels. For
example, we expect a worse outcome from firms that do not match the currency denomination of
their balance sheet. Foreign firms could outperform domestic firms since they mostly operate in
tradable sector and have dollar income in addition to dollar assets. The bottomline is that access to
finance and balance-sheet mismatch must be accounted for simultaneously since just being foreign
owned or just not having a mismatch can proxy for the other variable.
The unique nature of our dataset allows us to disentangle the effect of balance sheet mismatches
and access to credit during crises. The final step in our estimation strategy would be to estimate
equation (3) separately for domestic and foreign companies. A priori we can expect to see a positive
and significant coefficient on the interaction term Exportsi,c,j,t−1×DDebti,c,j,t−1×Postc,t for both
domestic and foreign companies if firms match export revenue and dollar liabilities. However, if
there is an additional effect from being foreign owned, we should see that the coefficient on the
interaction term for the subsample of foreign companies is higher than that for the subsample of
domestic companies. We interpret this additional effect due to being foreign owned as access to
credit. Holding dollar debt is not a constraint for foreign companies since they have access to global
credit.6
There might be some endogeneity and selection issues, since there can be selection both into
being an exporter and being foreign owned. For example, foreign companies are characterized
by a set of non-tangible assets that make them more productive irrespective of the depreciation
episode. Our identification strategy would be weakened if during the depreciation episode foreign
companies acquire the most productive domestic companies. As, we argued in the introduction,
the evidence so far seems to be showing the opposite. The recent literature on firm heterogeneity
and trade shows that it is most productive firms that enter the export market (Helpman, Melitz
and Yeaple (2004)). Therefore, the depreciation episode would only make firms near the threshold
productivity cut off level enter the export market. These firms would be more productive than the6Chang and Velasco (2001) argue that their main result of a bank run due short term liabilities exceeding the
value of assets can be overturned if they allow FDI in their model.
8
non exporting ones but less productive than the ones that were already exporting and that due to
the depreciation also experience a competitive effect. Consequently in the case of firms changing
export status during the depreciation episode we cannot rule out an endogenous selection bias. In
order to mitigate this effect we use lagged export values.
One might also worry about the unobserved firm characteristics that drive the balance-sheet
matching decision of companies. For example, risk loving managers would have a tendency to
avoid balance-sheet matching (due to higher returns on long-term domestic assets and lower cost of
short-term foreign debt) and therefore, the correlation between balance sheet mismatch and output
might be confounded. In theory, many of the firm unobservable characteristics that would cause a
threat to the identification strategy are time invariant. To control for firm specific characteristics
that do not vary over time we take advantage of the panel data nature of our dataset and include
firm fixed effects. In addition, we attempt to eliminate the bias from common shocks by including
year fixed effects. The 90s was an important period for many Latin American countries in terms
of deregulation, openness to trade and financial liberalization. To control for those country spe-
cific events we include country-year fixed effects. Similarly, the deregulation and openness had a
differential impact across sectors and therefore, we control for sector-year specific effects.
2.2 Data
The empirical analysis draws on a unique database with accounting information for over 1,200
non-financial companies in six Latin American countries, spanning the period 1991 to 2004. The
countries covered are: Argentina, Brazil, Chile, Colombia, Mexico and Peru. A distinct feature
of this dataset is that it contains firm-specific information on the share of assets and liabilities
denominated in foreign currency, the breakdown of sales into domestic and export revenues, and
the foreign-ownership structure.7
The data for this paper was assembled from different sources.8 Balance sheet and general
company information was obtained from annual financial statements drawn from local stock markets
or regulatory agencies in each country. Data on foreign currency liabilities and assets was hand-
collected from the financial explanatory notes of firms’ balance sheets. These include all assets or7The most widely used firm-level dataset in cross-country studies, Worldscope, has no information on the currency
denomination of either assets or debt, and very sparse coverage of firm’s foreign currency revenues (see, for example,
Desai, Foley and Forbes, 2008).8Further details on the data construction and variable definitions are provided in the Data Appendix and in Kamil
(2009).
9
liabilities outstanding which are denominated in-or indexed to-foreign currency, issued domestically
or abroad.9 Information on firms’ export revenues was obtained from countries’ customs office
records, and matched for each firm in the sample using their fiscal code identifier and/or name.
We also have information on firm-level issuance of external bonds, loans and ADRs from Dealogic
Bondware and Loanware.
We constructed a time-varying measure of domestic/foreign ownership by combining three
sources. We use the Corporations Affiliations database to identify Latin American firms in our
sample that are affiliates, subsidiaries and/or divisions of global firms.10 We also used information
from data provider Economatica on firms’ main shareholders, their stockholdings and nationality.
Finally, we used SDC Platinum database published by Thomson Reuters to identify those firms
that were merged or acquired by a foreign company, and the fraction of shares that were bought.
Hence, we have a continuous foreign ownership measure. As a start, we define a firm to be foreign
owned if, in a given year, it was a local affiliate of a foreign multinational or had a majority 50%
foreign-owned equity or above.
Our main outcome indicators are sales and investment in fixed capital. Sales is defined as gross
sales and other operating revenues from main activities. The stock of physical capital, in turn,
is defined as the sum of property, plant, equipment, plus technical reappraisal (valuation change),
minus cumulated depreciation. An ideal measure of investment, however, should consider the rate of
change of the capital stock series at replacement cost: in periods of financial crisis with large swings
in exchange rates, the book value and replacement cost of assets can diverge significantly.11As in
Blalock, Gertler and Levine (2008), we try to minimize the effects of reporting bias in the value of
capital stock by estimating the models with firm-level fixed effects. The measure of investment used
in the estimation analysis is the annual change in the stock of physical capital scaled by lagged total
assets. By scaling we want to avoid capturing differences in investment responses after depreciation
episodes that are merely due to differences in firm size.9Information on the exact currency composition of foreign-currency denominated debt or assets for all countries is
not available. For countries for which we do have a detailed breakdown of currency denomination (Chile and Peru),
we find that, on average, 95 percent is denominated in dollars. Thus, we assume throughout that all foreign currency
debt is denominated or indexed to the US dollar.10Contains US and international public and private business profiles and corporate linkage (”who owns whom”)
for approximately 184,000 public and private companies worldwide.11Data on capital stock at replacement costs was not available for most countries, nor did we have a convincing
set of assumptions to correct the book value of fixed assets. Cash flow information on capital expenditures was only
available for Argentina and Mexico.
10
Most of the sample consists of publicly-traded companies. Focusing mostly on publicly listed
firms has the disadvantage that small firms may be underrepresented in the dataset, yet it has
the advantage that financial statistics are typically more reliable and comprehensive. Moreover,
relative to other available databases, the coverage of small and medium-sized publicly traded firms
is superior, thus providing ample cross-firm variation in sizes.12
For our estimates, we use a sample restricted to those firms for which data on our main variables
of interest (i.e. foreign-currency liabilities, exports, foreign ownership, investment, sales and total
assets) was available on a continuous time basis. The nature of the panel is nonetheless unbalanced
since we might have missing data on some of the variables. Although we do not allow firms disappear
and then reappear in the sample, we might have new firms starting later, and we might also have
some firms going bankrupt before the end of our sample. Table 2 shows the number of observations
in the final sample per country and year, distinguishing between the number of firms according to
whether data on investment was available or not.
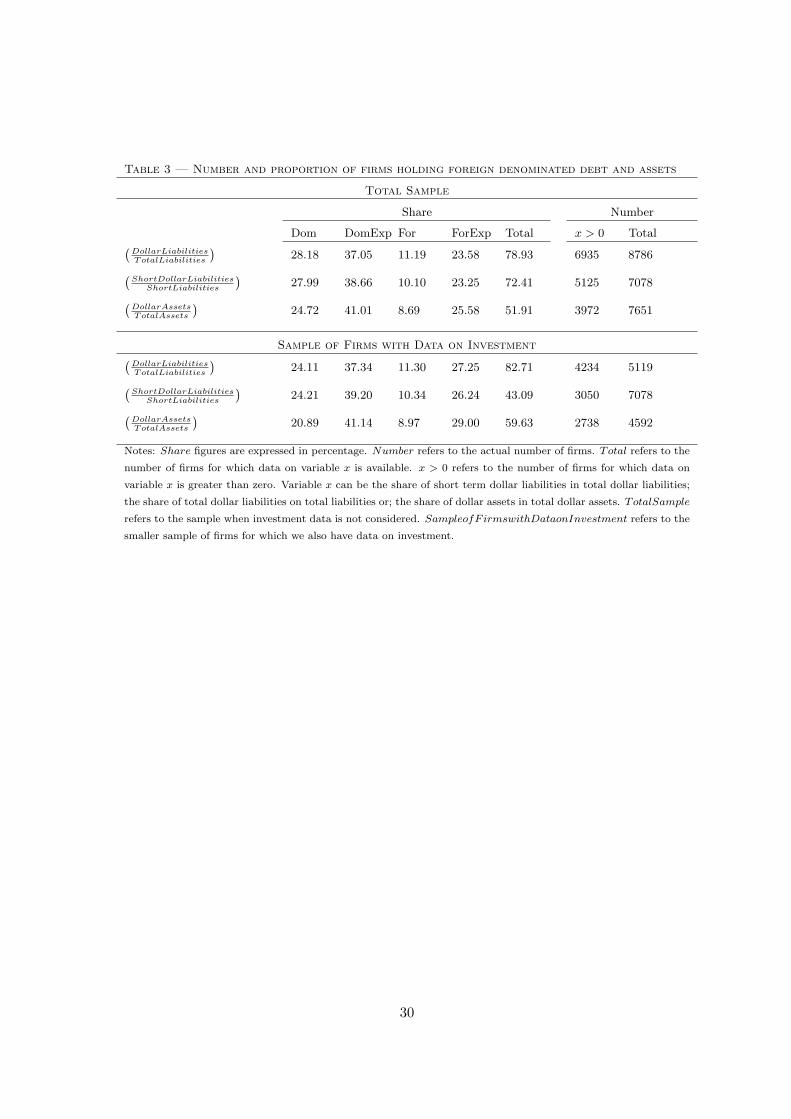
Table 3 reports the percentage of firms holding dollar denominated debt or assets by type of firm.
Around 79% of the observations hold dollar denominated debt of which 72% are domestic exporters,
foreign companies or foreign exporters. It is worth noting that most of the dollar denominated debt
is short-term dollar debt and that only 50% of the observations hold dollar denominated assets. In
our estimation we look at two outcome variables: sales and investment. As it was already pointed
out due to data availability the sample size is reduced in the case of the investment outcome. For
the sample in which investment is available, the percentage of firms holding short term dollar debt
is reduced to 43%.13
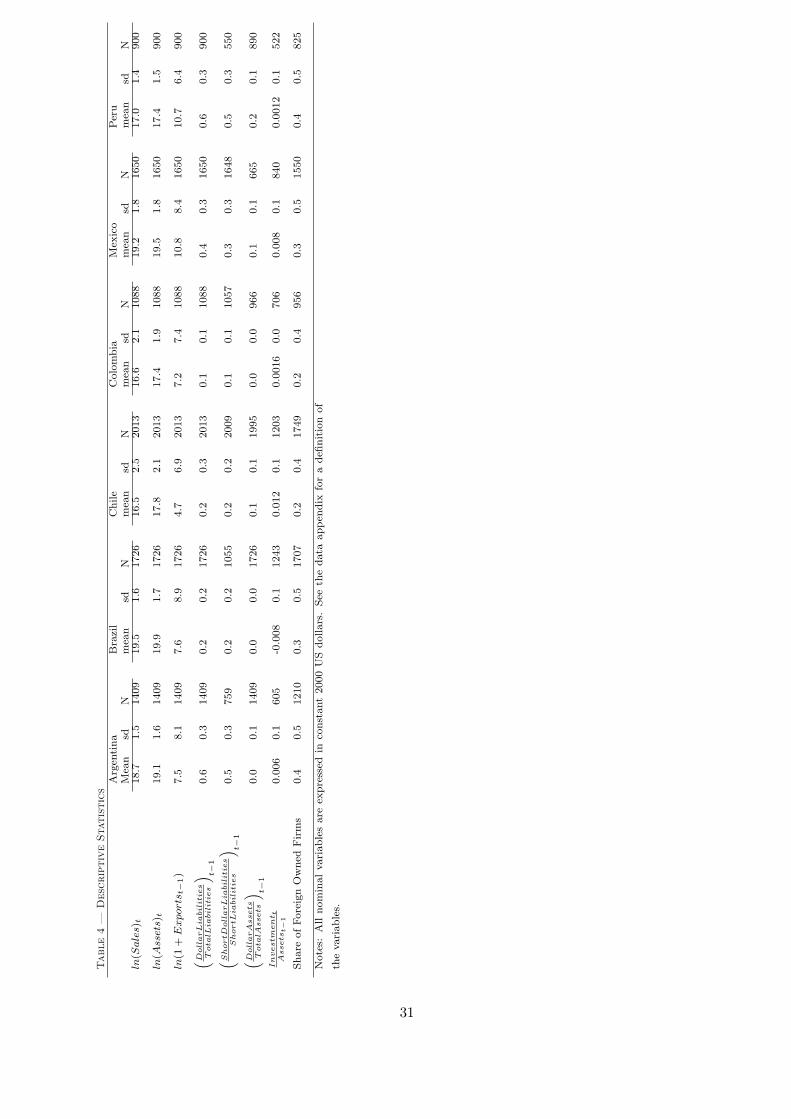
Table 4 reports the descriptive statistics for the variables used in the analysis. Inspection
of Table 4 reveals significant cross-country variation in the currency denomination of corporate
borrowing. The average share of foreign currency debt during the period ranged from 10 percent
in Colombia to above 60 percent in the case of Argentina and Peru. Foreign currency denominated
assets are a small share of total assets (between 1 and 10 percent). Regarding foreign ownership,
for most countries one third of the observations are considered foreign owned.12The database covers all firms that are listed-or have been listed- in the six countries’ stock exchanges, rather than
just the most liquid or with the biggest market capitalization, as has been common in other cross-country studies
(see, for example, Allayanis, Brown and Klapper, 2003).13Note that this will bias our results downwards working against us.
11
2.3 The crisis episodes
Finally, we need to define the depreciation episodes. We say a depreciation takes place if the real
exchange rate increased by more than 25% compared to the value of the exchange rate the year
earlier. Using data on CPI, the real exchange rates were obtained as the deflated end-of period
exchange rates. We identify three depreciation episodes in our sample: Mexico (1994), Brazil (1999)
and Argentina (2002).14 Therefore, the identification strategy does not only rely on the before/after
effects on the depreciation within the same country but it is enhanced by the comparison of firms
in countries that suffered an exchange rate depreciation and firms in countries that did not suffered
any depreciation episode.
In addition, following Reinhart and Rogoff (2008) we identify the following banking crises:
Argentina (1995), Brazil (1995), Mexico (1994), Colombia (1998) and Peru (1999). The advantage
of our dataset is that we can compare countries that suffer simultaneous banking and exchange
rate crises, countries with only exchange rate crises and those that underwent only a banking crisis.
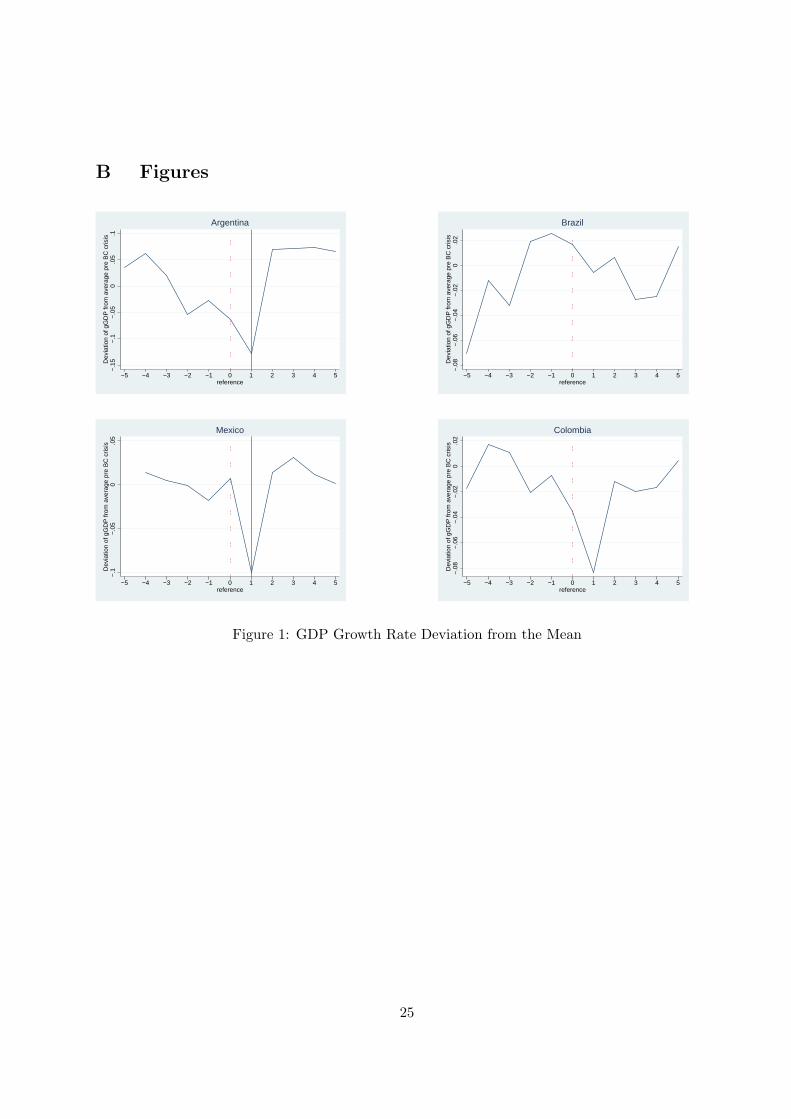
As we can see from Figures 1 and 2 the aggregate effects on output and investment vary widely.
Figure 1 plots the growth rate of GDP as deviation from its average trend 4 years before the
banking crisis for Mexico, Argentina, Brazil, and Colombia.15 The dotted line at the year zero
denotes the banking crisis and the solid line at year one denotes the currency crisis. Brazil and
Colombia had only a banking crisis in years 1995 and 1998 (years denoted as zero) respectively.16
Argentina and Mexico on the other hand had a banking crisis in 2001 and in 1994 respectively
(years denoted as zero) and then immediately had a currency crisis the next year. In Mexico’s case
currency crisis was in December 1994. In order to have a better visual demonstration, we put the
line for currency crisis for Mexico in the year 1995.17 The figure shows that output growth rises
sharply a year after the currency depreciation, which is consistent with the view that the recovery
is driven by the competitiveness effect. On the other hand there is also a clear drop in output
growth after the banking crisis and the recovery seems to take 2 years as can be seen from the
case of Colombia and Brazil, who only had a banking crisis. Although there is a declining trend14Notice Mexico abandoned the peg in December 1994, Brazil in January 1999 and finally, Argentina in January
2002.15The average growth rate of GDP in the four years before the banking crisis is 1.9% in Argentina, 2.7% in Brazil,
4.1% in Colombia and 3.7% in Mexico.16We dated the banking crisis based on Reinhart and Rogoff (2008).17In our regressions we will have country*year dummies which will control for banking crisis and hence will define
the Mexico currency crisis as 1994 following the other studies in the literature. We have also run a robustness check,
defining it as 1995 and obtaining similar results.
12
in output in Colombia and Argentina before the crisis, this is not the case for Brazil and Mexico.
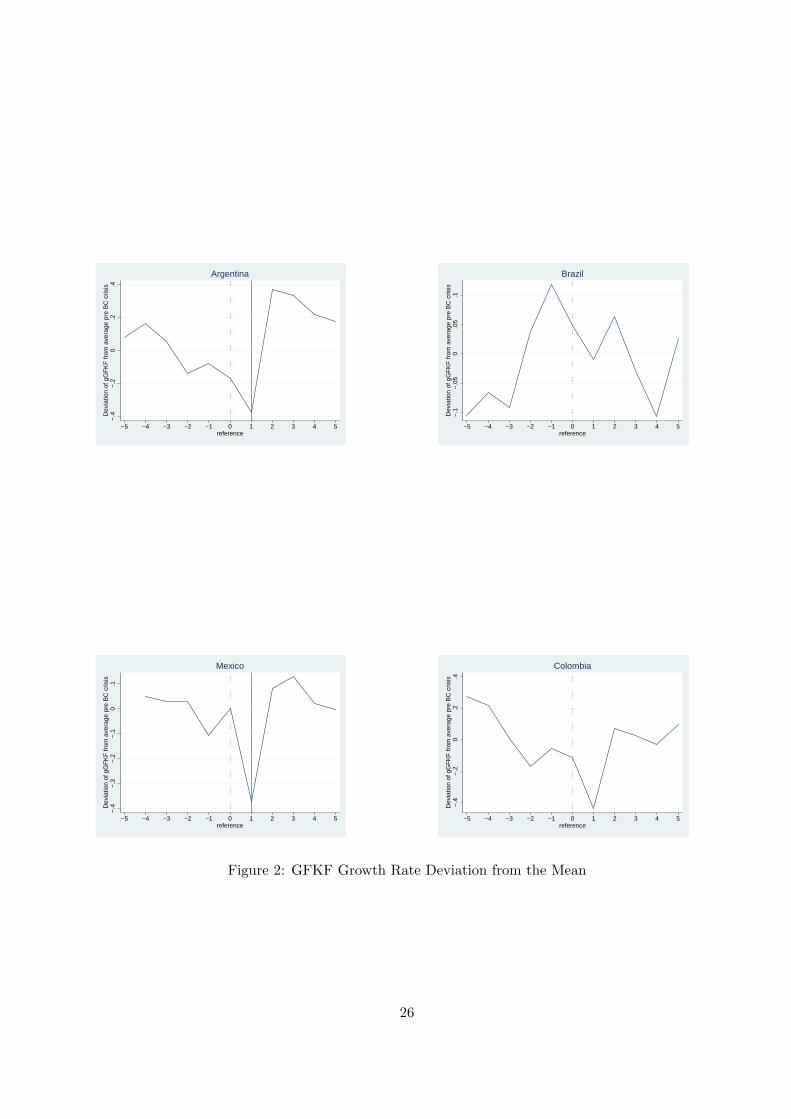
Figure 2 undertakes the same exercise for the growth of aggregate investment which is measured
as the change in gross fixed capital formation. We pretty much get a similar picture, implying the
aggregate output and investment responses go together. Although, there is a great deal of country
heterogeneity, especially depending on having a twin or a single crisis.
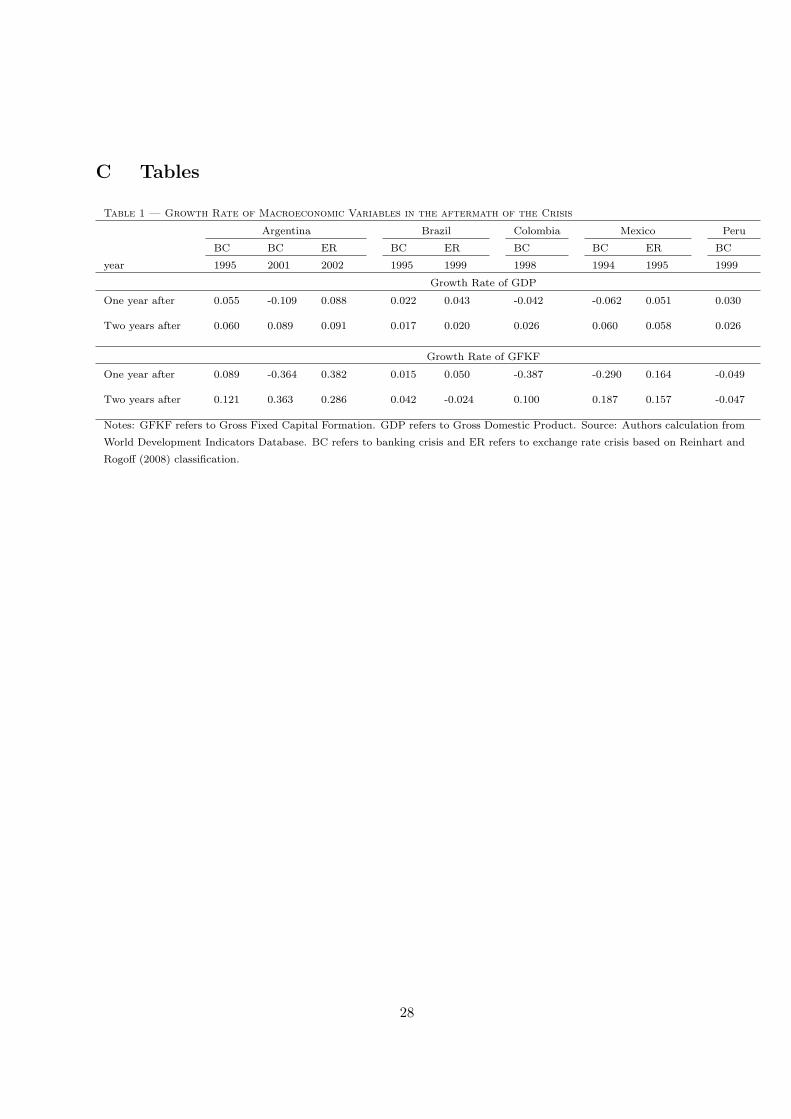
If we look at the numbers behind these changes, we see that output dropped 10 percent, while
investment is shrinking 36 percent in Argentina after the 2001 banking crisis, as shown in Table
1. After the exchange rate crisis both seemed to be recovered. In Mexico, on the other hand, the
recovery took much longer. The original drop in output was 6 percent and in investment was 29
percent and the year after the currency crisis, although output recovered, investment only increased
16 percent. These aggregate numbers clearly mask a great deal of heterogenous firm responses. In
fact a closer look shows, in Mexico the year after the currency crisis, domestic companies reduce
their sales by 3 percent while foreign owned companies increasing it 9 percent. In Colombia, sales
increased for both domestic firms and the foreign-owned firms but much more for the latter group,
2 percent and 4 percent respectively. In fact, investment shrank 3 percent for the domestic firms
the year after the banking crisis in Colombia, and increased 4 for the foreign owned firms. These
findings call for an empirical strategy that is centered around firm heterogeneity.
3 Results
3.1 Main Results
The traditional textbook theory on the effect of exchange rate depreciations on output, concludes
that the depreciation episode should increase sales and investment of exporting firms due to a
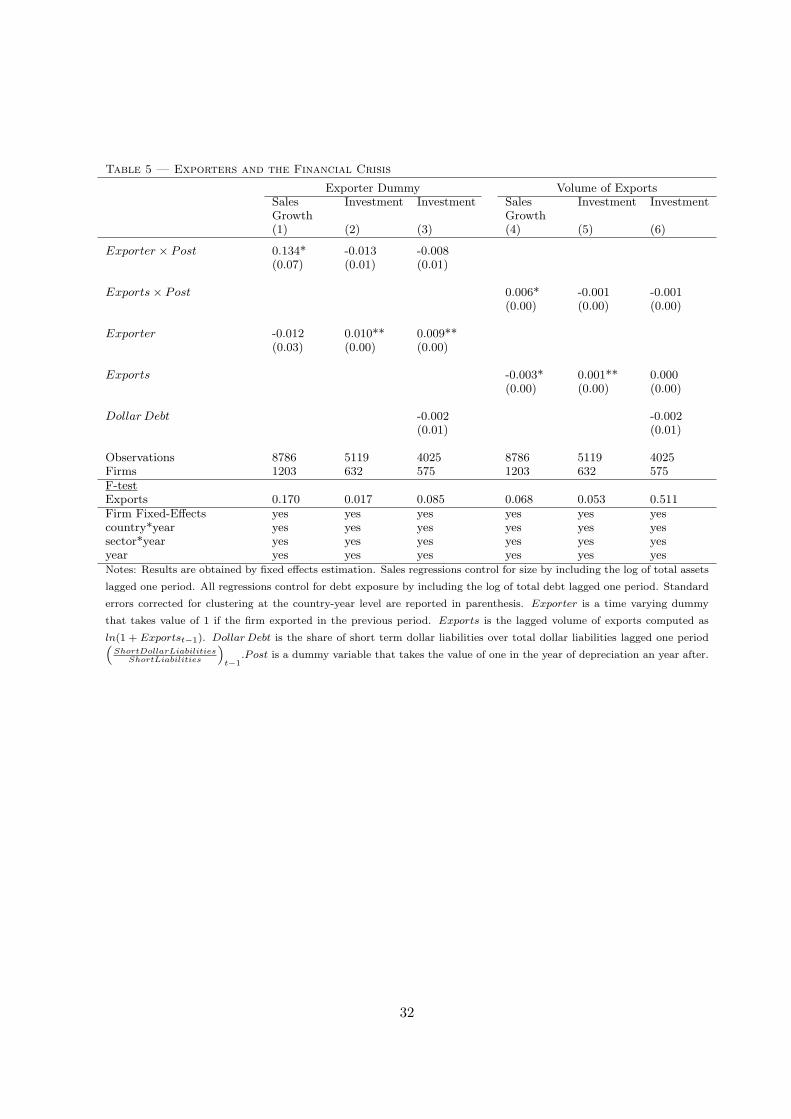
competitiveness effect. Table 5 tests this hypothesis by estimating equation (1). Columns (1) to
(3) use an export dummy capturing whether the firm exported in the previous period. Columns (4)
to (6) use the volume of exports18. Column (1) shows that exporters increase sales in the aftermath
of the depreciation. However, contrary to what the standard theory predicts, column (2) shows
that exporters do not increase investment in the depreciation period. Columns (4) and (5) show
similar results using the volume of exports. This counterintuitive result has been explained in the
literature as the result of financial constraints. The depreciation does not only imply a positive
competitiveness effect but a) if it is combined with a banking crisis, which typically is the case,18Similar results were obtained using the share of export to sales.
13
then there will be an associated credit crunch, b) depreciation can also exacerbate the financial
constraints of firms holding dollar denominated debt. This increase in the value of the debt would
not represent an obstacle to investment in two cases: a) if the firm could access credit through
domestic and international capital markets or b) if the firm has an stream of income denominated
in foreign currency (i.e. dollar assets or exports).
We start by looking at the balance sheet channel. Columns (3) and (6) in Table 5 control for
the share of dollar denominated debt in total short term debt as a first attempt to address the
balance sheet mismatch. Different studies use different definitions regarding the variable dollar
debt. The theoretical literature stresses the importance of short-term dollar denominated debt19
and therefore, we focus on this variable in our analysis. The lack of detailed data has prevented
previous studies from investigating whether the maturity of the debt matters.20
In theory, we would expect that once we control for dollar liabilities, exporters will increase
investment in the aftermath of the crisis. However, as it is shown in columns (3) and (6) this is
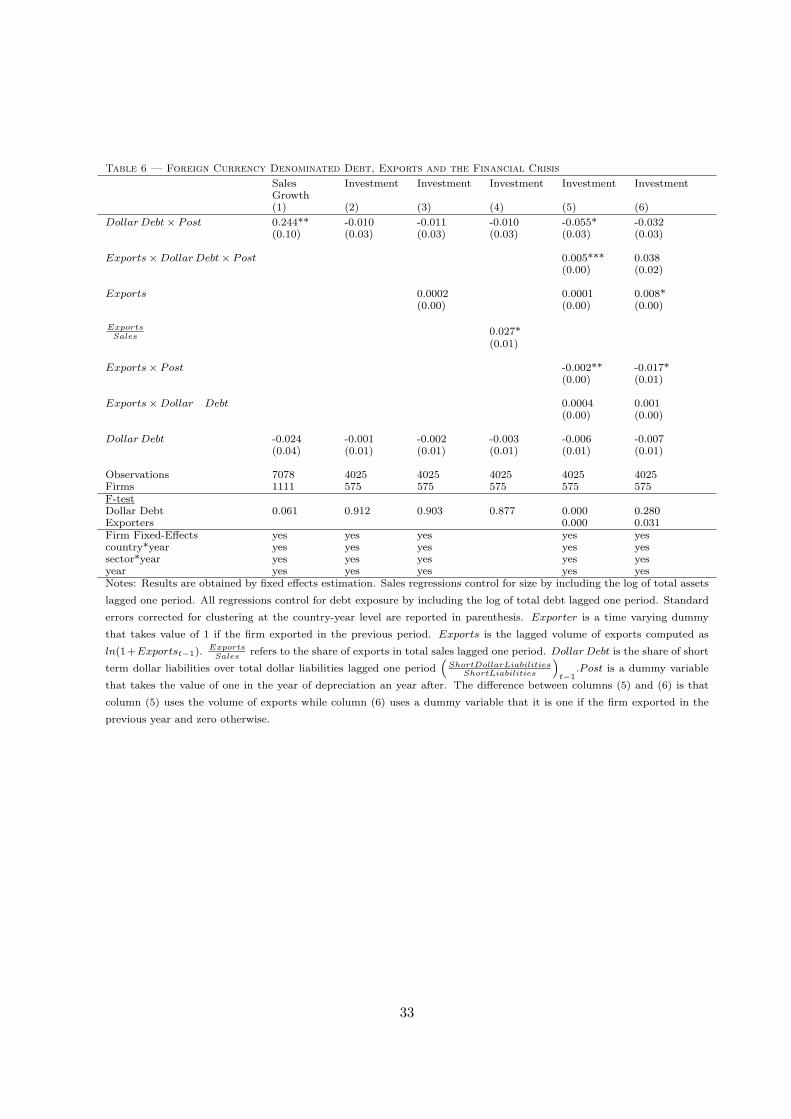
not the case. So what is the role of dollar liabilities during crises? Table 6 explores this question
in greater detail. Columns (1) and (2) show that firms holding dollar denominated debt increased
sales and did not decrease investment as we would expect if the value of the dollar denominated
debt increased after the depreciation. As we have been arguing this effect might be mitigated by
the fact that firms holding dollar liabilities do also export. Column (3) shows that accounting for
the other side of the balance sheet does not explain the results in column (2). Exports cannot
explain the finding that dollar-indebted firms do not experience a decrease in investment during
depreciations.21 One might worry that the volume of exports is not the relevant variable but rather
the share of exports in total sales. Column (4) repeats the estimation controlling for the share of
exports and results are similar to those in column (3) when we control for volume of exports.
The results so far are consistent with the existence of some financial constraint but the exact
mechanism is not clear. One possibility is that controlling for exports or dollar liabilities is not
enough to rule out the balance sheet channel because the depreciation episode had a differential
impact on exporters and firms holding dollar liabilities. Column (5) in Table 6 reports the results
from estimating equation (3). The coefficient of interest is the coefficient on the triple interaction
between exports, dollar debt and post. The results suggest that exporters holding dollar debt19Short-term liabilities refer to outstanding debt that must be satisfied within 12 months. See Appendix for a
description of the variables.20We find similar results using total debt.21Notice the share of non-exporting firms holding dollar denominated debt is relatively high (27%) as suggested by
the “original sin” literature on the difficulties that domestic firms face to borrow in local currency.
14
increased investment in the aftermath of the depreciation and therefore, hints the possibility that
firms match export revenue and dollar denominated debt. In fact, column (6) in Table 6 repeats
the analysis using an exporter dummy instead of volume of exports. Although the F-test for joint
significance of the export coefficients is significant the triple interaction is not and suggests that
to increase investment while holding dollar debt it is not enough to export you need to have a
considerable volume of exports.
Our main hypothesis is that the coefficient in column (5) of Table 6 is a reduced form effect
of two confounded channels: the balance sheet channel and the credit channel. Foreign firms hold
on average higher levels of dollar denominated debt are more export oriented. Therefore, failing
to control for foreign ownership would bias upwards the coefficient on the triple interaction. By
proxying access to credit with foreign ownership we should be able to disentangle the balance
sheet and access to credit channels. If firms hold dollar denominated debt and they match this by
exports, both domestic and foreign companies experience a balance sheet effect during depreciation
episodes. However, foreign companies might mitigate a potential negative balance sheet effect by
having access to external financing. Domestic companies that are highly dependent on domestic
credit markets would not be able to borrow during depreciations when they are more financially
constrained. Therefore, we expect an heterogenous response from firms holding short-term dollar
debt and/or exporters, according to ownership. Alternatively if everybody matches and there is no
negative effect of holding dollar debt, and if we still find a higher coefficient on foreign ownership,
this shows the additional effect of being foreign-owned, which we interpret as access to finance.
Table 7 shows our main results. Columns (1) and (2) repeat the diff-in-diff estimation strategy
from column (5) in Table 6 but splitting the sample among domestic and foreign companies. Results
in column (1) show that domestic exporters holding dollar debt do not increase investment in the
aftermath of the crisis. On the contrary, in column (2) foreign exporters holding dollar debt increase
investment in the aftermath of the depreciation. Therefore, if the channel would be a better balance
sheet match of exporters we should observe an increase in investment for domestic exporters but
we do not. We only observe foreign exporters increasing investment. One can also run a symmetric
exercise by distinguishing between exporters and non-exporters. Columns (3) and (4) in Table
7 report these results. As expected we confirm the previous findings. Only foreign exporting
companies holding dollar debt increase investment in the years of depreciation. As a result, we
conclude that access to credit is the main channel hindering investment in the aftermath of crisis.
15
3.2 Robustness
In this section we conduct a series of robustness checks for the results found in column (4) of Table
7. We use the subsample of exporters because in this way we have more observations but similar
results are found when checking the robustness of results in column (2) of Table 7.
First, we control for the possibility that foreign firms are on a different trend than domestic
firms by adding foreign-year fixed effects. In addition, the motivations of foreign investors to set
up an exporting plant or a subsidiary that serves the local market might vary according to the
host country characteristics. Therefore, in order to control for unobserved characteristics that vary
across foreign companies and countries we include foreign-country fixed effects. Results in column
(1) of Table 8 show that foreign exporters holding dollar debt are still increasing investment in the
aftermath of the depreciation.
Second, our identification strategy relies on the assumption that only foreign companies have
access to credit during crises. However, this might not need to be the case if domestic companies
can access international credit markets. Column (2) in Table 8 adds two variables to the main
specification. A dummy variable that takes on a value of one starting the year the firms accessed
international equity markets (by cross-listing shares in foreign stock markets) and/or tapped for-
eign credit markets (by issuing bonds or taking loans abroad). We used Bank of New York data
to identify those firms whose shares listed in a foreign stock exchange in the form of American
Depositary Receipts (ADRs). Firm-level issuance data on private bonds and syndicated loans was
extracted from Dealogic Bondware and Loanware. Although on average access to international
capital markets has a positive and significant effect on investment our main interaction effect is not
significantly affected by it. These results confirm that the triple interaction coefficient is capturing
access to the parent’s company credit and not credit from international capital markets. Of course,
parent company being foreign is more diversified and have access to international capital markets
and hence our interpretation is that the foreign-owned firms do get access to the markets through
their foreign owners.
Third, an additional source of dollar denominated income rather than exports can be dollar
denominated assets. Column (3) repeats the estimation controlling for the share of dollar denomi-
nated assets in total assets with no major impact on the triple interaction coefficient.
Finally, one of the main identifying assumption is that the time effect for firms holding short-
term dollar debt and peso indebted firms is the same. A potential concern is that firms that
choose to hold dollar denominated debt could be different from the firms that chose not to do so,
16
irrespective of the depreciation, and these differences might be correlated with output. In practice,
most of the firm unobservable characteristics are time invariant and therefore, this concern should
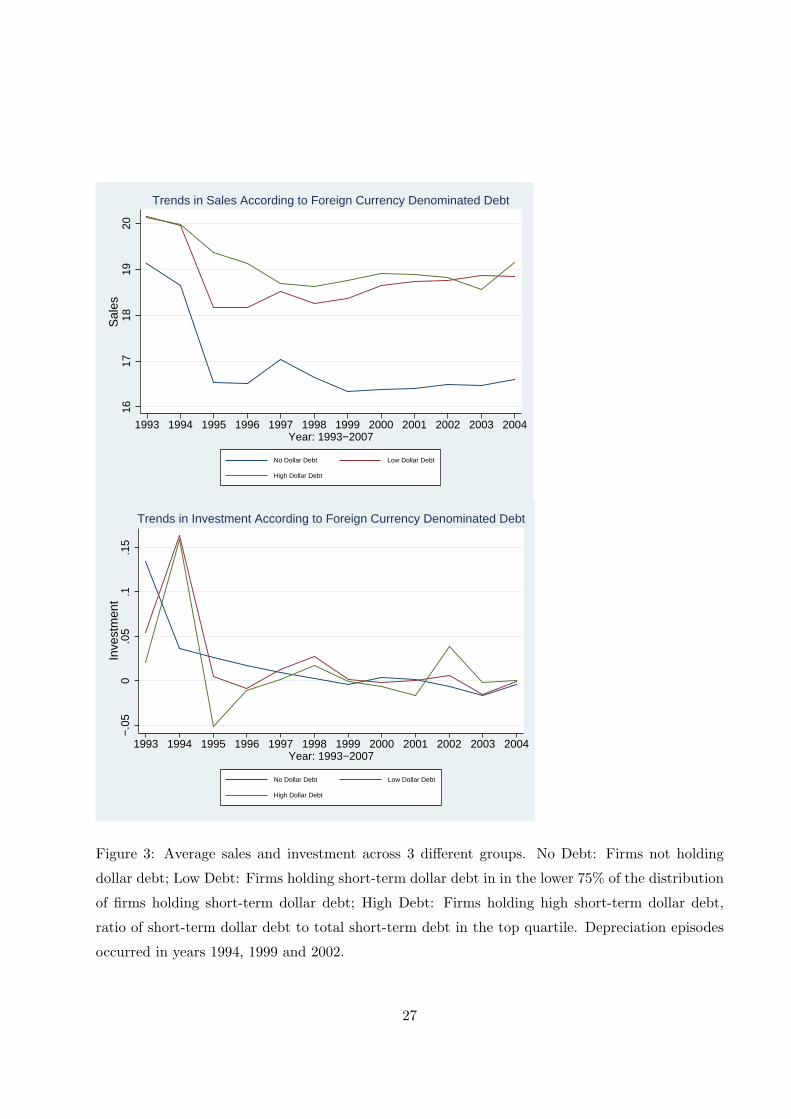
be mitigated by the fixed effect estimation. Figure 3 shows the average sales for three different
groups of firms: firms not holding dollar debt, firms holding dollar debt above the top quartile of
the distribution of firms holding dollar debt and firms holding dollar debt below the 75 percentile.
Graphical inspection reveals that in the case of sales there are no major differences in trends
between firms holding short-term dollar debt and those that do not in the depreciation episodes of
Mexico and Argentina. However, there are significant differences in the case of Brazil (1999). Most
importantly in terms of differences in investment trends Figure 3 shows differences between firms
holding dollar debt and those not holding before all depreciation episodes. However, the trends are
similar for those holding high levels of dollar debt and those holding low levels of dollar debt in
the years prior to depreciations22. Given the pre-existing trend differences between firms holding
dollar debt and peso indebted firms, column (4) in Table 8 repeats the analysis for the subsample
of firms holding short-term dollar debt. Our main result is robust to the new sample composition.
Foreign exporting firms holding higher levels of short-term dollar debt increase investment in the
year of depreciation. Column (5) controls for all the potential concerns, yielding similar results.
4 Conclusion
The question of what will happen to investment and growth in the aftermath of the recent global
financial crisis is at the central stage of policy making. Following the recent work by Reinhart and
Rogoff (2008), we argue that we can learn a lot from the past financial crises. We utilize a new firm-
level database from six Latin American countries between 1992 and 2004. These countries during
this time period have experienced severe financial crises and hence constitute a fertile laboratory.
These experiences also underline the role of financial constraints and the heterogenous impact of
financial crises on firms’ performance.
We have tested the role of two main channels of financial constraints proposed by the theoretical
literature. On the one hand there is the balance-sheet mismatch channel. If there is a mismatch
between firms’ foreign-currency denominated debt and local currency denominated assets, firms
might become financial constrained during a depreciation and may not exploit the investment
opportunities in the exporting sector. On the other hand, firms might cut off both from domestic
and foreign finance and this limited access to credit can aggregate the financial constrains. As22Firms with high levels of dollar debt are those in the top quartile of the distribution of firms holding dollar debt.
17
oppose to the previous studies, we are able to differentiate between these two main sources of
financial constraints, by utilizing a new firm-level database. Our database includes information not
only on the share of firms’ debt, denominated in foreign currency, but also on the export orientation
and the foreign-ownership structure of the firm.
Using a differences-in-differences methodology, we show that foreign owned firms do better
both in terms of sales and investment than the domestic firms in the post-crisis period, regardless
of the fact that the foreign owned firms might also be exporters and might hold short-term foreign
currency denominated debt. We conclude that limited access to finance plays an important role in
hindering investment during crises.
18
References
[1] Agenor, Pierre-Richard, and Peter Montiel. 1996, Development Macroeconomics. Princeton,
NJ: Princeton University Press.
[2] Aghion, Philippe, Bachetta, Philippe, and Abhijit Banerjee. 2001, “Currency Crises and Mon-
etary Policy in an Economy with Credit Constraints”, European Economic Review 45, pp.
1121-50.
[3] Aguiar, Mark A., 2005, “Investment, Devaluation, and Foreign Currency Exposure: The Case
of Mexico,” Journal of Development Economics, Vol. 78, pp. 95-113.
[4] Aguiar, Mark A., and Gita Gopinath, 2005, “Fire-sale FDI and Liquidity Crises”, Review of
Economics and Statistics 87 (3), pp. 439-452.
[5] Allayannis, George, Gregory Brown, and Leora F. Klapper, 2003, “Capital Structure and
Financial Risk: Evidence from Foreign Debt Use in East Asia,” Journal of Finance, Vol. 58,
pp. 2667-2709.
[6] Basu, Susanto and John Fernald, 2001, “Why Is Productivity Procyclical? Why Do We Care?”.
In: New Developments in Productivity Analysis, pp. 225-302. National Bureau of Economic
Research.
[7] Bernanke, Ben S., Mark Gertler, 1989, “Agency Costs, Net Worth, and Economic Fluctua-
tions,” American Economic Review, Vol.79, pp. 14-31.
[8] Bleakley, Hoyt, and Kevin Cowan, 2008, “Corporate Dollar Debt and Depreciations: Much
Ado About Nothing?” The Review of Economics and Statistics, Vol. 90(4), pp. 612-626.
[9] Caballero, R., Krishnamurthy, A., 2001, “International and domestic collateral constraints in
a Model of Emerging Market Crises”, Journal of Monetary Economics 48 (3), pp. 513-548.
[10] Calvo, Guillermo A., and Carmen M. Reinhart, 2002, “Fear of Floating”, Quarterly Journal
of Economics 107 (2), pp. 379-408.
[11] Chang, Roberto, and Andres Velasco, 2001, “A Model of Financial Crisis in Emerging Mar-
kets”, Quarterly Journal of Economics 116 (2), pp. 489-517.
[12] Cspedes, Luis Felipe, Roberto Chang, and Andres Velasco, 2004, “Balance Sheets and Ex-
change Rate Policy,” The American Economic Review, Vol. 94(4), pp. 1183-93.
19
[13] Cowan, Kevin, Erwin Hansen, and Luis O. Herrera, 2005, “Currency Mismatches, Balance
Sheet Effects and Hedging in Chilean Non-Financial Corporations,” in External Vulnerability
and Preventive Policies, ed. by R. Caballero, C. Calderon, and L. F. Cespedes (Chile: Central
Bank of Chile).
[14] Foley, Fritz, Desai, M. A., and Kristin J. Forbes, 2008, ”Financial Constraints and Growth:
Multinational and Local Firm Responses to Currency Depreciations.” Review of Financial
Studies 21, pp. 2857-888.
[15] Eichengreen, Barry, and Ricardo Hausmann, 1999, “Exchange Rates and Financial Fragility,”
In New Challenges for Monetary Policy, Kansas City, Missouri: Federal Reserve Bank of
Kansas City, pp.329-368.
[16] Fazzari, S., R. Hubbard, and B. Petersen, 1988, “Financing Constraints and Corporate Invest-
ment”, Brookings Papers on Economic Activity, 1:141-95.
[17] Fazzari, S., R. Hubbard, and B. Petersen, 2000, “Investment-Cash Flow Sensitivities Are
Useful”, Quarterly Journal of Economics 115:695-705.
[18] Forbes, K., 2002, “How Do Large Depreciations Affect Firm Performance?”, International
Monetary Fund Staff Papers 49:214-38.
[19] Galindo, Arturo, Ugo Panizza, and Fabio Schiantarelli, 2003, “Debt Composition and Bal-
ance Sheet Effects of Currency Depreciation: A Summary of the Micro Evidence,” Emerging
Markets Review, Vol. 4(4), pp. 330-39.
[20] Goldstein, M., and Philip Turner, 2004, Controlling Currency Mismatches in Emerging Mar-
kets (Washington: Institute for International Economics).
[21] Gupta, P., D.Mishra, and R. Sahay, 2007, “Behavior of Output Response During Currency
Crises”, Journal of International Economics, Vol.72, Issue 2, pp. 428-450.
[22] Kamil, Herman, 2009, “How Do Exchange Rate Regimes Affect Firms’ Incentives to Hedge
Currency Risk in Emerging Markets?”, Washington, D.C., International Monetary Fund, un-
published.
[23] Graciela L. Kaminsky and Carmen M. Reinhart, 1999. “The Twin Crises: The Causes of
Banking and Balance-of-Payments Problems,” American Economic Review, vol. 89(3), pages
473-500, June
20
[24] Helpman, Elhanan, Melitz, Marc, and Stephen Yeaple “Export Versus FDI with Heterogeneous
Firms”, American Economic Review, Vol. 94, pp. 300-316.
[25] Kaplan, S., and L. Zingales, 1997, “Do Investment-Cash Flow Sensitivities Provide Useful
Measures of Financing Constraints?” Quarterly Journal of Economics, 112:169-215.
[26] Krugman, Paul, 1999, “Balance Sheets, the Transfer Problem, and Financial Crises,” Interna-
tional Tax and Public Finance, Vol. 6(4), pp. 459-72.
[27] Lamont, O, 1997, “Cash Flow and Investment: Evidence from Internal CapitalMarkets”, Jour-