58
A single tonne of CO 2 e - Provenance, perspective, progression Embodied Carbon Week Dr Craig Jones @CircularEcology
| Date post: | 18-Aug-2015 |
| Category: |
Environment |
| Upload: | circular-ecology |
| View: | 457 times |
| Download: | 3 times |

A single tonne of CO2e - Provenance, perspective, progression
Embodied Carbon Week
Dr Craig Jones
@CircularEcology

Contents
• About Circular Ecology
• Context
• Provenance - What is CO2e?
• Perspective - A single tonne of CO2e for:
• Transport
• Food
• Materials
• Progression - Reducing CO2e
• Summary

Embodied Carbon Week
• April 7-11th 2014 is ‘Embodied Carbon Week’
• Organised / funded by UK Green Building Council, Tishman
Speyer, WRAP, British Land, Land Securities and Derwent
London
• www.ukgbc.org/content/embodied-carbon-week-2014
• Embodied Carbon Week Twitter hashtag #ECW2014
Introducing Circular Ecology
• Set up in 2013 to offer the following services:
• Embodied carbon assessment
• Product carbon footprinting
• Water footprinting
• Streamlined and full life cycle assessment (LCA)
• Research
• Peer review
• Training
• Visit www.circularecology.com

Context:Sustainable Development
Provenance
Sustainable Development
There are over 200 definitions of sustainability –Sara Parkins, 2000
“Meeting the needs of the present without compromising the ability of future
generations to meet their own needs”
Brundtland Report, 1987
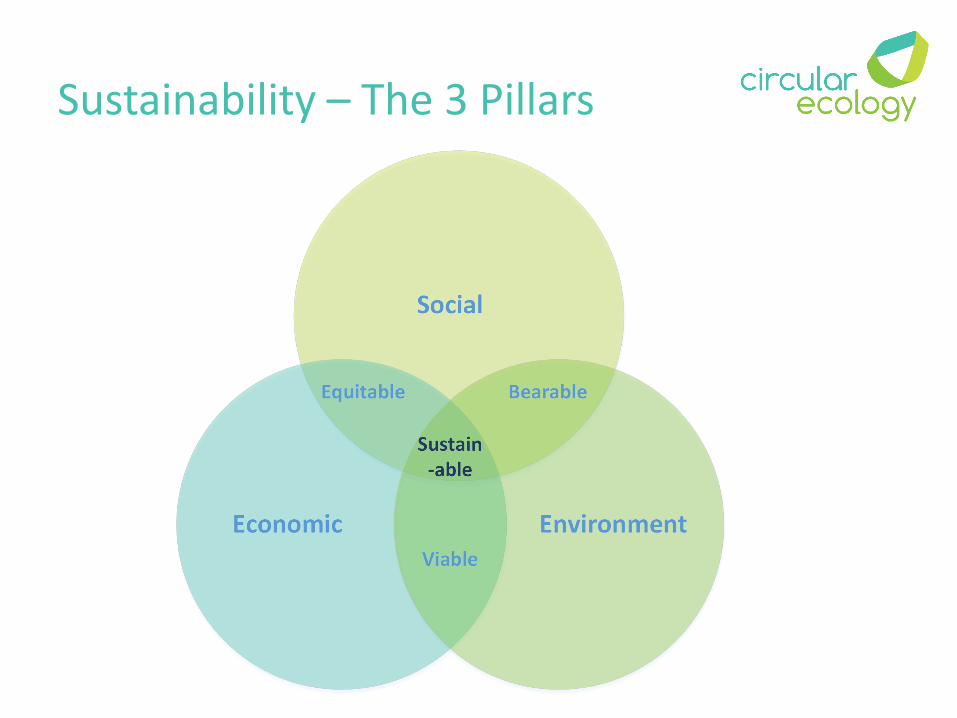
Sustainability – The 3 Pillars
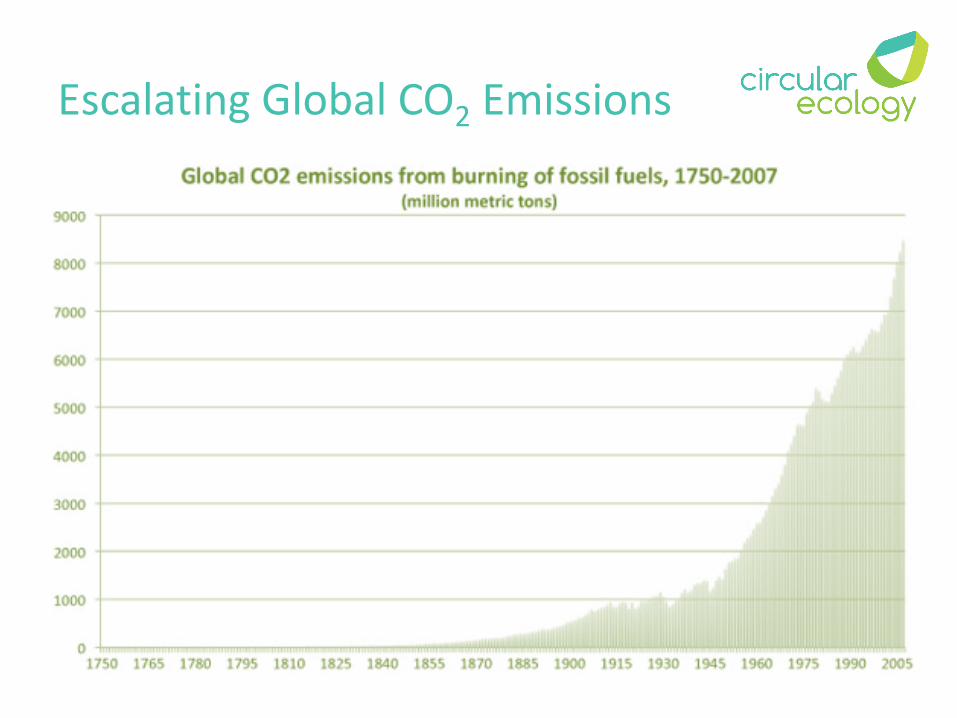
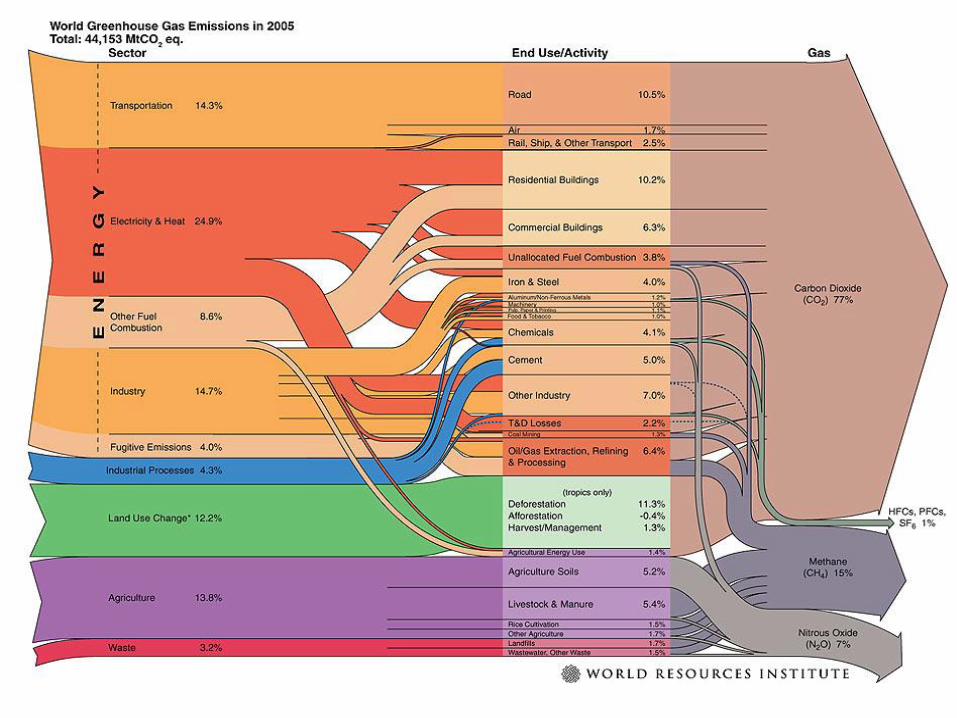
Escalating Global CO2 Emissions
Carbon Dioxide Equivalent
• But we are always talking about taking action on climate change and CO2 emissions….
• Global CO2e emissions have risen 50% from 1990
• Each 1 tonne of CO2e reduction has a part to play
• But what really is a tonne of CO2e? How do we put it into perspective?
What is CO2e?
Provenance
Carbon Footprints

It’s Not all About Carbon Dioxide
• Basket of 6 key GHGs:
• Carbon dioxide
• Methane
• Nitrous Oxide
• Hydrofluorocarbons
• Perflurorocarbons
• Sulphur hexafluoride

What’s a GHG Worth?
1 kg Carbon dioxide (CO2)+
1 kg Methane (CH4)+
1 kg Nitrous Oxide (N2O)
= ???
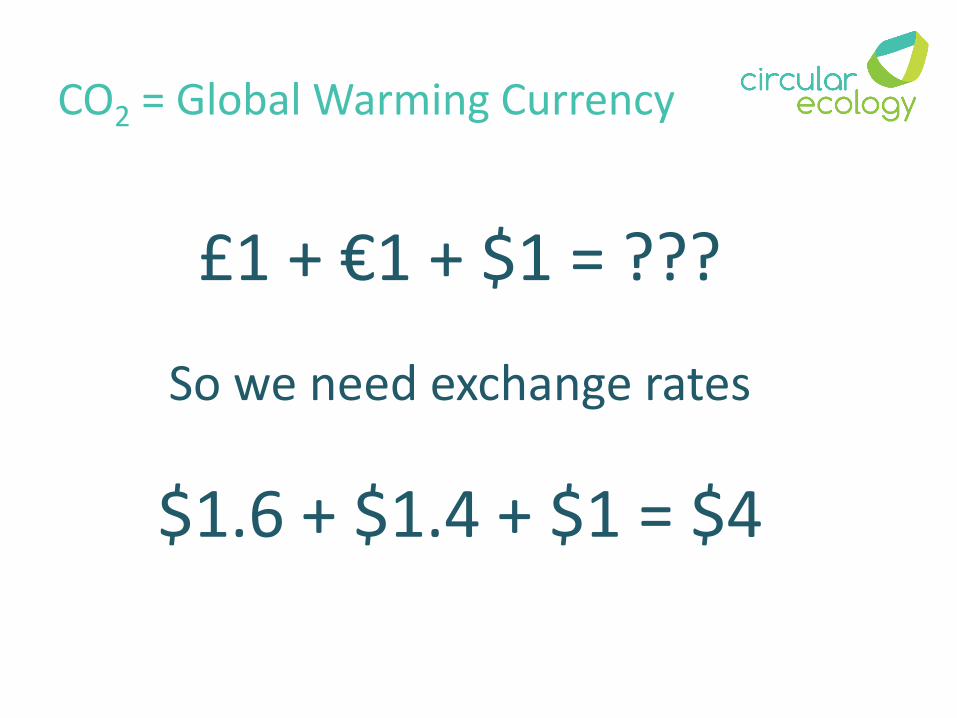
CO2 = Global Warming Currency
£1 + €1 + $1 = ???
So we need exchange rates
$1.6 + $1.4 + $1 = $4
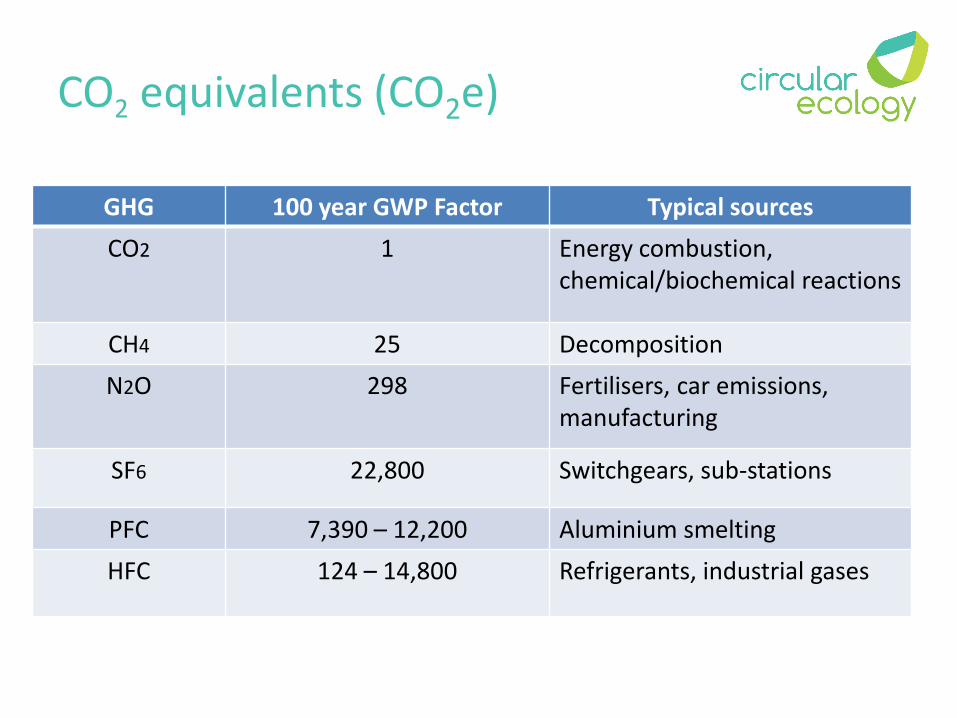
CO2 equivalents (CO2e)
GHG 100 year GWP Factor Typical sources
CO2 1 Energy combustion, chemical/biochemical reactions
CH4 25 Decomposition
N2O 298 Fertilisers, car emissions, manufacturing
SF6 22,800 Switchgears, sub-stations
PFC 7,390 – 12,200 Aluminium smelting
HFC 124 – 14,800 Refrigerants, industrial gases
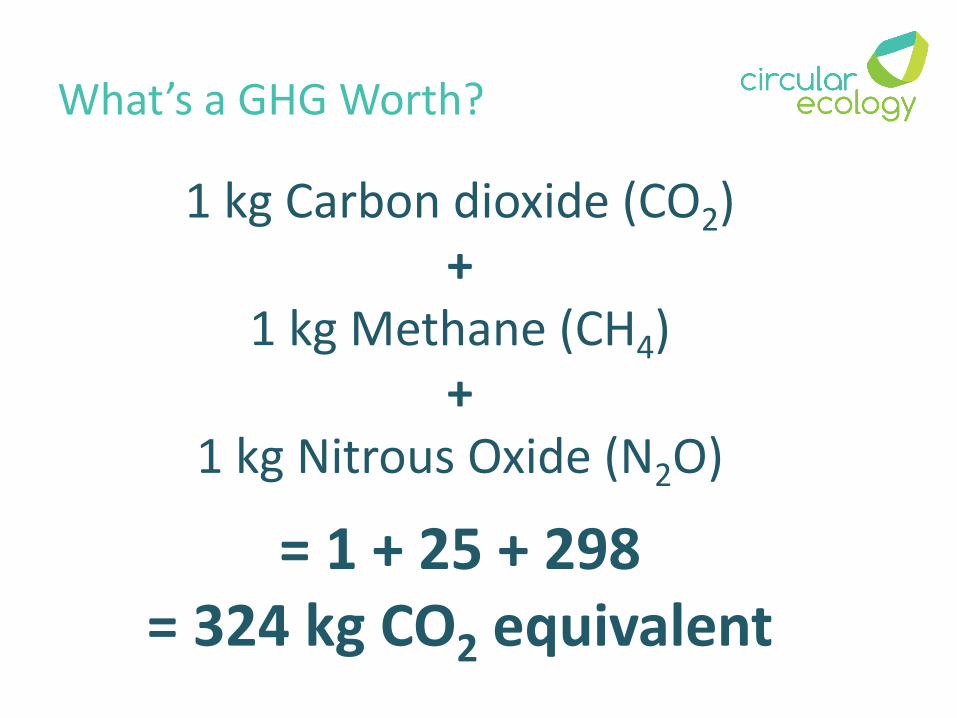
What’s a GHG Worth?
1 kg Carbon dioxide (CO2)+
1 kg Methane (CH4)+
1 kg Nitrous Oxide (N2O)
= 1 + 25 + 298= 324 kg CO2 equivalent
Transport
Perspective
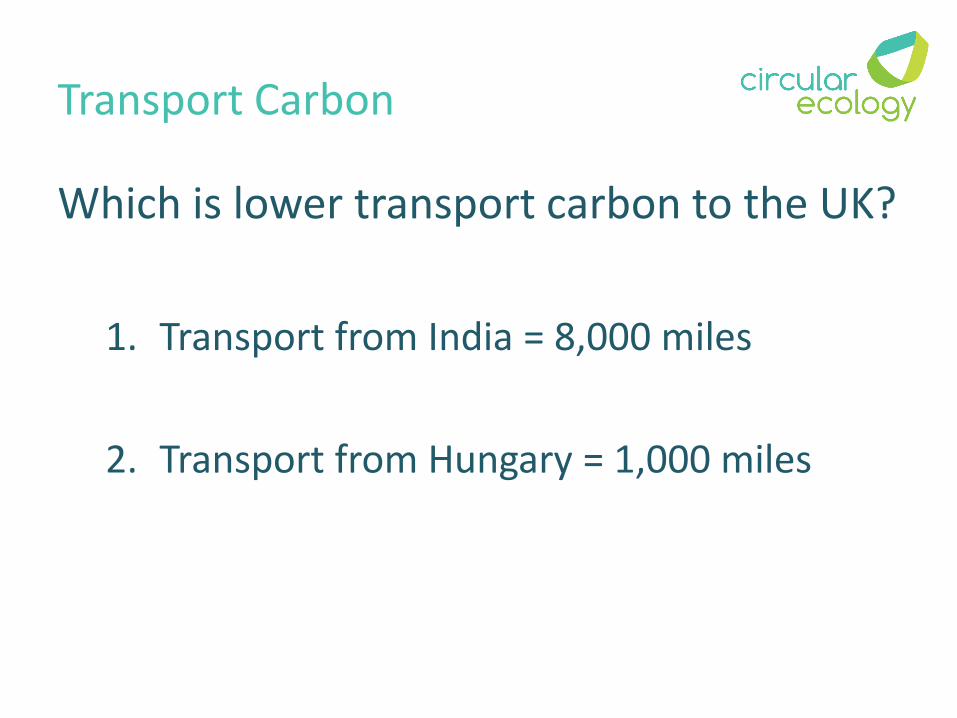
Transport Carbon
Which is lower transport carbon to the UK?
1. Transport from India = 8,000 miles
2. Transport from Hungary = 1,000 miles
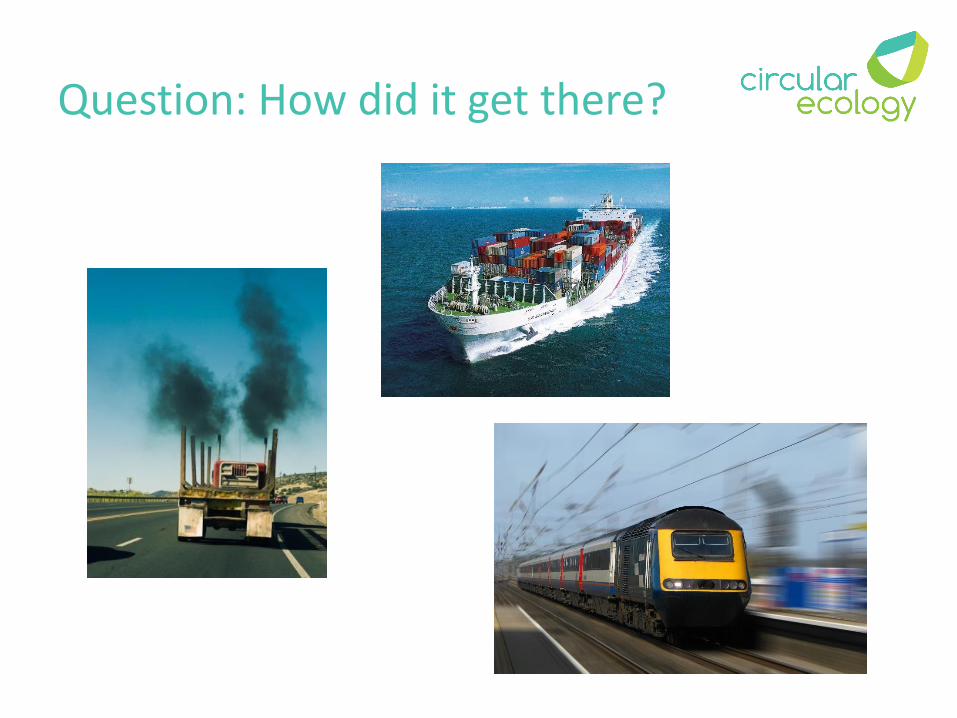
Question: How did it get there?
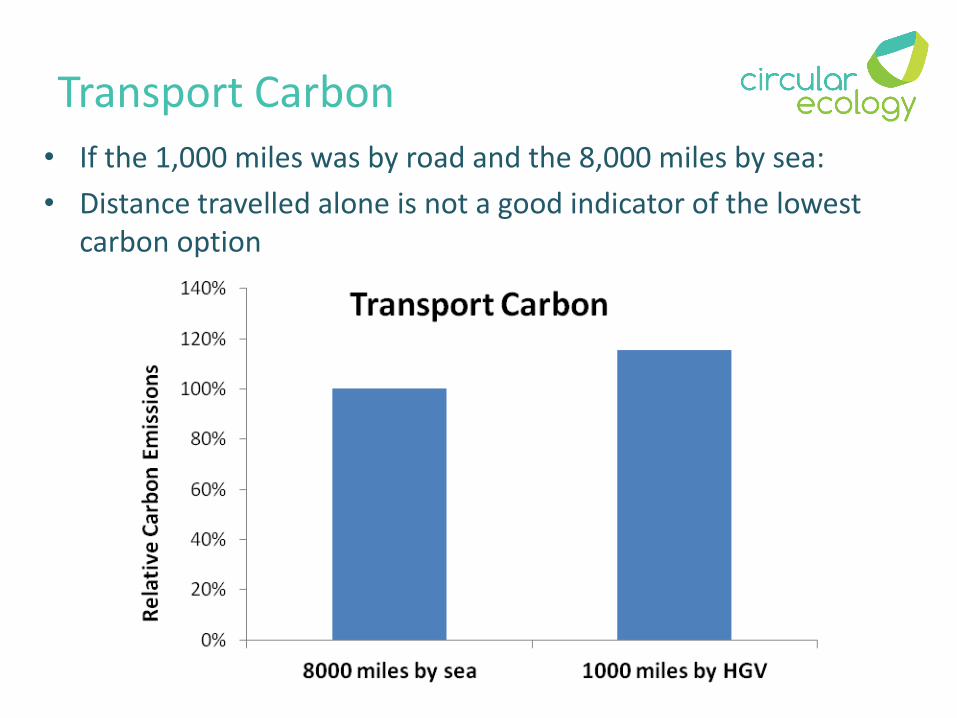
Transport Carbon
• If the 1,000 miles was by road and the 8,000 miles by sea:
• Distance travelled alone is not a good indicator of the lowest carbon option
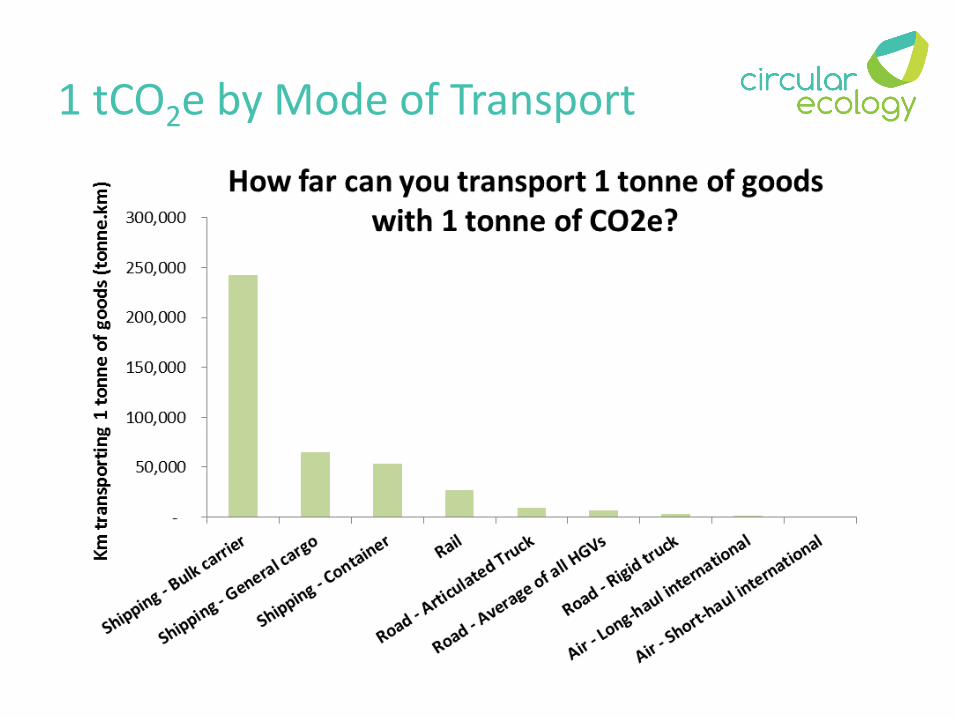
1 tCO2e by Mode of Transport
Food
Perspective

A Single tCO2e - Food
Q – Is the carbon footprint of food:
- High? or
- Low?
Let’s find out…
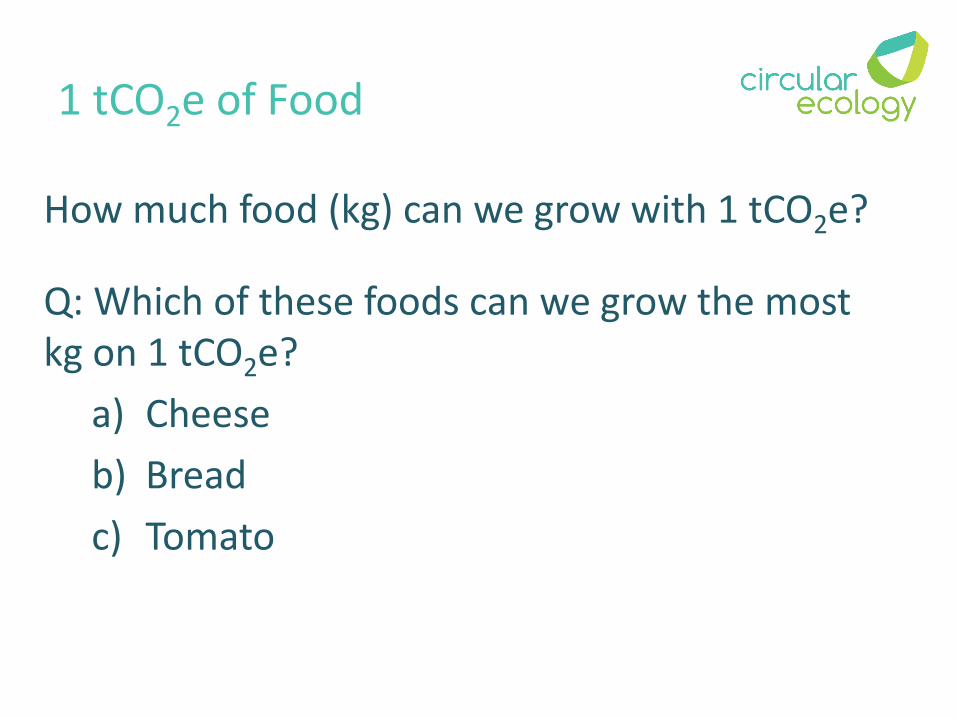
1 tCO2e of Food
How much food (kg) can we grow with 1 tCO2e?
Q: Which of these foods can we grow the most kg on 1 tCO2e?
a) Cheese
b) Bread
c) Tomato

1 tCO2e of Food

1 tCO2e of Food
How much of each drink (litres) can we produce with 1 tCO2e?
Q: Which of these drinks can we produce the most litres on 1 tCO2e?
a) Wine
b) Lager
c) Cider
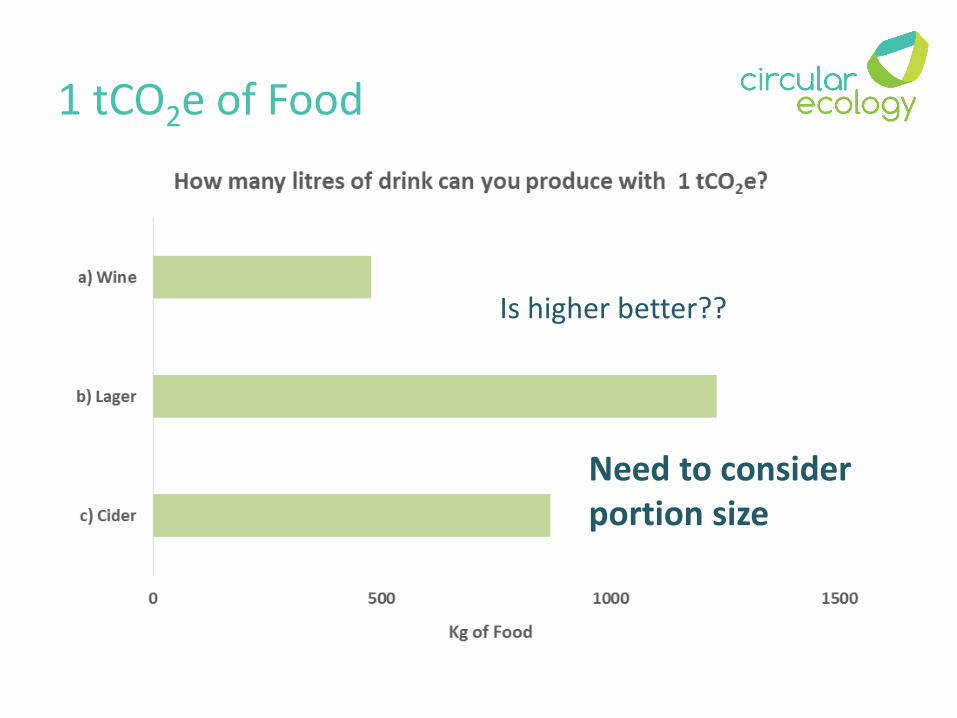
1 tCO2e of Food
Is higher better??
Need to consider portion size
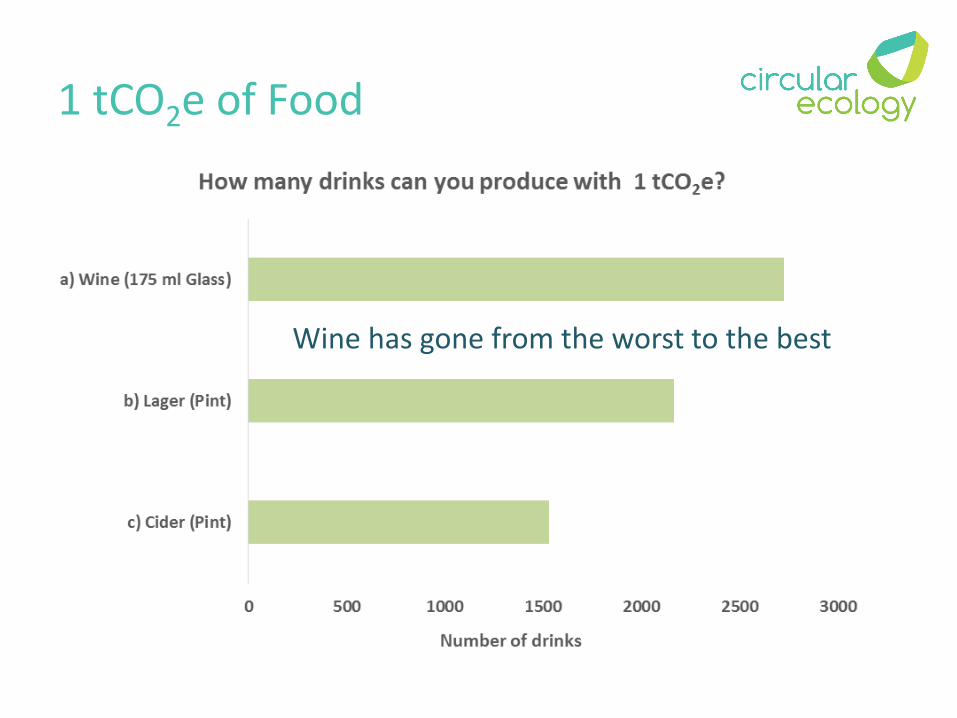
1 tCO2e of Food
Wine has gone from the worst to the best
Food
So litres or Kg of different foods isn’t a fair comparison.
Q: Which of these fruits has the lowest carbon footprint?
a) A banana
b) An orange
c) An apple
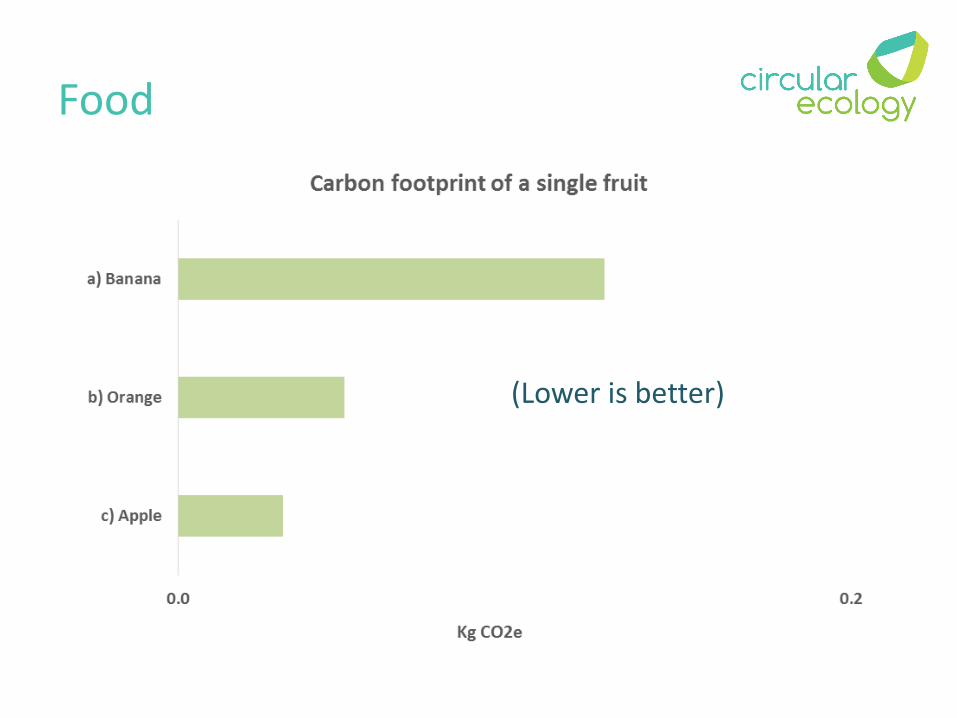
Food
(Lower is better)
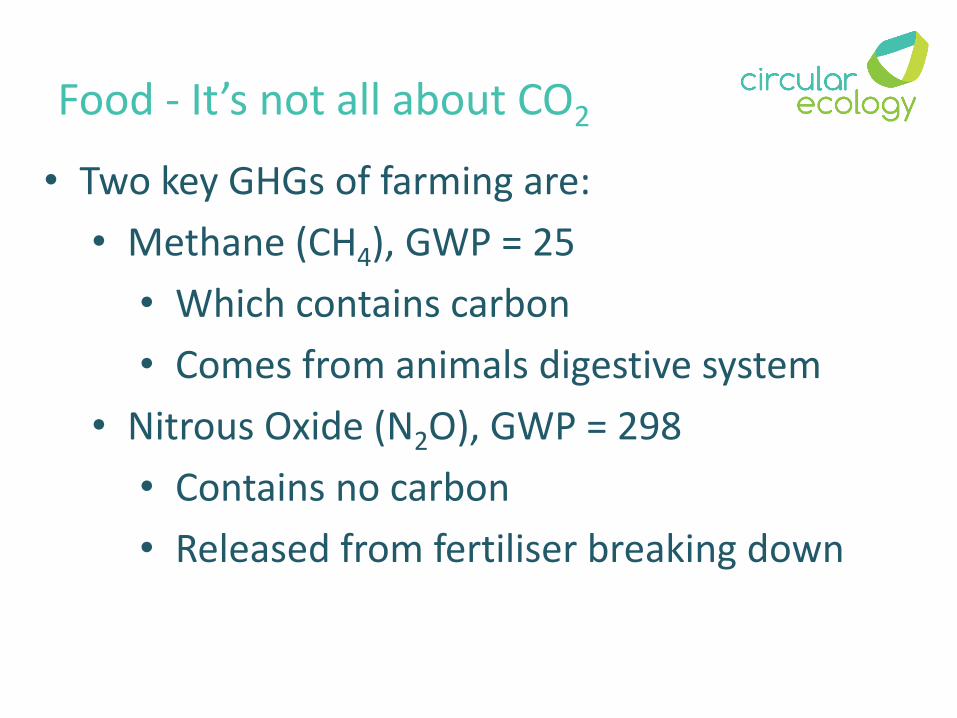
Food - It’s not all about CO2
• Two key GHGs of farming are:
• Methane (CH4), GWP = 25
• Which contains carbon
• Comes from animals digestive system
• Nitrous Oxide (N2O), GWP = 298
• Contains no carbon
• Released from fertiliser breaking down
Materials
Perspective
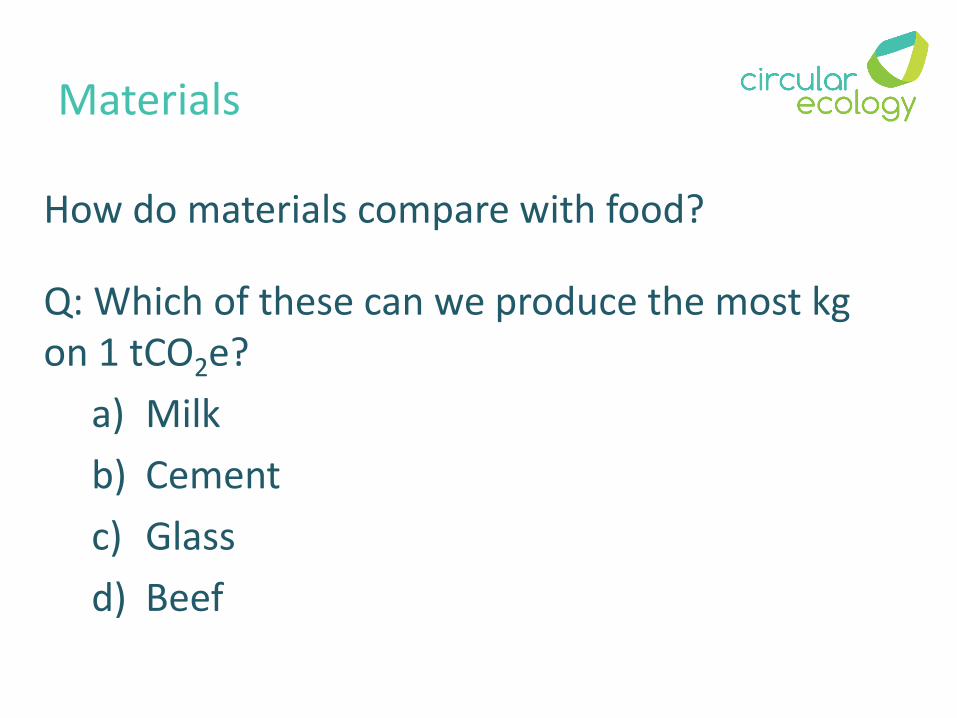
Materials
How do materials compare with food?
Q: Which of these can we produce the most kg on 1 tCO2e?
a) Milk
b) Cement
c) Glass
d) Beef

Materials

Materials
“More CO2e is released to make 1 litre of milk than to make 1 kg of recycled steel”
In fact: 2.5 times more
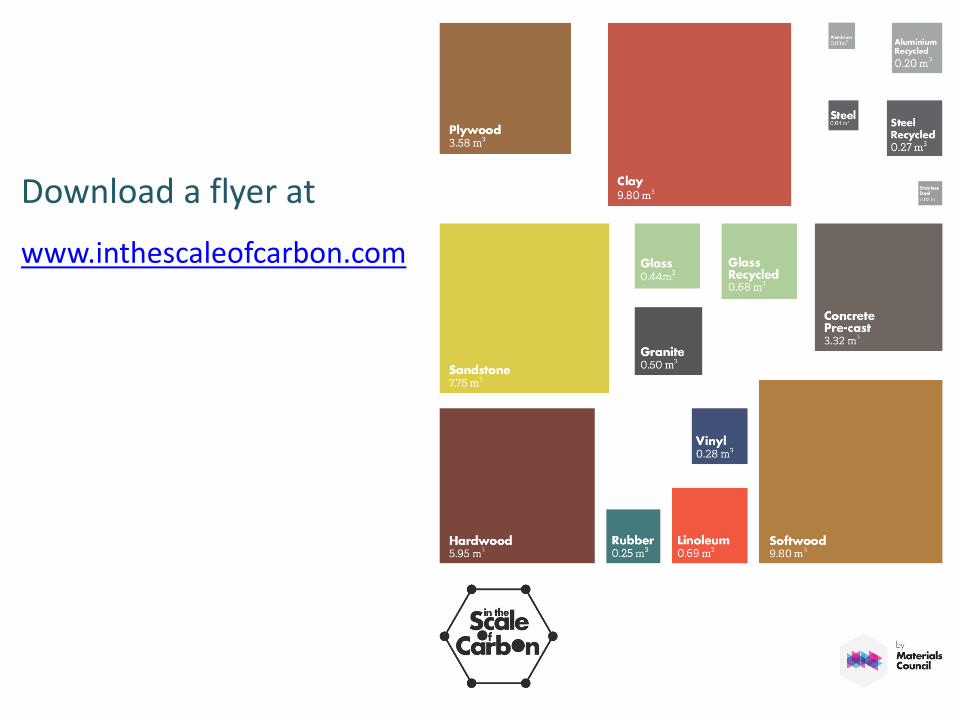
In The Scale of Carbon
Perspective
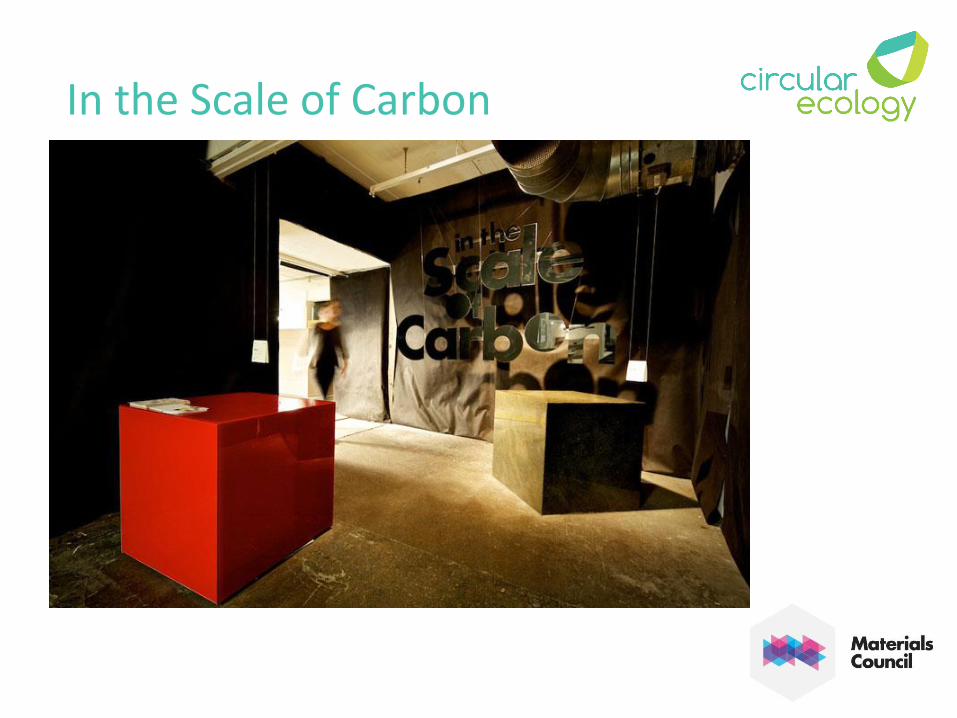
In the Scale of Carbon
• Exhibition lead by Materials Council
(http://www.materialscouncil.com) and supported by
Circular Ecology
• Aim: To put into context what 1 tonne of CO2e means
for different materials
• What does it look like as a volume of steel, glass,
timber…?
In the Scale of Carbon
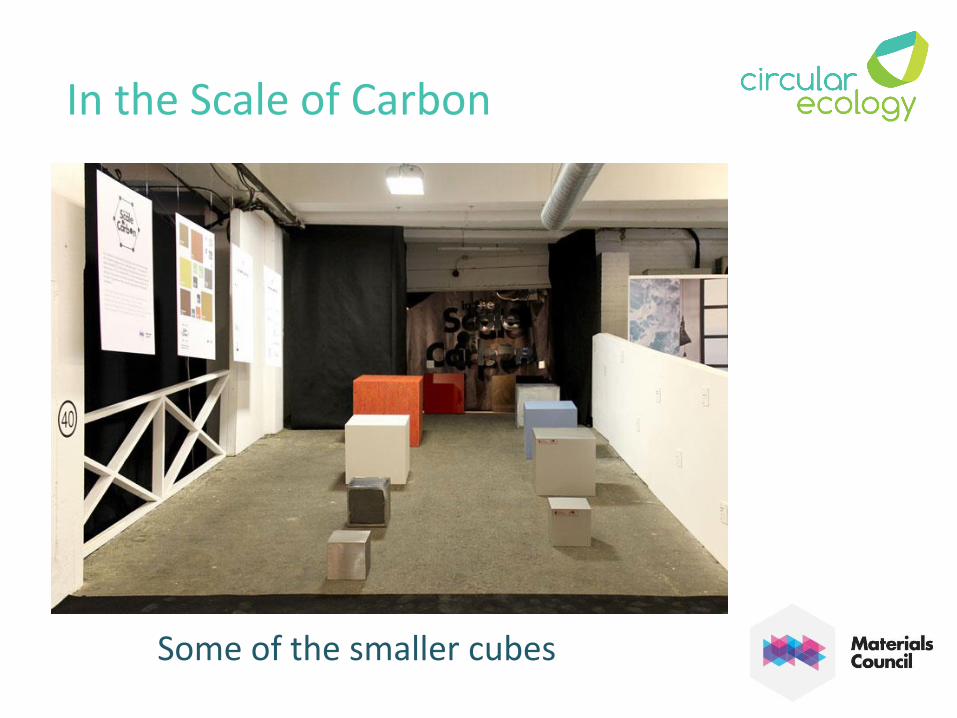
In the Scale of Carbon
Some of the smaller cubes
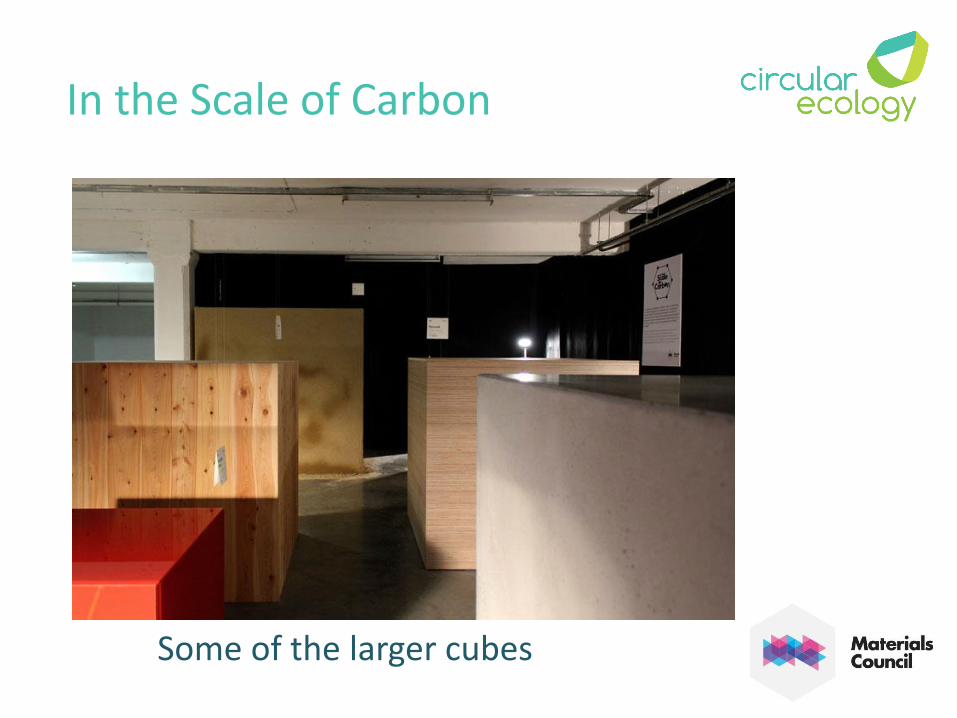
In the Scale of Carbon
Some of the larger cubes
Materials
• Of course volume of materials isn’t a completely fair
comparison
• How much of each material do you need to provide a
set function?
• But it is better than comparing per kg
• And it’s more visual, which helps considerably to put
into perspective what CO2e really means
In the Scale of Carbon
• More information from this exhibition at:
• www.inthescaleofcarbon.com
• www.materialscouncil.com
• www.circularecology.com/1/post/2013/09/post-event-blog-
in-the-scale-of-carbon-exhibition.html
• www.materialscouncil.com/exhibitionsandevents/in-the-
scale-of-carbon/
Reducing CO2e
Progression
Progression
“Reducing carbon does not mean
increasing cost”
Progression
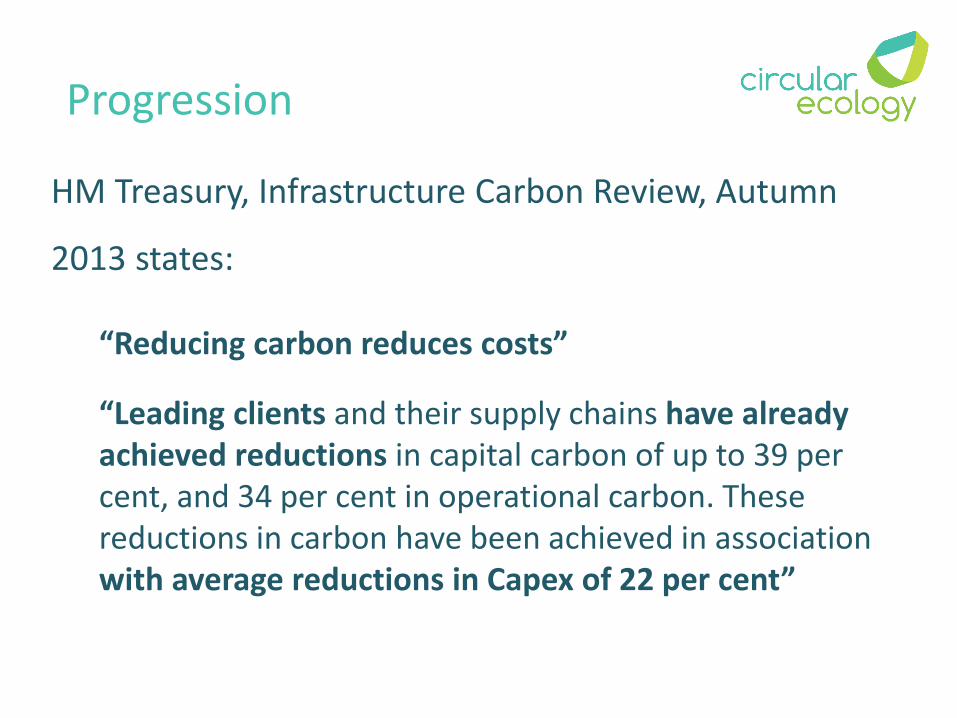
HM Treasury, Infrastructure Carbon Review, Autumn
2013 states:
“Reducing carbon reduces costs”
“Leading clients and their supply chains have already achieved reductions in capital carbon of up to 39 per cent, and 34 per cent in operational carbon. These reductions in carbon have been achieved in association with average reductions in Capex of 22 per cent”

London 2012 Olympic Stadium
2012 Olympics
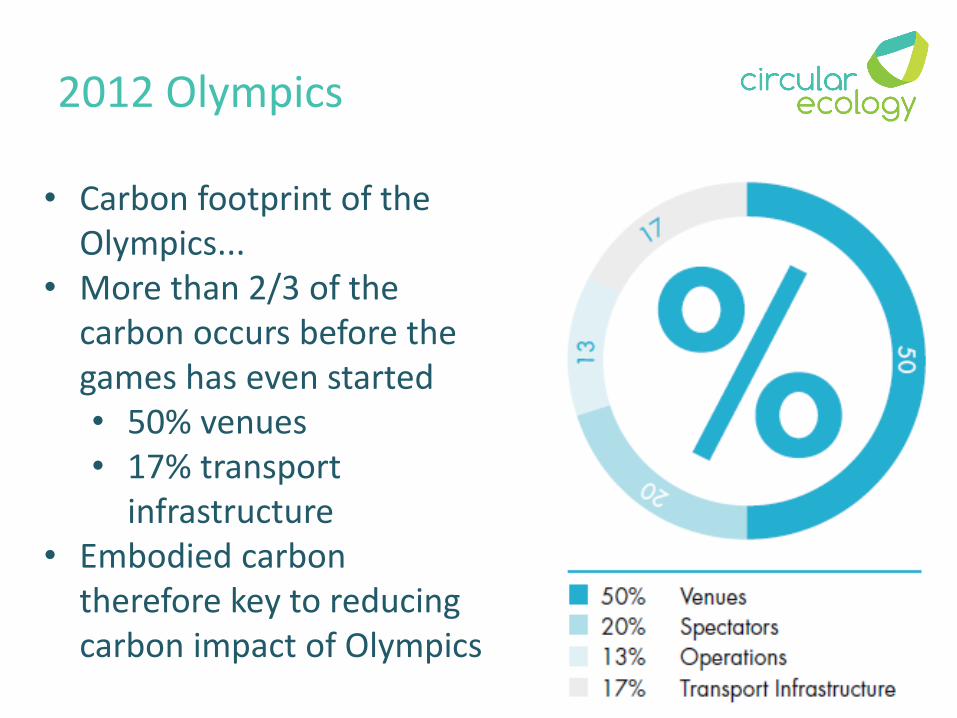
• Carbon footprint of the Olympics...
• More than 2/3 of the carbon occurs before the games has even started• 50% venues• 17% transport
infrastructure• Embodied carbon
therefore key to reducing carbon impact of Olympics
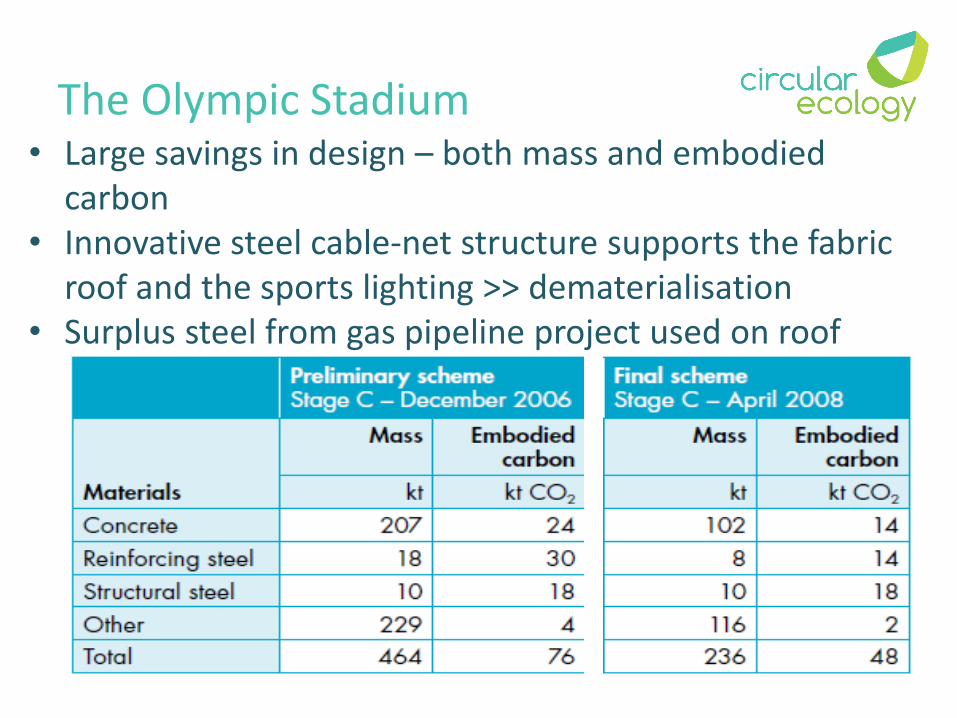
• Large savings in design – both mass and embodied carbon
• Innovative steel cable-net structure supports the fabric roof and the sports lighting >> dematerialisation
• Surplus steel from gas pipeline project used on roof
The Olympic Stadium
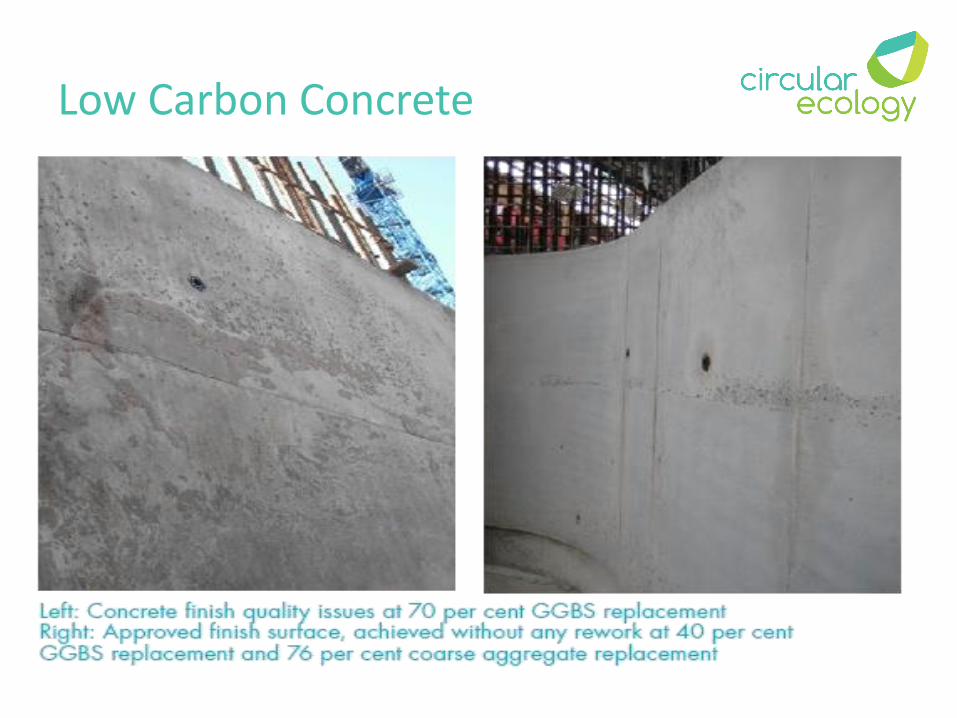
Low Carbon Concrete
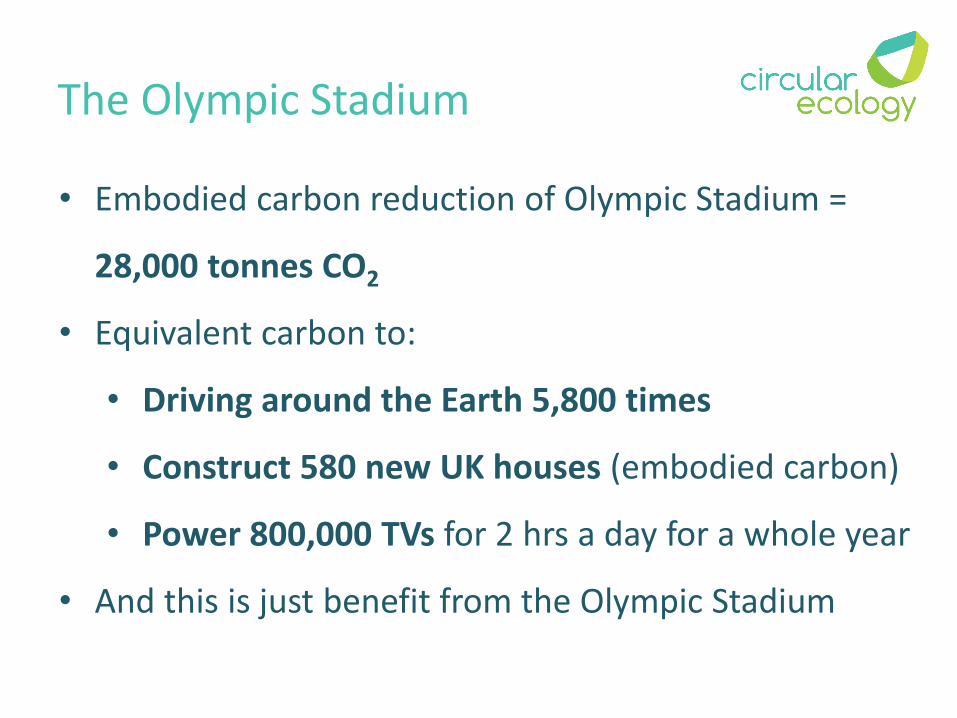
The Olympic Stadium
• Embodied carbon reduction of Olympic Stadium =
28,000 tonnes CO2
• Equivalent carbon to:
• Driving around the Earth 5,800 times
• Construct 580 new UK houses (embodied carbon)
• Power 800,000 TVs for 2 hrs a day for a whole year
• And this is just benefit from the Olympic Stadium
Progression
• You have considerable influence
• When you design
• When you specify
• When you purchase
• When you dispose
• So use your influence
Closing Thoughts
A Single tCO2e
Key References
• Transport - Defra GHG emissions factors for company reporting
• www.ukconversionfactorscarbonsmart.co.uk
• Food – WRAP “An initial assessment of the environmental impact of grocery products”
• www.wrap.org.uk/priorityproducts
• Materials – ICE Database
• www.circularecology.com/ice-database.html
A Single tCO2e
• This webinar has been video recorded and will
be made available online
www.circularecology.com
• Upcoming online training courses:
• Embodied energy and carbon training
• Life Cycle Assessment (LCA)
• www.circularecology.com/training.html
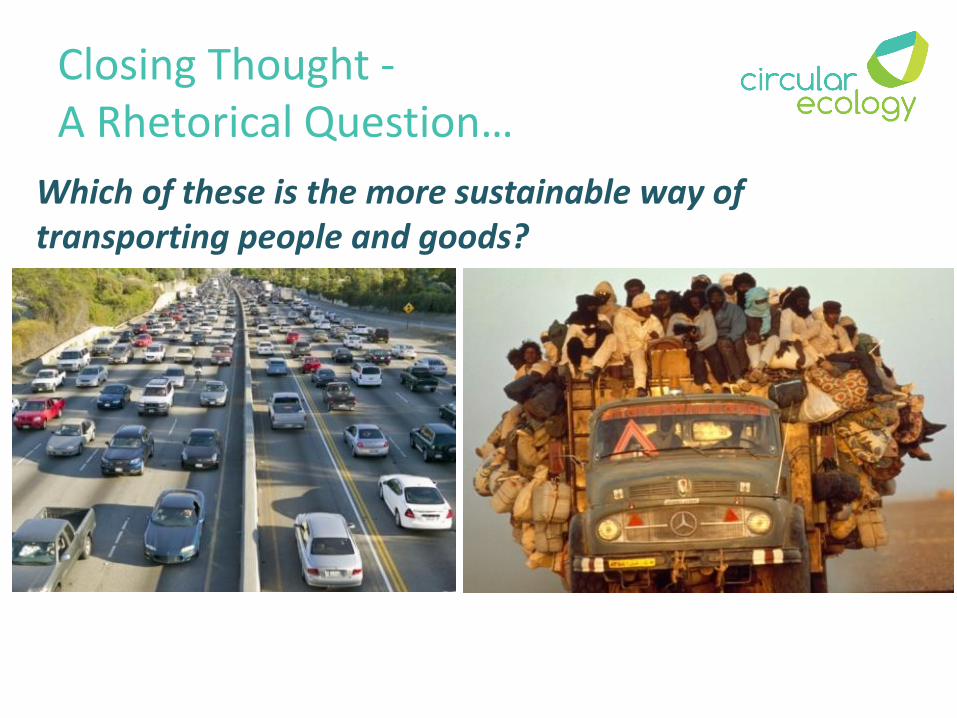
Closing Thought -A Rhetorical Question…
Which of these is the more sustainable way of transporting people and goods?