What is a Valid Data Center Model ? An Introduction to Calibration for Predictive Modeling Future Facilities’ White Paper FFL-007 Revision 1.0 Mark SeyMour director Steve DavieS product marketing manager Executive Summary This paper, written for data center consultants and owner- operators, introduces and outlines the importance of using calibration to validate data center models used for predic- tive modeling. It highlights the general need to calibrate, and the specific need to create accurate 3D models to begin with. It goes on to show why, without calibration, the results of simulation can be very misleading. Finally, it provides specific guidance for modeling and calibrating the air sup- ply, air delivery, power and temperature components of a data center. “... it is critical that a systematic calibration process is adopted in order to avoid “garbage in – garbage out” and deliver the full potential of maximizing availability, capacity and efficiency”
Transcript
What is a Valid Data Center Model? An Introduction to Calibration for Predictive Modeling
Future Facilities’ White Paper FFL-007 Revision 1.0
Mark SeyMour directorSteve DavieS product marketing manager
Executive Summary
This paper, written for data center consultants and owner-operators, introduces and outlines the importance of using calibration to validate data center models used for predic-tive modeling. It highlights the general need to calibrate, and the specific need to create accurate 3D models to begin with. It goes on to show why, without calibration, the results of simulation can be very misleading. Finally, it provides specific guidance for modeling and calibrating the air sup-ply, air delivery, power and temperature components of a data center.
“... it is critical that a systematic calibration process is adopted
in order to avoid “garbage in – garbage out” and deliver
the full potential of maximizing availability, capacity and
What iS a valiD Data center MoDel? an introDuction to calibration For PreDictive MoDeling
Introduct ion
This document serves as an introduction to the need for calibration, an essen-tial element of using simulation (Figure 1) for troubleshooting and on-going
operational management of the data center white space/data hall using predic-tive modeling.
In this context, predictive modeling is focused on using airflow simulation in the form of computational fluid dynamics (CFD) to balance availability, physical ca-pacity and efficiency (ACE). It does so by analyzing the delivery of cooling airflow to the IT equipment, and by enabling the user to identify the configuration that achieves the optimum ACE balance at a reduced cost per kW of connected IT.
This document is supported by a series of complementary texts that drill down into the topics covered below, providing additional detail and offering the reader a greater level of understanding. Visit futurefacilities.com/media for more informa-tion, including access to the following papers as they become available:
• Measuring Critical Airflows and Temperature in the White Space
• Identifying Modeling Improvements when Calibrating a White Space Model
• Working with Discrepancies between White Space Simulation and the Real World
• Making a Calibrated Perforated Tile/Floor Grille model
• Key Elements to Modeling an IT Rack/Cabinet
Figure 1 (above)
Example virtual facility model for an operational data com hall. The detail and accuracy of this full 3D representation will directly influence the quality of the predictive modeling results that it produces. Models like this one form the heart of the operational decision making loop for many of the world’s leading data center owner-operators
Techspeak
calibration
the use of measured data to check that the model reflects real-ity and any necessary model refinement that follows
This document is not intended to provide a guide to predictive modeling but, for completeness, includes a short description of its uses for a data center’s
‘white space’ – the room where the IT equipment is housed.
Predictive modeling is a general term that describes predicting the behavior of a system by using a computer generated model. For a white space, the model is normally a single room, but there are notable exceptions:
• Where there are service corridors that house the cooling units and these service corridors also form part of the return and/or supply air plenums
• Where the white space is connected to an adjoining space with which it shares the cooling or has a common supply or return air plenum.
In such cases, if computer resources allow, it is best to include the connected spaces in a single model. In the case of adjacent halls that are disconnected, it is best to create separate models so that the calculations can be run independently when changes are made to only one space.
Predictive modeling can include prediction of the future for any key capacity related element: space, power, cooling and network being the principle elements. As cooling is by far the most complex element, it is the subject for calibration and this document.
For cooling, predictive modeling takes the form of computational fluid dynamics (CFD) to predict the airflow and heat transfer throughout the hall. The availability of cooling for a chosen location, or indeed any item of IT equipment that may be present now or in the future in some proposed configuration, can thereby be predicted.
Why Cal ibrate?Data centers are extremely complex spaces that intrinsically deviate from design. During design, the space is assumed to be constructed with notional uniform loads. This assumption is made without consideration of real IT equipment, the practicalities of installing them, their associated cabling etc. The details, if in-cluded in full, would almost certainly make a CFD model intractable and therefore useless for business purposes.
The key is to model the white space as simply as possible. The responsibility for this rests not only on the user (and the CFD software suppliers’ libraries) making appropriate assumptions, but also on them making due diligence checks that the model is actually representative of the end product.
In the case of the design stage, where real life measurements cannot be made, the user must follow best practice in making their assumptions. They do so in parallel with gathering as much information as possible from the client about how they are likely to use the space – typical IT equipment types and conceptual layouts, operational practices etc.
In operation, this due diligence must be based on review and measurement of the actual installation. Why? Because many of the assumptions used in design about installation and operation are not reflected in reality, and many elements are difficult to qualify. For example, measuring flows through the perforated floor tiles, Figure 2, and comparing them with the simulated values, Figure 3. The blue would represent good upward cooling and red, if there were any, very poor down-ward flow.
On first sight of Figures 2 and 3, they look strikingly similar. To the untrained eye the colored and sized bars, which denote magnitude of the airflow through each perforated tile, might appear very similar. The key though is to look more closely by differencing the flows and plotting the differences, Figure 4.
The differences illustrated by Figure 4 can now be seen very clearly. Ideally we’d like all the differences to be in the +/-10% range, which would mean all grilles were green in color. Instead, we can see that there are some notable exceptions, in particular one large over-prediction. However there are also some systematic differences; higher flow over-predictions along the center line, where the oppos-ing flows of the cooling units meet; and some under-predictions nearer the cool-ing units.
The systematic errors may result from more systematic modeling errors (e.g. underestimation of the perforated tile flow resistance or under-estimation of general cabling resistances).For the localized errors, we need to look for incor-rectly modeled features (e.g. incorrect damper setting) or missing features (e.g. underfloor obstruction).
The modeling challenge in operation compared with design can be seen in a simple example. A uniform equipment deployment is used in design, where in reality it may be somewhat varied, Figure 5.
The cabinet for design simulation is half full of front-to-back ventilated servers (Figure 5, left-most cabinet) providing a load of 4.25 kW per rack/cabinet. In an
Figure 5 (left)
Generic server cabinet for design versus more typical equipment configurations during operation. In the left-most cabinet are front-to-back servers (as expected during design). But the cabinets to its right all feature a wide range of equipment - equipment that was not anticipated during design, and which dramatically affects airflow and cooling requirements
What iS a valiD Data center MoDel? an introDuction to calibration For PreDictive MoDeling
operational data center however, the equipment installed varies from cabinet to cabinet (Figure 5, all other cabinets) as does the load. When such equipment is installed, the thermal performance may be significantly different, Figure 6.
This type of “difficult to determine” data is highly prevalent in data centers, and the list is considerable. It includes damper settings, cable penetration open areas, in-cabinet leakage, IT equipment airflows and so on.
If the initial view model is used without any review, the results can be very error prone. For example, if cabling were modeled as completely blocking when in fact it is quite open the predicted flows will be completely wrong in that vicinity.
However, experience has shown that if models are based on surveys from the existing data center, measured data can be used to identify where the model needs revisiting. This allows settings to be corrected sufficiently to achieve useful results from an engineering perspective, allowing deployment decisions to be made.
Model Cal ibrat ion – The Key Elements
Model calibration is the process of measurement and model correction. The objective is to ensure that the simulated results are sufficiently representa-
tive for any predictions to be useful for engineering or deployment decisions.
For avoidance of doubt, model correction is exactly that: model details are modi-fied to ensure better representation – simulation results are not fixed to mea-sured values, a practice that some modelers and modeling tools have adopted. The practice of fixing results to measured data is useless if the model is to be
Figure 6 (below)
Designed for a white space that contains a uniform load (left), in reality the data center fills over time with a non-uniform load (right). The implications to airflow are severe, as shown by the presence of red (overheat) and yellow (borderline overheat) IT on the right
used for the prediction required for operational management, deployment or in-deed refurbishment/upgrade, because the model cannot then respond to change.
Given the importance of temperature and airflow measurements, it is useful to have tools that give readings quickly, even if only to determine where to make more accurate readings. A good example of such tools is the thermal imaging camera, which provides a useful tool for understanding temperature destitution and where to place data logging sensors.
Tough Model ing Decisions When Bui ld ing the Model
When building a model of the white space, it is important to consider each element in the facility with respect to its influence on air delivery and
scavenging by the cooling system. Equally important is to represent the heat and airflow sources in the white space, most notably the IT equipment.
This presents considerable challenges because many of the features are not well defined. Some obstructions, such as chilled water pipes under a cooling unit, are often significant enough to represent explicitly, Figure 7.
Figure 7 (below)
Cooling pipes underneath a down-flow perimeter cooling unit are the sort of airflow obstruction that requires explicit modeling
Figure 8 (left)
Cables that appear to block airflow when viewed from the side (left and middle) often transpire to be much less of an obstruction when viewed head on (far right)
What iS a valiD Data center MoDel? an introDuction to calibration For PreDictive MoDeling
However, other structures that represent potential obstructions must also be considered. Pipes, conduits, cables and cable trays can be represented with vari-ous degrees of simplification, or indeed, not included at all. The modeling decision is challenging because the choice will not only depend on the size of the obstruc-tion, but also on its location in relation to airflow paths and key airflows.
Figure 8 (p.7) illustrates that views of cables can be very misleading. Imagine a group of loose cables descending from above. If the cables are not bound together, there is no reason for them to form a tight grouping. The modeler needs to describe how open the cable obstruction is to airflow between the cables. Yet, when viewed from the side, the degree of obstruction is very misleading.
Another similar challenge is to decide what gaps are significant, and whether they should be included explicitly, represented as a porous surface, or not represented at all? Gaps can occur in many locations, but again the location can be as criti-cal as the size. For example, gaps in items that segregate airflows are normally significant. Examples of critical surfaces are the raised floor, containment, and gaps that connect the front and the back of the cabinet.
Lastly, but by no means least, it is often difficult to determine the characteristics of equipment in the space; both infrastructure and IT. For the gross design of a data center, very simplified data is required: maximum heat dissipation or cooling capacity, nominal airflow and overall geometry are normally sufficient. These can be significantly different to the values achieved in operation. Figure 9 shows two different blade center models with the same processors running the same work-load but with different cooling strategies, i.e. using different airflows.
Figure 9 (below)
Two different blade center models with the same processor configurations and workload, but cooled using two different strategies
Given all these uncertainties, it is important to understand the potential uncertain-ty when constructing the models and then use measured data to help determine the appropriate settings.
The following high level overview describes the basis for calibrating some of the key elements. Of course, the calibration has to consider the overall picture as well as the individual elements of calibration, but these guidelines are intended to provide a good starting point.
Cal ibrat ing the Air Supply System
Cooling units are difficult to model, largely because the information known about them is quite limited. This is for two main reasons:
• Manufacturer-supplied data is limited to geometric information. It is also limited to the standard method of test performance figures that do not include important details for modeling (flow discharge characteristics, for example)
• Performance in operation is affected by choices/settings made at installation and during operation, not to mention the impact of the environment that the cooling unit is placed in.
As a result, the actual performance will need to be determined from onsite mea-surements. Measurements are largely confined to air volume flow rate and supply and return temperatures.
Temperature MeasurementIt is easy to imagine that a single measurement will adequately characterise the return air temperature. But this is not actually the case: temperatures can vary considerably over the face of a typical downflow unit return, often as much as 5°C or more, Figure 10. It is therefore important to take multiple readings around the perimeter and over the face.
Measuring temperature in the supply airstream is normally more straightforward. If the return air tem-perature is relatively uniform, a single measurement in the supply airstream is sufficient. If there are multiple fan discharges and there is significant variation in temperature at the return, a single measurement for each fan discharge may identify temperature varia-tions also.
Figure 10 (above)
Typical variation in temperature across the return air filter of downflow unit. In this instance, the temperatures range from 18°C to 26°C
What iS a valiD Data center MoDel? an introDuction to calibration For PreDictive MoDeling
Airflow MeasurementAirflow measurement is more challenging.
Close to the air discharge, the airflow is normally very fast and turbulent. This makes it almost impossible to estimate flow rate by measuring supply air veloci-ties.
The alternative is to measure the flow going back to the return. If the cooling unit has a duct leading to it, a traverse of the duct airflow according to ASHRAE Fun-damentals, 2013 is all that is required.
If there is no duct leading to the inlet of the cooling unit, then it is important to get the measuring device as close as possible to air return. This is important because the suction drags air from any and all directions open to it. There are therefore very strong cross velocity components near the perimeter that should not be included and, if included, will result in a significant overestimate of the airflow.
Using a vane anemometer helps to avoid measuring these non-perpendicular components of velocity, but if the vane is any significant distance away from the return, it will almost certainly result in an under reading. This is because non perpendicular flows will simply bypass the vane and enter the filters between the return and the anemometer.
CalibrationGiven a good understanding of the airflow and temperature, calibration can now begin. The airflow data and temperature values can be used to make appropriate settings and/or check and adjust the controls.
If the airflow rate is fixed, then use the measured airflow rate to reset the cooling unit fixed flow rate. If the airflow rate is controlled, then check the controls are achieving the flow rate measured. If not, check the sensor location and if the sensor(s) is (are) located correctly, and check the model to see if there are signifi-cant gradients of the sensed variable in that location. If there are not gradients, the cause of poor prediction must be determined. If there are gradients, the sen-sor location may need to be moved slightly to achieve the readings occurring in practice.
Do not overlook the fact that it is not just the bulk airflow that matters, but also the flow distribution – check the flow velocity in different directions from the cooling unit supply/supplies. This can be critical in cooling systems using local cooling, such as in-row systems as well as in-perimeter cooled systems. As mea-surement is challenging in the supply airstream, the direction can be observed
“Do not overlook the fact that it is not just the
bulk airflow that matters, but also the flow distribution”
by using lightweight streamers to observe direction in order to determine the distribution of the measured air volume.
Calibration based on temperature is similar. If the controls are designed to supply at a fixed supply air temperature, then:
• Check whether there is any reason the cooling unit cannot achieve the set point
• If so, ensure the limitation is included in the model/that the model captures the physics that result in reaching the limit
• If not, adjust the control temperature to reflect the actual control behavior.
If the cooling unit controls return temperature, then consider the above but also pay attention to whether the model sensor location is appropriately set to capture the true sensor position which is often not published.
If the controls act on temperature(s) measured in the body of the white space, remember also to check for local gradients and adjust the sensor location or check for overall prediction quality and refine the model as necessary.
Cal ibrat ing the Air Del ivery System
Calibration of the air delivery system is generally very important – if the cool air distribution and warm air scavenging are not well modeled, the simulation
may not be useful at all.
Key aspects for calibration are:
Raised floor cooling distribution systems• Checking the underfloor blockages
• Ensuring a good model exists of the perforated floor tiles (and any dampers in the system)
• Reviewing air leakage paths through the raised floor e.g. cable penetrations.
Discrepancies will commonly occur because of the difficulty in establishing quantitative characteristics. For example, the items above are all difficult to quantify – underfloor blockages such as cables are not well defined because of their potentially unstructured nature; factors like damper settings can vary continuously between open and closed; and cable penetration blockage typically
What iS a valiD Data center MoDel? an introDuction to calibration For PreDictive MoDeling
comes from loose cables or seal material like brushes, making the open area very difficult to determine.
The best indication of where there are errors is to measure the airflow through the raised floor tiles. This is not as straight-forward as it may appear. Given the large number of perforated tiles in an enterprise data center, the generally open nature of the raised floor plenum and low resistance/pressure drop associated with high flow perforated tiles, placing a measure-ment device over a raised floor tile can significantly affect the flow.
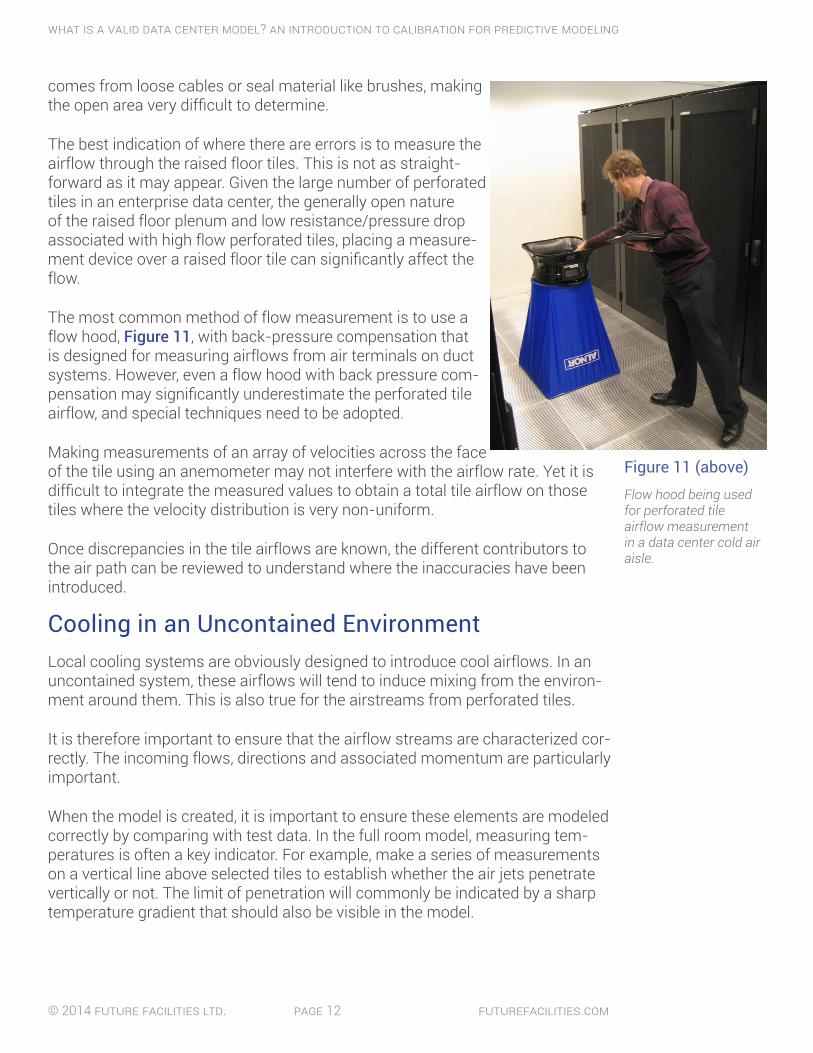
The most common method of flow measurement is to use a flow hood, Figure 11, with back-pressure compensation that is designed for measuring airflows from air terminals on duct systems. However, even a flow hood with back pressure com-pensation may significantly underestimate the perforated tile airflow, and special techniques need to be adopted.
Making measurements of an array of velocities across the face of the tile using an anemometer may not interfere with the airflow rate. Yet it is difficult to integrate the measured values to obtain a total tile airflow on those tiles where the velocity distribution is very non-uniform.
Once discrepancies in the tile airflows are known, the different contributors to the air path can be reviewed to understand where the inaccuracies have been introduced.
Cooling in an Uncontained EnvironmentLocal cooling systems are obviously designed to introduce cool airflows. In an uncontained system, these airflows will tend to induce mixing from the environ-ment around them. This is also true for the airstreams from perforated tiles.
It is therefore important to ensure that the airflow streams are characterized cor-rectly. The incoming flows, directions and associated momentum are particularly important.
When the model is created, it is important to ensure these elements are modeled correctly by comparing with test data. In the full room model, measuring tem-peratures is often a key indicator. For example, make a series of measurements on a vertical line above selected tiles to establish whether the air jets penetrate vertically or not. The limit of penetration will commonly be indicated by a sharp temperature gradient that should also be visible in the model.
Figure 11 (above)
Flow hood being used for perforated tile airflow measurement in a data center cold air aisle.
Similarly, check vertically upwards in front of an in-row cooling unit discharge to see whether, and if so how far, warm air is drawn in over the tops of the cabinets into the cold aisle.
Likewise, measurements can be made horizontally at the ends of rows in front of the last few cabinets in the row to determine whether there is recirculation and, if so, how far it penetrates in from the end of the aisle.
Cooling in a Contained AisleIn a contained aisle, the challenge is somewhat different. The IT equipment is less susceptible to large areas of recirculation and mixing, but these can still occur.
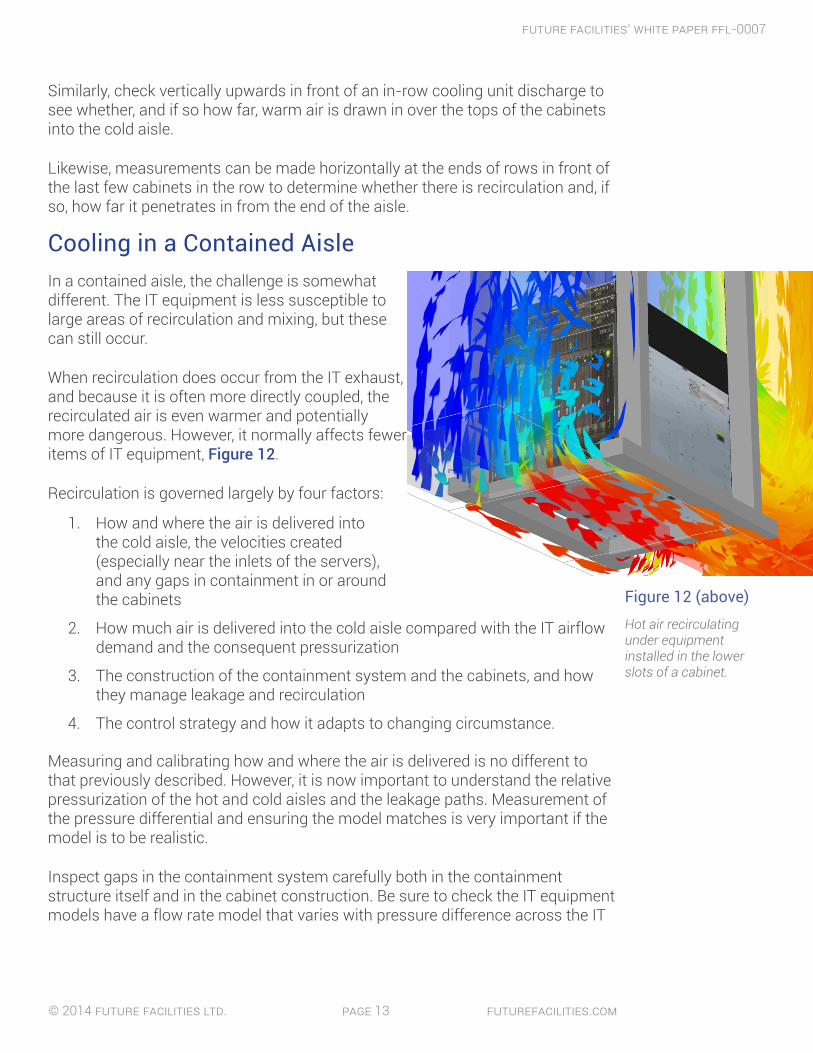
When recirculation does occur from the IT exhaust, and because it is often more directly coupled, the recirculated air is even warmer and potentially more dangerous. However, it normally affects fewer items of IT equipment, Figure 12.
Recirculation is governed largely by four factors:
1. How and where the air is delivered into the cold aisle, the velocities created (especially near the inlets of the servers), and any gaps in containment in or around the cabinets
2. How much air is delivered into the cold aisle compared with the IT airflow demand and the consequent pressurization
3. The construction of the containment system and the cabinets, and how they manage leakage and recirculation
4. The control strategy and how it adapts to changing circumstance.
Measuring and calibrating how and where the air is delivered is no different to that previously described. However, it is now important to understand the relative pressurization of the hot and cold aisles and the leakage paths. Measurement of the pressure differential and ensuring the model matches is very important if the model is to be realistic.
Inspect gaps in the containment system carefully both in the containment structure itself and in the cabinet construction. Be sure to check the IT equipment models have a flow rate model that varies with pressure difference across the IT
Figure 12 (above)
Hot air recirculating under equipment installed in the lower slots of a cabinet.
What iS a valiD Data center MoDel? an introDuction to calibration For PreDictive MoDeling
equipment so they can adjust to variations in conditions accordingly. If there is doubt about any IT equipment models, a relatively easy way to check IT flows if you have power strip power monitoring is to measure the inlet and outlet tem-peratures for sample installations in order to calculate the airflow.
Cal ibrat ing Power and Temperature
If you didn’t already, you will be beginning to realize that these different measure-ment and calibration processes are strongly inter-linked.
At the heart of creating a good model is understanding how much power is being used, and where it is dissipated as heat. Given modern power monitoring, that can be readily available down to the power strip or even the socket. In fact, IP based data promises to provide data for every server in due course. If you are modeling an older facility, then you may only have power data at the PDUs, or worse still, at the facility level.
Whatever the case may be, it is critical first to ensure that you have the right total power by scaling the equipment power attached to the power source to achieve the appropriate power dissipation. The nearer the IT the power is measured, the better the representation of heat load distribution in the room model.
Assuming power has been distributed well, temperatures are the easiest values to measure in order to understand how accurate your models are and where calibra-tion of the model is most required.
Normally, the calibration will be achieved by looking at the items already dis-cussed. But if power distribution is in question and power cables cannot be clamped, then it is useful to measure inlet and outlet air temperature and veloci-ties or airflows in order to check the validity of power settings.
Measurement of velocity can be used to estimate airflow, but engineering judg-ment will be required when converting it to an airflow rate. Air volumes have been measured using tools like flow hoods but clearly this is a specialist task, as such hoods are not designed for the purpose. Continued overleaf...
“... it is critical first to ensure that you have the right total power by scaling
When all the measured data is available, it is possible to use it to help deter-mine the cause of any discrepancies and then update the model accord-
ingly.
For example:
1. If the airflow from the perimeter down flow units has been confirmed, and...
2. One white space area in the model has a higher flow rate than measured, and...
3. Another white space area in the model has a lower flow rate than measured, then...
...there are a few classic possible reasons that should be investigated:
• Has the impact of a major cable route been poorly assessed or indeed overlooked?
• Is there a different strategy for perforated tile deployment in one area compared with the other? Perhaps dampers are being applied differently or indeed more than one tile type has been used and this has not been properly included?
• Is there a different strategy for cable penetration management in different areas? And has the impact for this been accommodated in the model?
This is just an example of the type of thought process that must be used. Issues faced may be more localized, resulting in only one or two cabinets being affected. In such a case, revisit the cabinet construction and IT deployment and description as well as considering the potential for discrepancies in the air delivery model as already described.
Conclusion
We have discussed the general need to calibrate and shown that without calibration the results of simulation can be very misleading.
It is now clear that there are many factors in a complex facility that require a sys-tematic approach to 1) modeling, and then 2) calibration, in order to be confident that the model represents the facility concerned.
What iS a valiD Data center MoDel? an introDuction to calibration For PreDictive MoDeling
About Future Faci l i t ies Ltd.
For a decade, Future Facilities has provided predictive modeling software and consultancy services to both the world’s largest data center owner-operators and to the industry’s leading consultancies.
With offices across the globe, we are unique in the market place; the only company offering an holistic solution for the data center life cycle – from inception through to operation. We call this holistic ap-proach ‘the Virtual Facility’.
While the overall facility is complex, many of the individual elements can be individually assessed, making it possible to diagnose why the initial model does not adequately represent the facility (nor-mally, it won’t!).
Given this understanding of the challenges of creating a good quality CFD model for predictive model-ing, and bearing in mind the potential gains that have been described elsewhere as a result of success-ful modeling and operational changes, it is critical that a systematic calibration process is adopted in order to avoid “garbage in – garbage out” and deliver the full potential of maximizing availability, capacity and efficiency.
Further Reading from Future Faci l i t ies
Future Facilities White Paper Link
Five Reasons your Data Center’s Availability, Capacity and Efficiency are being Compromised
Future Facilities White Paper Link
ACE Performance Assessment - An Engineering Case Study
Future Facilities White Paper Link
From Compromised to Optimized: An ACE Performance Assessment Case Study