AQS DISCOVERER WEB USER GUIDE Page 1 5/29/07 What is Discoverer? A business intelligence tool from Oracle Corporation for ad hoc queries, reporting, analysis, and Web publishing iscoverer is a tool for retrieving and analyzing data from a database. It works with databases designed for online transaction processing or as a data warehouse as well as relational databases such as the AQS database. Oracle designed this tool to give non- technical users access to information in a familiar spreadsheet-style format – easy to read and understand as well as share with others. There are two versions of this web-based software: Oracle Business Intellignece Discoverer Plus (Plus) and Oracle Business Intelligence Discoverer Viewer (Viewer). The Plus version uses a downloadable Java applet; the Viewer version uses HTML. The US EPA deployed both versions in its web architecture so it is available to all registered AQS users without additional cost to the user. Intent of This Guide This guide is intended to provide specific information for using Oracle BI Discoverer Plus with the EPA’s Air Quality System (AQS) database. Discoverer Viewer is mentioned but since it only allows users to view and execute existing queries, it is not the focus of this guide. Unless stated otherwise, all references to Discoverer in this guide refer to Oracle BI Discoverer Plus. The guide covers how to connect to the AQS database using Discoverer; how to create, save and share a workbook; how to change the default worksheet settings; and where to go for help with additional features. The current structure of the available business areas is also included. Oracle Corporation provides extensive help for using the Discoverer tool in both Online Help and in their User’s Guide. Chapter 1 D
Transcript
A Q S D I S C O V E R E R W E B U S E R G U I D E
Page 1 5/29/07
What is Discoverer? A business intelligence tool from Oracle Corporation for ad hoc queries, reporting, analysis, and Web publishing
iscoverer is a tool for retrieving and analyzing data from a database. It works with databases designed for online transaction processing or as a data warehouse as well as relational databases such as the AQS database. Oracle designed this tool to give non-technical users access to information in a familiar spreadsheet-style format – easy to read
and understand as well as share with others.
There are two versions of this web-based software: Oracle Business Intellignece Discoverer Plus (Plus) and Oracle Business Intelligence Discoverer Viewer (Viewer). The Plus version uses a downloadable Java applet; the Viewer version uses HTML. The US EPA deployed both versions in its web architecture so it is available to all registered AQS users without additional cost to the user.
Intent of This Guide This guide is intended to provide specific information for using Oracle BI Discoverer Plus with the EPA’s Air Quality System (AQS) database. Discoverer Viewer is mentioned but since it only allows users to view and execute existing queries, it is not the focus of this guide. Unless stated otherwise, all references to Discoverer in this guide refer to Oracle BI Discoverer Plus.
The guide covers how to connect to the AQS database using Discoverer; how to create, save and share a workbook; how to change the default worksheet settings; and where to go for help with additional features. The current structure of the available business areas is also included.
Oracle Corporation provides extensive help for using the Discoverer tool in both Online Help and in their User’s Guide.
Chapter
1
D
A Q S D I S C O V E R E R W E B U S E R G U I D E
Page 2 5/29/07
Why Use Discoverer with AQS? While the AQS application provides many useful reports, there are times when the exact information you want is not easily found in one of those reports or in the desired format. Discoverer helps you:
• find data that you know is in the database • access data quickly without waiting for the computer to search through the entire database • view data in a familiar spreadsheet-style format that is easy to read and understand • analyze data using a variety of powerful techniques including:
o drilling up and down through data and to related data o creating crosstabs (pivot tables) o sorting data o graphing o totaling o comparing results from "what if" scenarios
• prepare reports showing the results of your analysis • share data with others, and in other applications (e.g. Microsoft Excel)
Prerequisites to run Discoverer PlusSince Discoverer Plus is a web application, there is very little you need to install on your PC to use it. Most users are outside the US EPA’s firewall and run Discoverer Plus over HTTPS.
To use Discoverer Plus, on your client machine (i.e., your PC) you need:
• A standard web browser with java enabled (e.g., Internet Explorer 5.5, 6.0 or higher but not IE7, Netscape 7.1, 7.2 or higher, Mozilla 1.5 or higher, Safari 1.3 or higher)
• Administrative privileges on the client machine so that you can install a Java Virtual Machine (JVM)
• At least 50MB of Users Personal Profile Space for the Oracle Jar Cache • A minimum of between 100-150MB of available disk space to install a JVM
There may be performance issues on PC’s with less than 1 GB of RAM.
Prerequisites to run Discoverer Viewer OracleBI Discoverer Viewer was also installed as part of the Oracle Application Server at EPA. It uses the same End User Layer as Discoverer Plus. To use Discoverer Viewer, on your client machine (i.e., your PC) you need:
• A standard web browser (IE 5.5, 6.0 or higher but not IE7; Netscape 7.1, 7.2 or higher, Mozilla 1.5 or higher, or Safari 1.3 or higher) with JavaScript and cookies enabled
• Workbooks previously defined via Discoverer Plus or Desktop
A Q S D I S C O V E R E R W E B U S E R G U I D E
Page 3 5/29/07
First Time Use of Discoverer Plus The first time a client machine (PC) is used to connect to Discoverer Plus, the Discoverer Plus applet is downloaded from the Discoverer Services tier on the EPA network and cached on the client machine. The Discoverer Plus applet provides the Discoverer Plus user interface and functionality for creating workbooks and analyzing data. When the user logs on subsequently, the Discoverer Plus applet runs from the local cache and does not need to be downloaded.
If a Java Virtual Machine (JVM) (e.g., Java Plug-in) is not already installed on your PC, you should be prompted to download and install a JVM. If you have to download and install a JVM, you may also see a dialog about security.
Step-by-step logon guidance to Discoverer Plus is provided in Chapter 2.
Key Terminology A few terms are important to understand when working with Discoverer.
Discoverer uses a view of the database called the End User Layer (EUL). The EUL is a server based metadata repository. It provides a relatively easy-to-understand view of the database so that end users can concentrate on the data in the database without having to worry about the structure of the database. This EUL is created by the Discoverer Administrator. It protects the data in the database – the integrity of the database cannot be compromised with Discoverer. Without the EUL, Discoverer will not work. (Users rarely need to worry about the EUL.)
This EUL is subdivided into Business Areas (BA). A BA contains a group of tables related to particular areas of interest to end users. Typically, end users are not interested in all of the tables in a EUL. For example, information on which AQS Reports have been used is only valuable information to staff responsible for the AQS software and not to people interested in annual summary data. Two business areas are available to all users: “AQS Basic” and “AQSprod”.
Folders in a business area are the tables and views from the database available to end users. Views are created by the Data Base Administrator and are generally a combination of one or more database tables. There may also be folders created by the Discoverer Administrator that contain items from multiple tables or views. An example of this is the folder named “PARAMETER CLASSIFICATIONS” that contains the classification description from the Classifications table along with the parameter classification code(s) for each parameter.
Items are the columns in the tables, i.e., different types of information within a folder. For example, in the “AGENCIES” folder, “Agency Code” is the 4-character identifier assigned to an agency reporting, analyzing, or collecting AQS data.
Worksheets and Workbooks are the parts you create using Discoverer. Discoverer generates SQL (Structured Query Language) queries and sends them to the database. Each worksheet is a single query. A workbook is a group of worksheets. Every worksheet in a workbook is usually related to
A Q S D I S C O V E R E R W E B U S E R G U I D E
Page 4 5/29/07
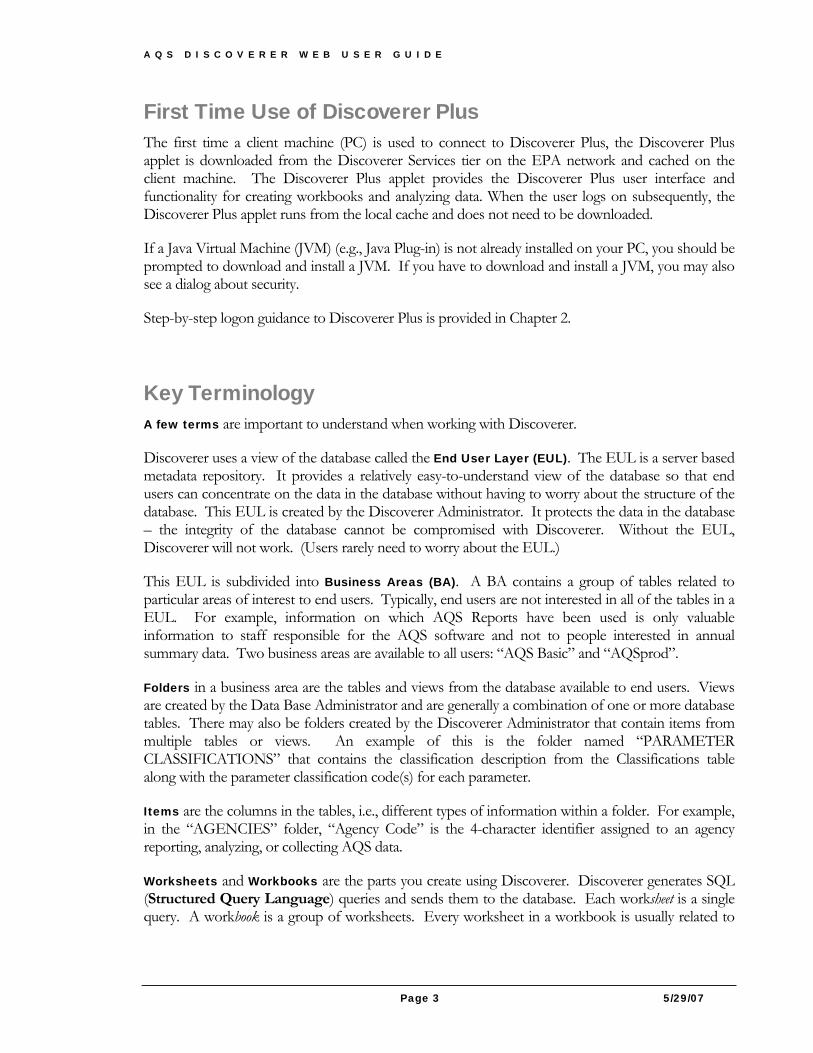
the other worksheets. For example, you may want a workbook with one worksheet listing each site in a particular county and another worksheet with all of the monitors in that county.
Here is a chart with the Discoverer terms and the similar terms used in database and spreadsheet products:
ERD and Data Model Diagrams You cannot create worksheets (queries) if you do not know what data is available to you. It is not necessary to know about every item or even every folder, but some basic understanding is required. To give you some idea of the structure of the entire database, there is a copy of the Entity Reference Diagram (ERD), circa June 2005, on the next page.
Each box on this diagram represents a table. Fields in a table are listed inside its box. There are indicators for primary keys, foreign keys, item formats, and more.
The lines from one table to another represent links between the tables. Links between tables were used to create joins automatically between folders in the Business Areas. When folders are joined, users can pull data from the joined folders into one worksheet. Other joins have been defined manually by the Discoverer administrator.
A Q S D I S C O V E R E R W E B U S E R G U I D E
Page 5 5/29/07
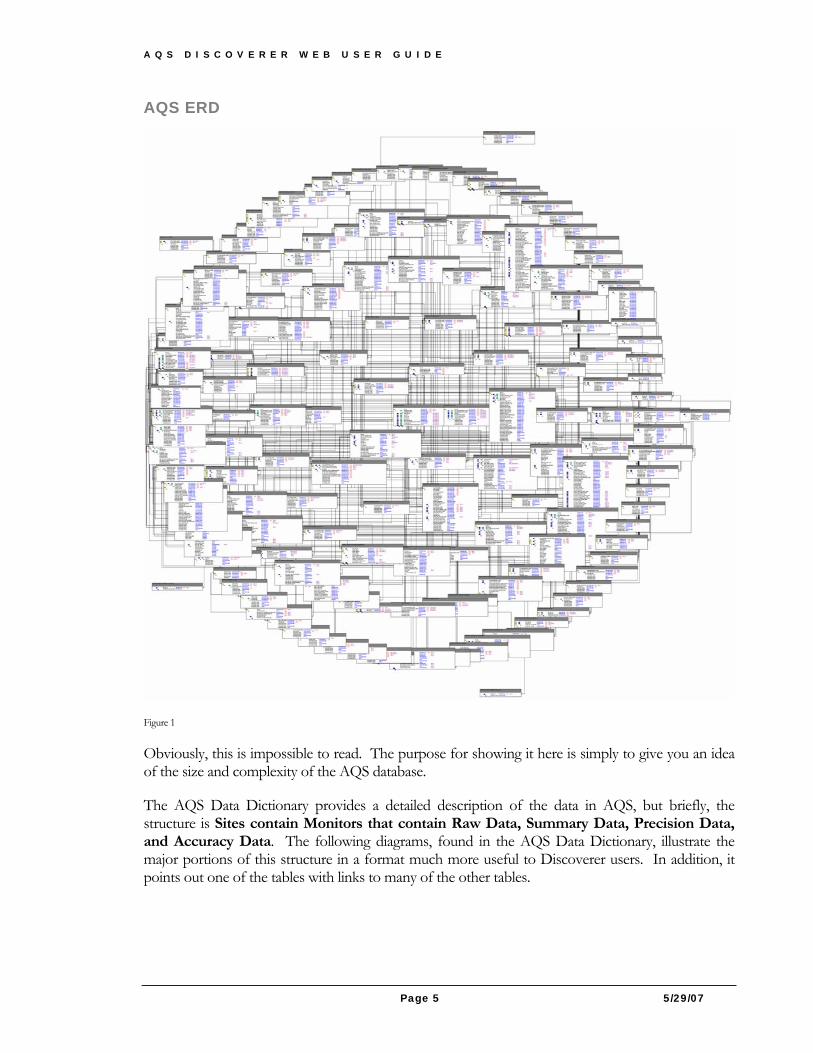
AQS ERD
Figure 1
Obviously, this is impossible to read. The purpose for showing it here is simply to give you an idea of the size and complexity of the AQS database.
The AQS Data Dictionary provides a detailed description of the data in AQS, but briefly, the structure is Sites contain Monitors that contain Raw Data, Summary Data, Precision Data, and Accuracy Data. The following diagrams, found in the AQS Data Dictionary, illustrate the major portions of this structure in a format much more useful to Discoverer users. In addition, it points out one of the tables with links to many of the other tables.
A Q S D I S C O V E R E R W E B U S E R G U I D E
Page 6 5/29/07
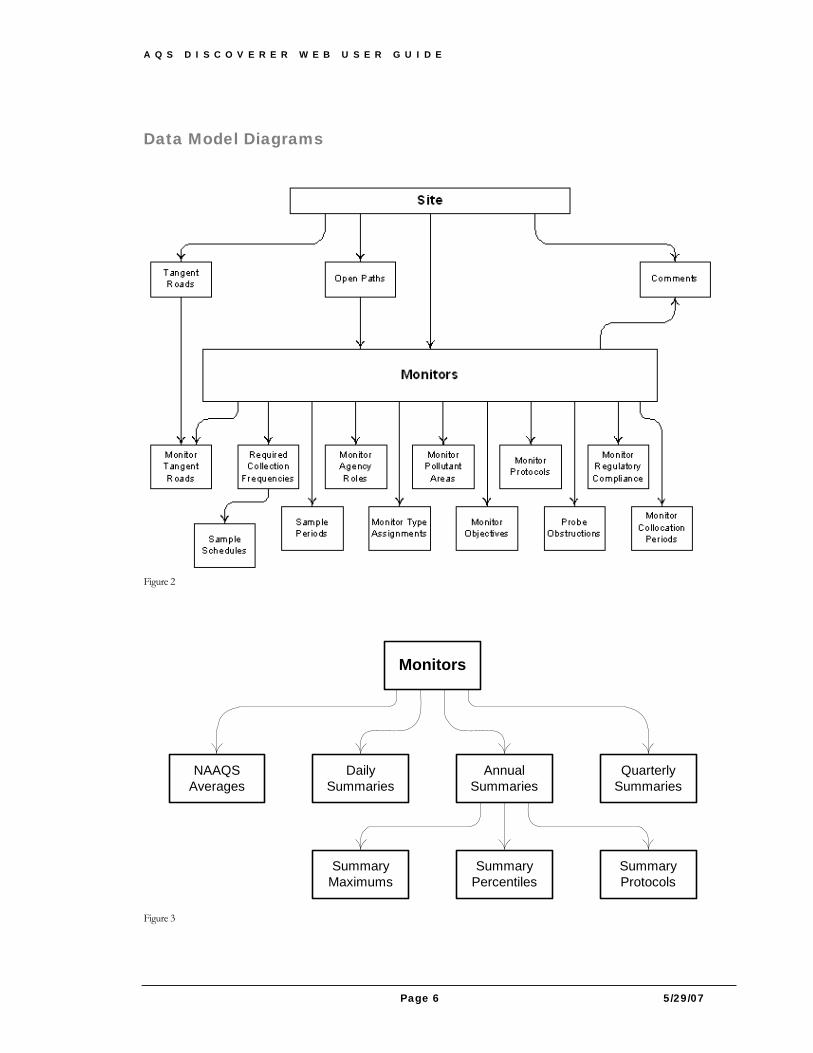
Data Model Diagrams
Figure 2
Monitors
NAAQSAverages
DailySummaries
QuarterlySummaries
AnnualSummaries
SummaryMaximums
SummaryPercentiles
SummaryProtocols
Figure 3
A Q S D I S C O V E R E R W E B U S E R G U I D E
Page 7 5/29/07
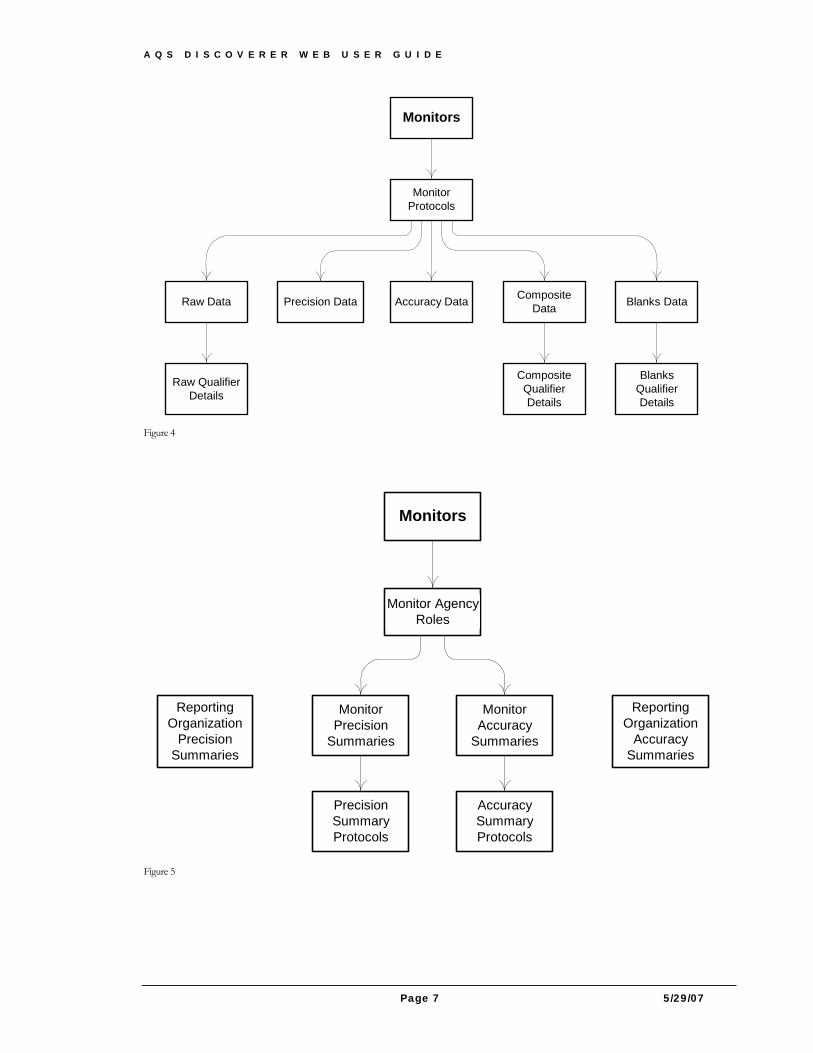
Monitors
MonitorProtocols
CompositeDataRaw Data Blanks DataAccuracy DataPrecision Data
Raw QualifierDetails
CompositeQualifierDetails
BlanksQualifierDetails
Figure 4
Monitors
Monitor AgencyRoles
PrecisionSummaryProtocols
AccuracySummaryProtocols
MonitorPrecision
Summaries
MonitorAccuracy
Summaries
ReportingOrganization
PrecisionSummaries
ReportingOrganization
AccuracySummaries
Figure 5
A Q S D I S C O V E R E R W E B U S E R G U I D E
Page 8 5/29/07
The AQS Basic Business Area The “AQS Basic” business area contains about 44 of the folders most frequently used. It was created from the views of the database described in the Data Dictionary along with reference tables such as “States” and “Parameters”. (Whenever a view is used instead of a physical database table, the letter “V” follows the folder name.)
AQS Basic contains folders with summary and descriptive items.
Sometimes, you will only need to refer to one folder to find the data you are seeking. Other times, you will need to look in more than one folder. You can request information from multiple tables whenever there is an established link between them. For example, the “Sites” folder is linked to the “Tangent Roads” folder according to the data model above. So, if you wanted more information on a tangent road than what is included in the site folder, you can see any related information in the “Tangent Roads” folder. The data models above indicate relationships between the various folders in the business areas. You may find it helpful to refer to them when creating a workbook. When you study the data models, you will notice that almost every folder is connected to “Monitors”.
The “AQS Basic” business area contains about 44 of the folders most frequently used. So, not all of the data entered into the database is accessible from this business area. For example, Summary data is included; Raw data is not.
The AQSprod Business Area The “AQSprod” business area contains all the folders in the “AQS Basic” business area, plus about 30 more, including “Raw Data V - Current”. We suggest that you start out using the “AQS Basic” business area to become acquainted with the Discoverer tool.
If you cannot get to the data you need from “AQSprod”, please let the NADG staff know. We will try to accommodate your needs. (Please remember that a standard report from the AQS application may be the best source of data for you.)
A Q S D I S C O V E R E R W E B U S E R G U I D E
Page 9 5/29/07
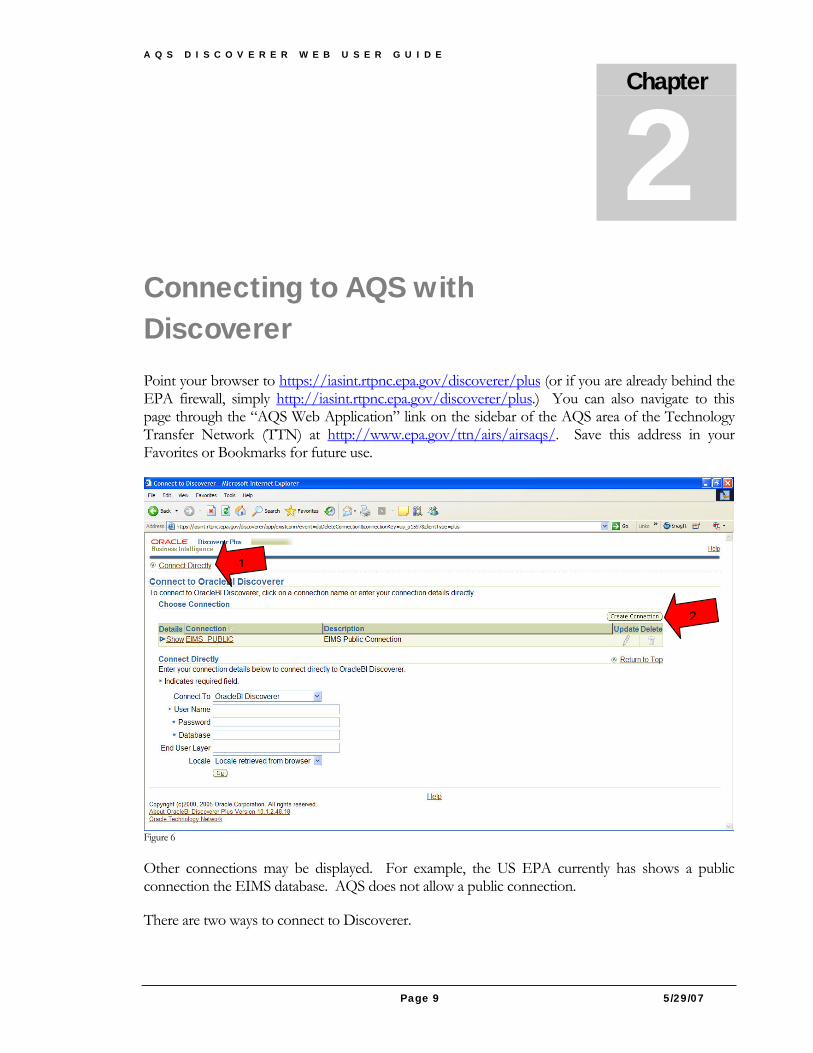
Connecting to AQS with Discoverer Point your browser to https://iasint.rtpnc.epa.gov/discoverer/plus (or if you are already behind the EPA firewall, simply http://iasint.rtpnc.epa.gov/discoverer/plus.) You can also navigate to this page through the “AQS Web Application” link on the sidebar of the AQS area of the Technology Transfer Network (TTN) at http://www.epa.gov/ttn/airs/airsaqs/. Save this address in your Favorites or Bookmarks for future use.
Figure 6
Other connections may be displayed. For example, the US EPA currently has shows a public connection the EIMS database. AQS does not allow a public connection.
There are two ways to connect to Discoverer.
Chapter
2
2
1
A Q S D I S C O V E R E R W E B U S E R G U I D E
Page 10 5/29/07
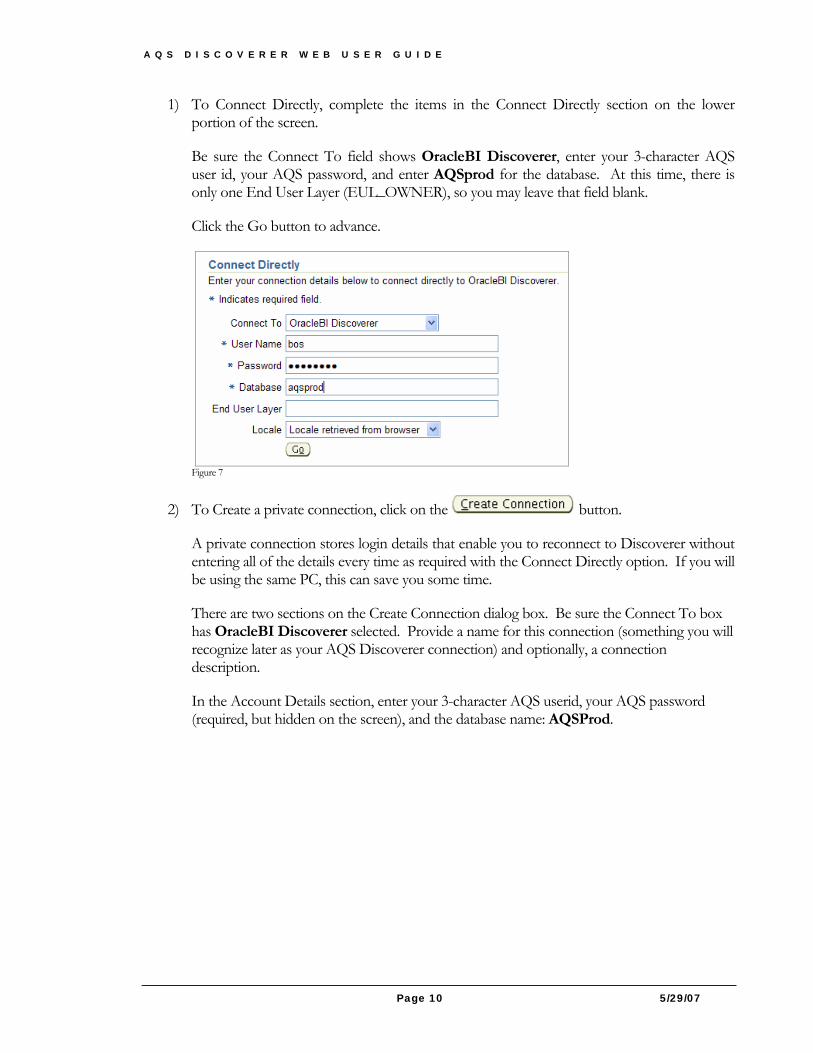
1) To Connect Directly, complete the items in the Connect Directly section on the lower portion of the screen.
Be sure the Connect To field shows OracleBI Discoverer, enter your 3-character AQS user id, your AQS password, and enter AQSprod for the database. At this time, there is only one End User Layer (EUL_OWNER), so you may leave that field blank.
Click the Go button to advance.
Figure 7
2) To Create a private connection, click on the button.
A private connection stores login details that enable you to reconnect to Discoverer without entering all of the details every time as required with the Connect Directly option. If you will be using the same PC, this can save you some time.
There are two sections on the Create Connection dialog box. Be sure the Connect To box has OracleBI Discoverer selected. Provide a name for this connection (something you will recognize later as your AQS Discoverer connection) and optionally, a connection description.
In the Account Details section, enter your 3-character AQS userid, your AQS password (required, but hidden on the screen), and the database name: AQSProd.
A Q S D I S C O V E R E R W E B U S E R G U I D E
Page 11 5/29/07
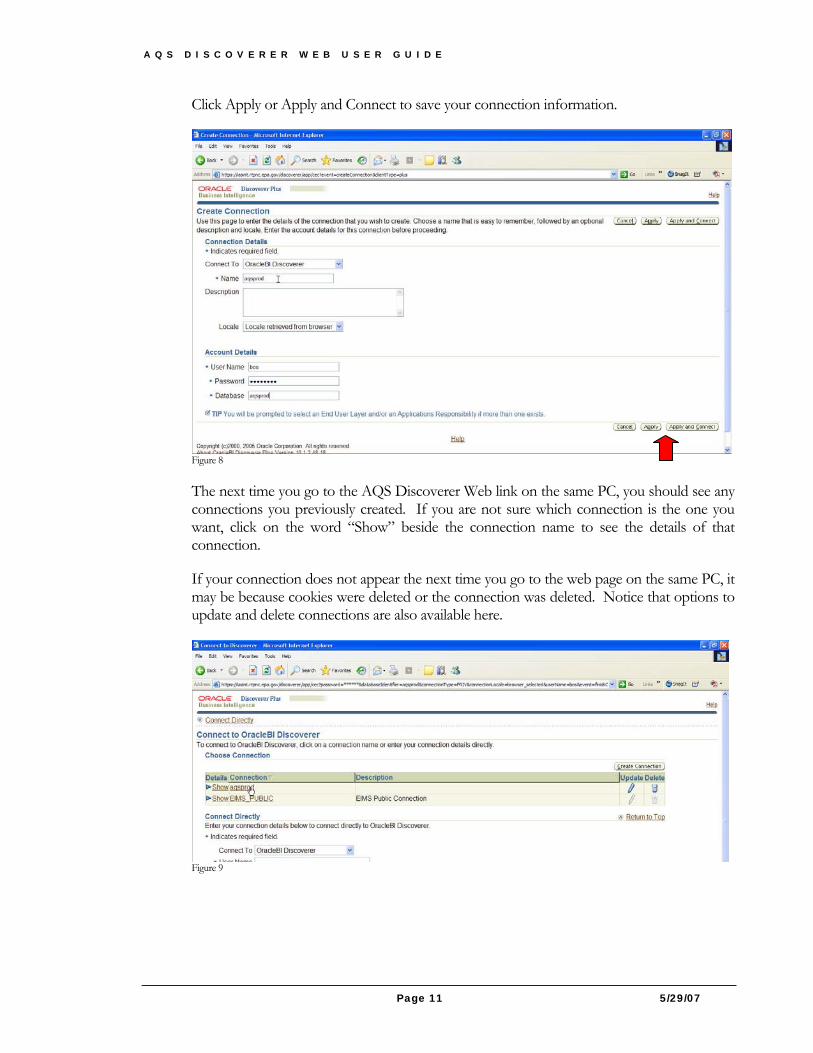
Click Apply or Apply and Connect to save your connection information.
Figure 8
The next time you go to the AQS Discoverer Web link on the same PC, you should see any connections you previously created. If you are not sure which connection is the one you want, click on the word “Show” beside the connection name to see the details of that connection.
If your connection does not appear the next time you go to the web page on the same PC, it may be because cookies were deleted or the connection was deleted. Notice that options to update and delete connections are also available here.
Figure 9
A Q S D I S C O V E R E R W E B U S E R G U I D E
Page 12 5/29/07
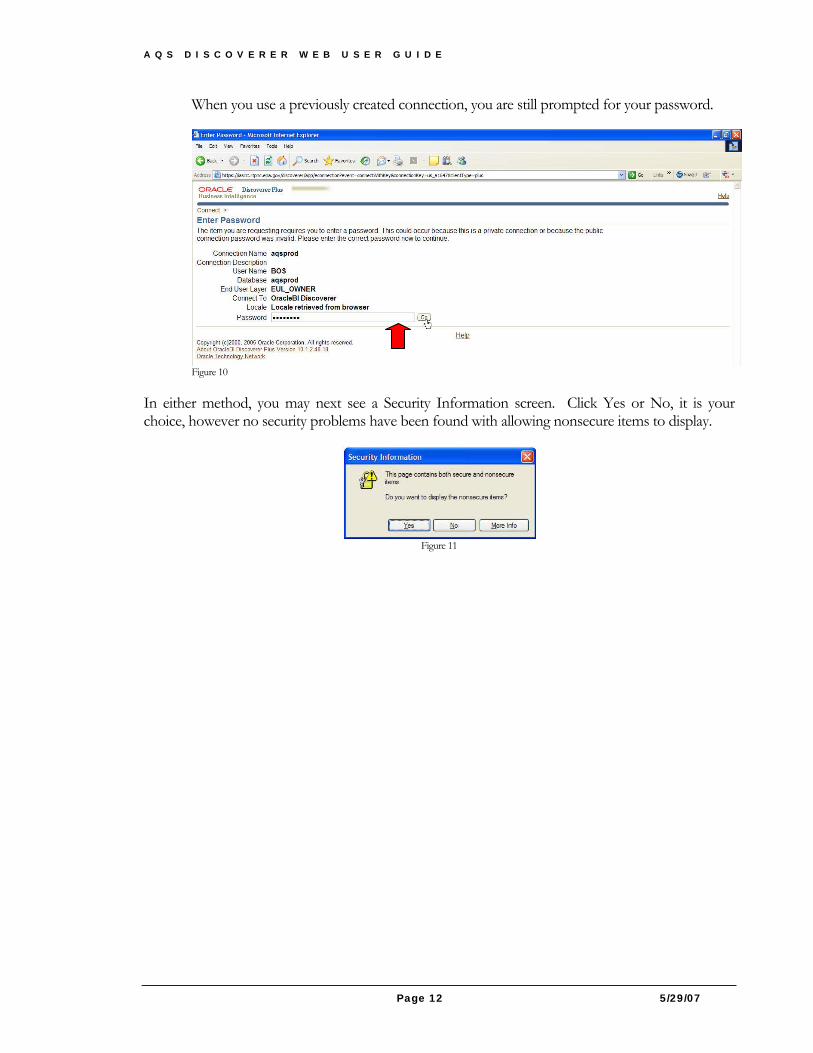
When you use a previously created connection, you are still prompted for your password.
Figure 10
In either method, you may next see a Security Information screen. Click Yes or No, it is your choice, however no security problems have been found with allowing nonsecure items to display.
Figure 11
A Q S D I S C O V E R E R W E B U S E R G U I D E
Page 13 5/29/07
“First-time-only” Processes There are a few more “first-time-only” processes to be completed. These may vary depending on the browser you are using and how your agency’s network is configured. Follow the on-screen instructions.
Install Sun Java Plug-in: If you already have the Java plug-in installed, you may skip this step. Sun regularly upgrades the version of the Java Plug-in, but Oracle does not quickly certify these new versions for use with Discoverer. Most users are using 1.5 successfully. Multiple versions of the plug-in can co-exist on your PC, so if you are prompted to download a new version, you may do so, just do NOT remove the older version. Discoverer will continue to use the older version. (To download an archived version, go to http://java.sun.com/products/archive/)
If your agency requires it, your network administrator may have to install this.
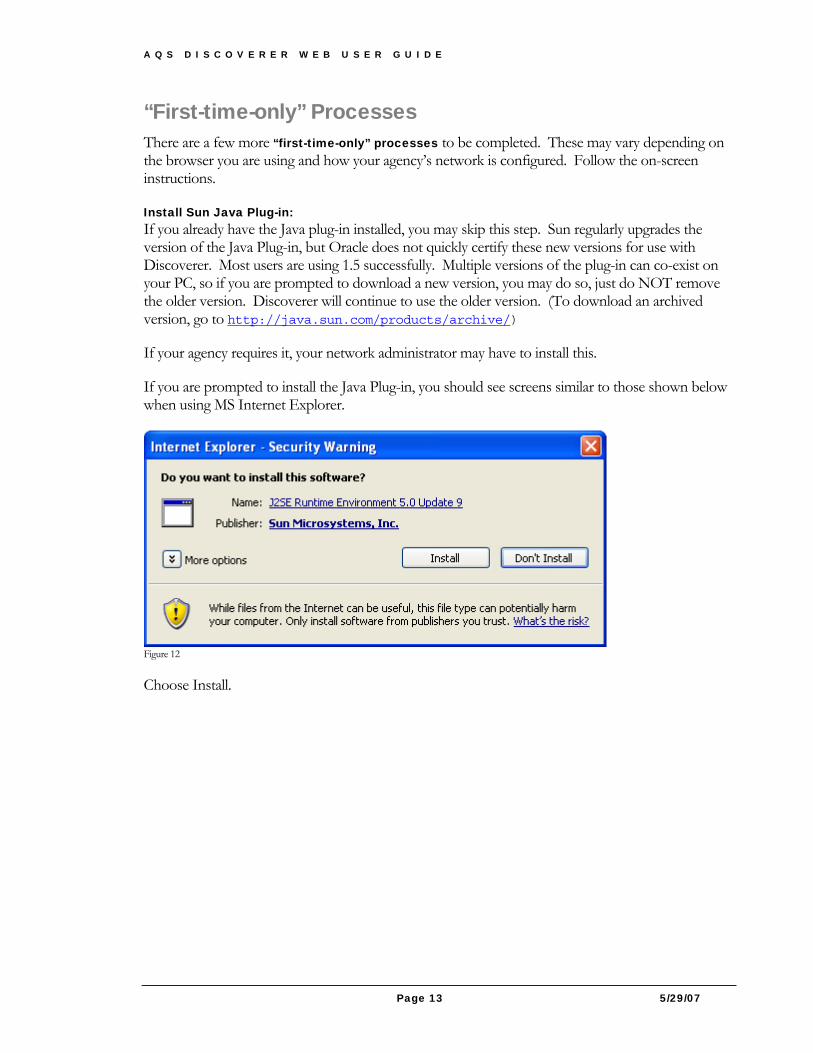
If you are prompted to install the Java Plug-in, you should see screens similar to those shown below when using MS Internet Explorer.
Figure 12
Choose Install.
A Q S D I S C O V E R E R W E B U S E R G U I D E
Page 14 5/29/07
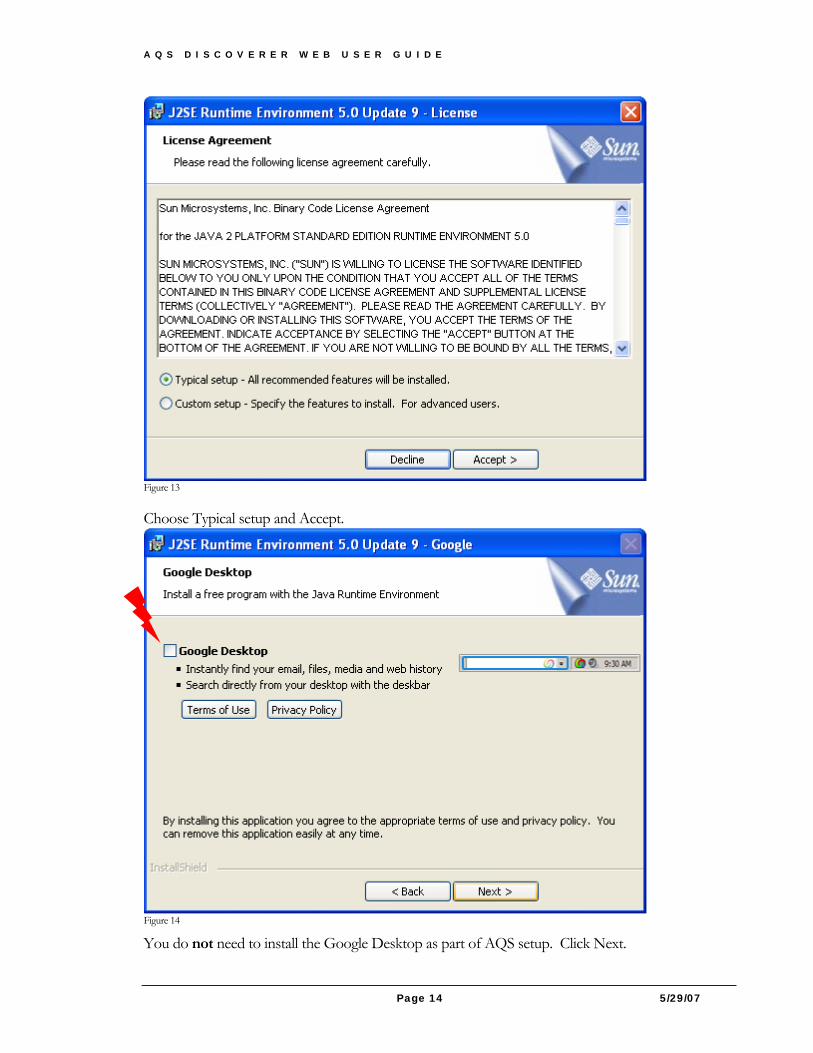
Figure 13
Choose Typical setup and Accept.
Figure 14
You do not need to install the Google Desktop as part of AQS setup. Click Next.
A Q S D I S C O V E R E R W E B U S E R G U I D E
Page 15 5/29/07
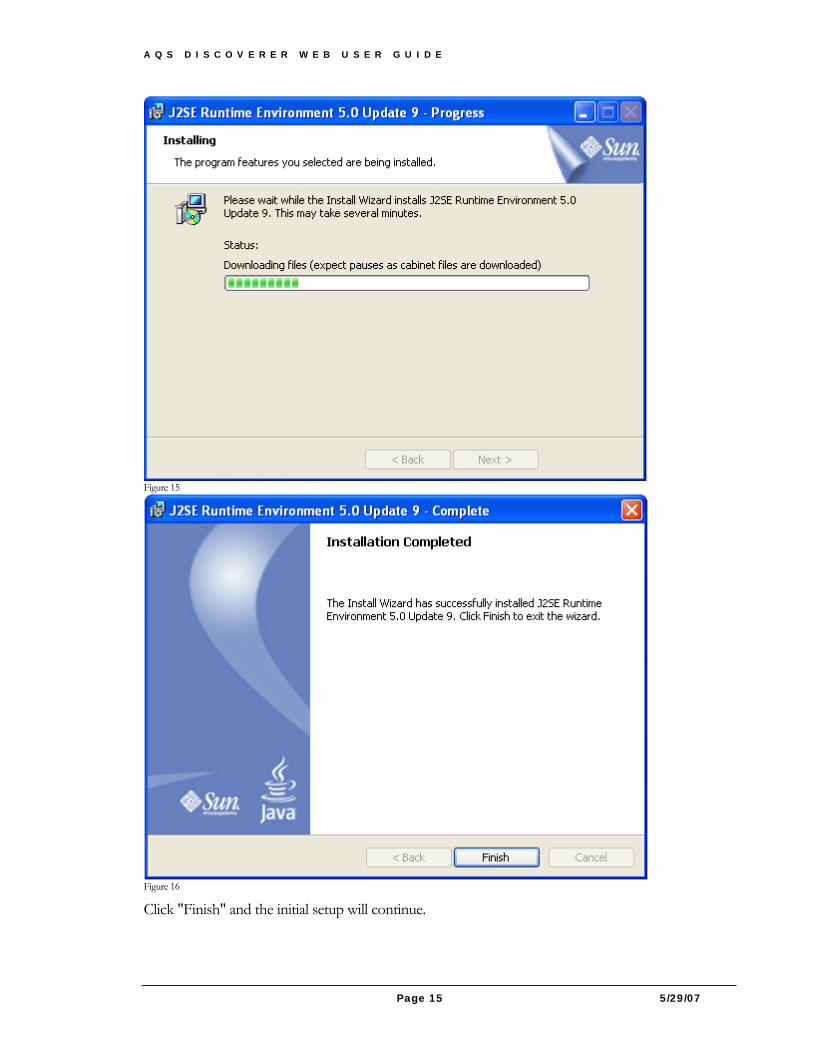
Figure 15
Figure 16
Click "Finish" and the initial setup will continue.
A Q S D I S C O V E R E R W E B U S E R G U I D E
Page 16 5/29/07
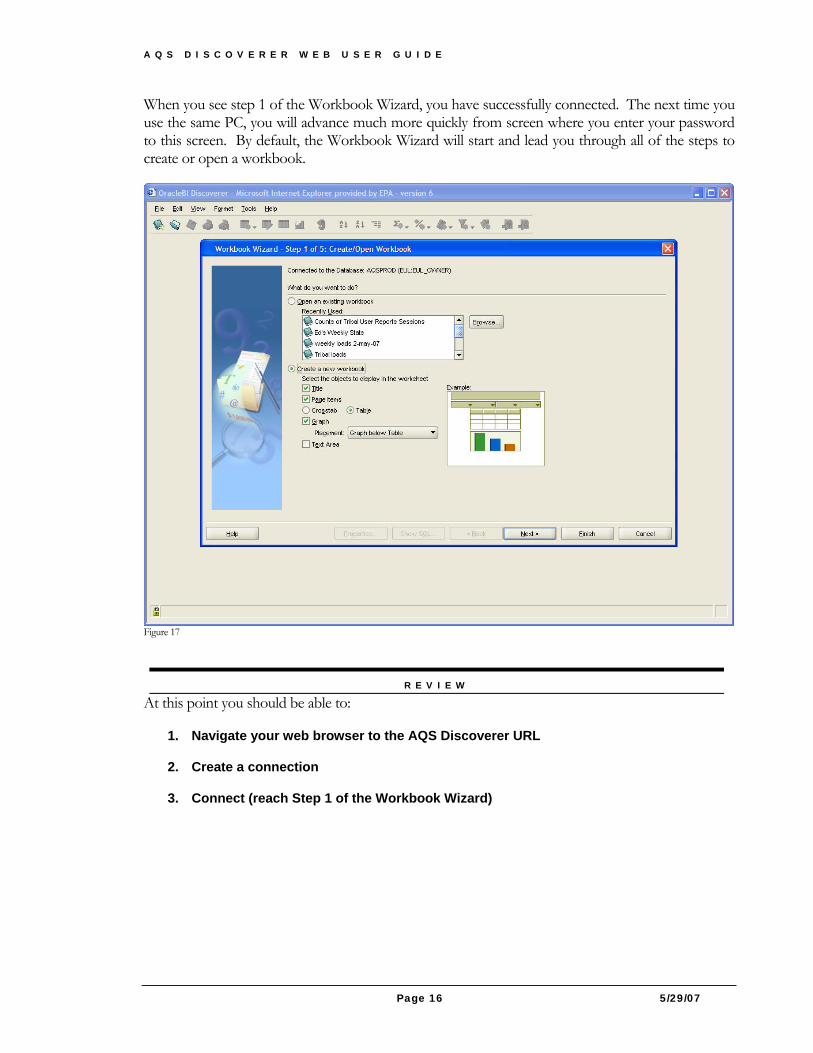
When you see step 1 of the Workbook Wizard, you have successfully connected. The next time you use the same PC, you will advance much more quickly from screen where you enter your password to this screen. By default, the Workbook Wizard will start and lead you through all of the steps to create or open a workbook.
Figure 17
At this point you should be able to:
1. Navigate your web browser to the AQS Discoverer URL
2. Create a connection
3. Connect (reach Step 1 of the Workbook Wizard)
R E V I E W
A Q S D I S C O V E R E R W E B U S E R G U I D E
Page 17 5/29/07
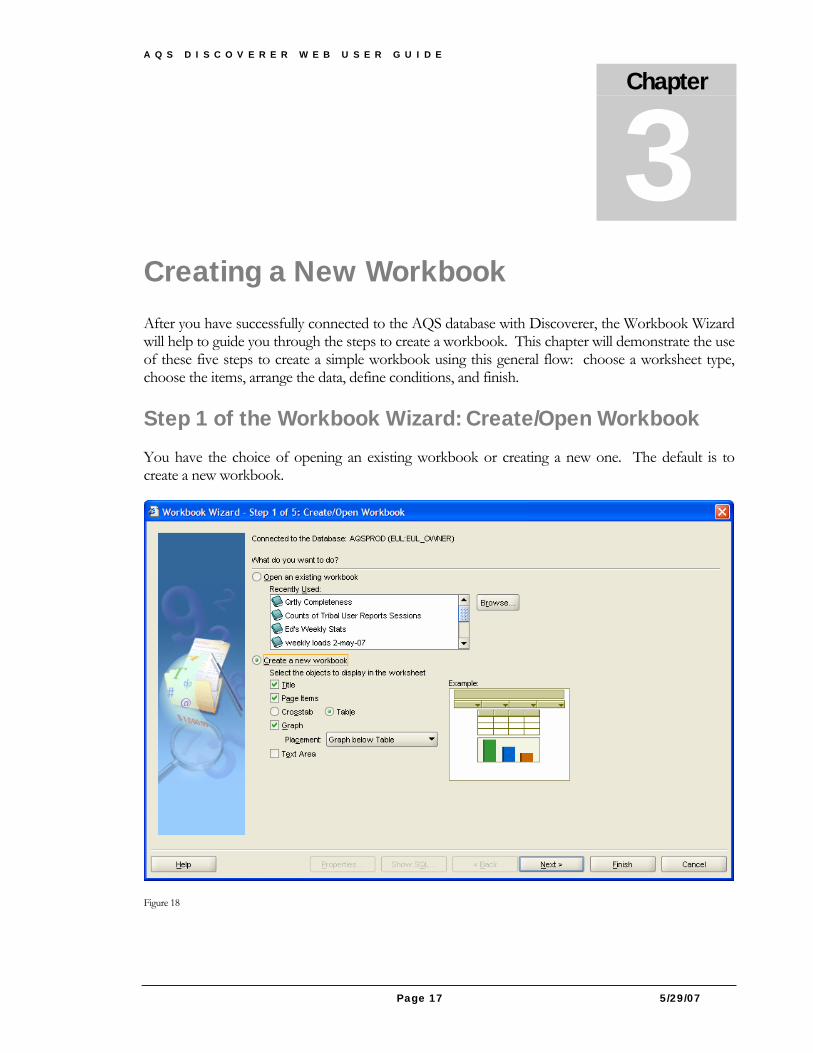
Creating a New Workbook After you have successfully connected to the AQS database with Discoverer, the Workbook Wizard will help to guide you through the steps to create a workbook. This chapter will demonstrate the use of these five steps to create a simple workbook using this general flow: choose a worksheet type, choose the items, arrange the data, define conditions, and finish.
Step 1 of the Workbook Wizard: Create/Open Workbook
You have the choice of opening an existing workbook or creating a new one. The default is to create a new workbook.
Figure 18
Chapter
3
A Q S D I S C O V E R E R W E B U S E R G U I D E
Page 18 5/29/07
The boxes and buttons on the Step 1 screen are described below.
Title: Check this box to show a title for your worksheet. It may seem more logical to add a title later.
Page Items: Uncheck this box unless you want to create a table with page items. Page items are used to view the data in slices. For example, to show all of the monitors in a state, with one page for each site, one option would be to use the site id as a page item.
Table: Select Table to show the data organized in rows and columns (like a spreadsheet). By default, row numbers are shown down the left-hand side and column headings are the item names from the folder. Row numbers can be turned off and column headings can be renamed.
Crosstab: Cross-tabulation shows the interrelationship of two or more set of data. This is similar to the pivot table in Excel. You can start with a table then use it to create a crosstab later.
Graph: Uncheck this box if you do not want to create a graph while you are creating a worksheet. This box is checked by default. A graph can be added later if desired.
Text Area: This box creates an area at the bottom of the worksheet to display additional information to help explain the worksheet or to help another user run your worksheet. Uncheck it if you do not want this area. It can be added later.
Buttons at the bottom of each Workbook Wizard screen provide options available for that step.
The Help button opens a second browser window to display online help in HTML format. The online help provided by Oracle is very good.
The Properties button allows you to set up default values for formats and displays.
Show SQL opens a separate window that lets you view and copy the SQL for the query you create. This information can be valuable when people knowledgeable in SQL are debugging a query.
The Back and Next buttons move you backward to a previous screen or forward to the next screen. Selections made are retained, so backing up does not destroy your previous selections.
The Finish button notifies Discoverer that you are finished creating the query and wish to see the results.
Cancel tells Discoverer you do not want to continue with this query.
A Q S D I S C O V E R E R W E B U S E R G U I D E
Page 19 5/29/07
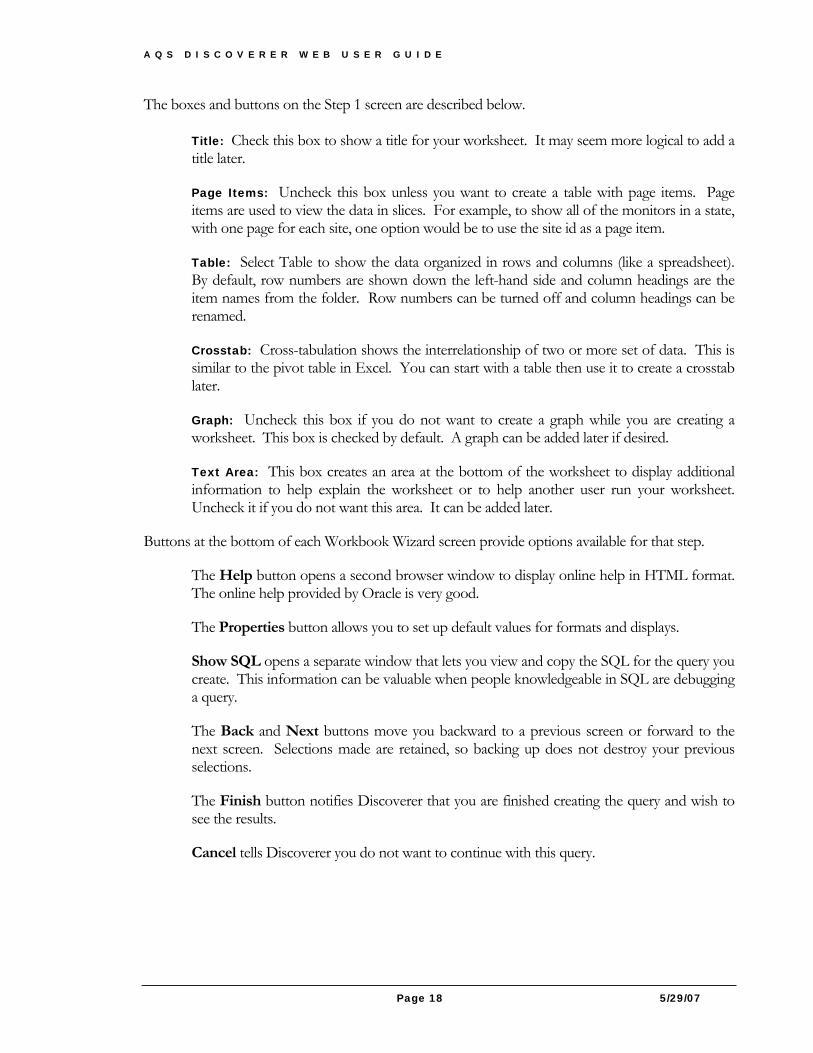
Step 2 of the Workbook Wizard: Select Items This step is where items are selected to include in the worksheet. It is also where conditions and any calculations may be created. There are several areas of importance on this screen.
1) Business Area selection: Look for the down arrow to see the business areas available.
2) Once the business area is selected, a list of folders in that business area appears. To see the items in a folder, click on the plus sign beside the folder name. To select an item or items (or entire folders), click the item to highlight it and then either use the selection arrow, drag and drop, or right click and select add to worksheet.
Figure 19
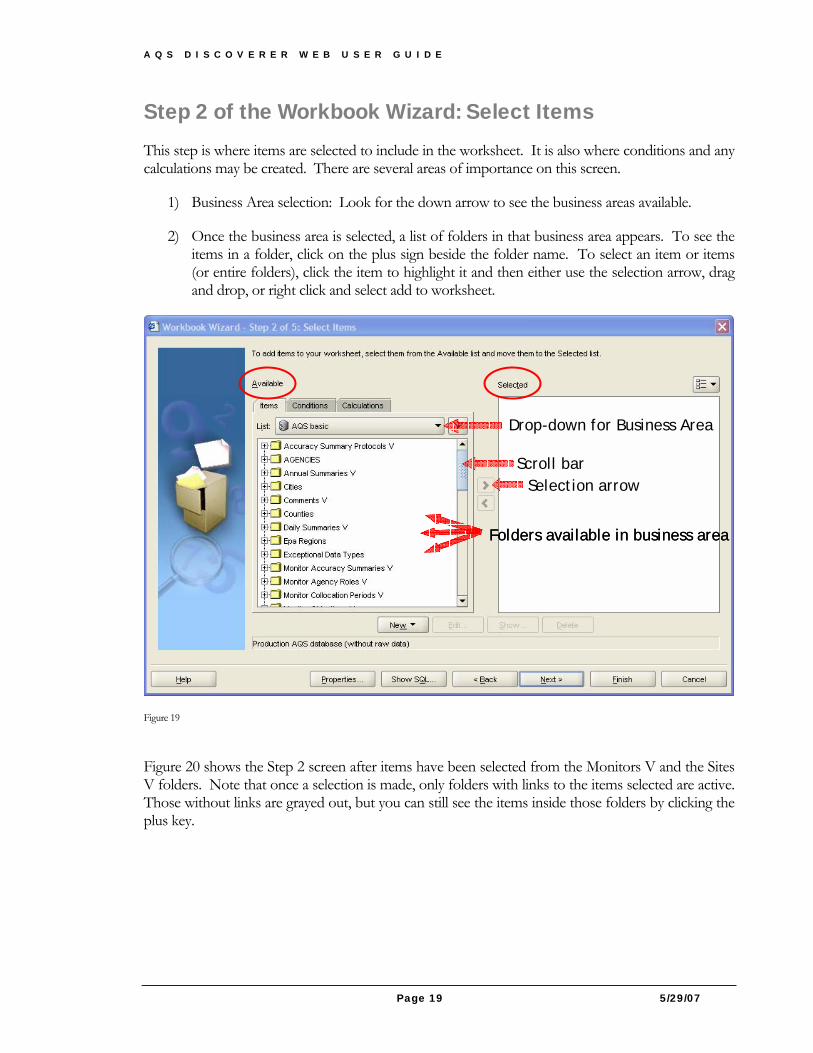
Figure 20 shows the Step 2 screen after items have been selected from the Monitors V and the Sites V folders. Note that once a selection is made, only folders with links to the items selected are active. Those without links are grayed out, but you can still see the items inside those folders by clicking the plus key.
Folders available in business area
Drop-down for Business Area
Selection arrow Scroll bar
Folders available in business area
A Q S D I S C O V E R E R W E B U S E R G U I D E
Page 20 5/29/07
Figure 20
Two other buttons can help when selecting items for a worksheet: the Find button and the Views button to show (or hide) folder names associated with the items selected.
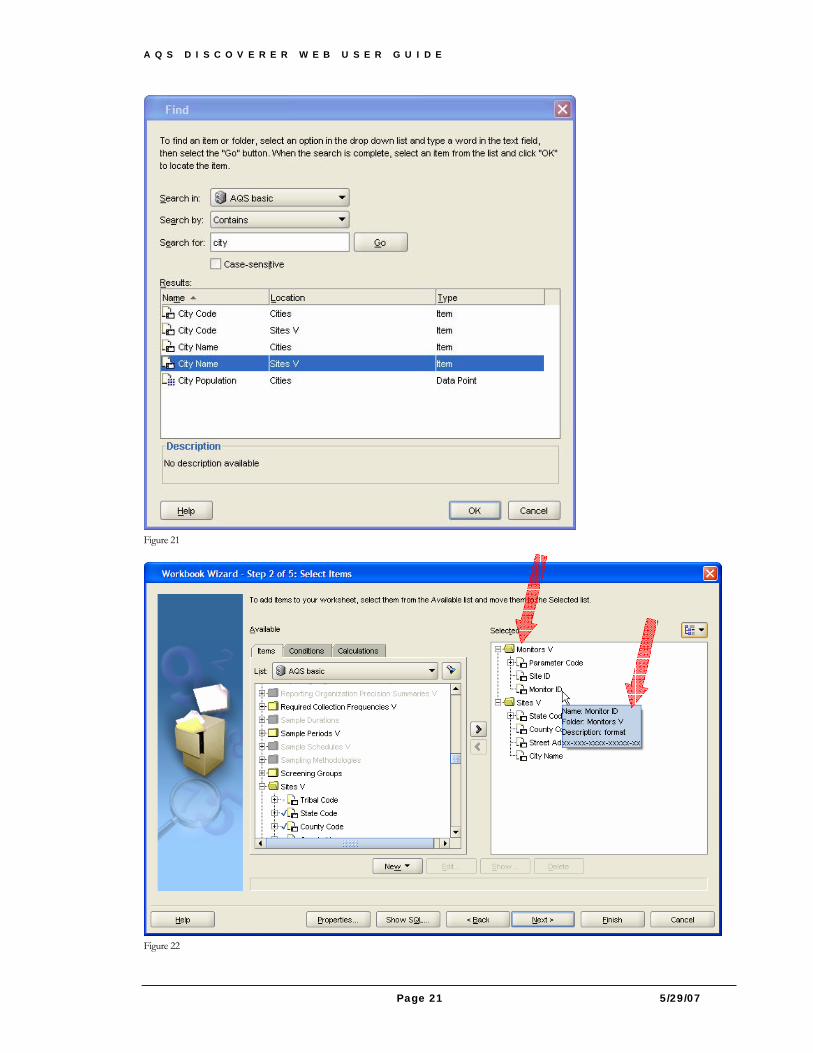
The Find button can help search for items containing, starting with, ending with, or exactly matching the value supplied. For example, a search for items containing “city” in the AQS basic business area produces shows there are city names, city codes, and city populations items found in two different folders (locations): Cities and Sites V. (See Figure 21.) It is not recommended to search for the value “date” since there are 200 - 400 date items in both business areas of AQS. Instead, include more descriptive information about the date item requested, e.g., “sampling begin date ”.
The Views button shows or hides the folder names in the Selected box. Showing the folder name can be very helpful in AQS since many items appear in more than one folder. You can also see a popup with the folder name and other available description for an item by holding your cursor over an item name. (See Figure 22.)
Show or hide folder names Find items
Grayed out
items
A Q S D I S C O V E R E R W E B U S E R G U I D E
Page 21 5/29/07
Figure 21
Figure 22
A Q S D I S C O V E R E R W E B U S E R G U I D E
Page 22 5/29/07
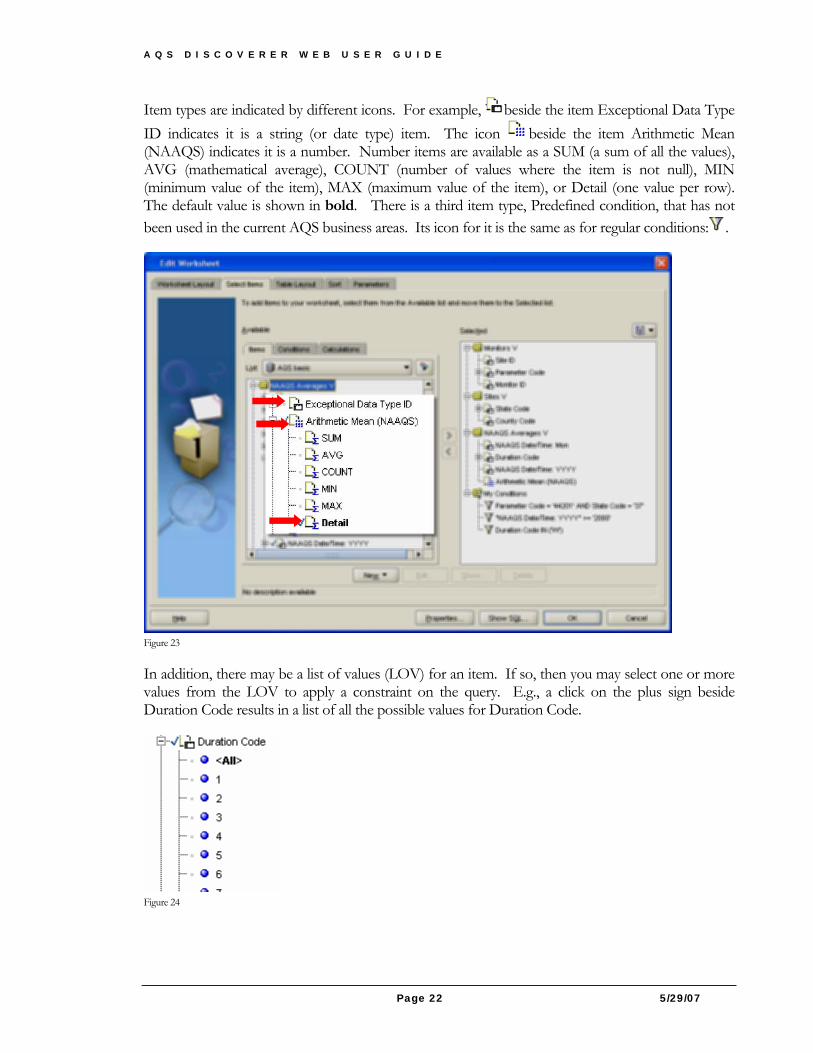
Item types are indicated by different icons. For example, beside the item Exceptional Data Type ID indicates it is a string (or date type) item. The icon beside the item Arithmetic Mean (NAAQS) indicates it is a number. Number items are available as a SUM (a sum of all the values), AVG (mathematical average), COUNT (number of values where the item is not null), MIN (minimum value of the item), MAX (maximum value of the item), or Detail (one value per row). The default value is shown in bold. There is a third item type, Predefined condition, that has not been used in the current AQS business areas. Its icon for it is the same as for regular conditions: .
Figure 23
In addition, there may be a list of values (LOV) for an item. If so, then you may select one or more values from the LOV to apply a constraint on the query. E.g., a click on the plus sign beside Duration Code results in a list of all the possible values for Duration Code.
Figure 24
A Q S D I S C O V E R E R W E B U S E R G U I D E
Page 23 5/29/07
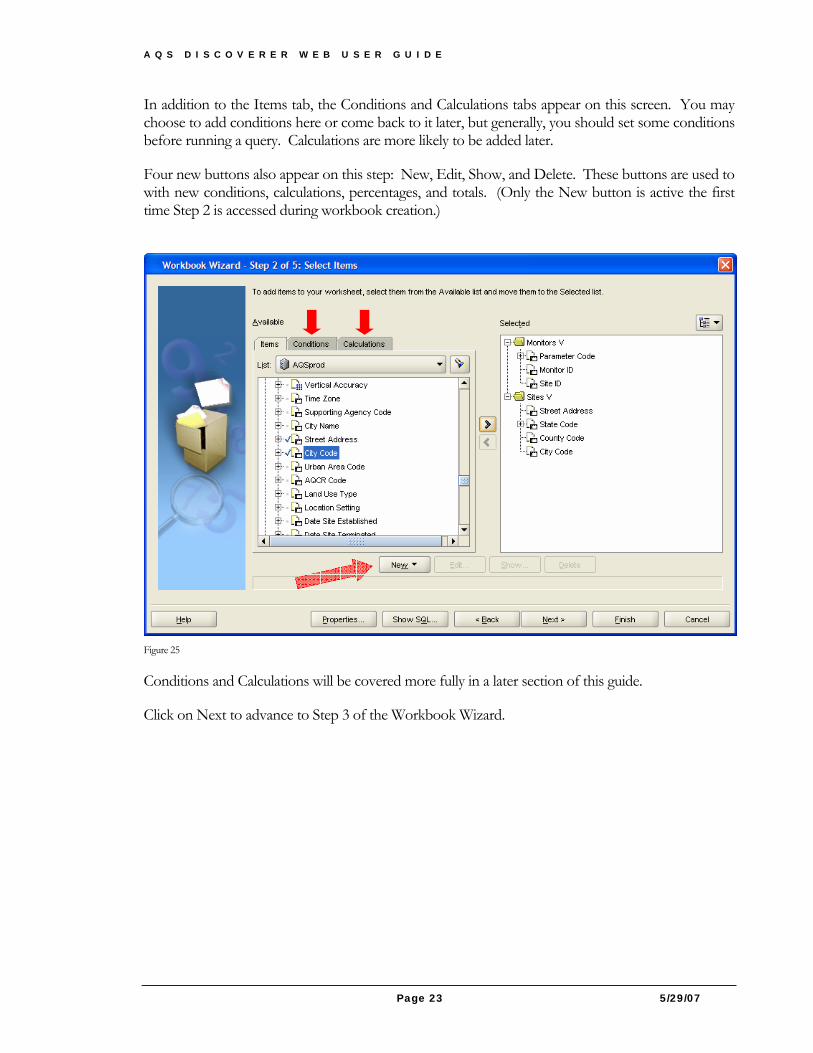
In addition to the Items tab, the Conditions and Calculations tabs appear on this screen. You may choose to add conditions here or come back to it later, but generally, you should set some conditions before running a query. Calculations are more likely to be added later.
Four new buttons also appear on this step: New, Edit, Show, and Delete. These buttons are used to with new conditions, calculations, percentages, and totals. (Only the New button is active the first time Step 2 is accessed during workbook creation.)
Figure 25
Conditions and Calculations will be covered more fully in a later section of this guide.
Click on Next to advance to Step 3 of the Workbook Wizard.
A Q S D I S C O V E R E R W E B U S E R G U I D E
Page 24 5/29/07
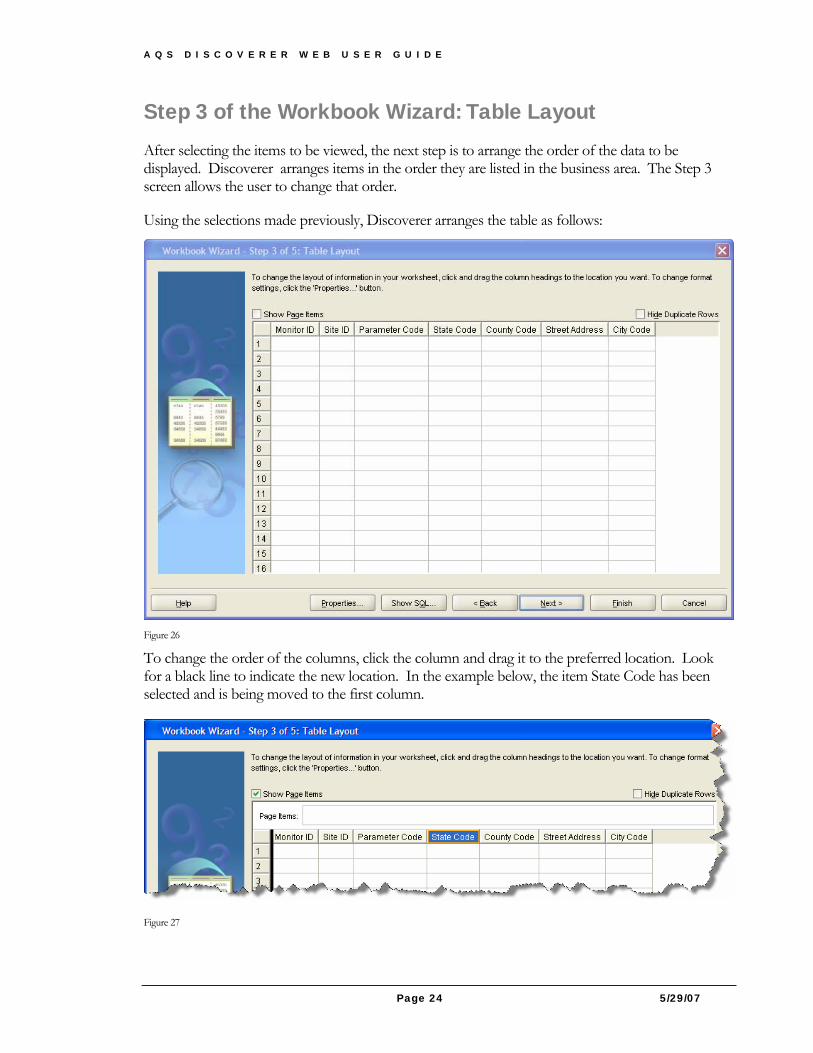
Step 3 of the Workbook Wizard: Table Layout After selecting the items to be viewed, the next step is to arrange the order of the data to be displayed. Discoverer arranges items in the order they are listed in the business area. The Step 3 screen allows the user to change that order.
Using the selections made previously, Discoverer arranges the table as follows:
Figure 26
To change the order of the columns, click the column and drag it to the preferred location. Look for a black line to indicate the new location. In the example below, the item State Code has been selected and is being moved to the first column.
Figure 27
A Q S D I S C O V E R E R W E B U S E R G U I D E
Page 25 5/29/07
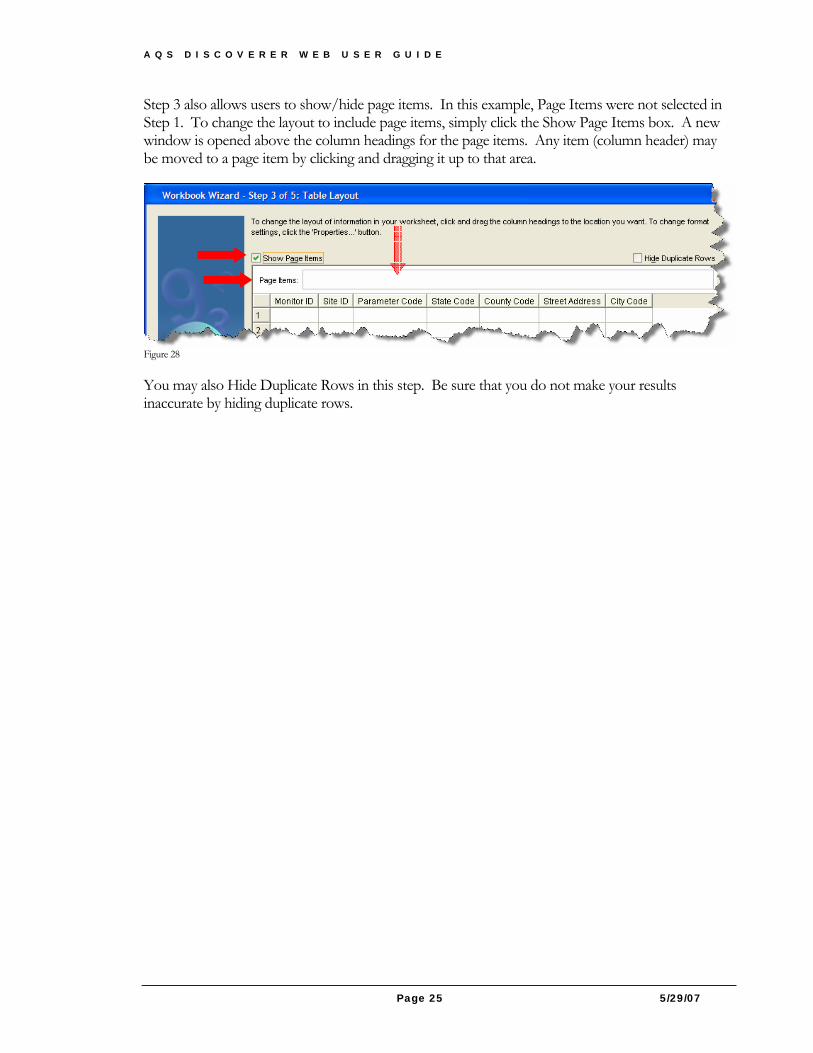
Step 3 also allows users to show/hide page items. In this example, Page Items were not selected in Step 1. To change the layout to include page items, simply click the Show Page Items box. A new window is opened above the column headings for the page items. Any item (column header) may be moved to a page item by clicking and dragging it up to that area.
Figure 28
You may also Hide Duplicate Rows in this step. Be sure that you do not make your results inaccurate by hiding duplicate rows.
A Q S D I S C O V E R E R W E B U S E R G U I D E
Page 26 5/29/07
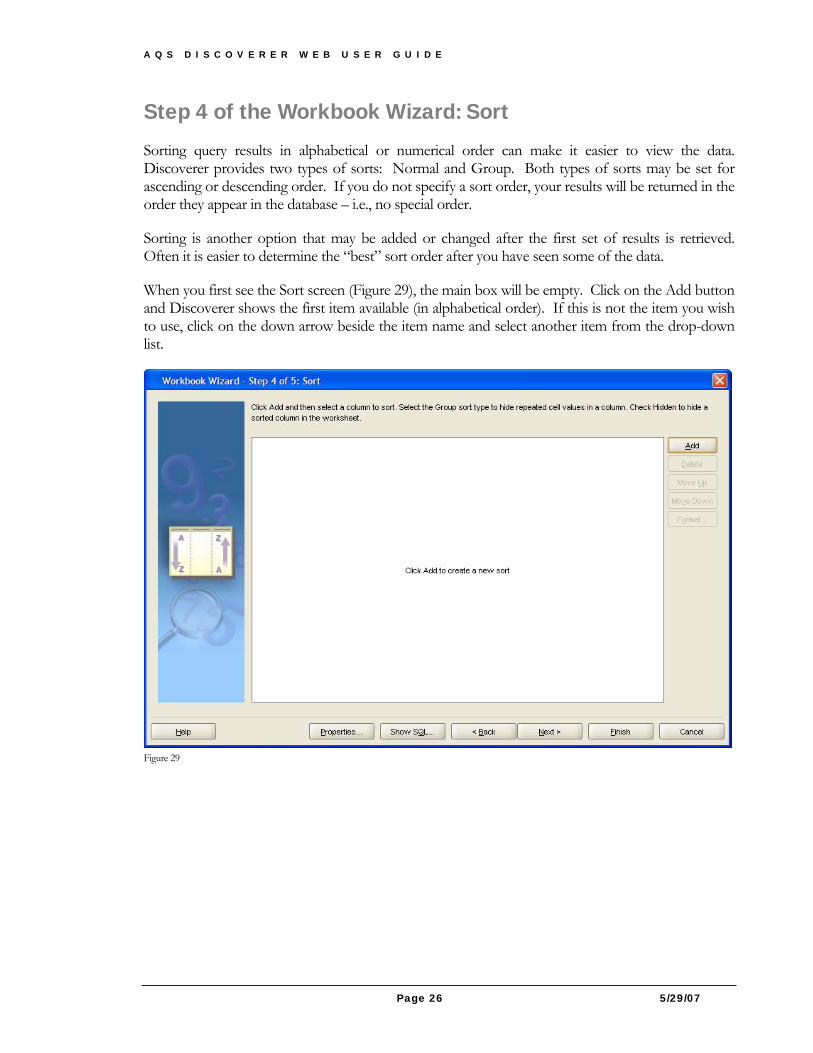
Step 4 of the Workbook Wizard: Sort Sorting query results in alphabetical or numerical order can make it easier to view the data. Discoverer provides two types of sorts: Normal and Group. Both types of sorts may be set for ascending or descending order. If you do not specify a sort order, your results will be returned in the order they appear in the database – i.e., no special order.
Sorting is another option that may be added or changed after the first set of results is retrieved. Often it is easier to determine the “best” sort order after you have seen some of the data.
When you first see the Sort screen (Figure 29), the main box will be empty. Click on the Add button and Discoverer shows the first item available (in alphabetical order). If this is not the item you wish to use, click on the down arrow beside the item name and select another item from the drop-down list.
Figure 29
A Q S D I S C O V E R E R W E B U S E R G U I D E
Page 27 5/29/07
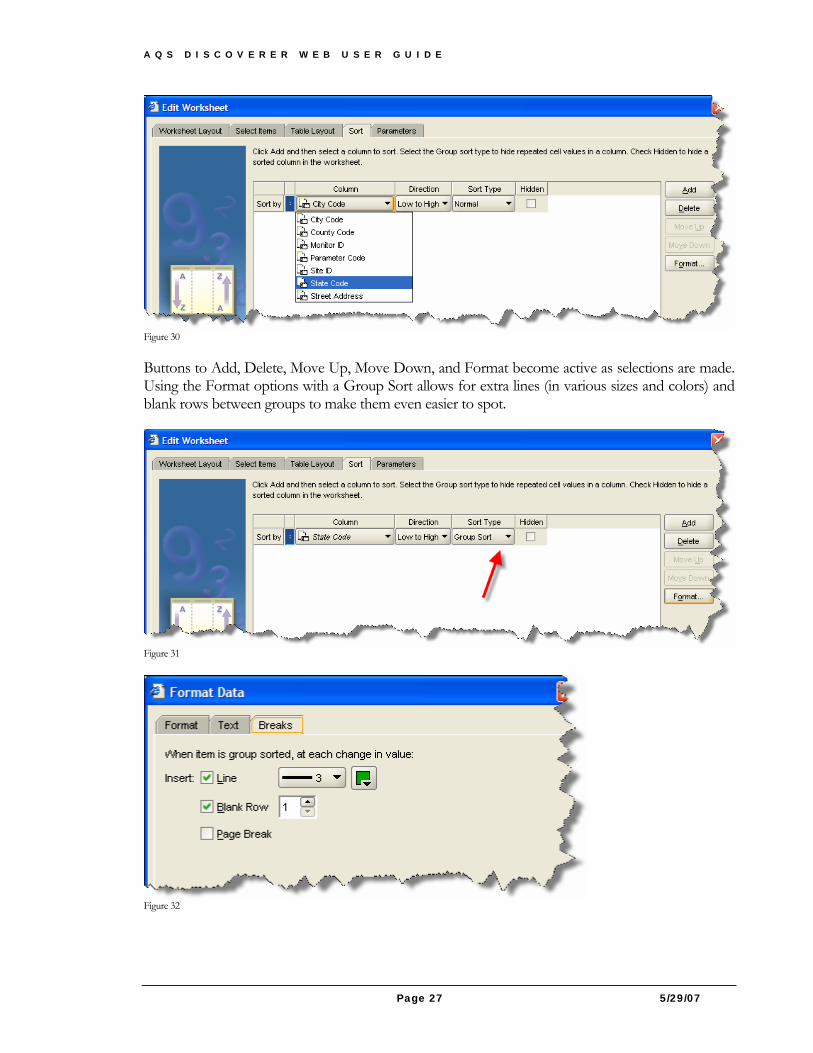
Figure 30
Buttons to Add, Delete, Move Up, Move Down, and Format become active as selections are made. Using the Format options with a Group Sort allows for extra lines (in various sizes and colors) and blank rows between groups to make them even easier to spot.
Figure 31
Figure 32
A Q S D I S C O V E R E R W E B U S E R G U I D E
Page 28 5/29/07
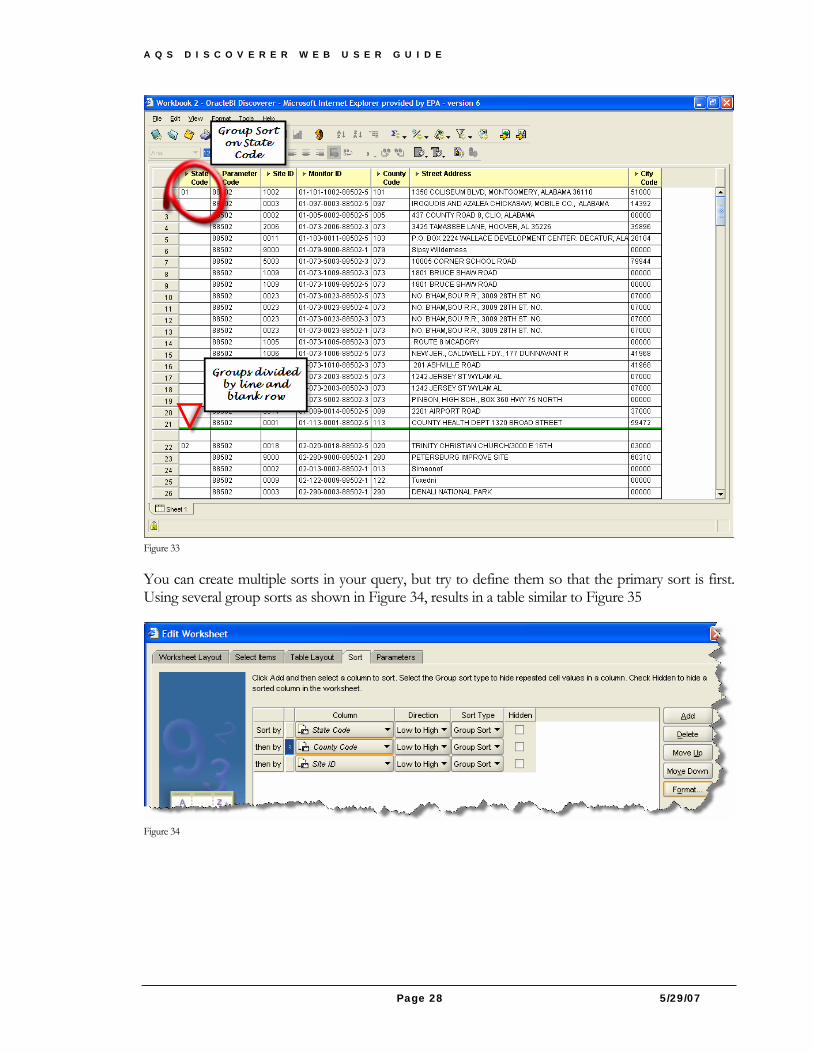
Figure 33
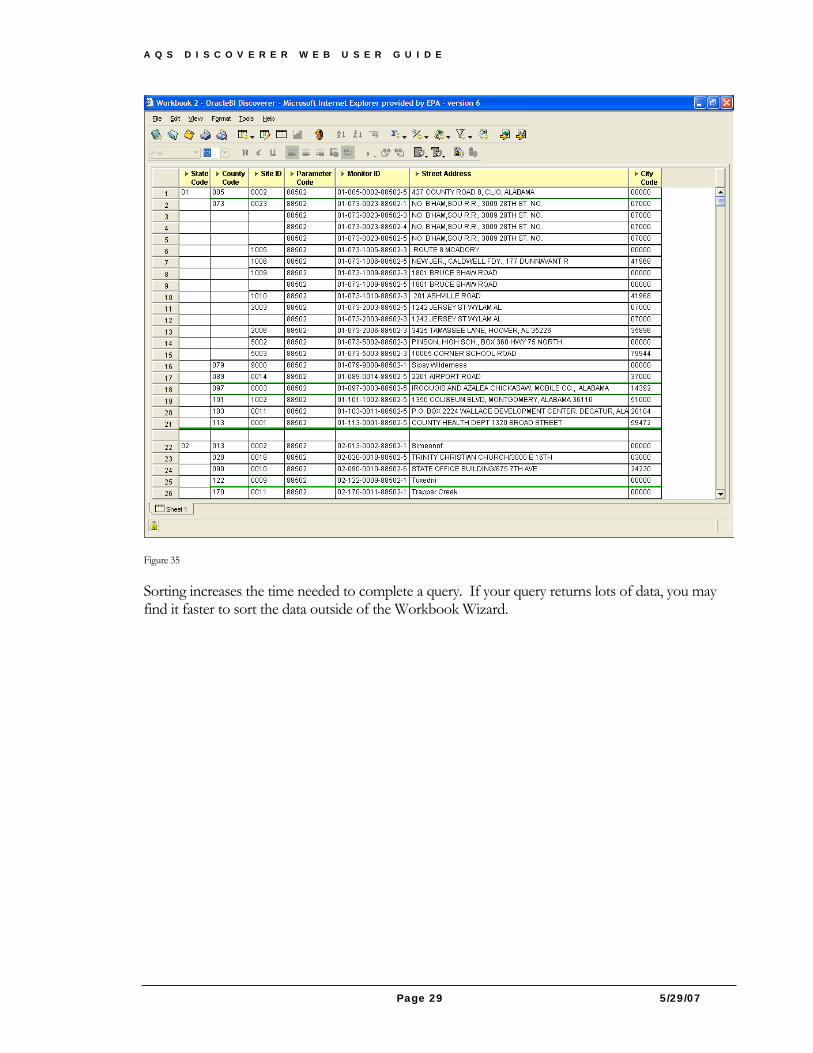
You can create multiple sorts in your query, but try to define them so that the primary sort is first. Using several group sorts as shown in Figure 34, results in a table similar to Figure 35
Figure 34
A Q S D I S C O V E R E R W E B U S E R G U I D E
Page 29 5/29/07
Figure 35
Sorting increases the time needed to complete a query. If your query returns lots of data, you may find it faster to sort the data outside of the Workbook Wizard.
A Q S D I S C O V E R E R W E B U S E R G U I D E
Page 30 5/29/07
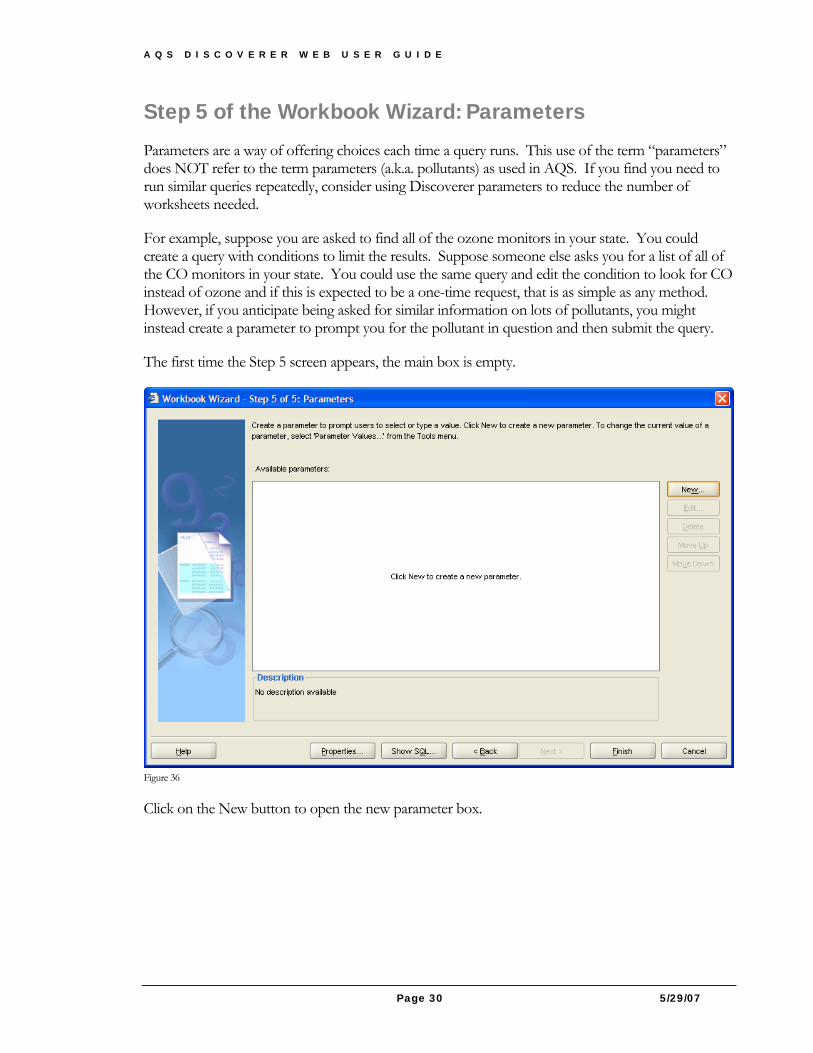
Step 5 of the Workbook Wizard: Parameters
Parameters are a way of offering choices each time a query runs. This use of the term “parameters” does NOT refer to the term parameters (a.k.a. pollutants) as used in AQS. If you find you need to run similar queries repeatedly, consider using Discoverer parameters to reduce the number of worksheets needed.
For example, suppose you are asked to find all of the ozone monitors in your state. You could create a query with conditions to limit the results. Suppose someone else asks you for a list of all of the CO monitors in your state. You could use the same query and edit the condition to look for CO instead of ozone and if this is expected to be a one-time request, that is as simple as any method. However, if you anticipate being asked for similar information on lots of pollutants, you might instead create a parameter to prompt you for the pollutant in question and then submit the query.
The first time the Step 5 screen appears, the main box is empty.
Figure 36
Click on the New button to open the new parameter box.
A Q S D I S C O V E R E R W E B U S E R G U I D E
Page 31 5/29/07
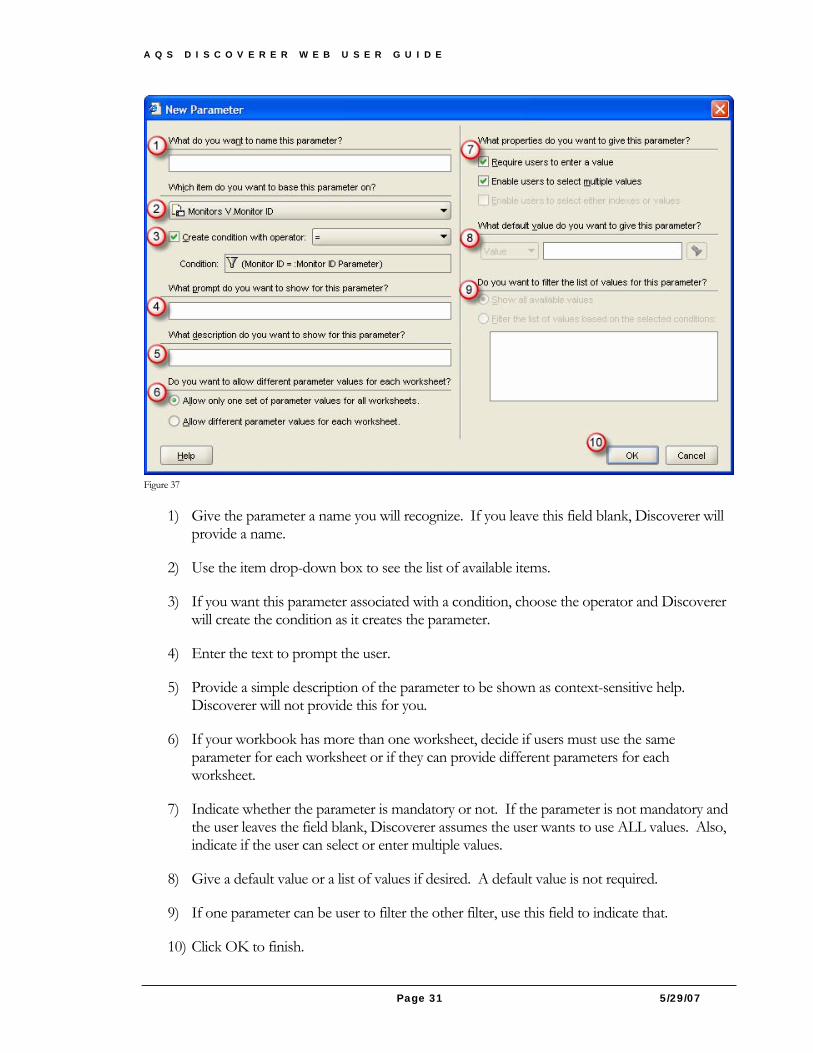
Figure 37
1) Give the parameter a name you will recognize. If you leave this field blank, Discoverer will provide a name.
2) Use the item drop-down box to see the list of available items.
3) If you want this parameter associated with a condition, choose the operator and Discoverer will create the condition as it creates the parameter.
4) Enter the text to prompt the user.
5) Provide a simple description of the parameter to be shown as context-sensitive help. Discoverer will not provide this for you.
6) If your workbook has more than one worksheet, decide if users must use the same parameter for each worksheet or if they can provide different parameters for each worksheet.
7) Indicate whether the parameter is mandatory or not. If the parameter is not mandatory and the user leaves the field blank, Discoverer assumes the user wants to use ALL values. Also, indicate if the user can select or enter multiple values.
8) Give a default value or a list of values if desired. A default value is not required.
9) If one parameter can be user to filter the other filter, use this field to indicate that.
10) Click OK to finish.
A Q S D I S C O V E R E R W E B U S E R G U I D E
Page 32 5/29/07
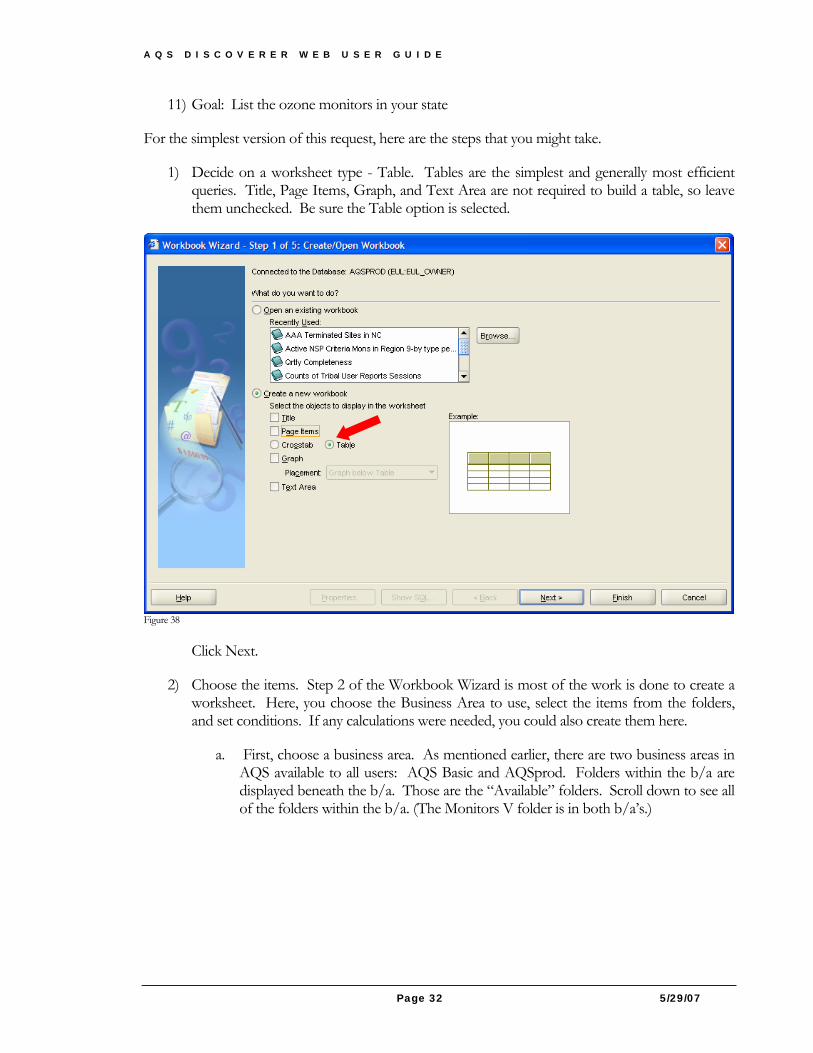
11) Goal: List the ozone monitors in your state
For the simplest version of this request, here are the steps that you might take.
1) Decide on a worksheet type - Table. Tables are the simplest and generally most efficient queries. Title, Page Items, Graph, and Text Area are not required to build a table, so leave them unchecked. Be sure the Table option is selected.
Figure 38
Click Next.
2) Choose the items. Step 2 of the Workbook Wizard is most of the work is done to create a worksheet. Here, you choose the Business Area to use, select the items from the folders, and set conditions. If any calculations were needed, you could also create them here.
a. First, choose a business area. As mentioned earlier, there are two business areas in AQS available to all users: AQS Basic and AQSprod. Folders within the b/a are displayed beneath the b/a. Those are the “Available” folders. Scroll down to see all of the folders within the b/a. (The Monitors V folder is in both b/a’s.)
A Q S D I S C O V E R E R W E B U S E R G U I D E
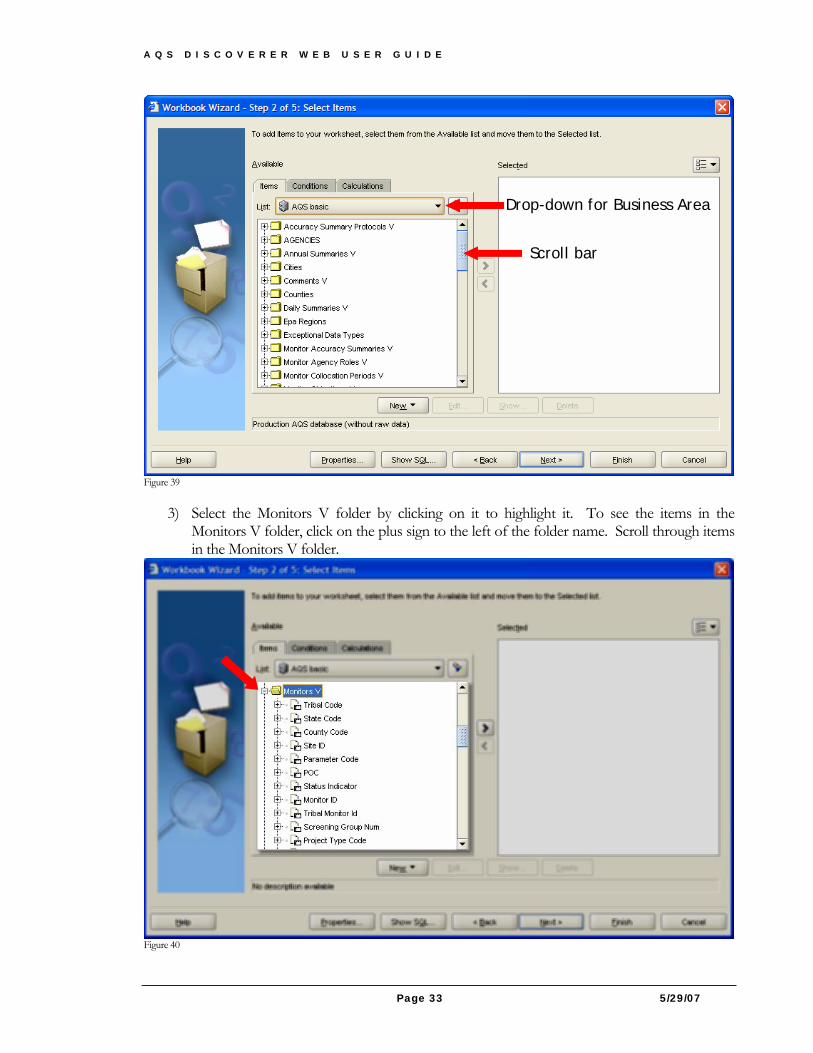
Page 33 5/29/07
Figure 39
3) Select the Monitors V folder by clicking on it to highlight it. To see the items in the Monitors V folder, click on the plus sign to the left of the folder name. Scroll through items in the Monitors V folder.