What is Driving China’s Decline in Energy Intensity? * Karen Fisher-Vanden** Dartmouth College Gary H. Jefferson Brandeis University LIU Hongmei National Bureau of Statistics TAO Quan National Bureau of Statistics April 10, 2002 Abstract In this paper, we employ a unique data set of approximately 2,500 large and medium-sized industrial enterprises in China for the years 1997-1999 to identify the factors driving the fall in total energy use and energy intensity. Using an econometric approach that identifies sources of variation in energy intensity, we find that changing energy prices and research and development expenditures are significant drivers of declining energy intensity. Changes in ownership, region, and industry composition are less important. By identifying the contribution of each of these five factors, we reduce the size of the contribution of sectoral shift and identify specific sources of productivity gain. The association between differences in relative energy prices and measured energy intensities indicates that Chinese firms are responding to prices— something not largely observed in the past. In addition, the impact of R&D spending on energy intensity suggests that firms are using resources for energy saving innovations. JEL codes: Q4, P2 * We would like to thank Su Jian for excellent research assistance. We also thank Messers Xu Jianyi , Ma Jingkui, and Liu Fujiang for making the Dartmouth-Brandeis-NBS collaboration possible, and Jim Feyrer, Mun Ho, Adam Jaffe and participants at the Rockefeller Center’s faculty seminar (February 2002) for helpful comments. This research was supported by the Rockefeller Center at Dartmouth College, the U.S. Department of Energy’s Biological and Environmental Research Program (contract # DE-FG02-00ER63030), and the National Science Foundation (project/grant #450823). **Corresponding author: Dartmouth College, 6182 Steele Hall, Hanover, NH 03755. Phone: 603-646-0213, fax: 603-646-1682, email: [email protected]
Transcript
What is Driving China’s Decline in Energy Intensity?*
Karen Fisher-Vanden**
Dartmouth College
Gary H. Jefferson Brandeis University
LIU Hongmei
National Bureau of Statistics
TAO Quan National Bureau of Statistics
April 10, 2002
Abstract In this paper, we employ a unique data set of approximately 2,500 large and medium-sized industrial enterprises in China for the years 1997-1999 to identify the factors driving the fall in total energy use and energy intensity. Using an econometric approach that identifies sources of variation in energy intensity, we find that changing energy prices and research and development expenditures are significant drivers of declining energy intensity. Changes in ownership, region, and industry composition are less important. By identifying the contribution of each of these five factors, we reduce the size of the contribution of sectoral shift and identify specific sources of productivity gain. The association between differences in relative energy prices and measured energy intensities indicates that Chinese firms are responding to prices—something not largely observed in the past. In addition, the impact of R&D spending on energy intensity suggests that firms are using resources for energy saving innovations. JEL codes: Q4, P2 * We would like to thank Su Jian for excellent research assistance. We also thank Messers Xu Jianyi , Ma Jingkui, and Liu Fujiang for making the Dartmouth-Brandeis -NBS collaboration possible, and Jim Feyrer, Mun Ho, Adam Jaffe and participants at the Rockefeller Center’s faculty seminar (February 2002) for helpful comments. This research was supported by the Rockefeller Center at Dartmouth College, the U.S. Department of Energy’s Biological and Environmental Research Program (contract # DE-FG02-00ER63030), and the National Science Foundation (project/grant #450823). **Corresponding author: Dartmouth College, 6182 Steele Hall, Hanover, NH 03755. Phone: 603-646-0213, fax: 603-646-1682, email: [email protected]
2
1. Introduction
A significant proportion of the robust economic growth that China has enjoyed over the
past 20 years has accrued from the growth of total factor productivity. China’s rising levels of
TFP have, in part, been driven by rising energy productivity. In 1990, however, as we can see
from Figure 1, China’s overall energy efficiency lagged behind that of other countries of similar
levels of per capita income. By 1998, the use of similar data indicates that China had
substantially closed the gap between its predicted and actual level of energy use
This movement toward greater energy efficiency is reflected in China’s energy intensity
over time. As shown in Figure 2, since 1978, China’s energy intensity (defined as the ratio of
real energy consumption to real GDP) has fallen dramatically. Although China’s energy
intensity has fallen since 1978, primary energy consumption and production have generally risen.
As shown in Figure 3, beginning in 1996, this trend of rising consumption and production seems
to have reversed itself. Between 1996 and 2000, total primary energy consumption fell by eight
percent, driven mainly by a 17.4 percent decline in coal consumption. This downward trend in
energy consumption has tracked a similar trend in primary energy production. During 1996-
2000, primary energy production has fell by 17.8 percent, again driven by a 26.6 percent decline
in coal production. Based on trends from 1978 to 1996, the persistence of reported high levels of
economic growth, and increases in household demand for automobiles and modern appliances,
the fall in energy production and use is contrary to what most have forecast.
Figure 1
y = -6E-07x2 + 0.2895x + 29.738
100
1000
10000
100 1000 10000 100000
1990 GDP per capita (US$, PPP, log scale)
1990
en
erg
y u
se p
er c
apit
a (k
g o
f oil
equ
iv, l
og
sca
le)
China
3
Figure 2Energy-Output Ratios, 1978-2000
02468
1012141618
1978
1980
1982
1984
1986
1988
1990
1992
1994
1996
1998
2000
10,0
00 t
on
s S
CE
/100
mill
ion
19
78 Y
uan
Source: China Statistical Yearbook, 2001 (NBS, 2001).
Figure 3Primary energy consumption
0
20000
40000
60000
80000
100000
120000
140000
1978
1980
1982
1984
1986
1988
1990
1992
1994
1996
1998
2000
10,0
00 t
on
s S
CE
HydroN. gas
OilCoal
Source: China Statistical Yearbook, 2001 (NBS, 2001).
Explanations for China’s decline in energy use and intensity fall into three categories.
The first is gains in energy efficiency: at the firm level, energy productivity could be improving,
thereby lowering the amount of energy required to produce a unit of output. The second possible
explanation centers on structural change: sectoral output shares could be changing, so that the
share of the more energy intensive sectors in total output could be declining. Finally,
inaccuracies in China’s energy statistics could be underreporting the amount of energy
consumed, and/or overestimating the growth of output. Although previous work has also
attempted to measure the relative contribution of each of these factors, we have the advantage of
4
a data set, which includes industry detail at the 3 and 4-digit levels. In addition, we use a large
sample of data to estimate a range of contributions – prices, R&D expenditure, ownership
change, and other factors – to changes in energy productivity at the firm level. This level of
detail has not been previously possible.
A number of studies have attempted to measure the relative contributions of sectoral shift
and sub-sector productivity change. Using decomposition methods, Garbaccio, Ho and
Jorgenson (1999), Lin and Polenske (1995), and Sinton and Levine (1994) each find sub-sector
productivity change to be the principal contributor to the fall in China’s energy-output ratio.1
A shortcoming of these studies is the aggregate nature of the data used. Most of the
studies use industrial data, which are aggregated at the 2-digit industry level. As acknowledged
in previous studies and confirmed by our analysis, this level of aggregation can overstate the
contribution of sub-sector energy productivity improvements and understate the role of sectoral
shift. A second shortcoming of prior research is the inability of these studies to identify factors
that drive sub-sector energy productivity improvements. Such factors include changes in energy
prices, differences in energy efficiency across ownership types, and differences in R&D intensity
that may have important policy implications. A third drawback of prior studies is that the data
cover broad, heterogeneous segments of the Chinese economy. While these studies have the
advantage of comprehensive coverage, by including data collected from the non- industrial
sectors and smaller firms, these studies also run a greater risk of inaccurate data. Lastly, these
previous studies do not cover the period 1996-1999, during which we observe not only a
continuation of the decline in energy intensity, but also a fall in total energy consumption.
In this paper we employ a unique data set of approximately 2,500 large and medium-
sized Chinese industrial enterprises for the years 1997-1999. We use the data to identify the
factors that are driving the fall in total energy use and energy intensity, while hopefully resolving
the issues faced in previous studies. Similar to these previous studies, we find that
improvements in energy productivity play a larger role than sectoral shift in explaining the
decline in energy intensity. The magnitude of this contribution varies significantly, depending
on the level of industry aggregation used. In explaining improvements in firm-level energy
productivity, we find that in some measure shifts in output across ownership type, region, and
1 Garbaccio, Ho, and Jorgenson compare 1987 and 1995; Lin and Polenske compare 1981 and 1987, and Sinton and Levine compare different years between 1980 and 1990.
5
industry all contribute efficiency improvements. The largest contributions, however, originate
from energy prices and research and development activity within the firm. Price changes
account for the largest efficiency gains. This result suggests that Chinese firms are reacting to
changing energy prices—something not observed in the past.
We conduct an analysis of the level of price variation in energy markets across region,
ownership type, and industry. That prices tend to be the highest in the eastern coastal provinces
suggests that energy prices in this area have most fully adapted to world prices. If energy prices
in other regions of China rose to match those in coastal areas, then presumably the country could
achieve even further efficiency gains.
The paper is organized as follows. Section 2 describes the data set we use; in this
section, we place our sample within the context of China’s overall industry and all large and
medium enterprises. Section 3 compares trends in consumption and efficiency by energy type
between our sample, total industry, and the Chinese economy as a whole ; we discuss the possible
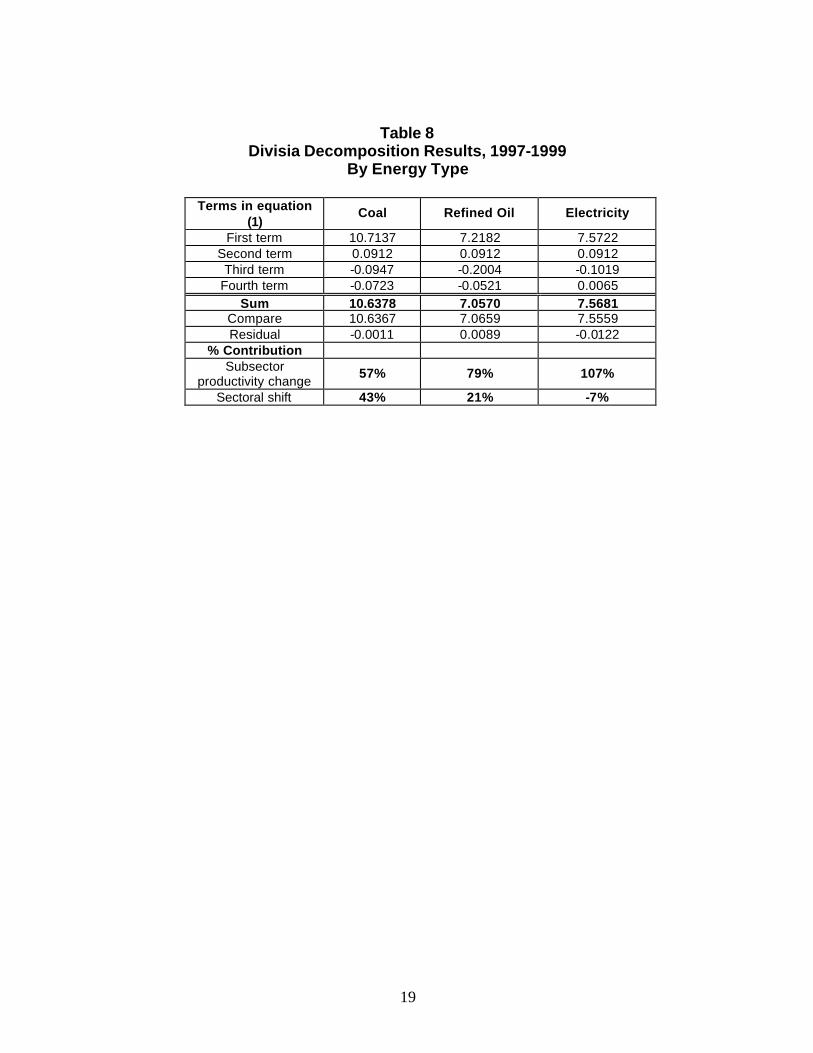
explanations for these trends. Section 4 applies the Divisia decomposition method to our sample
to measure the relative contribution of sectoral shift and productivity change. Section 5 provides
a closer examination of the improvements in firm-level energy productivity by conducting an
econometric analysis to identify the factors driving these improvements. Section 6 examines the
market efficiency of energy prices (a factor shown to be important in explaining firm-level
energy productivity improvements) by conducting an econometric analysis to test the importance
of region, ownership and industry differences on energy prices. Lastly, we present the
conclusions of our research in Section 7.
6
2. Data Description
The analyses presented in this paper were conducted using a dataset spanning
approximately 2,500 large and medium-size Chinese industrial enterprises for the years 1997-
1999. The energy data are combined with two other data sets of data that cover all of China’s
approximately 22,000 large and medium-size enterprises (LMEs) and are updated annually by
the National Bureau of Statistics (NBS) in China. The first is an economic and financial data set,
collected by the Bureau’s Department of Industrial and Transportation Statistics [NBS, 2001b];
the second data set, which consists of science and technology measures, including innovation
inputs and outputs, is maintained by the Bureau’s Department of Population, Social, and Science
and Technology Statistics [NBS, 2001c]. These two data sets include all of China’s
approximately 22,000 large and medium-size enterprises, far more than the 3,700-4,700
enterprises that have been covered by the energy survey in recent years.
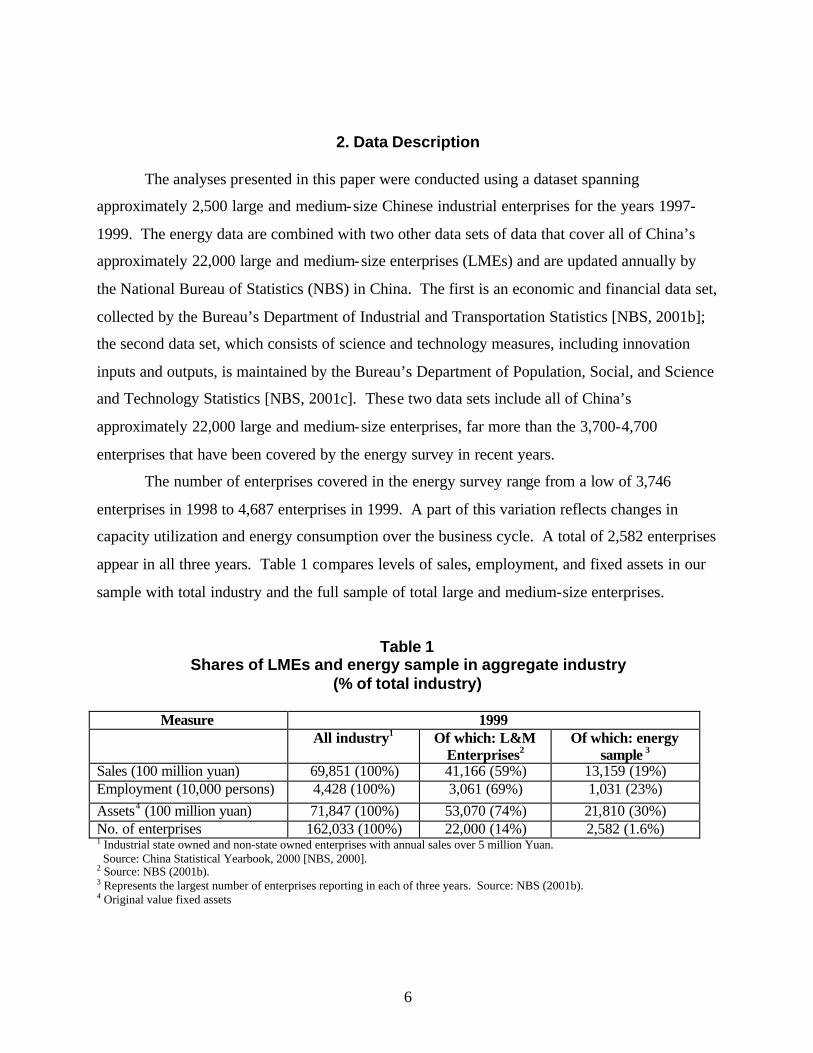
The number of enterprises covered in the energy survey range from a low of 3,746
enterprises in 1998 to 4,687 enterprises in 1999. A part of this variation reflects changes in
capacity utilization and energy consumption over the business cycle. A total of 2,582 enterprises
appear in all three years. Table 1 compares levels of sales, employment, and fixed assets in our
sample with total industry and the full sample of total large and medium-size enterprises.
Table 1 Shares of LMEs and energy sample in aggregate industry
(% of total industry)
Measure 1999 All industry1 Of which: L&M
Enterprises2 Of which: energy
sample 3
Sales (100 million yuan) 69,851 (100%) 41,166 (59%) 13,159 (19%) Employment (10,000 persons) 4,428 (100%) 3,061 (69%) 1,031 (23%) Assets4 (100 million yuan) 71,847 (100%) 53,070 (74%) 21,810 (30%) No. of enterprises 162,033 (100%) 22,000 (14%) 2,582 (1.6%) 1 Industrial state owned and non-state owned enterprises with annual sales over 5 million Yuan. Source: China Statistical Yearbook, 2000 [NBS, 2000]. 2 Source: NBS (2001b). 3 Represents the largest number of enterprises reporting in each of three years. Source: NBS (2001b). 4 Original value fixed assets
7
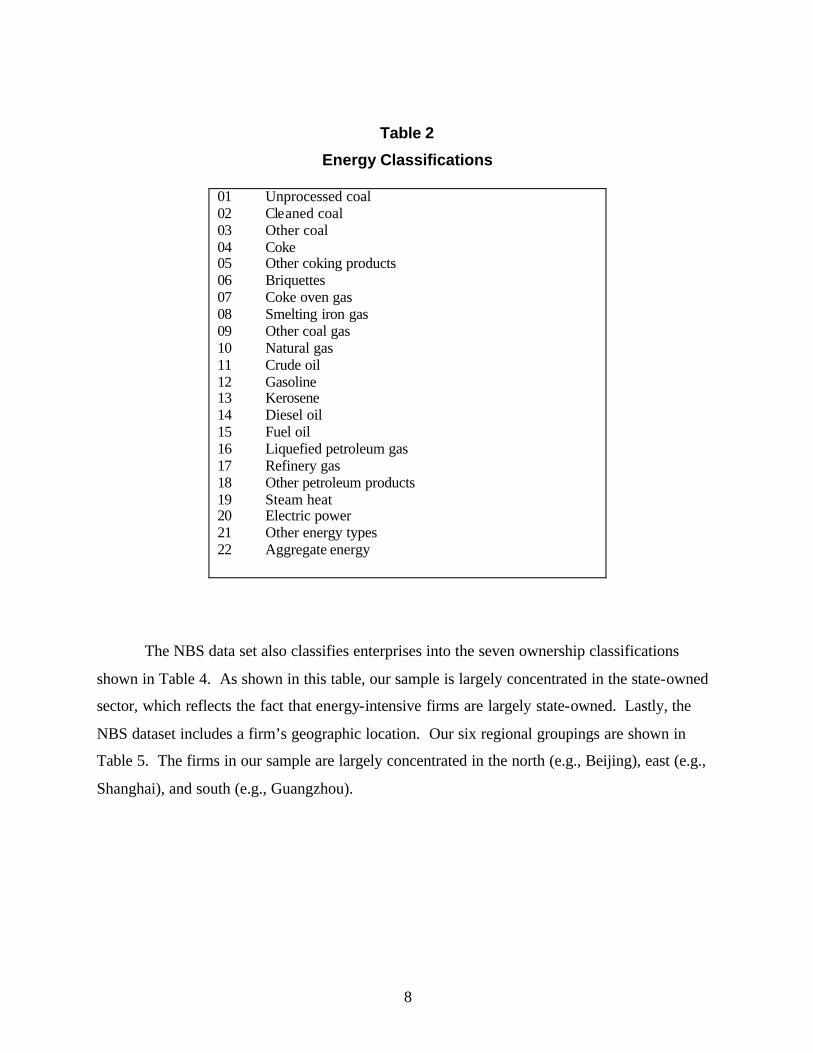
The energy dataset includes 21 energy types and a measure of aggregate energy
consumption (Table 2). These data, collected annua lly by the NBS, are reported by the most
energy intensive enterprises among the population of large and medium-size enterprises. In this
paper, we concentrate on energy types that comprise a large share of total energy use and are
consumed for combustion purposes. Three energy categories (in addition to aggregate energy)
were created from the 21 energy types provided in the data: coal and coal products (01-06),
refined oil (12-17), and electricity (20). Crude oil (11) was not included in this classification
since it is almost entirely consumed in the refined oil sector. Coal gases (07-09) and natural gas
(10) were not included due to their small relative share of total energy and the presence of
relatively few observations in the data set. Due to the non-combustion functions, other
petroleum products (18), steam heat (19), and other energy types (21) were not included.
The NBS data set classifies enterprises into 37 industrial categories. For the purposes of
this analysis, we group the 37 industrial classifications into12 industry categories. Table 3 shows
the distribution of the enterprises in our sample over these 12 industrial sectors. Not
surprisingly, relative to the distribution of total industry and LMEs, the energy sample includes a
higher incidence of enterprises in the more energy- intensive industries. The chemical and
electric power industries are among those that are over-represented relative to the total industry
and LME populations.
8
Table 2
Energy Classifications
01 Unprocessed coal 02 Cleaned coal 03 Other coal 04 Coke 05 Other coking products 06 Briquettes 07 Coke oven gas 08 Smelting iron gas 09 Other coal gas 10 Natural gas 11 Crude oil 12 Gasoline 13 Kerosene 14 Diesel oil 15 Fuel oil 16 Liquefied petroleum gas 17 Refinery gas 18 Other petroleum products 19 Steam heat 20 Electric power 21 Other energy types 22 Aggregate energy
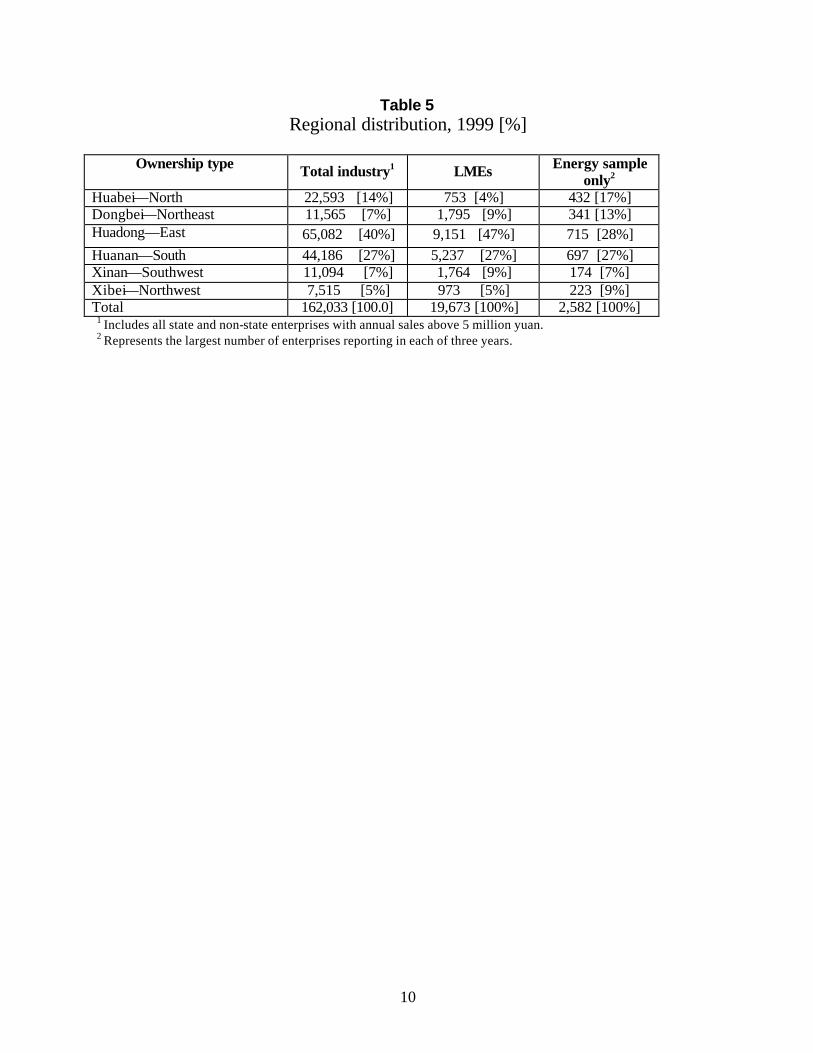
The NBS data set also classifies enterprises into the seven ownership classifications
shown in Table 4. As shown in this table, our sample is largely concentrated in the state-owned
sector, which reflects the fact that energy-intensive firms are largely state-owned. Lastly, the
NBS dataset includes a firm’s geographic location. Our six regional groupings are shown in
Table 5. The firms in our sample are largely concentrated in the north (e.g., Beijing), east (e.g.,
Shanghai), and south (e.g., Guangzhou).
9
Table 3 Industry distribution, 1999 [%]
Industry classification
(2-digit SIC) Total industry1 LMEs Energy sample only2
Electric power (44) 4,941 [3%] 1,039 [5%] 286 [11%] Other industry (43,45,46) 14,335 [9%] 971 [4%] 68 [3%] Total 162,033 [100%] 22,589 [100%] 2,582 [100%]
1 Includes all state and non-state enterprises with annual sales above 5 million yuan. Source: NBS (2000). 2 Represents the largest number of enterprises reporting in each of three years.
Total 162,033 [100%] 22,111 [100%] 2,582 [100%] 1 Includes all state and non-state enterprises with annual sales above 5 million yuan. 2 Represents the largest number of enterprises reporting in each of three years.
1 Includes all state and non-state enterprises with annual sales above 5 million yuan. 2 Represents the largest number of enterprises reporting in each of three years.
11
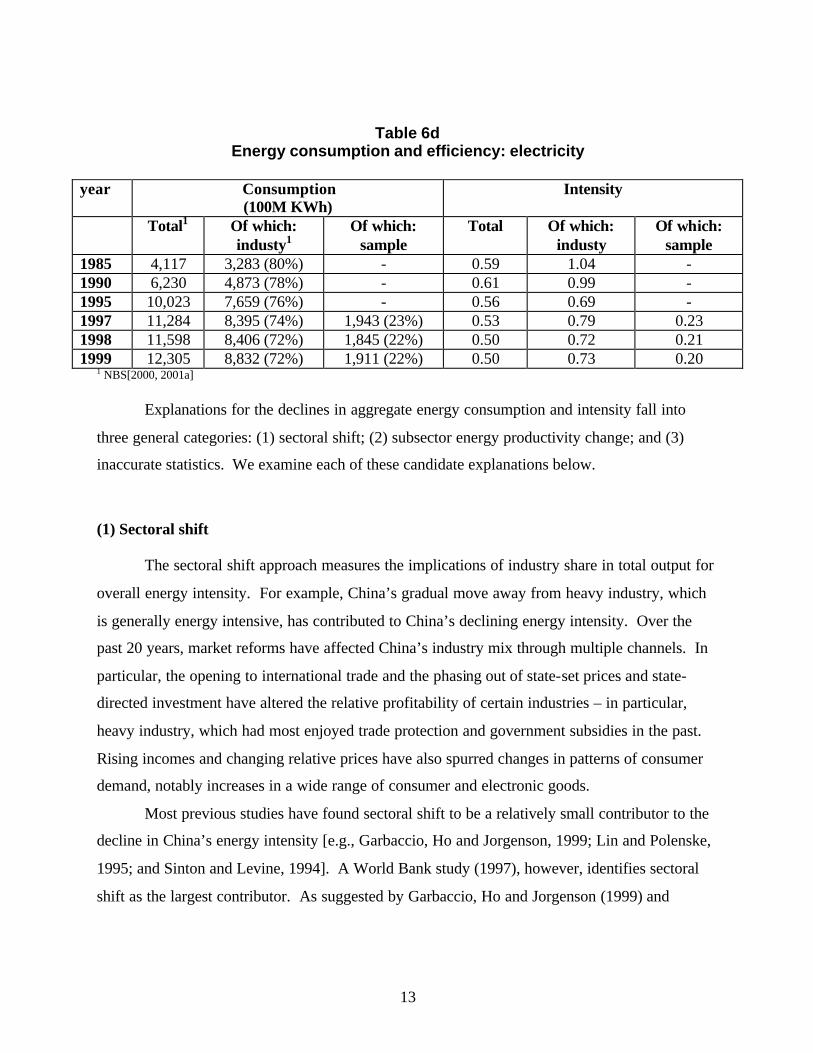
3. Energy Consumption and Intensity, 1997-1999
How do the consumption and intensity figures in our survey data compare with the
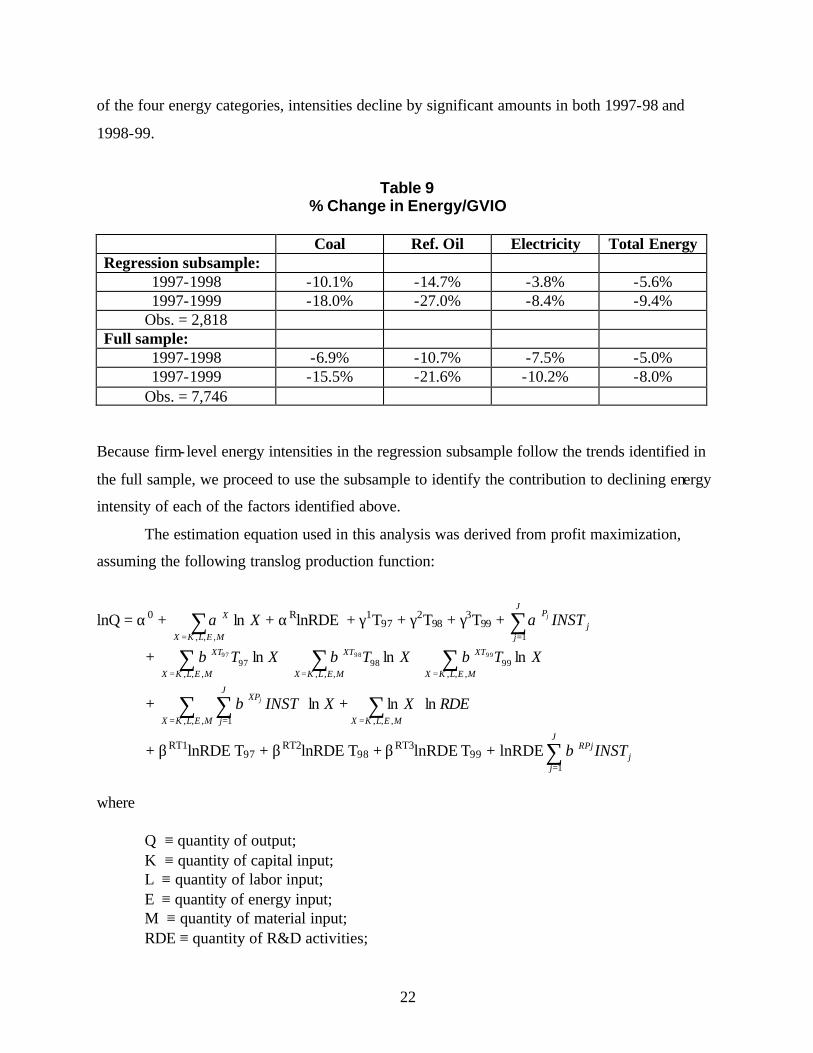
national trends shown above in Figures 2 and 3? Tables 6a-e compare consumption and intensity
figures for total energy, coal, oil and electricity in our sample with total industry and economy-
wide figures from the national statistics. The trends in our sample mirror those of the total
economy and industrial sector—namely, consumption levels of total energy, coal, and oil have
fallen since 1996 while electricity has risen. In addition, the ratios of consumption of total
energy, coal, oil, and electricity to output have all decreased, implying a fall in the intensity of
each energy type.
Table 6a Overall energy consumption and efficiency
Q ≡ quantity of output; K ≡ quantity of capital input; L ≡ quantity of labor input; E ≡ quantity of energy input; M ≡ quantity of material input; RDE ≡ quantity of R&D activities;
23
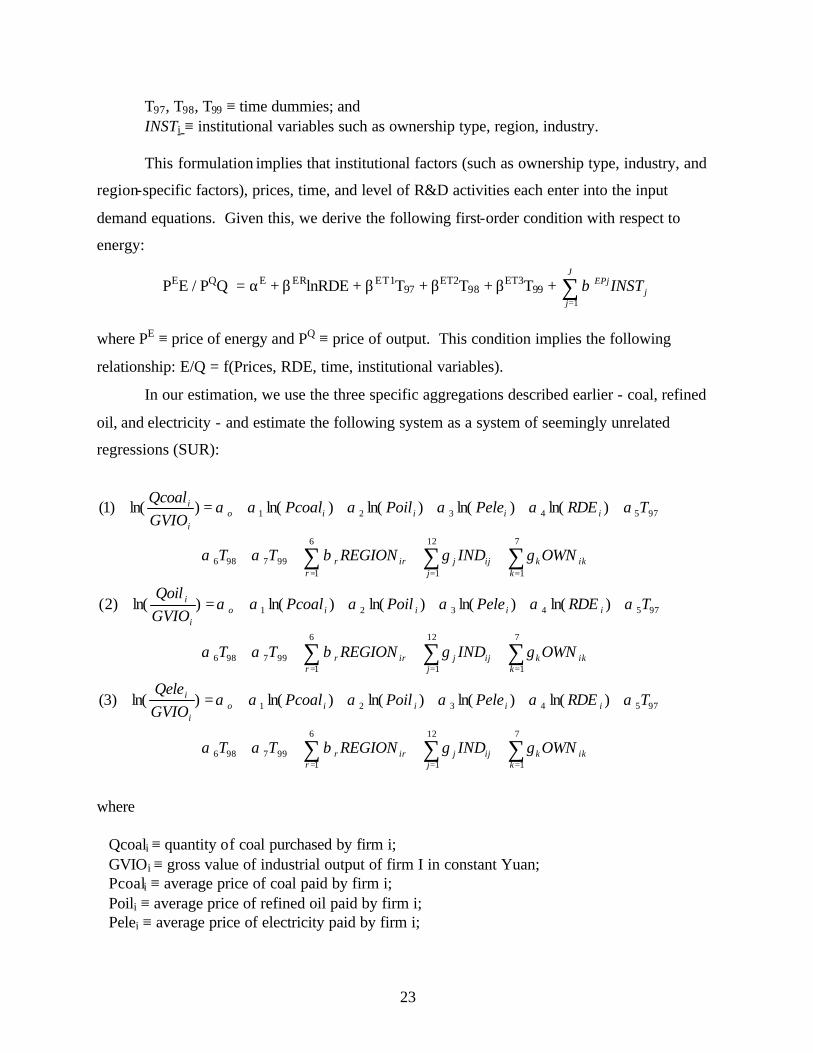
T97, T98, T99 ≡ time dummies; and INSTi ≡ institutional variables such as ownership type, region, industry.
This formulation implies that institutional factors (such as ownership type, industry, and
region-specific factors), prices, time, and level of R&D activities each enter into the input
demand equations. Given this, we derive the following first-order condition with respect to
where PE ≡ price of energy and PQ ≡ price of output. This condition implies the following
relationship: E/Q = f(Prices, RDE, time, institutional variables).
In our estimation, we use the three specific aggregations described earlier - coal, refined
oil, and electricity - and estimate the following system as a system of seemingly unrelated
regressions (SUR):
∑∑∑
∑∑∑
∑∑∑
===
===
===
++++
++++++=
++++
++++++=
++++
++++++=
7
1
12
1
6
1997986
9754321
7
1
12
1
6
1997986
9754321
7
1
12
1
6
1997986
9754321
)ln()ln()ln()ln()ln( )3(
)ln()ln()ln()ln()ln( )2(
)ln()ln()ln()ln()ln( )1(
kikk
jijj
rirr
iiiioi
i
kikk
jijj
rirr
iiiioi
i
kikk
jijj
rirr
iiiioi
i
OWNINDREGIONTT
TRDEPelePoilPcoalGVIOQele
OWNINDREGIONTT
TRDEPelePoilPcoalGVIOQoil
OWNINDREGIONTT
TRDEPelePoilPcoalGVIOQcoal
γγβαα
αααααα
γγβαα
αααααα
γγβαα
αααααα
where
Qcoali ≡ quantity of coal purchased by firm i; GVIOi ≡ gross value of industrial output of firm I in constant Yuan; Pcoali ≡ average price of coal paid by firm i; Poili ≡ average price of refined oil paid by firm i; Pelei ≡ average price of electricity paid by firm i;
24
RDEi ≡ research and development expenditures by firm i;3 T97, T98, T99 ≡ dummy variables associated with years 1997-1999; REGIONir ≡ dummy variables associated with 6 regions (refer to table 5 for list of regions); INDij ≡ dummy variables associated with 12 industry categories (refer to table 3 for list of
industries); and OWN ik ≡ dummy variables associated with 7 ownership types (refer to table 4 for list of
ownership types).
In each set of estimates, the reference intercept includes state-owned enterprises, the
machinery industry, the Xibei (northwest) region, and the year 1997. The results from the SUR
are shown in columns (a)-(c) of Table 10. In addition, we estimated a demand equation for
aggregate energy. These results are shown in column (d) of Table 10. In all four cases, prices
are significant and the sign of the coefficients are consistent with our prior expectations – own-
price elasticities are negative implying that an increase in the price of the energy type will
decrease intensity (and increase efficiency defined as GVIO/E) and cross-prices are positive
implying that the three energy types are substitutes. Expenditure on research and development is
also significant for coal, electricity, and aggregate energy. The negative sign on the coefficient
implies an increase in R&D activities increases energy efficiency and decrease energy intensity.
Firm ownership matters only in certain cases. In particular, foreign- invested firms are
more efficient than state-owned firms in their use of all four energy types, as reflected in the
negative coefficient. Collectives, foreign, and Hong-Kong-Macao-Taiwan (HKMT) firms all
generally exhibit greater energy efficiency than their SOE counterparts. Industry-specific factors
are also significant in explaining efficiency levels. Mining, petroleum processing, non-metal
mineral products, metal processing and products, electric power, and other all report high levels
of energy intensity across all four categories relative to machinery. Even after controlling for
differences in prices, ownership, and industry mix, we find significant regional differences.
Huadong (East) and Huanan (South) report consistently lower levels of energy intensity than the
rest of the country. These differences may reflect generally higher levels of firm-level
efficiency in these coastal regions. Lastly, year-specific factors seem to matter largely in the
case of refined oil. This result indicates that while the price and institutional factors included in
the regressions are largely able to explain the declining energy intensity for the oil, electricity,
3 We use current R&D expenditures as a proxy for the accumulation of past R&D expenditures. Regressing lagged R&D expenditures on current R&D expenditures, we find current R&D expenditures to be a good predictor of past
25
and aggregate energy sectors, our regression analysis is generally unable to identify the specific
factors that explain the decline in the intensity of use of refined oil.
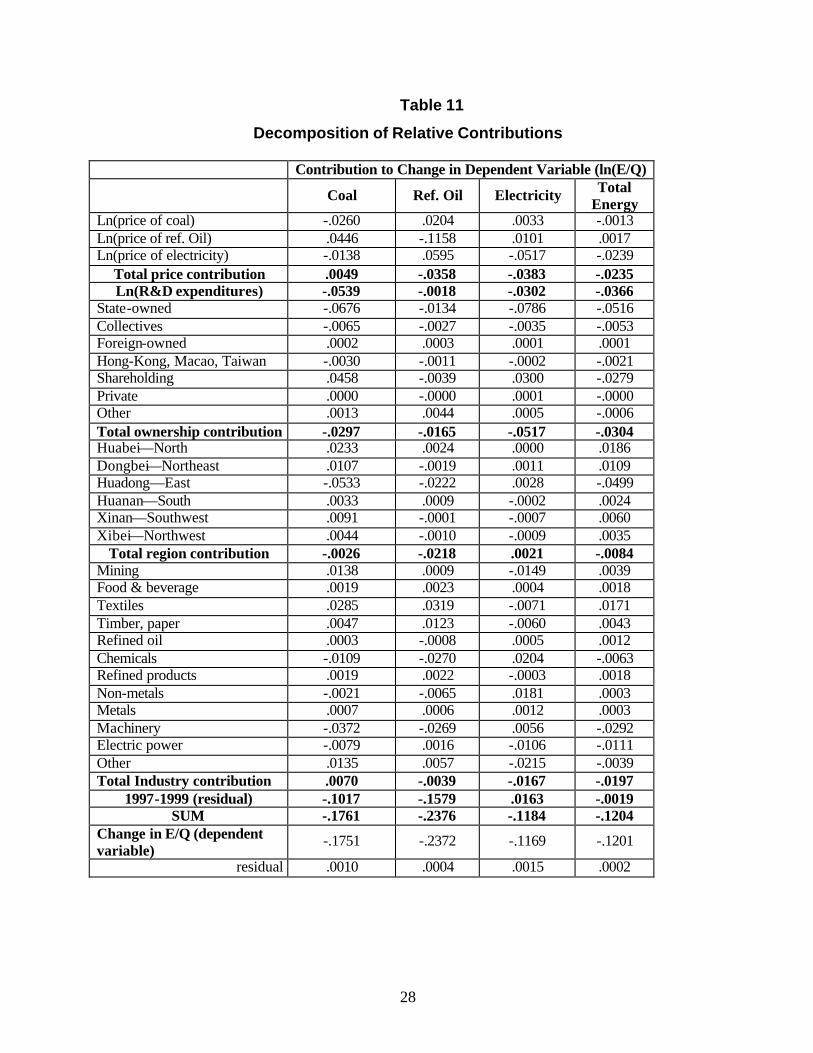
In Table 11, we decompose the relative contribution of each of the factors to changes in
the dependent variable (i.e., the log of energy intensity) from 1997 to 1999. Relative
contributions are calculated by multiplying the change in the within sample mean of each of the
independent variable by the relevant coefficient.4
Prices of each of the three energy types increased from 1997 to 1999. In the case of coal,
the increase in coal and electricity prices led to a decrease in coal intensity, but this fall was
offset by the increase in oil prices, which led to a substitution toward coal. For the other energy
categories, however, the decline in energy intensity resulting from own-price increases
outweighed the increase in energy intensity from substitution.
R&D expenditures. Using current R&D expenditures (rather than lagged) allows us to retain one year of observations. 4 Because the firms in our sample do not change industry or region over time, we use coefficients from a regression that uses share of total output in each dummy category rather than zero or one.
26
Table 10
Determinants of intensity by energy type1
Dependent variable = ln(Quantity of energy/constant GVIO)
Coal (a)
Refined Oil (b)
Electricity (c)
Aggregate Energy
(d)
Constant2 -2.763*** (0.239)
-4.541*** (0.208)
-3.564*** (0.151)
-1.360*** (0.141)
Ln(price of coal) -0.513*** (0.057)
0.406*** (0.049)
0.066* (0.036)
-0.023 (0.033)
Ln(price of refined oil) 0.408*** (0.060)
-1.070*** (0.052)
0.092** (0.038)
0.012 (0.035)
Ln(price of electricity) -0.069 (0.045)
0.301*** (0.040)
-0.261*** (0.029)
-0.120*** (0.027)
Ln(R&D expenditures) -0.125*** (0.017)
-0.005 (0.015)
-0.070*** (0.011)
-0.085*** (0.010)
Collectives -0.715*** (0.180)
-0.249 (0.156)
-0.522*** (0.113)
-0.571*** (0.106)
Foreign -0.501*** (0.197)
-0.490*** (0.171)
-0.434*** (0.124)
-0.363*** (0.116)
Hong Kong, Macao, Taiwan
-0.702*** (0.243)
-0.223 (0.221)
-0.302** (0.153)
-0.514*** (0.143)
Shareholding -0.003 (0.089)
-0.057 (0.077)
-0.118** (0.056)
-0.032 (0.052)
Private 0.512 (0.943)
0.245 (0.820)
0.858 (0.594)
0.100 (0.555)
Other 0.011 (0.410)
0.888*** (0.356)
-0.205 (0.258)
-0.095 (0.241)
Mining (06-10, 12) 0.721*** (0.128)
1.529*** (0.111)
1.300*** (0.080)
1.324*** (0.075)
Food and beverage (13-16)
0.157 (0.138)
-0.917*** (0.120)
-0.841*** (0.087)
-0.253*** (0.082)
Textile, apparel, and leather products (17-19)
-0.449*** (0.140)
-1.395*** (0.122)
0.338*** (0.088)
0.142* (0.082)
Timber, furniture, and paper (20-24)
1.435*** (0.170)
-0.511*** (0.148)
0.706*** (0.107)
1.004*** (0.100)
Petroleum processing and coking (25)
2.589*** (0.278)
0.555** (0.242)
0.281* (0.175)
3.320*** (0.164)
Chemicals (26-28) 1.486*** (0.102)
-0.253*** (0.089)
1.074*** (0.065)
1.319*** (0.061)
Rubber and plastic products (29-30)
0.466*** (0.186)
-0.438*** (0.161)
-0.053 (0.117)
0.043 (0.109)
Non-metal mineral products (31)
2.058*** (0.119)
1.053*** (0.103)
1.235*** (0.075)
1.783*** (0.070)
Metal processing and products (32-34)
1.189*** (0.122)
0.826*** (0.106)
1.297*** (0.077)
1.379*** (0.072)
Electric power (44) 3.303*** (0.230)
1.413*** (0.200)
1.046*** (0.145)
3.219*** (0.135)
27
Other (43,45,46) 0.751*** (0.233)
0.990*** (0.203)
2.053*** (0.147)
2.191*** (0.137)
Huabei—North -0.060 (0.122)
-0.391*** (0.106)
-0.236*** (0.077)
-0.048 (0.072)
Dongbei—Northeast 0.132 (0.129)
-0.071 (0.112)
-0.355*** (0.081)
-0.134* (0.076)
Huadong—East -0.024 (0.123)
-0.767*** (0.107)
-0.177** (0.078)
-0.188*** (0.073)
Huanan—South -0.378*** (0.122)
-0.687*** (0.106)
-0.136* (0.077)
-0.204*** (0.072)
Xinan—Southwest -0.216 (0.157)
-0.246* (0.136)
-0.132 (0.099)
0.016 (0.092)
1998 -0.070 (0.076)
-0.206*** (0.066)
-0.019 (0.048)
-0.035 (0.044)
1999 -0.130* (0.077)
-0.194*** (0.067)
-0.028 (0.048)
-0.038 (0.045)
R sq. (obs.) 0.277 (2818)
0.373 (2818)
0.3656 (2818)
0.4752 (2813)
1 Standard errors in parentheses. 2 The constant term include state-owned enterprises, the machinery, equipment and instrument industries (35-37, 39-42), the Xibei (Northwest) region, and the year 1997. * Significant at the 10% level, ** Significant at the 5% level, *** Significant at the 1% level.
In all cases, increases in research and development activities resulted in significant
decreases in energy intensity. For coal, R&D activity was the factor that contributed the most to
the fall in energy intensity. Change in the share of output by ownership type also contributed
significantly to declines in energy intensity. In particular, the declining share of output from
state-owned enterprises significantly reduced the intensity of each of the energy types including
aggregate energy. A substantia l portion of these reallocations of output was made to the
shareholding sector, which exhibits a lower level of energy intensity than state industry. In terms
of region, for coal, refined oil and aggregate energy an increase in the share of output in the east
coast region (in which more efficient firms are typically found) led to a decline in energy
intensity. Changes in the distribution of output across out 12 industry classifications made a
small contribution to declining energy intensity. With the exception of coal, shifts in the
composition of industry output led to small improvements in energy efficiency in each of the
other energy aggregates.
28
Table 11
Decomposition of Relative Contributions
Contribution to Change in Dependent Variable (ln(E/Q)
Coal Ref. Oil Electricity Total Energy
Ln(price of coal) -.0260 .0204 .0033 -.0013 Ln(price of ref. Oil) .0446 -.1158 .0101 .0017 Ln(price of electricity) -.0138 .0595 -.0517 -.0239
We note several interesting implications of this regression analysis. First, we see that
price and quantity adjustments played an important role in the decline in energy intensity, as
demand seemed to have gravitated toward energy types that posted smaller price increases.
Also, it appears that innovation associated with the R&D process is resulting in considerable
energy savings.
We should also note that, due to the short time series in our data set, the price elasticities
we estimate are principally long-run elasticities since they are based on the cross-sections. From
the magnitude of the “1997-1999 (residual)” term, we see that these long-run elasticities
significantly underestimate the short-run decline in the intensities of coal and refined oil. On
average, the price of coal increased less than the price of refined oil, and the price of electricity
increased significantly more than the prices of coal and refined oil from 1997 to 1999. Thus, in
the case of coal, we see a significant substitution effect from the fall in the relative price of coal.
That is, the total price contribution actually leads to an increase in coal intensity. This
substitution effect is much larger in the long-run and therefore results in an underestimation of
the decline in coal intensity in the short-run.
Our final observation concerns a comparison of the role of sectoral shift. Our Divisia
analysis applied to the 12-sector classification concluded that 26.8 percent of the decline in
industry intensity could be attributed to changes in the composition of industry output. The
decomposition based on the regression analysis attributes a smaller portion – 16.4 percent (i.e.,
“total industry contribution” divided by “sum”) – to changes in the distribution of output across
the same 12 sectors. Apparently some portion of the sectoral shift contribution found in the
Divisia analysis is attributable to systematic differences in price, R&D intensity, changes in
ownership composition, and shifts in regional allocations across the 12 sectors.
30
6. Efficiency of prices
From our previous analysis, we found price changes to be a large contributor to energy
efficiency improvements. This finding raises the question, how efficient are energy markets in
China? That is, how fragmented are energy markets across region, ownership, and industry? If
prices are highly uneven and, in general, higher in coastal areas than in interior areas where we
might expect prices to be more consistent with world prices, then we might surmise that
significant potential exists for efficiency gains by “getting prices right.”
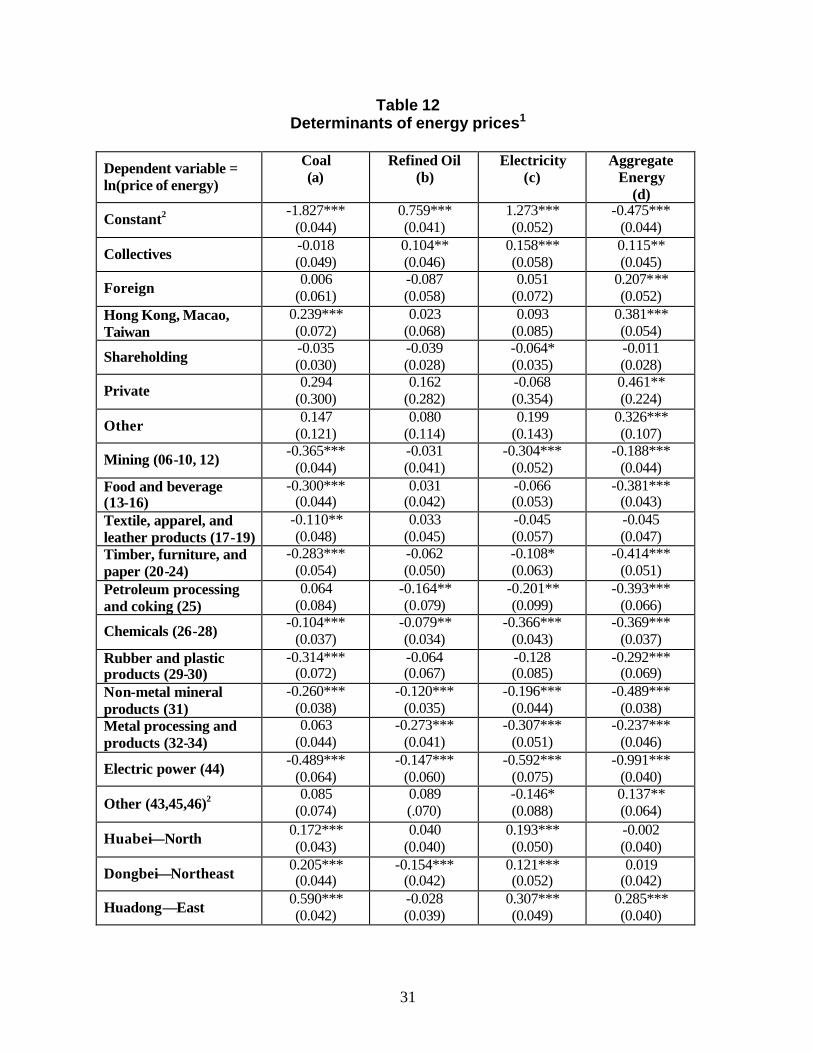
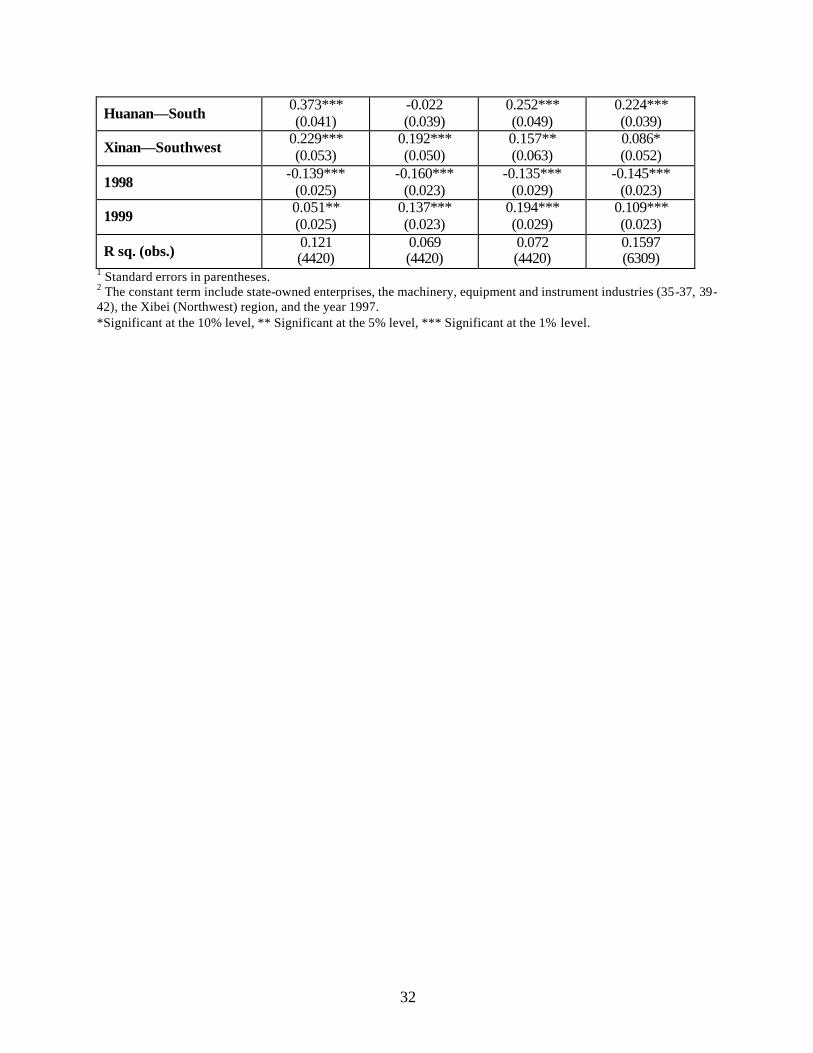
In Table 12, we examine the extent of market efficiency by energy type. To test for
market efficiency, we regress energy prices on ownership, industry, and regional differences. To
the extent that these regressors serve to explain differences in energy prices, we find evidence of
market fragmentation. If these conditions are not significant determinants of energy prices, we
postulate the presence of efficient markets. That is, the closer the R-square is to zero, the more
efficient the market.
Comparing R2’s and coefficients across energy types, we find the market for refined oil
to be the least fragmented and the market for coal to be the most fragmented. Given the
problems associated with transporting coal across China, it is not surprising that we should find
significant fragmentation across regions. This is also true with electricity due to limited linkages
across regions of distribution grids.
Using the coefficient on the Eastern region as an indicator of world prices, we see that
prices in other regions tend to be lower. These results, in combination with the results shown in
Table 11, suggest that the potential for efficiency gains could be realized if regions, ownership
types, and industries all faced uniform (world) energy prices.
31
Table 12 Determinants of energy prices1
Dependent variable = ln(price of energy)
Coal (a)
Refined Oil (b)
Electricity (c)
Aggregate Energy
(d)
Constant2 -1.827*** (0.044)
0.759*** (0.041)
1.273*** (0.052)
-0.475*** (0.044)
Collectives -0.018 (0.049)
0.104** (0.046)
0.158*** (0.058)
0.115** (0.045)
Foreign 0.006 (0.061)
-0.087 (0.058)
0.051 (0.072)
0.207*** (0.052)
Hong Kong, Macao, Taiwan
0.239*** (0.072)
0.023 (0.068)
0.093 (0.085)
0.381*** (0.054)
Shareholding -0.035 (0.030)
-0.039 (0.028)
-0.064* (0.035)
-0.011 (0.028)
Private 0.294 (0.300)
0.162 (0.282)
-0.068 (0.354)
0.461** (0.224)
Other 0.147 (0.121)
0.080 (0.114)
0.199 (0.143)
0.326*** (0.107)
Mining (06-10, 12) -0.365*** (0.044)
-0.031 (0.041)
-0.304*** (0.052)
-0.188*** (0.044)
Food and beverage (13-16)
-0.300*** (0.044)
0.031 (0.042)
-0.066 (0.053)
-0.381*** (0.043)
Textile, apparel, and leather products (17-19)
-0.110** (0.048)
0.033 (0.045)
-0.045 (0.057)
-0.045 (0.047)
Timber, furniture, and paper (20-24)
-0.283*** (0.054)
-0.062 (0.050)
-0.108* (0.063)
-0.414*** (0.051)
Petroleum processing and coking (25)
0.064 (0.084)
-0.164** (0.079)
-0.201** (0.099)
-0.393*** (0.066)
Chemicals (26-28) -0.104*** (0.037)
-0.079** (0.034)
-0.366*** (0.043)
-0.369*** (0.037)
Rubber and plastic products (29-30)
-0.314*** (0.072)
-0.064 (0.067)
-0.128 (0.085)
-0.292*** (0.069)
Non-metal mineral products (31)
-0.260*** (0.038)
-0.120*** (0.035)
-0.196*** (0.044)
-0.489*** (0.038)
Metal processing and products (32-34)
0.063 (0.044)
-0.273*** (0.041)
-0.307*** (0.051)
-0.237*** (0.046)
Electric power (44) -0.489*** (0.064)
-0.147*** (0.060)
-0.592*** (0.075)
-0.991*** (0.040)
Other (43,45,46)2 0.085 (0.074)
0.089 (.070)
-0.146* (0.088)
0.137** (0.064)
Huabei—North 0.172*** (0.043)
0.040 (0.040)
0.193*** (0.050)
-0.002 (0.040)
Dongbei—Northeast 0.205*** (0.044)
-0.154*** (0.042)
0.121*** (0.052)
0.019 (0.042)
Huadong—East 0.590*** (0.042)
-0.028 (0.039)
0.307*** (0.049)
0.285*** (0.040)
32
Huanan—South 0.373*** (0.041)
-0.022 (0.039)
0.252*** (0.049)
0.224*** (0.039)
Xinan—Southwest 0.229*** (0.053)
0.192*** (0.050)
0.157** (0.063)
0.086* (0.052)
1998 -0.139*** (0.025)
-0.160*** (0.023)
-0.135*** (0.029)
-0.145*** (0.023)
1999 0.051** (0.025)
0.137*** (0.023)
0.194*** (0.029)
0.109*** (0.023)
R sq. (obs.) 0.121 (4420)
0.069 (4420)
0.072 (4420)
0.1597 (6309)
1 Standard errors in parentheses. 2 The constant term include state-owned enterprises, the machinery, equipment and instrument industries (35-37, 39-42), the Xibei (Northwest) region, and the year 1997. *Significant at the 10% level, ** Significant at the 5% level, *** Significant at the 1% level.
33
7. Conclusions
In this paper, we have attempted to identify and measure the factors driving the fall in
China’s energy intensity and use during the period 1997-1999. According to our Divisia
calculations, sectoral shifts account for the smaller part of this decline, although the contribution
of sectoral shifts increases as we move to the three-digit level of industry detail. Subsector
energy productivity gains account for most of the decline. Unlike previous studies, we are able to
identify the factors behind improvements in firm-level energy productivity. We find that energy
prices and R&D activities are important contributors to the decline in firm-level energy intensity.
We also find that changes in the share of output by region, ownership type, and industry
contribute to declines in measured energy intensity. The fragmentation of energy markets and
tendency for energy prices to have risen more in coastal areas, where relative prices are more
likely to reflect world prices, suggest the potential for further efficiency gains as energy markets
become more integrated.
A few caveats are appropriate. First, this analysis includes only the industrial sector;
therefore, the effects of changes in final demand sectors such as consumer demand and imports
cannot be directly measured. In addition, our analysis only includes large and medium-size
enterprises and therefore omits small and rural enterprises. Although this omission allows us to
avoid certain data problems that have affected previous studies, it also does not allow us to
assess the complete situation in China. Yet, as shown, notwithstanding the limited scope of our
sample, the patterns of energy consumption exhibited by our sample are consistent with those
found in nationwide data.
34
REFERENCES Ang, B.W. and F.W. Zhang. 2000. “A Survey of Index Decomposition Analysis in Energy and Environmental Studies.” Energy, 25 (2000), 1149-1176. Byrd, W.A. 1989. “Plan and Market in the Chinese Economy: A Simple General Equilibrium Model.” Journal of Comparative Economics 13(2), pp. 177-204. Byrd, W.A. 1991. The Market Mechanism and Economic Reforms in China. M.E. Sharpe, Inc.: Armonk, NY. Garbaccio, R.F., M.S. Ho, and D.W. Jorgenson. 1999. “Why has the Energy-Output Ratio Fallen in China?” Energy Journal, 20 (3), 63-91. Jefferson, G.H. and T.G. Rawski. 1994. “Enterprise Reform in Chinese Industry.” Journal of Economic Perspectives, Vol. 8, no. 2 (Spring), pp. 47-70. Jefferson, G.H., T.G. Rawski, and Y. Zheng. 1996. “Chinese Industrial Productivity: Trends, Measurement Issues, and Recent Developments.” Journal of Comparative Economics, vol. 23, pp. 146-180. Jefferson, G.H., Bai Huamao, Guan Xiaojing, and Yu Xiaoyun. 2002, “R and D Performance in Chinese Industry,” manuscript, Brandeis University, GSIEF. Li, Wei. 1997. “The Impact of Economic Reform on the Performance of Chinese State Enterprises, 1980-1989.” Journal of Political Economy, vol. 105, no. 5, pp. 1080-1106. Lin, X. and K.R. Polenske. 1995. “Input-Output Anatomy of China’s Energy use Changes in the 1980’s.” Economic Systems Research, 7(1), 67-84. National Bureau of Statistics. 2000, 2001a. China Statistical Yearbook (2000, 2001 eds). Beijing: China Statistics Press. National Bureau of Statistics. 2001b. Department of Industrial and Transportation Statistics, annual LME economic and fiscal survey data and annual energy survey. National Bureau of Statistics. 2001c. Department of Population, Social, and Science and Technology Statistics, annual LME science and technology survey. Rawski, T.G. 2001. “What’s Happening to China’s GDP Statistics?” China Economic Review, 12(4), 347-354. Sinton, J.E. and D.G. Fridley. 2000. “What Goes Up: Recent Trends in China’s Energy Consumption.” Energy Policy, 28 (2000), 671-687.
35
Sinton, J.E. and M.D. Levine. 1994. “Changing Energy Intensity in Chinese Industry.” Energy Policy. 17 (March 1994), 239-255. World Bank. 1997. Clear Water, Blue Skies: China’s Environment in the new Century. World Bank, Washington, DC.