95
WELCOME TO ECONOMICS!
| Date post: | 28-Dec-2015 |
| Category: |
Documents |
| Upload: | violet-thompson |
| View: | 219 times |
| Download: | 0 times |
WELCOME TO ECONOMICS!

What is Economics?
The study of scarcity, or how society tries to satisfy unlimited wants through the use of limited resources.
The essential economic problem:
SCARCITY: There are UNLIMITED wants/needs but LIMITED resources

Need vs. Want
DISCUSS: What is the difference between a need and a want?
Need: something essential for survival Ex: air, shelter, food, clothes
Want: something a person desires to have Ex: Cadillac, Playstation3, New Bedroom
set

DISCUSS:
When you hear “ECONOMICS,” what comes to mind?
What we want to come to your mind…
CHOICES
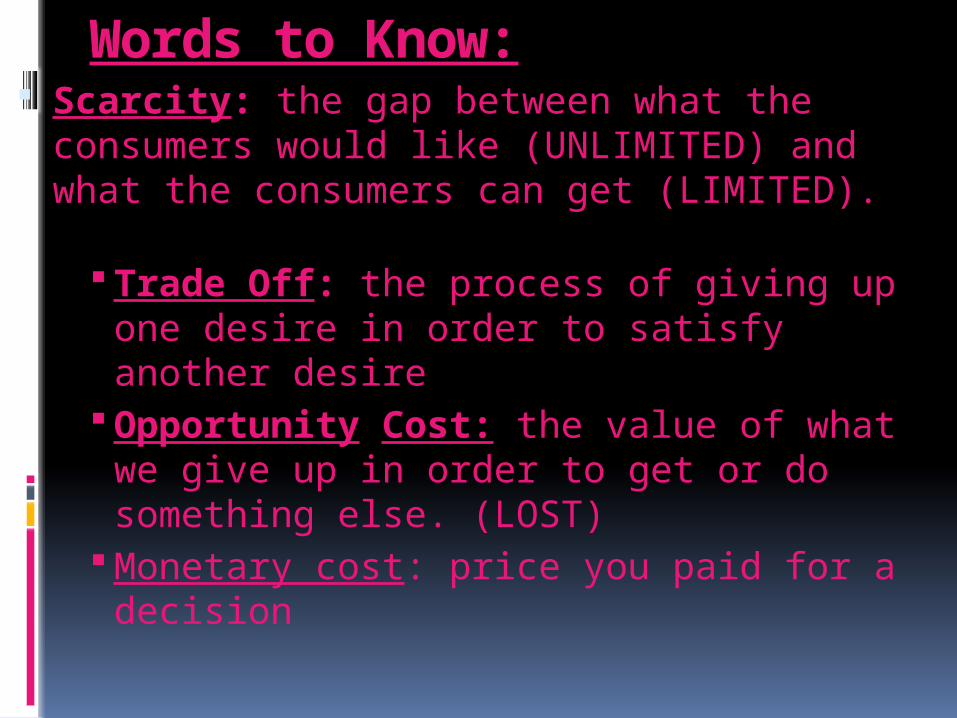
Words to Know: Scarcity: the gap between what the
consumers would like (UNLIMITED) and what the consumers can get (LIMITED).
Trade Off: the process of giving up one desire in order to satisfy another desire
Opportunity Cost: the value of what we give up in order to get or do something else. (LOST)
Monetary cost: price you paid for a decision

Trade Offs &Opportunity Costs
Three totally awesome men want to marry Ms. Nall. She really likes them ALL. Since she can only have one husband, she must choose:
She decides to marry Justin, leaving Kevin and Luke all alone.
What was the trade off? What is the opportunity
cost?

OPPORTUNITY COST IS WHAT
YOU LOST!

Need: something that is required Examples:
Want: something that is desired Examples:
Good: a tangible product Examples:
Service: a treatment (you cannot touch it!)
Examples:

Consumer: a buyer Examples:
Producer: The seller Examples:
Production: the process of making goods or services.
Examples:

3 Basic Economic Questions What to produce?
How to produce?
For whom to produce?

Scenario #1
Melissa is going to buy a new IPOD for $70, instead of a new pair of running shoes. She could also have bought her sister a birthday present or her boyfriend a new watch.
Tradeoffs – running shoes, birthday gift, watch
Opportunity Cost – running shoes Monetary Cost - $70

Scenario #2
The Adams family decides to go on a family vacation that costs $1,899 instead of buying a new car. They also could have put the money in Wendy’s college fund or bought a new TV.
Tradeoffs – new car, college fund, TV Opportunity Cost – new car Monetary Cost - $1,899

Scenario #3
Mr. S bought a new Wii for $500 instead of going for a weekend trip to the beach. He could have also used that money to buy a flat screen TV.
Tradeoffs – trip to the beach or TV Opportunity Cost – beach trip Monetary Cost - $500
Scenario #4
Matt decided to study Friday night for his exam on Monday rather than go out with his friends to the movies. He could have also gone to the basketball game or stayed home and play board games with his family.
Tradeoffs – movies, basketball game, board games
Opportunity Costs – movies Monetary Cost - none
(Write this to the side) Marginal Costs
The extra or additional cost of
producing one additional unit of an output
Ex: 30 bike helmets= $1500, 31 bike helmets= $1550 marginal cost= $50

(Side) Marginal Revenue
the extra revenue that results from selling one more unit of an output

(Side)
Cost-Benefit Analysis - an economic decision making technique that tells us to choose an action or make a decision
when the benefits are
greater than the costs

What is Economics?
Economics: the study of how people seek to satisfy their needs and wants by making choices

Classifications
Economists also have created categories for the resources necessary to produce goods and services. In economics, factors of production are the resources used to produce.
THE FACTORS OFPRODUCTION
What to produce?
There are 4 Factors of Production: Land or Natural Resources
Capital Goods
Labor
Entrepreneurship

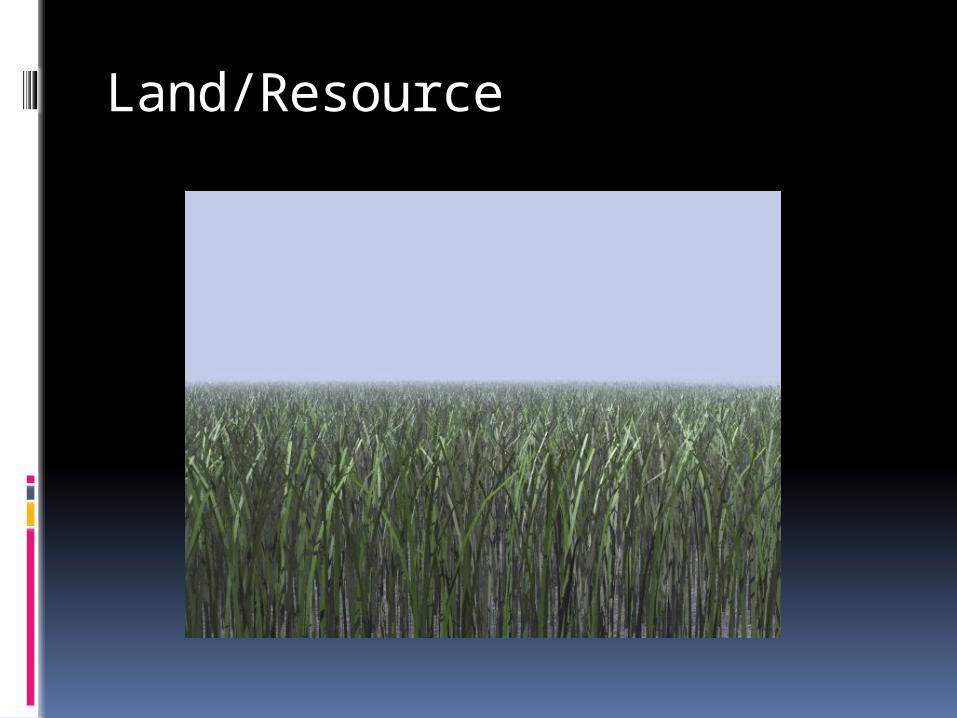
Land or Natural Resources
Materials that are NATURALLY MADE and transformed into something else
Examples: Oil Timber Land Crops Natural gas Milk

2 Types of Natural Resources RENEWABLE
Can be replaced or renewed or recycled
ex: wood, water, crops
NON-RENEWABLE Once used, resource is
gone Ex: Oil, Natural Gas,
Gold

LABOR PEOPLE who
work to produce a good or service
Example: Construction
worker Teacher Line cook

ALWAYS a PERSON!

Types of Labor #11
Blue Collar: typically performs “manual” labor (uniform)
White Collar: typically performs more “business” like labor
Professional: most advanced type of labor- highest educational degrees.
Skilled: typically knows a craft

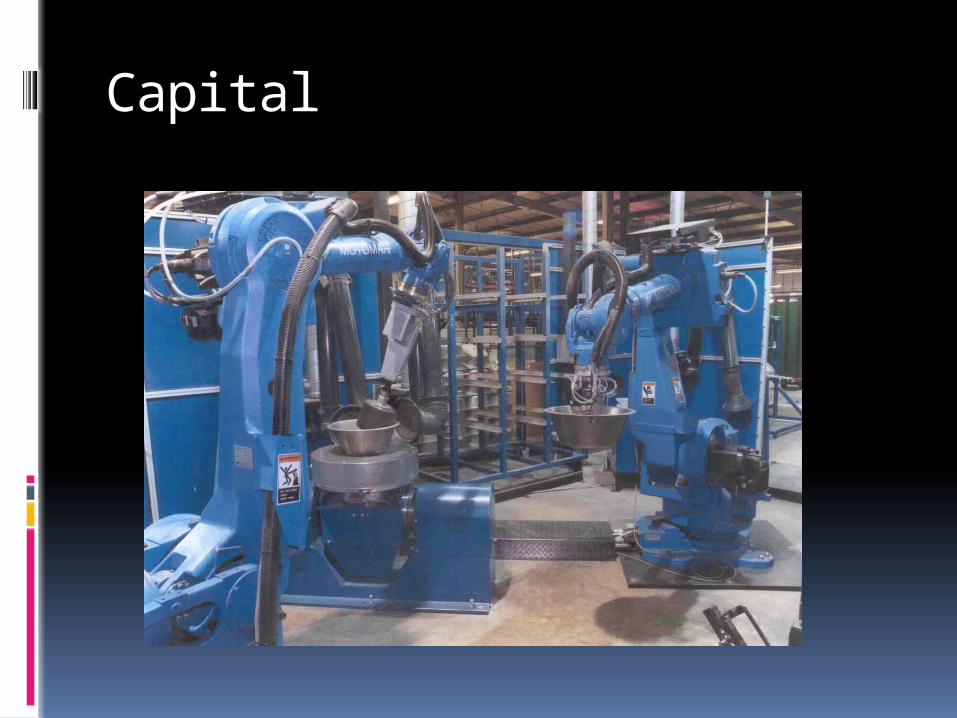
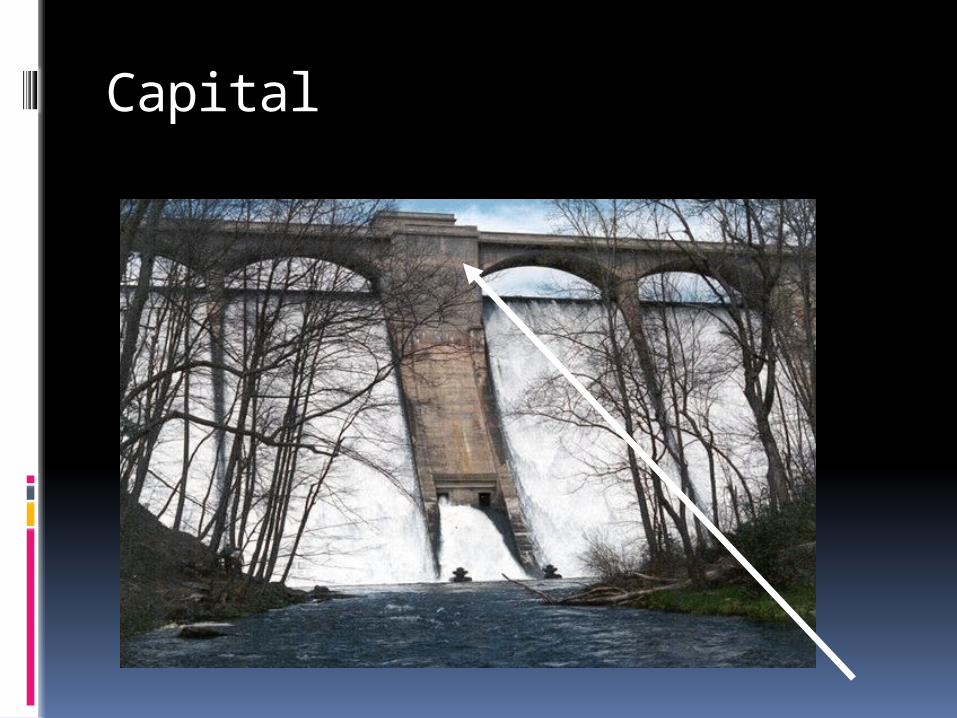
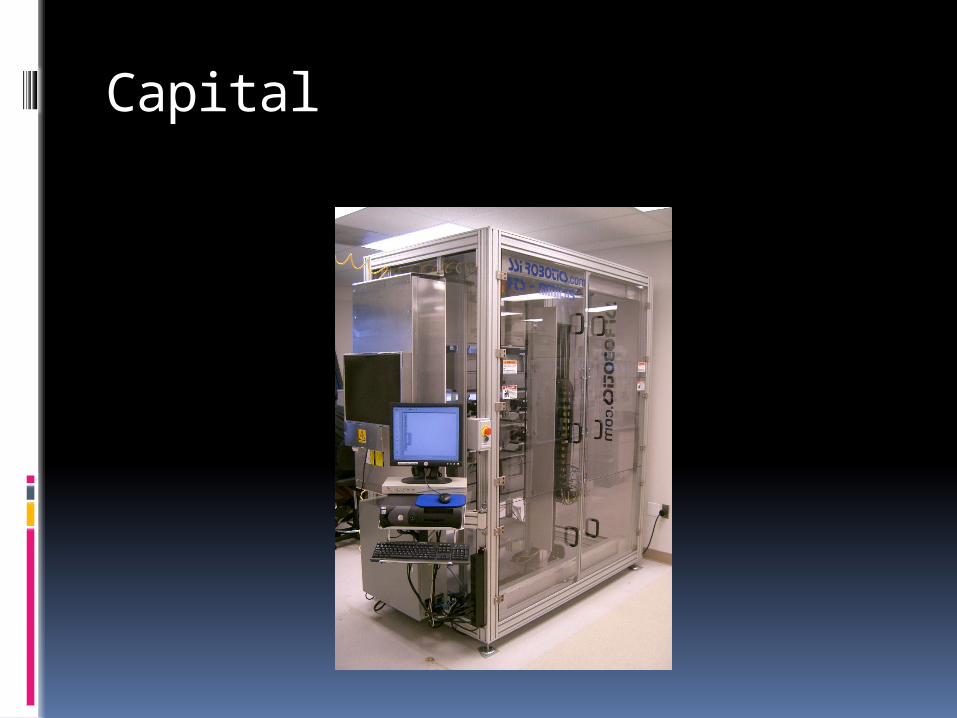
Capital PHYSICAL Man-made
instruments that assist in making something else
Examples: Hammer Robot Book Computer

ALWAYS a THING!

Capital HUMAN
Investment in knowledge or training for a laborer to become more productive
Examples: Training programs Skills development Advanced degrees
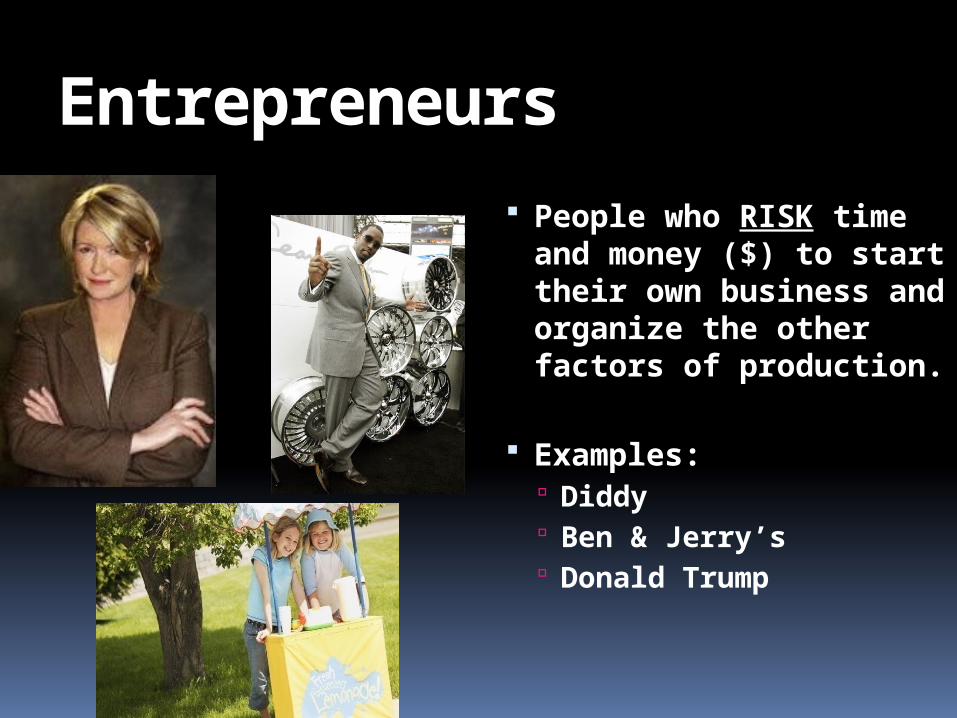
Entrepreneurs
People who RISK time and money ($) to start their own business and organize the other factors of production.
Examples: Diddy Ben & Jerry’s Donald Trump
Capital
Capital

Land/Resource
Capital

Labor

Entrepreneurship
Land/Resource

Labor

Land/Resource

Entrepreneurship

Review

Production and Productivity

Grasping Productivity Simulation
Assembly Line
Labor
Technology
Automation

Productivity - Vocabulary
How well resources are being used to produce a good or service.

Division of Labor
Breaking up the steps of production among many workers

Specialization
Workers are experts at only one task and do that task efficiently

Ways to increase productivity 1790
Total population = 4 million Farmer population = 3.6 million (90%)
1840 Total population = 17 million Farmer population = 9 million (53%)
1940 Total population = 132 million Farmer population = 30 million (23%)
1990 Total population = 246 million Farmer population = 4 million (1%)
SO…why haven’t we all died of starvation if there are less farmers today than before?
An assembly line
Increases productivity by having workers stand still and have output come to them to work on.

Technology
Increases productivity by improving the tools used to produce goods (robots, computers)

Human Capital
Increases productivity by making the worker smarter.

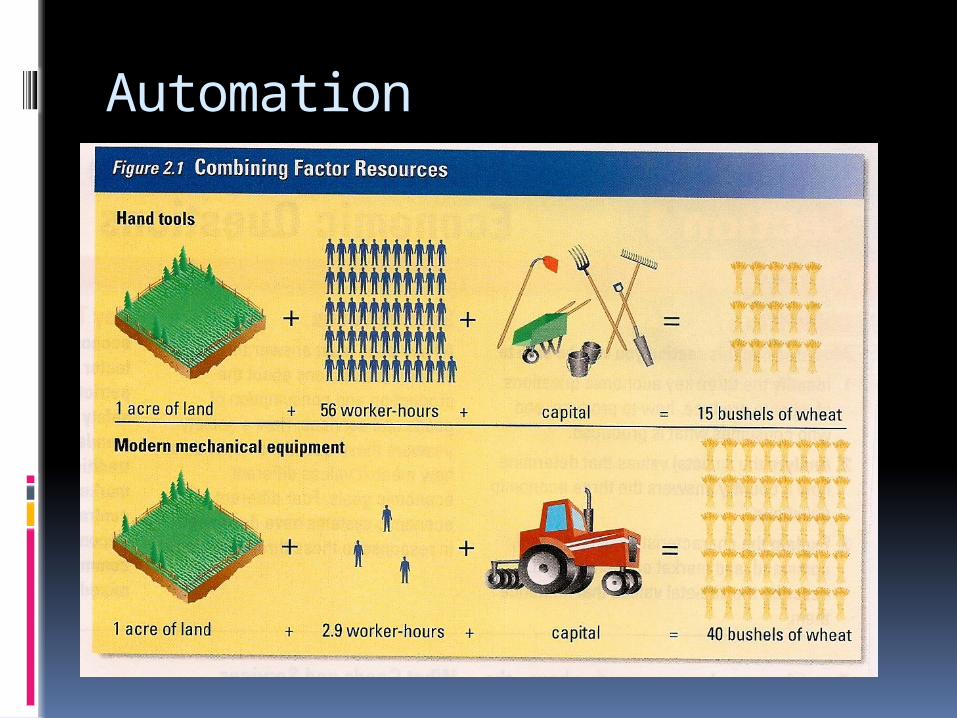
Automation
Increases productivity by using machines instead of humans (machines don’t get tired or take breaks)
Automation

Comparative Advantage
When a country produces a good that is easy to make instead of a good that is hard to make.
Ex: Saudi Arabia produces Oil U.S. produces Wheat

How does it affect global markets?
Comparative advantage leads to interdependence between countries.
Ex: U.S. sends extra wheat to Saudi Arabia for oil.

DISCUSS:
When you go into Subway, is it faster if there is 1 worker behind the counter or 2?
What do the 2 workers do that makes it faster?

Law of Diminishing Returns Productivity will increase to a point,
then begin to decrease as you add one factor of production.
Most productive
at this point

Cracker Challenge

Law of Diminishing Returns By adding more factors of production (i.e. technology, better trained workers, better entrepreneurship) it leads to greater efficiency.
But ONLY to a certain point and then you begin
to lose efficiency.
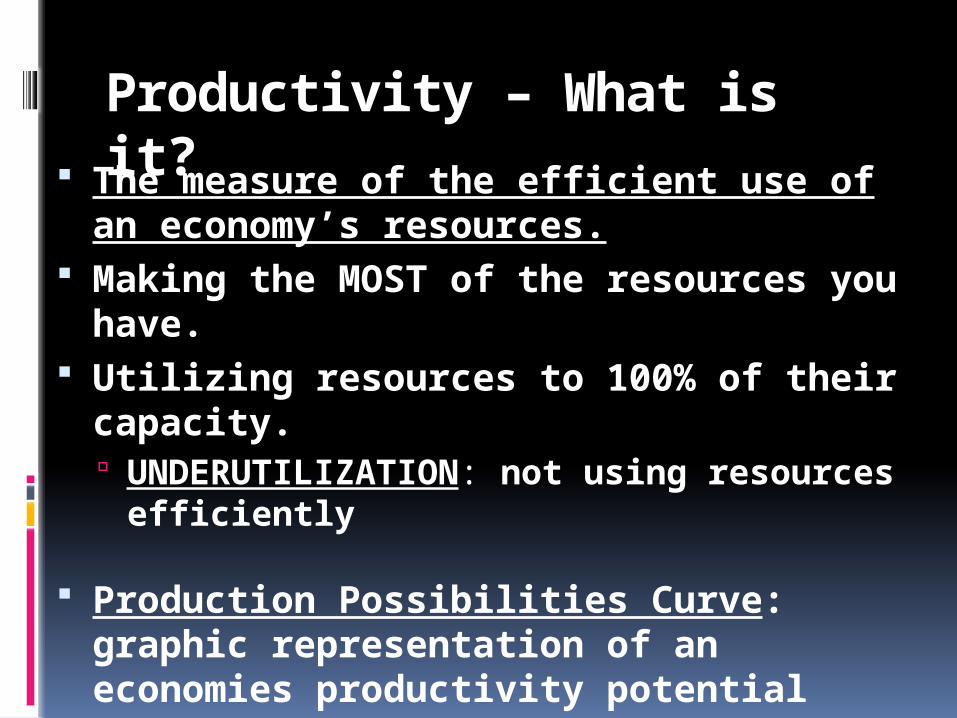
Productivity – What is it? The measure of the efficient use of an economy’s resources.
Making the MOST of the resources you have.
Utilizing resources to 100% of their capacity. UNDERUTILIZATION: not using
resources efficiently
Production Possibilities Curve: graphic representation of an economies productivity potential

0
1
2
3
4
5
6
7
8
0 1 2 3 4 5 6 7 8
Units of clothing (millions)
Un
its
of f
ood
(m
illi
ons)
Units of food Units of clothing (millions) (millions)
8m 0.0 7m 2.2m 6m 4.0m 5m 5.0m 4m 5.6m 3m 6.0m 2m 6.4m 1m 6.7m 0 7.0m
A Production Possibilities CurveA Production Possibilities Curve

LAWS OF DEMANDUNIT 7b
Discuss
What is a market? In a market who is the consumer? How does the price of a good affect
the consumer?

Market
An arrangement that allows buyers and sellers to exchange things
Markets exist because no one is self sufficient and no one produces all we require to satisfy all our needs and wants.

Discuss
Can a market exist on the internet? Can a market exist on the phone?
A market exists anywhere and anytime people make exchanges with one another.

Demand
Description The quantities of a particular good or
service consumers are willing and able to buy at different possible prices at a particular time
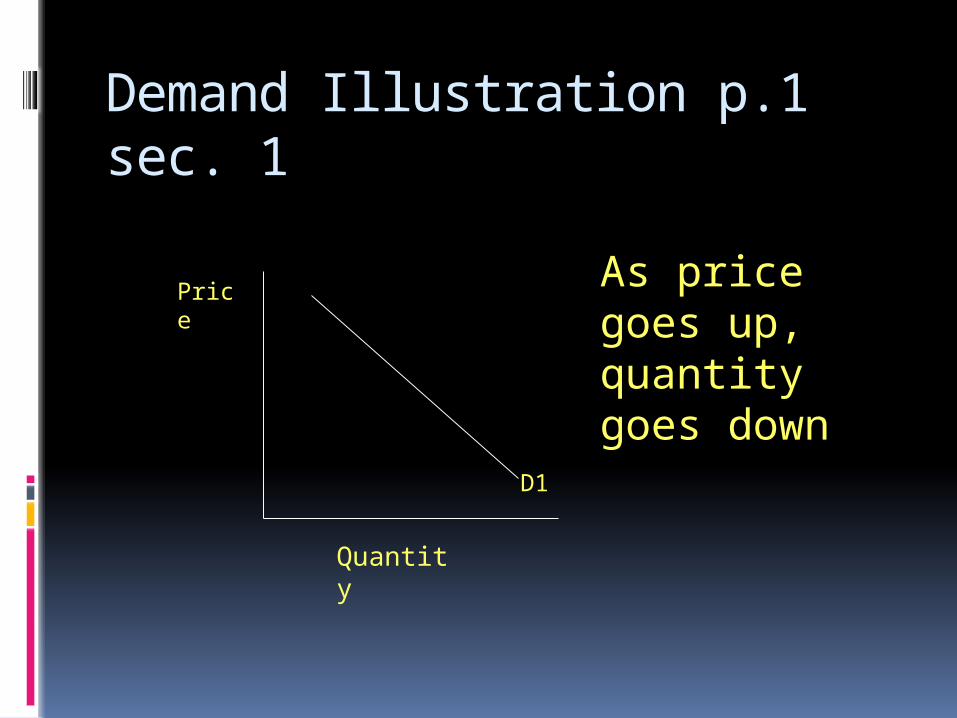
Demand Illustration p.1 sec. 1
Price
Quantity
As price goes up, quantity goes down
D1

Discuss
How does demand and “want” or “need” differ?
You may want or desire a new car or a closet full of clothes, but you demand these things only when you are willing and able to buy them.
Quantity Demand
The quantities of a particular good or service consumers are willing and able to buy at set prices at a particular time

Quantity Demand Illustration
D2
Price
Quantity

Demand Schedule
How much people are going to buy at the various prices.
Ex. The price of pizza
Price Quantity
$.50
$1.00
$1.50
$2.00
$2.50
Law of Demand
As price goes up quantity goes down As price goes down quantity goes up
People buy less of something at higher prices then they do at lower prices.

Discuss
Are there certain items you have to buy even if the price increases?
Medicine, Electricity, Gas

Elasticity of Demand
While all demand curves slope downward and to the right, their shape and steepness can be quite different.
ELASTICITY of DEMAND: How much the quantity demanded will change if the price rises or falls.
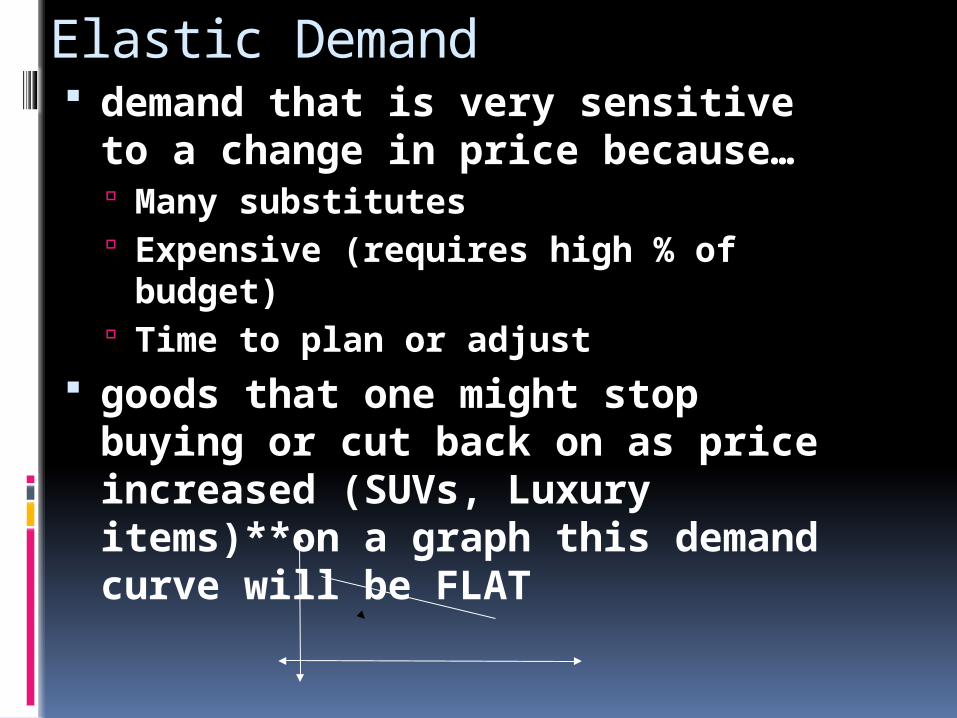
Elastic Demand demand that is very sensitive to
a change in price because… Many substitutes Expensive (requires high % of
budget) Time to plan or adjust
goods that one might stop buying or cut back on as price increased (SUVs, Luxury items)**on a graph this demand curve will be FLAT
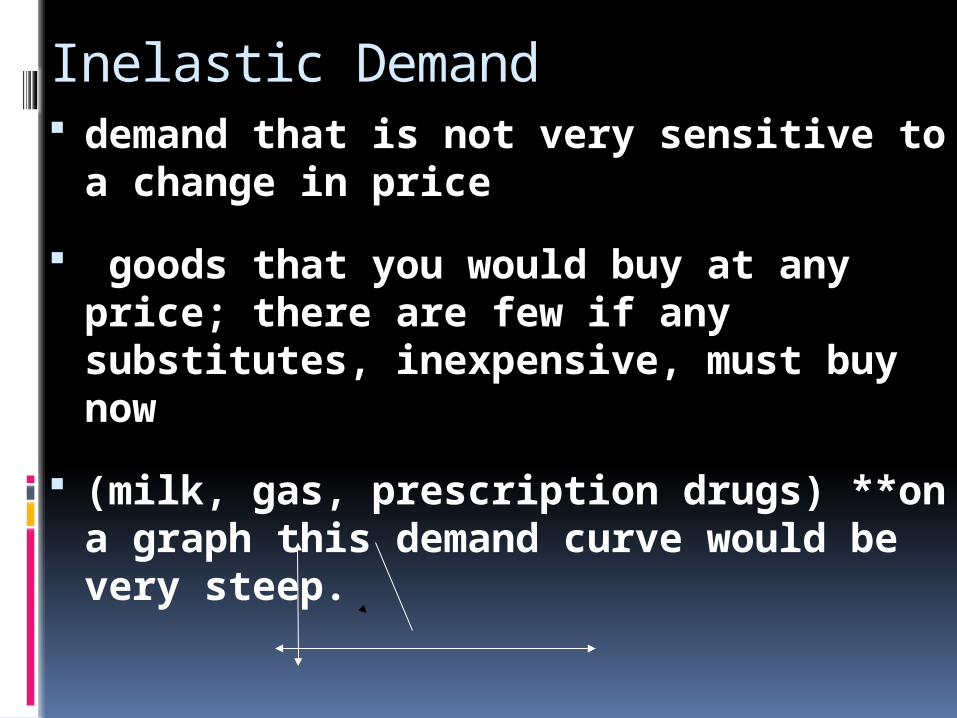
Inelastic Demand demand that is not very sensitive to a
change in price
goods that you would buy at any price; there are few if any substitutes, inexpensive, must buy now
(milk, gas, prescription drugs) **on a graph this demand curve would be very steep.

Price Elasticity of Demand for Milk and Cola Drinks
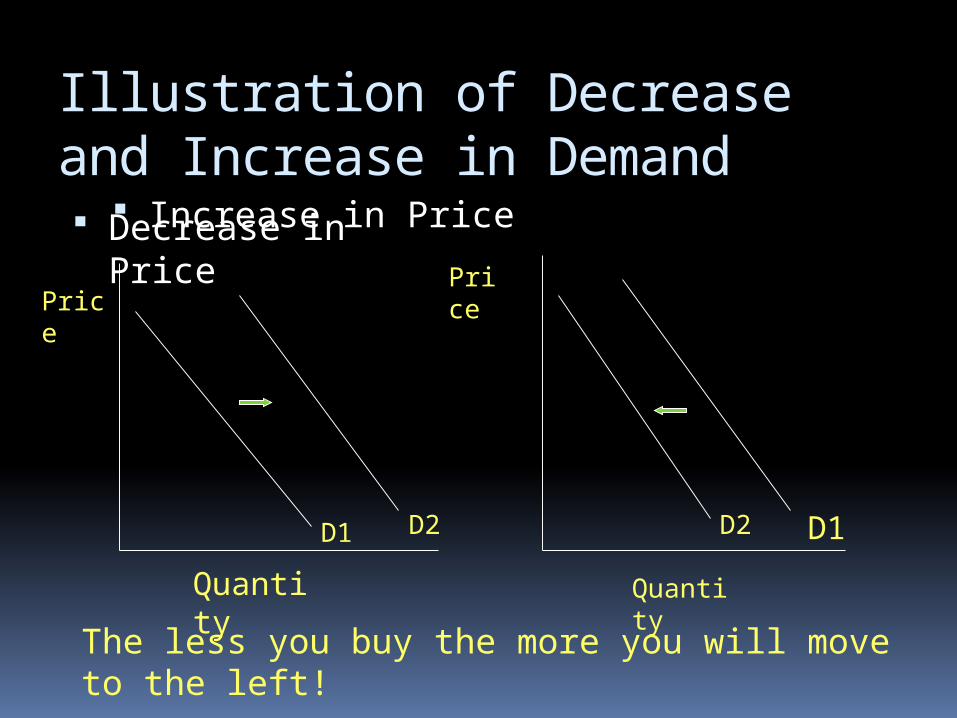
Illustration of Decrease and Increase in Demand Decrease in Price Increase in Price
Price
Quantity
D1 D2
Quantity
Price
D1D2
The less you buy the more you will move to the left!

The Demand Curve
The Demand Curve slopes downward to the right because the consumer is willing and able to buy more gasoline at lower prices than at higher prices.

COMPLEMENTARY VS. SUBSTITUTE
Can YOU tell the difference????

What is the difference?
Complementary Good: Two goods that are usually consumed together (Hot Dogs & buns)
Substitute Good: An acceptable replacement for a good (Playstation & Xbox)


CHANGES IN DEMAND
Reasons Demand can change
People’s Income Weather Complementary Goods Substitute Goods

People’s Income Increases
Effect on Demand Demand Increases
(shift right)
P
Q
D1 D2

Bad Weather (for product)
Effect on Demand Demand Decreases
(shift left)
P
Q
D1D2

Price of Complementary Good Decreases (ex: peanut butter & jelly)
Effect on Demand Demand Increases
(shift right)
P
Q
D1D2

Price of Substitute Good Decreases (ex: Pepsi & Coca-Cola)
Effect on Demand Demand
Decreases (shift left)
P
Q
D1D2