61
What is going on in modern volleyball

What is going on in modern volleyball

Picture of the Game - 2017
FIVB scientific research project 2
Table of contents
Page
Aims 3 Introduction 4 Key findings 5 Part 1 Men’s volleyball of top level. Main indicators 6 Part 2 Women’s volleyball of top level. Main indicators 29 Part 3 Men’s and Women’s top volleyball comparison 51 Part 4 Match and set duration
57

Picture of the Game - 2017
FIVB scientific research project 3
AIMS The aims of this project are as follows:
1. To collect and investigate data on present-day critical indicators of the game. 2. To compare the current data with previous years data in order to obtain a clear picture of the game
trends and evolution 3. On the basis of data analysis to make conclusions and proposals for further game development
Picture of the Game - 2017
FIVB scientific research project 4
Introduction
This year, as well as for the previous 12 years since 2006, and in line with the permanent monitoring of Volleyball development trends and evolution, the scientific research of the main Game indicators for the top level men’s and women’s teams (Rules of the Game and Refereeing Commission project (now Refereeing and Rules of the Game Commission) - “Picture of the Game”) is foreseen as one of the most important tasks. It is also of significant relevance to our abilities to create a product which can be marketed world-wide.
The results of this scientific statistical research are regularly reported to the FIVB President and always generate a positive response to its value. This was again confirmed during the meeting of the new combined commission in January, 2017. The FIVB President strongly supported the idea that any changes in Volleyball must be based on sustainable scientific research.
Taking into consideration the latest FIVB innovations: modern technology (Hawk-eye challenge, tablets, headsets, etc.), measures for shortening intervals between rallies and the adaptation of match duration to the demands of TV, the results of the research reflect not only the dynamic of volleyball trends, but also their degree of influence on volleyball development.
In terms of structure, the report is divided into 5 parts or “chapters”. The reason for this is that in reality we have more than one version of the sport of volleyball; while sharing the same rules, the men’s and women’s games show distinct characteristics of their own. In chapters one and two, the various aspects of the game are treated separately, while in chapter three the men’s and women’s games are compared and contrasted in the key areas which define our sport. Part 4 deals specifically with match duration. Part 5 is dedicated to the timing results of a new best of 7 sets format. Additionally, in the appendices there are two special concepts:
(1) Special reception zone (SRZ) concept - this an idea for discussion regarding how to make a more appropriate attack-defence balance, while at the same time decreasing the number of pseudo-rallies. An added bonus of this concept is the new attractive look given to the volleyball playing area.
(2) A “handicap” system, where the team winning the set starts the next set with a disadvantage or “handicap”.
Finally, there is a summary of findings and recommendations, based on the previous analysis. Unlike previous PoG report additions, the key findings have been placed at the beginning of the report, immediately after the Introduction.
Sergey Titov, Sandy Steel, Picture of the Game project leader Picture of the Game project chief analyst
Picture of the Game - 2017
FIVB scientific research project 5
Key findings:
1. Rally duration – fairly static within statistical norms. i.e. no improvement. The suggestions for rule modification – WEAKENING reception, STRENGTHENING service, liberalisation of overhand pass (double only) should be taken into account to improve rally length.
2. Flying ball time has shown a slight increase but since athletes are not at their peak for the entire length of a season, that this factor makes it difficult to put too much emphasis on this increase; much depends on the teams playing and their squad strength at that moment.
3. Percentage of pseudo rallies – includes service errors. This aspect remains the same for the same reasons; teams must use jump serves in order to win a rally, and because this is a high risk strategy, a large proportion are mistakes (or aces).
4. The % of one-attack rallies in the study has gone down over the past few years – this may be due to tactics, physical preparation of the players or other factors. On the face of it, this is a good thing.
5. One and fewer attack rallies are still in the region of 75% - practically it still means that out from 4 rallies, only one rally consists of more than one attack (long rally).
6. Ball contacts per rally – increasing year on year – which suggests that the game is getting ever-faster. 7. Structure of Rallies – we would like to see an upward trend in the more than one attack rallies
indicator, and should work towards this. 8. Attack-Defence balance – in reality, there has been no change: We still see two out of every three
rallies being won by the receiving team, regardless of the teams playing. 9. Proportion of rallies won on own service: Despite our efforts, the receiving team still wins the rally
most of the time (i.e. too often). 10. Percentage aces has gone down - small drop in aces seems to be a good thing – the ball stays in play
longer. 11. Number of net Crossings – compared to London 2012, this number is low. It should be realised that
the more net crossings the better the rally, the better the excitement levels, often more spectacular “saves” for TV to replay. It is still likely that too many net faults are being called, thus interrupting the flow of play.
Picture of the Game - 2017
FIVB scientific research project 6
Part 1.
Men’s volleyball of top level. Main indicators
On the basis of 2017 FIVB World League final tournament (Curitiba, Brazil, 04-08.07.2017) the following statistical data reflecting the main volleyball indicators and has been obtained:
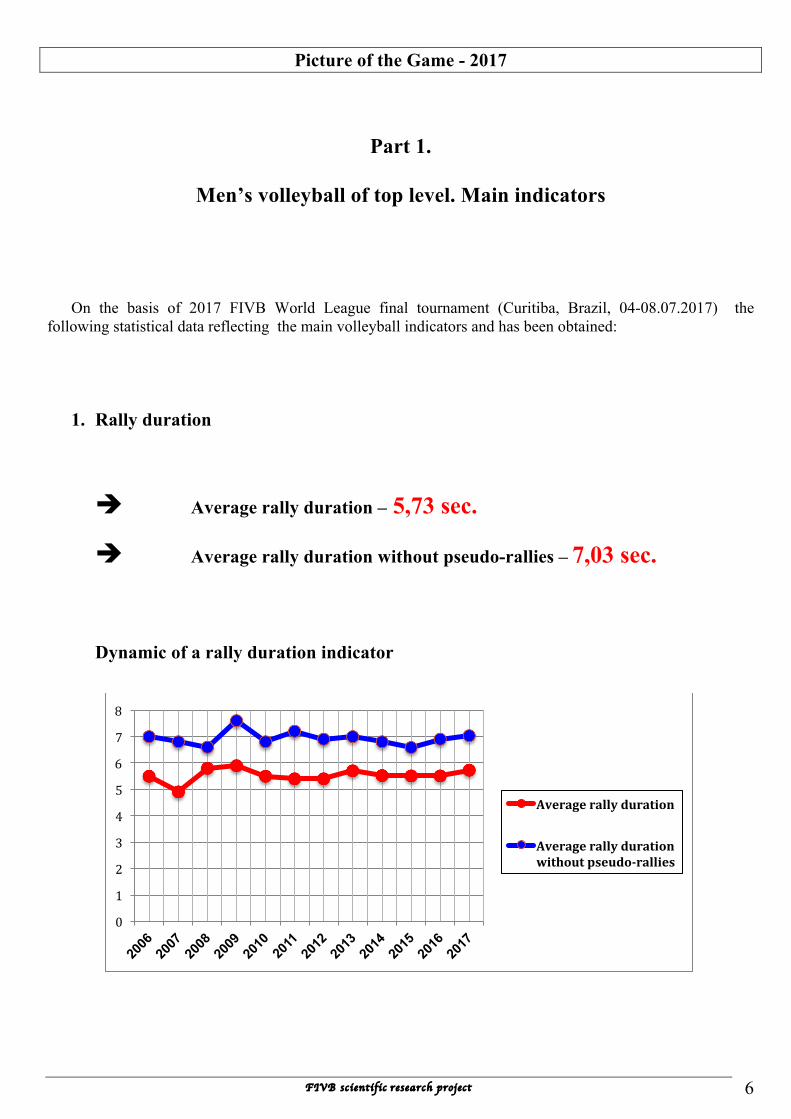
1. Rally duration
è Average rally duration – 5,73 sec. è Average rally duration without pseudo-rallies – 7,03 sec.
Dynamic of a rally duration indicator
0
1
2
3
4
5
6
7
8
Averagerallyduration
Averagerallydurationwithoutpseudo-rallies
Picture of the Game - 2017
FIVB scientific research project 7
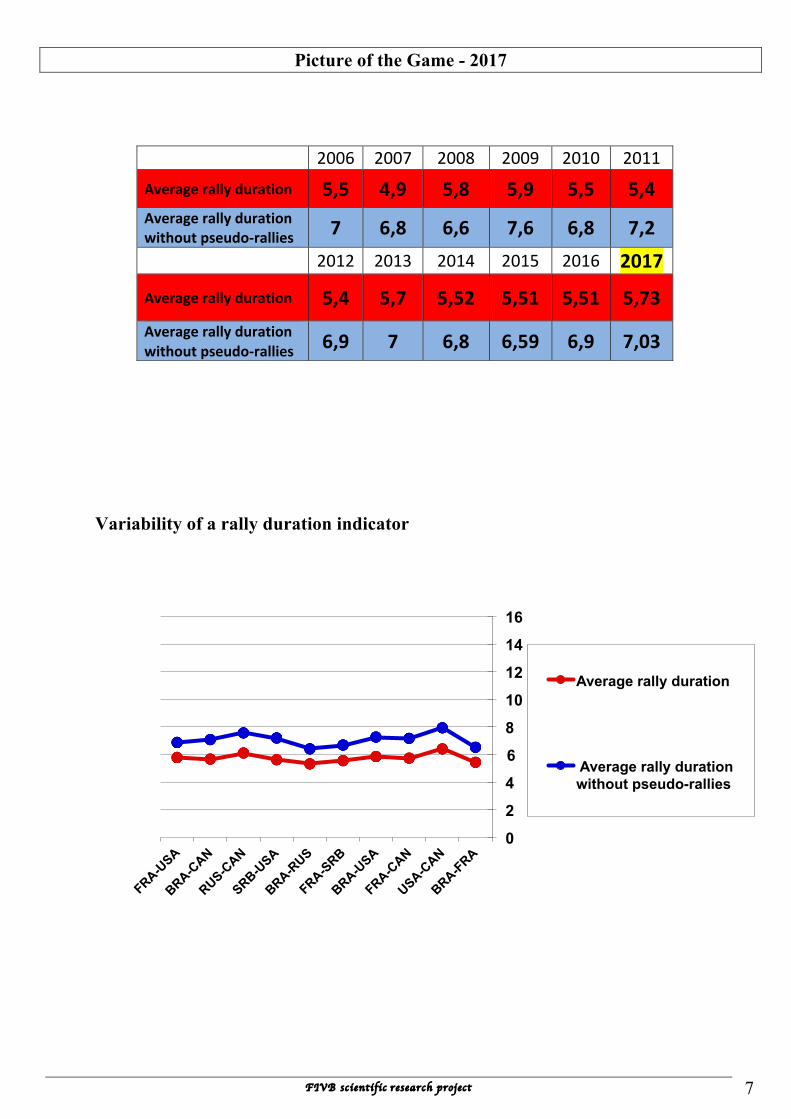
Variability of a rally duration indicator
0
2
4
6
8
10
12
14
16
Average rally duration
Average rally duration without pseudo-rallies
2006 2007 2008 2009 2010 2011
Averagerallyduration 5,5 4,9 5,8 5,9 5,5 5,4Averagerallydurationwithoutpseudo-rallies 7 6,8 6,6 7,6 6,8 7,2 2012 2013 2014 2015 2016 2017
Averagerallyduration 5,4 5,7 5,52 5,51 5,51 5,73Averagerallydurationwithoutpseudo-rallies 6,9 7 6,8 6,59 6,9 7,03

Picture of the Game - 2017
FIVB scientific research project 8
16%
84%
Rallies time
All sets duration
Comment: Still key – but the comments from last year are still valid ( see below) – if we wish to increase rally length, we need to STRENGTHEN service, WEAKEN reception. Taking a more liberal view of overhand pass is probably not going to have a huge impact on rally duration at the top level, since ball handling is generally very good at this level – but could have a positive impact at lower levels. That said, the removal of one more judgement call from the referee is probably a good thing, given our desire to let the players decide the rally through their play. 2016 Comment: Rally duration is one of the key Game indicators. This has been very stable during the last 10 years, and especially over the last 3 years, despite of all our efforts to increase it. The variability between different matches is small and therefore not significant. In order to change it towards greater rally prolongation, it may be necessary to make changes involving further ball handling liberalization (perhaps some liberalization of the second team hit, for example, or a more strict view of the 1st hit reception may be required). If the pseudo-rallies factor (i.e. rallies involving only service) can be completely eliminated, it is believed that average rally duration will extend by more than one second.
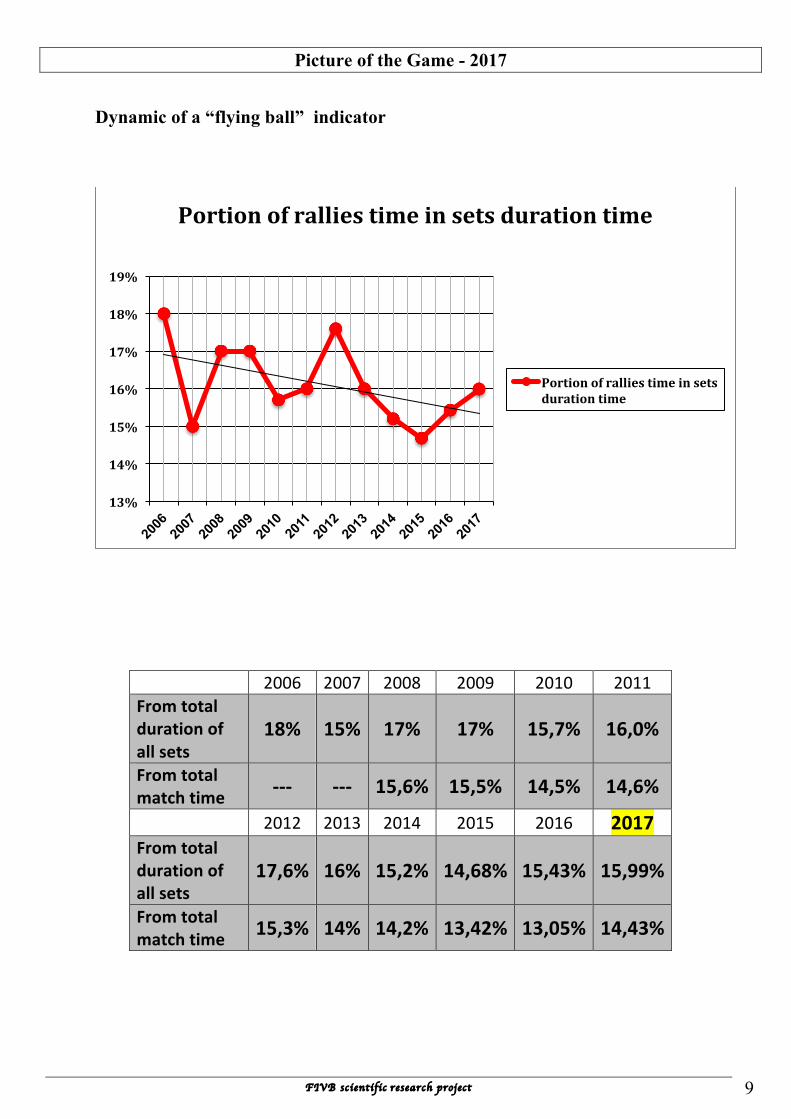
2. “Flying ball” “Flying ball” – 15,99% from total duration of all sets, OR 14,43% from
total match time
FRA-USA BRA-CAN RUS-CAN SRB-USA BRA-RUSAveragerallyduration 5,78 5,66 6,12 5,63 5,32Averagerallydurationwithoutpseudo-rallies 6,87 7,07 7,56 7,2 6,42
FRA-SRB BRA-USA FRA-CAN USA-CAN BRA-FRAAveragerallyduration 5,56 5,85 5,74 6,4 5,43Averagerallydurationwithoutpseudo-rallies 6,68 7,26 7,17 7,93 6,53
Picture of the Game - 2017
FIVB scientific research project 9
Dynamic of a “flying ball” indicator
2006 2007 2008 2009 2010 2011Fromtotaldurationofallsets
18% 15% 17% 17% 15,7% 16,0%
Fromtotalmatchtime --- --- 15,6% 15,5% 14,5% 14,6%
2012 2013 2014 2015 2016 2017Fromtotaldurationofallsets
17,6% 16% 15,2% 14,68% 15,43% 15,99%
Fromtotalmatchtime 15,3% 14% 14,2% 13,42% 13,05% 14,43%
13%
14%
15%
16%
17%
18%
19%
Portionofralliestimeinsetsdurationtime
Portionofralliestimeinsetsdurationtime
Picture of the Game - 2017
FIVB scientific research project 10
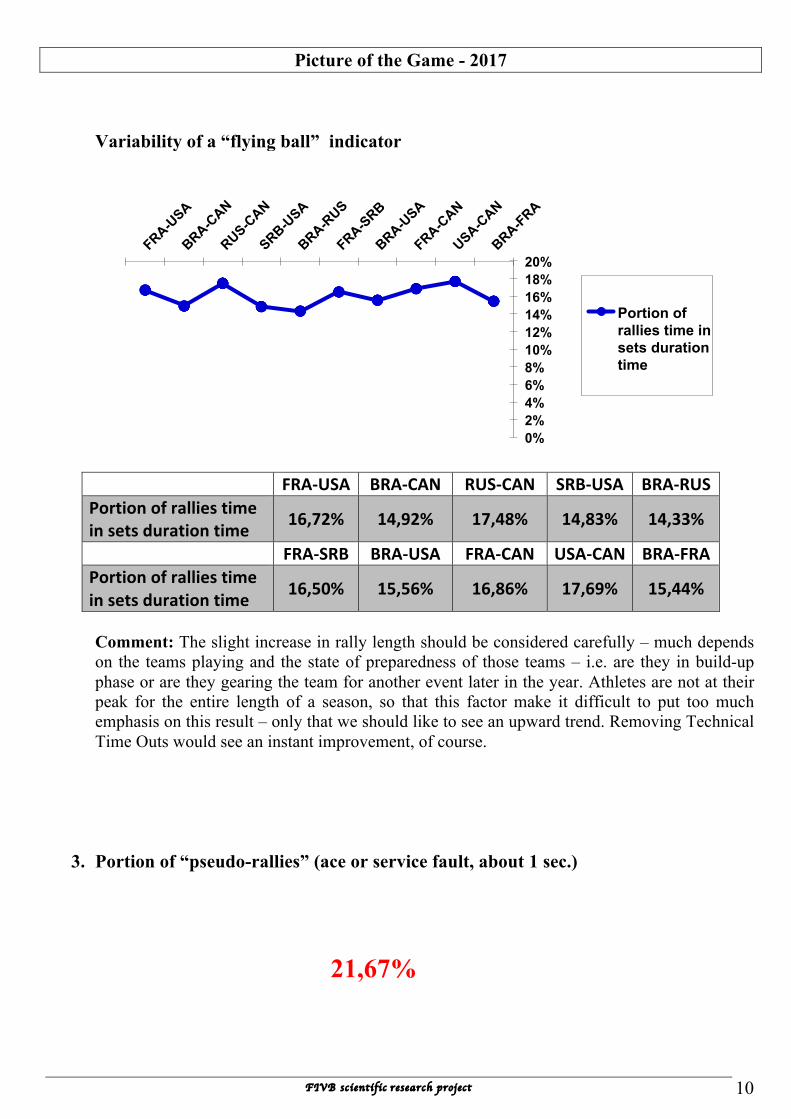
Variability of a “flying ball” indicator
FRA-USA BRA-CAN RUS-CAN SRB-USA BRA-RUSPortionofralliestimeinsetsdurationtime 16,72% 14,92% 17,48% 14,83% 14,33%
FRA-SRB BRA-USA FRA-CAN USA-CAN BRA-FRAPortionofralliestimeinsetsdurationtime 16,50% 15,56% 16,86% 17,69% 15,44%
Comment: The slight increase in rally length should be considered carefully – much depends on the teams playing and the state of preparedness of those teams – i.e. are they in build-up phase or are they gearing the team for another event later in the year. Athletes are not at their peak for the entire length of a season, so that this factor make it difficult to put too much emphasis on this result – only that we should like to see an upward trend. Removing Technical Time Outs would see an instant improvement, of course.
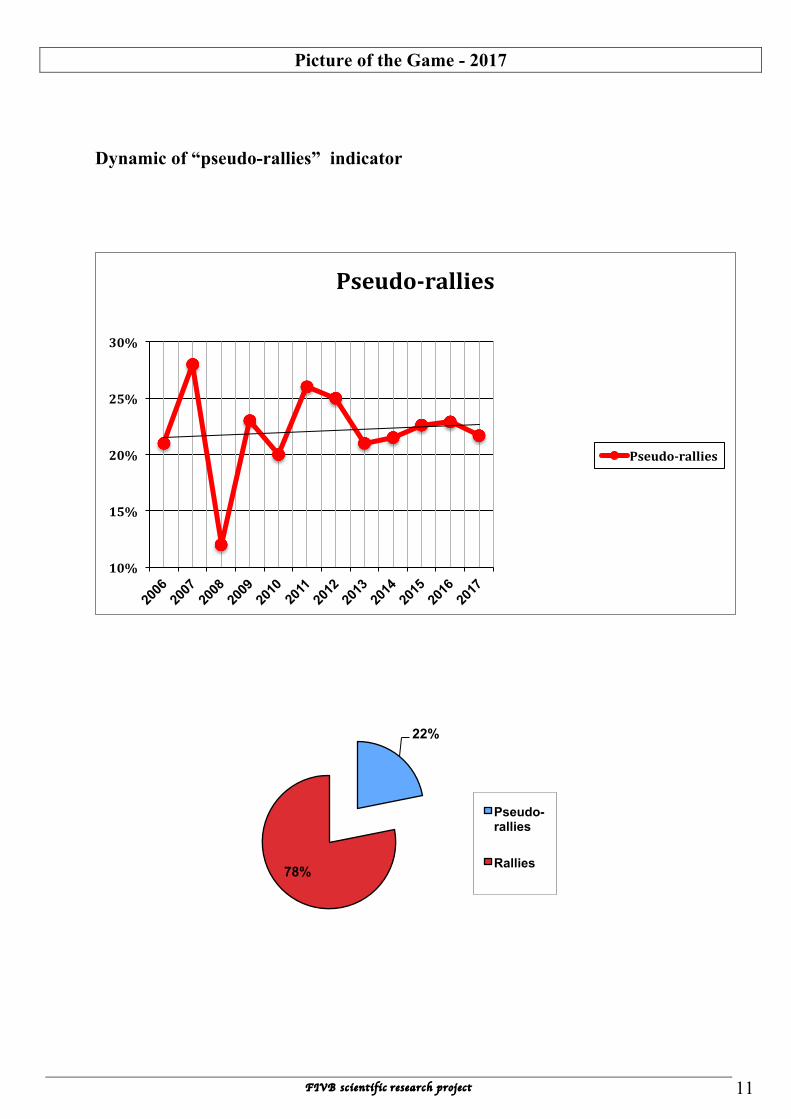
3. Portion of “pseudo-rallies” (ace or service fault, about 1 sec.)
21,67%
0% 2% 4% 6% 8% 10% 12% 14% 16% 18% 20%
Portion of rallies time in sets duration time
Picture of the Game - 2017
FIVB scientific research project 11
22%
78%
Pseudo-rallies
Rallies
Dynamic of “pseudo-rallies” indicator
10%
15%
20%
25%
30%
Pseudo-rallies
Pseudo-rallies

Picture of the Game - 2017
FIVB scientific research project 12
Variability of “pseudo-rallies” indicator
FRA-USA BRA-CAN RUS-CAN SRB-USA BRA-RUSPortionofpseudo-rallies 19,44% 23,29% 21,92% 25,27% 20,29%
FRA-SRB BRA-USA FRA-CAN USA-CAN BRA-FRAPortionofpseudo-rallies 19,80% 22,53% 23,20% 22,10% 19,90%
Comment: same issue as last year – this aspect remains the same for the same reasons; teams must use jump serves in order to win a rally – if they do not, the reception of the opponent simply absorbs the service and a decisive attack is created. Because the jump serve is risky, the % error is quite high.
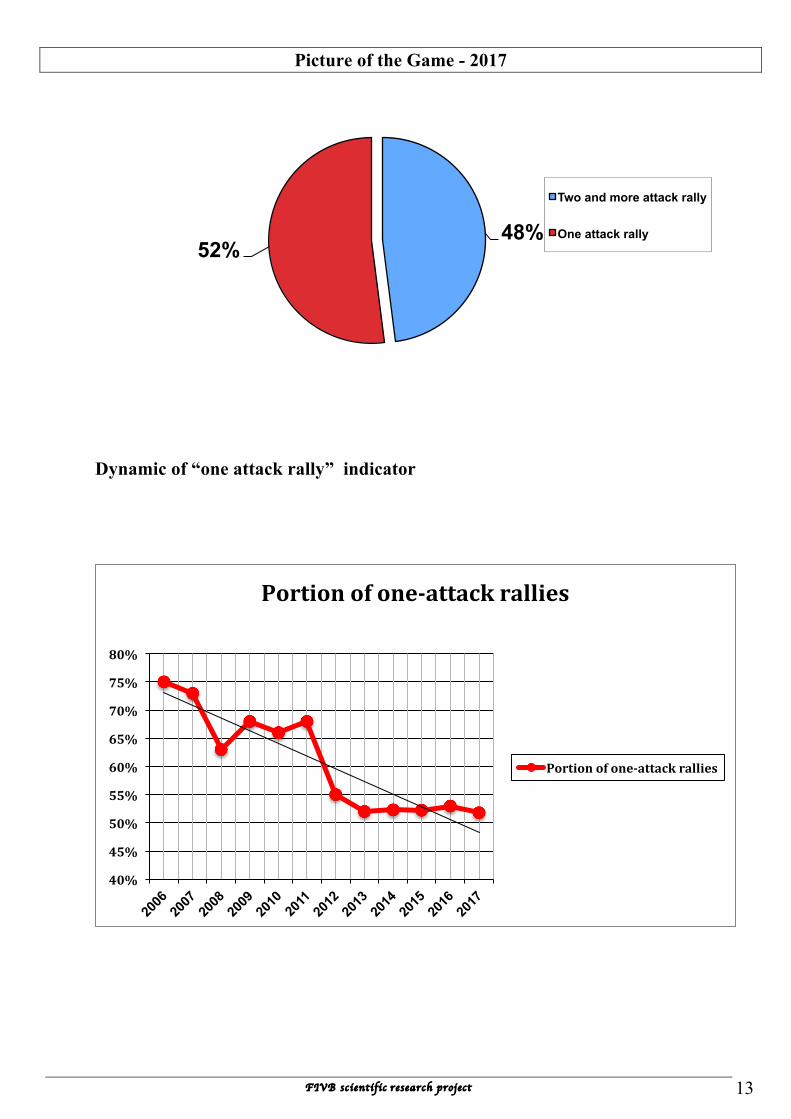
4. One attack rally out of all rallies (without pseudo-rallies)
2017 value: 51,78%
0%
5%
10%
15%
20%
25%
30%
Portion of pseudo-rallies
Picture of the Game - 2017
FIVB scientific research project 13
48% 52%
Two and more attack rally
One attack rally
Dynamic of “one attack rally” indicator
40%
45%
50%
55%
60%
65%
70%
75%
80%
Portionofone-attackrallies
Portionofone-attackrallies
Picture of the Game - 2017
FIVB scientific research project 14
2006 2007 2008 2009 2010 2011
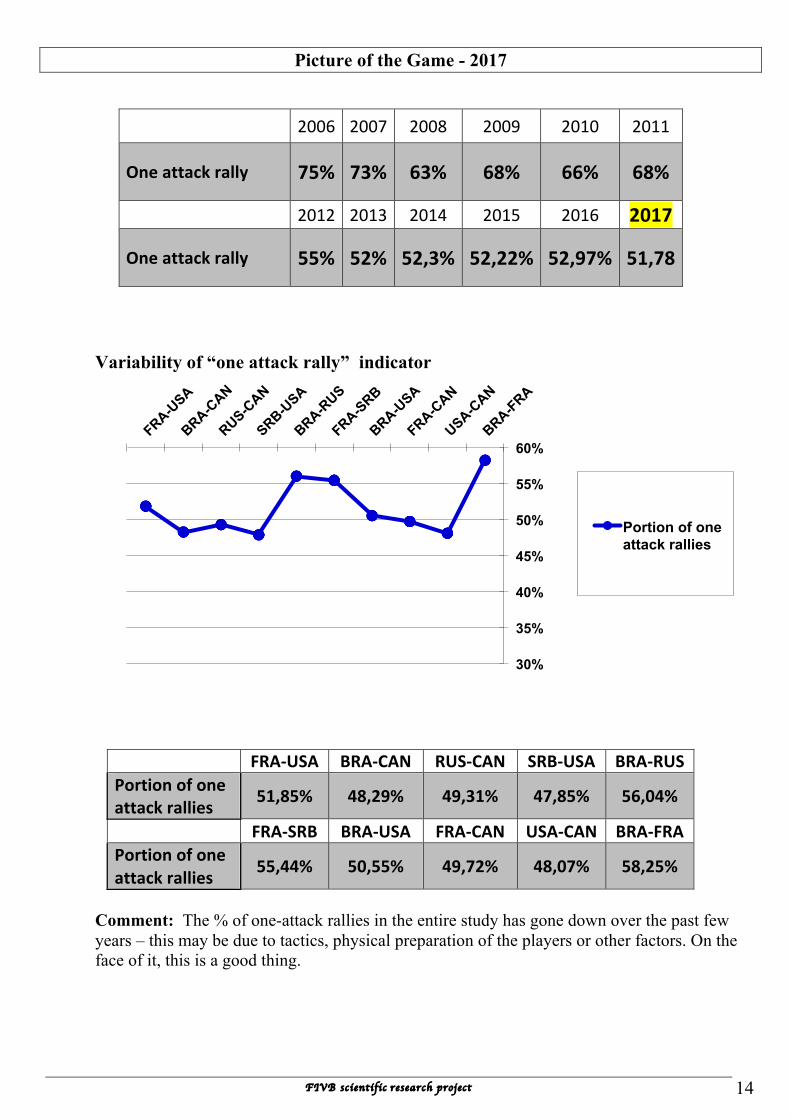
Oneattackrally 75% 73% 63% 68% 66% 68%
2012 2013 2014 2015 2016 2017
Oneattackrally 55% 52% 52,3% 52,22% 52,97% 51,78
Variability of “one attack rally” indicator
FRA-USA BRA-CAN RUS-CAN SRB-USA BRA-RUSPortionofoneattackrallies 51,85% 48,29% 49,31% 47,85% 56,04%
FRA-SRB BRA-USA FRA-CAN USA-CAN BRA-FRAPortionofoneattackrallies 55,44% 50,55% 49,72% 48,07% 58,25%
Comment: The % of one-attack rallies in the entire study has gone down over the past few years – this may be due to tactics, physical preparation of the players or other factors. On the face of it, this is a good thing.
30%
35%
40%
45%
50%
55%
60%
Portion of one attack rallies
Picture of the Game - 2017
FIVB scientific research project 15
27%
73%
Two and more attack rally
One and less attack rally
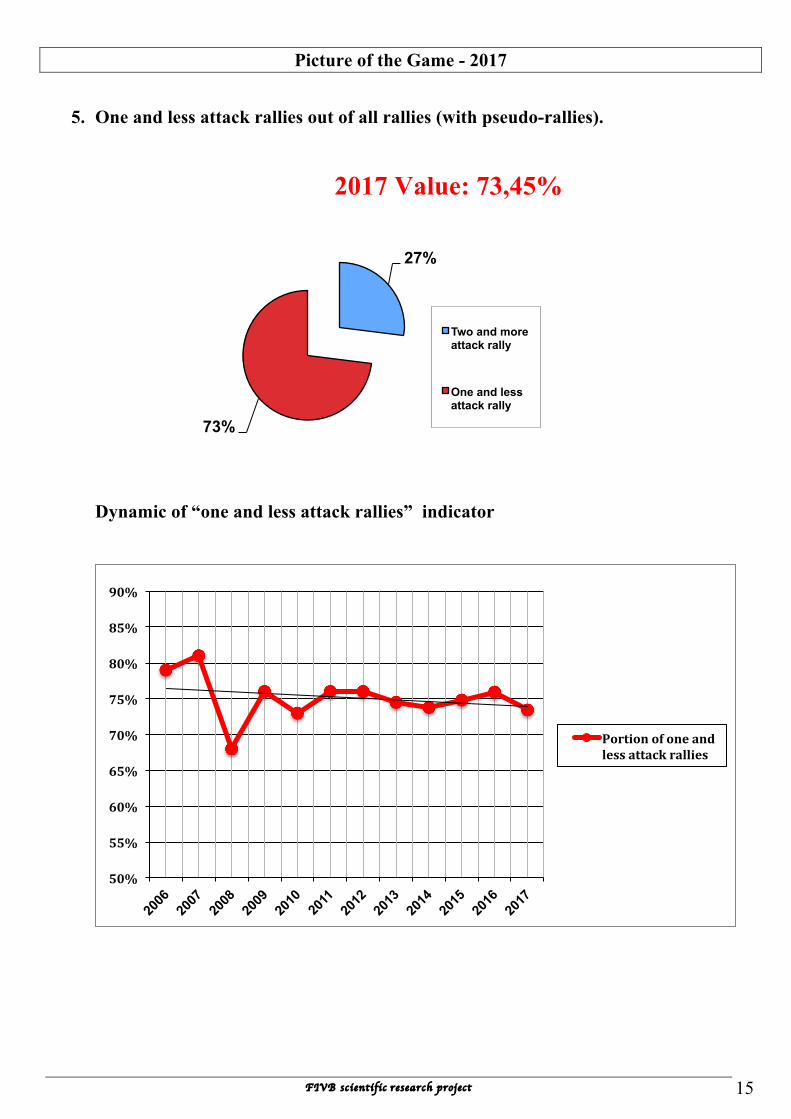
5. One and less attack rallies out of all rallies (with pseudo-rallies).
2017 Value: 73,45% Dynamic of “one and less attack rallies” indicator
50%
55%
60%
65%
70%
75%
80%
85%
90%
Portionofoneandlessattackrallies

Picture of the Game - 2017
FIVB scientific research project 16
Variability of “one and less attack rally” indicator
Comment: Practically it means that out from 4 rallies, only one rally consists of more than one attack (long rally). There is a slight downward trend in this study but the value still indicates an attack-defence imbalance.
65%
70%
75%
80%
Portion of one and less attack rallies
2006 2007 2008 2009 2010 2011
Oneandlessattackrally 79% 81% 68% 76% 73% 76%
2012 2013 2014 2015 2016 2017Oneandlessattackrally 76% 74,5% 73,8% 74,81% 75,94% 73,45
FRA-USA BRA-CAN RUS-CAN SRB-USA BRA-RUSPortionofoneandlessattackrallies 71,29% 71,59% 71,23% 73,12% 76,33%
FRA-SRB BRA-USA FRA-CAN USA-CAN BRA-FRAPortionofoneandlessattackrallies 75,25% 73,08% 72,93% 70,16% 78,15%

Picture of the Game - 2017
FIVB scientific research project 17
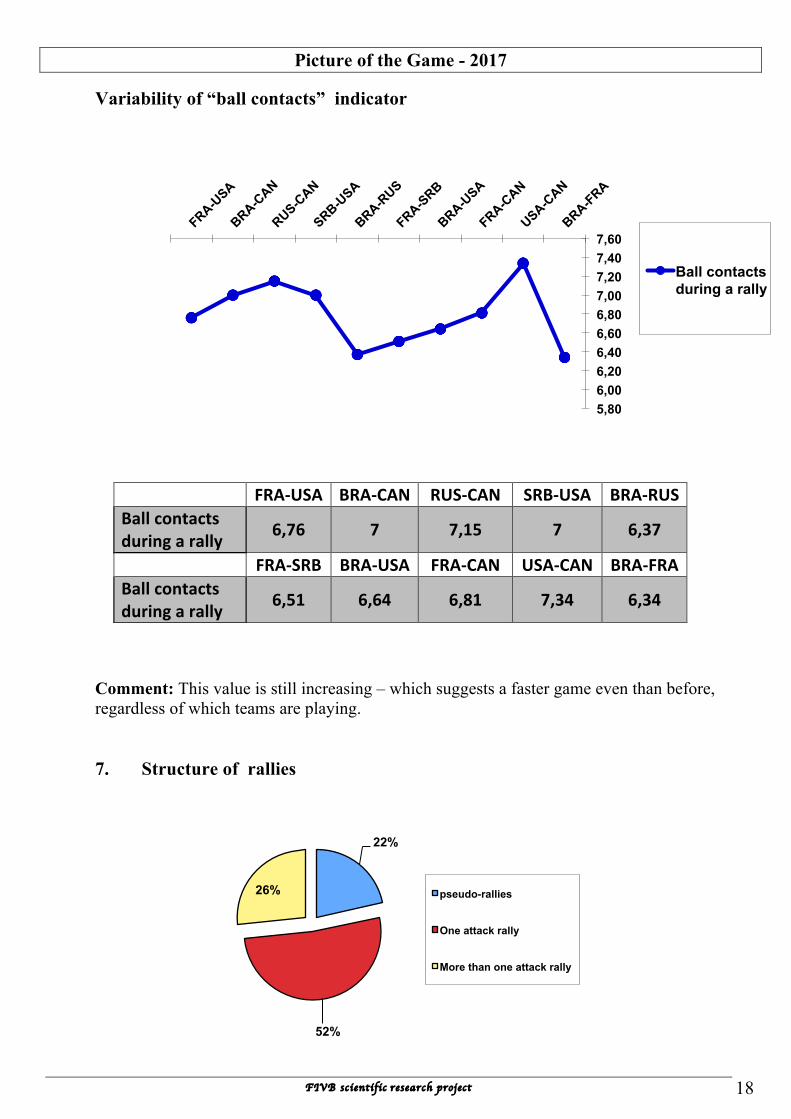
6. Average number of ball contacts during one rally (without pseudo- rallies)
2017 Value: 6,76
Dynamic of “ball contacts” indicator
2006 2007 2008 2009 2010 2011Averagenumberofballcontactsduringonerally
4,5 4,6 4,7 5,4 4,7 4,9
2012 2013 2014 2015 2016 2017Averagenumberofballcontactsduringonerally
5,7 6,7 6,4 6,6 6,5 6,76
3,00
3,50
4,00
4,50
5,00
5,50
6,00
6,50
7,00
Ballcontactsnumber
Picture of the Game - 2017
FIVB scientific research project 18
22%
52%
26% pseudo-rallies
One attack rally
More than one attack rally
Variability of “ball contacts” indicator
Comment: This value is still increasing – which suggests a faster game even than before, regardless of which teams are playing. 7. Structure of rallies
5,80 6,00 6,20 6,40 6,60 6,80 7,00 7,20 7,40 7,60
Ball contacts during a rally
FRA-USA BRA-CAN RUS-CAN SRB-USA BRA-RUSBallcontactsduringarally 6,76 7 7,15 7 6,37
FRA-SRB BRA-USA FRA-CAN USA-CAN BRA-FRABallcontactsduringarally 6,51 6,64 6,81 7,34 6,34

Picture of the Game - 2017
FIVB scientific research project 19
Dynamic of “structure of rallies” indicator
2006 2007 2008 2009 2010 2011Pseudo-rallies 21% 28% 12% 23% 20% 26%
Oneattackrallies 59% 52% 56% 53% 53% 50%
Morethanoneattackrallies 20% 20% 32% 24% 27% 24%
2012 2013 2014 2015 2016 2017Pseudo-rallies 25% 22% 21,5% 21,59% 22,97% 21,67%
Oneattackrallies 55% 52% 52,3% 50,03% 52,97% 51,78%
Morethanoneattackrallies 20% 26% 26,2% 28,38% 24,06% 26,55%
0,00%
10,00%
20,00%
30,00%
40,00%
50,00%
60,00%
70,00%
Pseudo-rallies
One-attackrallies
Morethanone-attackrallies
Picture of the Game - 2017
FIVB scientific research project 20
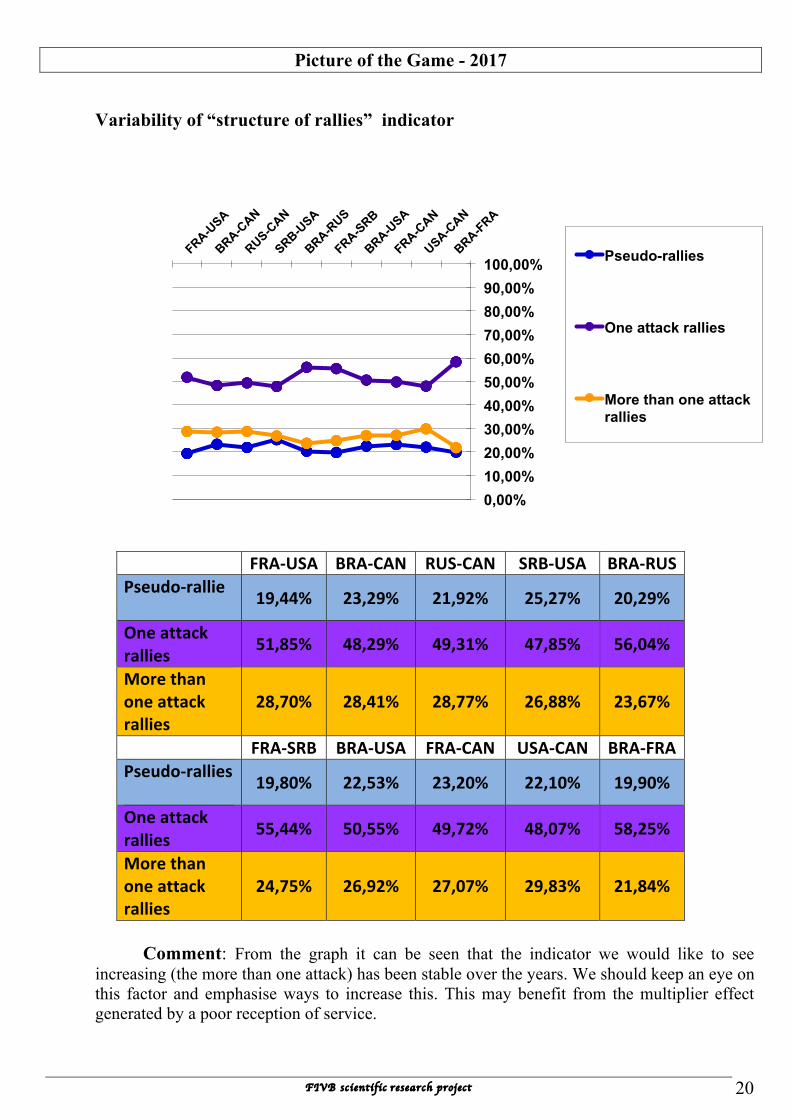
Variability of “structure of rallies” indicator
FRA-USA BRA-CAN RUS-CAN SRB-USA BRA-RUSPseudo-rallie 19,44% 23,29% 21,92% 25,27% 20,29%
Oneattackrallies 51,85% 48,29% 49,31% 47,85% 56,04%
Morethanoneattackrallies
28,70% 28,41% 28,77% 26,88% 23,67%
FRA-SRB BRA-USA FRA-CAN USA-CAN BRA-FRAPseudo-rallies 19,80% 22,53% 23,20% 22,10% 19,90%
Oneattackrallies 55,44% 50,55% 49,72% 48,07% 58,25%
Morethanoneattackrallies
24,75% 26,92% 27,07% 29,83% 21,84%
Comment: From the graph it can be seen that the indicator we would like to see increasing (the more than one attack) has been stable over the years. We should keep an eye on this factor and emphasise ways to increase this. This may benefit from the multiplier effect generated by a poor reception of service.
0,00% 10,00% 20,00% 30,00% 40,00% 50,00% 60,00% 70,00% 80,00% 90,00% 100,00% Pseudo-rallies
One attack rallies
More than one attack rallies

Picture of the Game - 2017
FIVB scientific research project 21
8. Attack-defence balance*
2017 Value: 2,09
* number of rallies won on the opponent service divided on number of rallies won on own service
Remark: attack-defence balance without pseudo-rallies is 1,71
Dynamic of “attack-defence balance” indicator
1,00
1,20
1,40
1,60
1,80
2,00
2,20
2,40
2,60
2,80
3,00
Attack-defencebalance

Picture of the Game - 2017
FIVB scientific research project 22
2006 2007 2008 2009 2010 2011
Attack-defencebalance 3 2,3 2,02 2,2 2,45 2,02
2012 2013 2014 2015 2016 2017Attack-defencebalance 2,09 1,85 2,18 2 2 2,09
Variability of “attack-defence balance” indicator
Comment: Current very “soft” and “liberal” service reception criteria are likely to be the main factor in continuing to create the imbalance shown in the figures (see above). We still see two out of every three rallies being won by the receiving team, regardless of the teams playing.
1
2
3
FRA-USA
BRA-CAN
RUS-CAN
SRB-USA
BRA-RUS
FRA-SRB
BRA-USA
FRA-CAN
USA-CAN
BRA-FRA
Attack-defence balance
FRA-USA BRA-CAN RUS-CAN SRB-USA BRA-RUSAttack-defencebalance 2 2,09 2,48 2,1 1,9
FRA-SRB BRA-USA FRA-CAN USA-CAN BRA-FRAAttack-defencebalance 1,77 1,89 1,87 2,48 2,47

Picture of the Game - 2017
FIVB scientific research project 23
33%
67%
Rally won on own service
Rally won on opponent service
9. Portion of rallies won on own service
2017 Value: 32,5 %
Remark: portion of rallies won on own service without pseudo-rallies is 36,88%
Dynamic of “portion of rallies won on own service” indicator
20,00%
22,00%
24,00%
26,00%
28,00%
30,00%
32,00%
34,00%
36,00%
38,00%
40,00%
Portionofrallieswononownservice

Picture of the Game - 2017
FIVB scientific research project 24
2007 2008 2009 2010 2011
Portionofrallieswononownservice 30% 33% 31% 29% 33%
2012 2013 2014 2015 2016 2017
Portionofrallieswononownservice 33% 36% 31,65% 33,53% 33,67% 32,50%
Variability of “portion of rallies won on own service” indicator
20
25
30
35
40
FRA-USA
BRA-CAN
RUS-CAN
SRB-USA
BRA-RUS
FRA-SRB
BRA-USA
FRA-CAN
USA-CAN
BRA-FRA
Portion of rallies won on own service (%)

Picture of the Game - 2017
FIVB scientific research project 25
Comment: Still not enough variation in this factor. When combined with attack-defence balance, these two factors make somewhat disturbing reading. Despite our efforts, the receiving team still wins the rally most of the time.
10. Portion of aces after jump service
2017 value: 4,94%
FRA-USA BRA-CAN RUS-CAN SRB-USA BRA-RUSPortionofrallieswononownservice 33,33% 32,39% 28,77% 32,26% 34,30%
Portionofrallieswononownservicewithoutpseudo-rallies
39,08% 35,55% 35,96% 36,69% 40%
FRA-SRB BRA-USA FRA-CAN USA-CAN BRA-FRAPortionofrallieswononownservice 36,14% 34,61% 34,81% 28,73% 28,64%
Portionofrallieswononownservicewithoutpseudo-rallies
38,89% 37,59% 36,69% 33,33% 33,94%

Picture of the Game - 2017
FIVB scientific research project 26
Dynamic of “portion of aces after jump service” indicator
2013 2014 2015 2016 2017
Portionofacesafterjumpservice 5,7% 5,3% 6,25% 7,56% 4,94
Variability of “portion of aces after jump service” indicator
2,00%
3,00%
4,00%
5,00%
6,00%
7,00%
8,00%
9,00%
10,00%
Portionofacesafterjumpservice(%)
0 1 2 3 4 5 6 7 8 9
10 11 12
FRA-USA
BRA-CAN
RUS-CAN
SRB-USA
BRA-RUS
FRA-SRB
BRA-USA
FRA-CAN
USA-CAN
BRA-FRA
Portion of aces after jump service (%)

Picture of the Game - 2017
FIVB scientific research project 27
Comment: The continued small drop in aces seems to be a good thing – the ball stays in play longer and the rally will likely not finish at the first attack. It seems likely that better reception techniques are responsible for this.
11. Net crossings
2017 value: 1,86 %
Dynamic of “net crossings” indicator
* Net crossings indicator without pseudo-rallies in 2017 WL Final is 2,09
1,7
1,75
1,8
1,85
1,9
1,95
2
2,05
2008OG 2012OG 2016OG 2017WLFinal
1,96
2,02
1,81
1,86
Netcrossingsinallrallies
FRA-USA BRA-
CANRUS-CAN SRB-USA BRA-RUS
Portionofacesafterjumpservice
2,2% 5,62% 2,08% 6,33% 5,06%
FRA-SRB BRA-USA FRA-CAN USA-CAN BRA-FRA
Portionofacesafterjumpservice
6,57% 5,93% 9,37% 3,88% 2,42%

Picture of the Game - 2017
FIVB scientific research project 28
Variability of “net crossings” indicator
Note: “zero” crossings - situation when a ball after service hit didn't cross vertical plane of the net. When a ball after service hit crossed the net plane and directly went out, then only one “crossing” was counted. Comment: There has been only a marginal change in the number of net crossings. At this point we should not read too much into this figure – except to say that the more net crossings the better the rally, the better the excitement levels, often more spectacular “saves” for TV to replay, and so on. It is still likely also that there are too many net faults interrupting the rallies, thus preventing this value from increasing.
1,7
1,8
1,9
2
2,1
2,2
2,3
2,4
Net crossings
Net crossings without pseudo-rallies
FRA-USA BRA-CAN RUS-CAN SRB-USA BRA-RUSNetcrossings 1,89 1,81 1,90 1,82 1,79Netcrossingswithoutpseudo-rallies 2,13 2,01 2,18 2,04 1,99
FRA-SRB BRA-USA FRA-CAN USA-CAN BRA-FRANetcrossings 1,86 1,89 1,78 2,05 1,86Netcrossingswithoutpseudo-rallies 2,04 2,18 1,98 2,30 2,05
Picture of the Game - 2017
FIVB scientific research project 29
Part 2.
Women’s volleyball of top level. Main indicators.
On the basis of the FIVB World Grand Prix final matches in Nanjing (China) 02-06.08.2017 the following statistical data reflecting the main volleyball indicators for women’s volleyball has been obtained for comparison with previous editions:
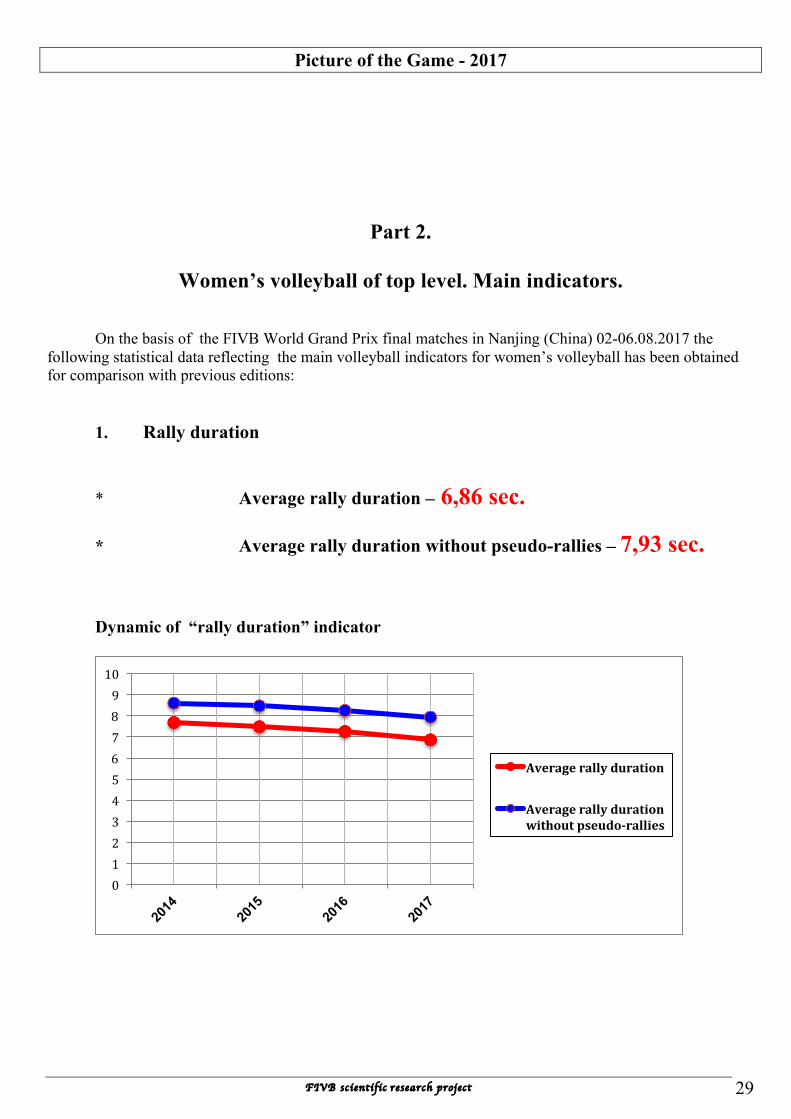
1. Rally duration
* Average rally duration – 6,86 sec. * Average rally duration without pseudo-rallies – 7,93 sec.
Dynamic of “rally duration” indicator
012345678910
Averagerallyduration
Averagerallydurationwithoutpseudo-rallies

Picture of the Game - 2017
FIVB scientific research project 30
2014 2015 2016 2017
Averagerallyduration 7,67 7,48 7,25 6,86Averagerallydurationwithoutpseudo-rallies 8,6 8,46 8,25 7,93
Variability of “rally duration” indicator
Comment: When we factor in the results for 2017 and compare with data going back to 2014, the trend in rally length has shown a slight but steady downward trend, perhaps because like the men, the women athletes are getting bigger, faster and stronger, and the services are not yet of the strength and power to trouble the defence as much as we would like to create the rally instability which we need.
6
6,5
7
7,5
8
8,5
9
9,5
10
Average rally duration
Average rally duration without pseudo-rallies
CHN-BRA SRB-USA USA-ITA BRA-NED SRB-ITAAveragerallyduration 6,23 7,28 7,32 7,22 7,16Averagerallydurationwithoutpseudo-rallies 6,87 8,46 8,39 8,07 8,45
CHN-NED SRB-BRA CHN-ITA CHN-SRB ITA-BRAAveragerallyduration 6,94 6,56 6,42 6,36 6,89Averagerallydurationwithoutpseudo-rallies 7,91 7,55 7,69 7,78 7,88
Picture of the Game - 2017
FIVB scientific research project 31
19%
81%
Rallies time
All sets duration
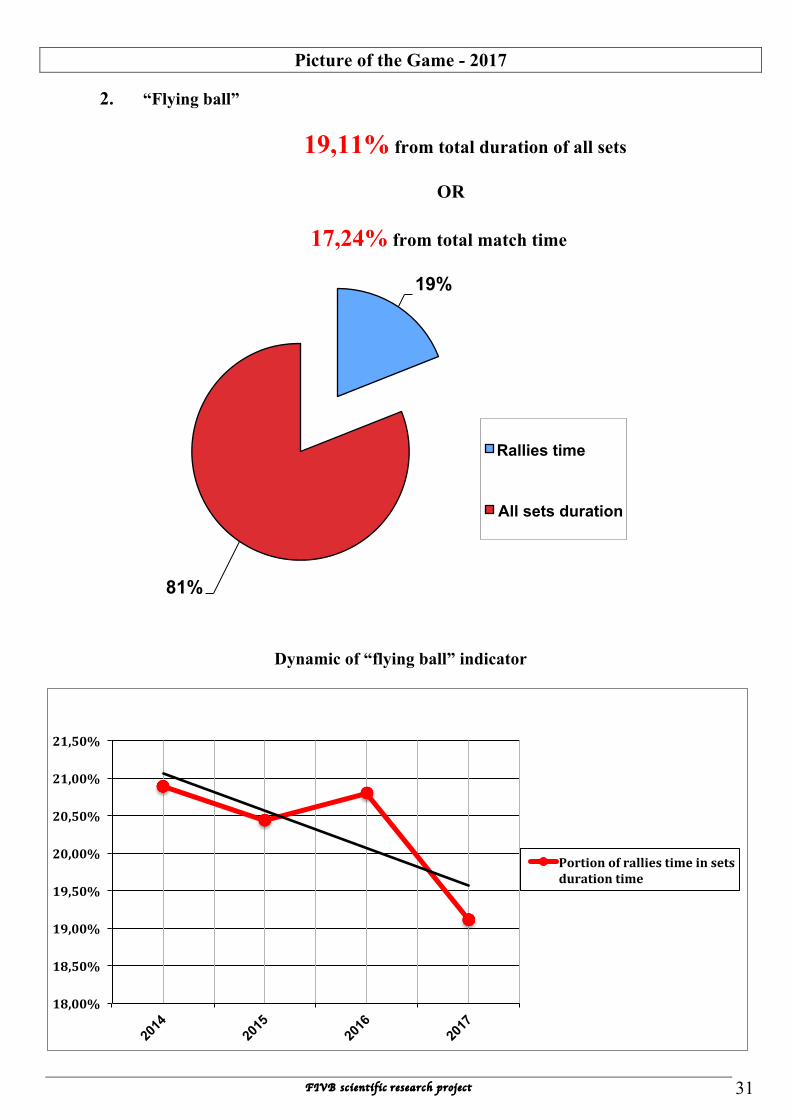
2. “Flying ball”
19,11% from total duration of all sets
OR
17,24% from total match time
Dynamic of “flying ball” indicator
18,00%
18,50%
19,00%
19,50%
20,00%
20,50%
21,00%
21,50%
Portionofralliestimeinsetsdurationtime

Picture of the Game - 2017
FIVB scientific research project 32
2014 2015 2016 2017Fromtotaldurationofallsets 20,89% 20,44% 20,8% 19,11%
Fromtotalmatchtime 18,95% 18,44% 19,06% 17,24%
Variability of “flying ball” indicator
CHN-BRA SRB-USA USA-ITA BRA-NED SRB-ITAPortionofralliestimeinsetsdurationtime 17,76% 20,21% 21,12% 19,14% 19,68%
CHN-NED SRB-BRA CHN-ITA CHN-SRB ITA-BRAPortionofralliestimeinsetsdurationtime 19,84% 18,23% 17,23% 18,22% 19,10%
Comment: There has been a 2% drop in flying ball time since 2014 when all matches are considered – although individual matches will perhaps demonstrate a smaller change in flying ball. Nevertheless, the 2% fall is significant and should be viewed as a trend which we need to bring to a standstill if we are to retain audience as we have done historically.
17,0%
18,0%
19,0%
20,0%
21,0%
22,0%
Portion of rallies time in sets duration time

Picture of the Game - 2017
FIVB scientific research project 33
15%
85%
Pseudo-rallies Rallies
3. Portion of “pseudo-rallies” (ace or service fault, about 1 sec.) – 15,47 %
Dynamic of “pseudo-rallies” indicator
10,00%
11,00%
12,00%
13,00%
14,00%
15,00%
16,00%
17,00%
18,00%
19,00%
20,00%
Pseudo-rallies

Picture of the Game - 2017
FIVB scientific research project 34
2014 2015 2016 2017
Portionof“pseudo-rallies” 12,79% 12,01% 13,66% 15,47%
Variability of “pseudo-rallies” indicator
CHN-BRA SRB-USA USA-ITA BRA-NED SRB-ITAPortionofpseudo-rallies 11,03% 16,02% 14,52% 11,98% 17,32%
CHN-NED SRB-BRA CHN-ITA CHN-SRB ITA-BRAPortionofpseudo-rallies 13,90% 15,64% 18,95% 20,97% 14,35%
Comment: The significance of this figure is perhaps in the number of service errors as opposed to ace services. Again, this is something to consider. We need high risk serves to develop longer rallies, but we need to reduce the errors by the server at the same time.
10% 11% 12% 13% 14% 15% 16% 17% 18% 19% 20% 21% 22%
Portion of pseudo-rallies
Picture of the Game - 2017
FIVB scientific research project 35
50% 50% Two and more attack rally
One attack rally
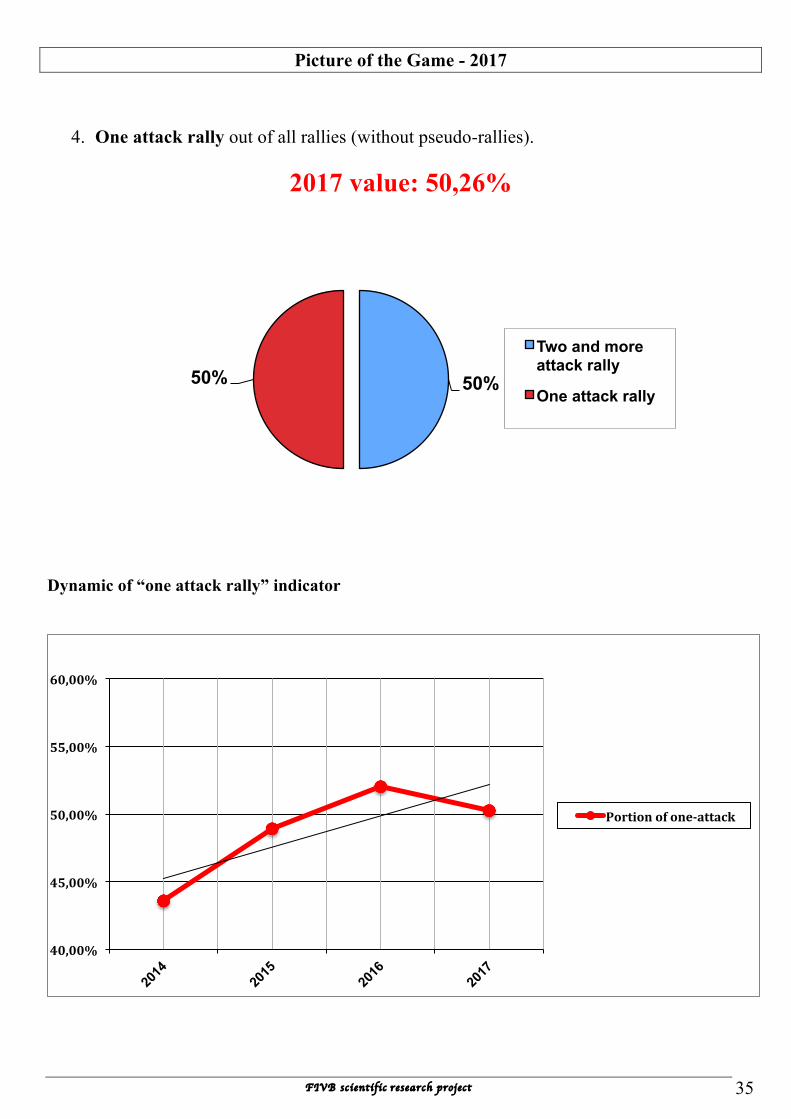
4. One attack rally out of all rallies (without pseudo-rallies).
2017 value: 50,26% Dynamic of “one attack rally” indicator
40,00%
45,00%
50,00%
55,00%
60,00%
Portionofone-attack
Picture of the Game - 2017
FIVB scientific research project 36
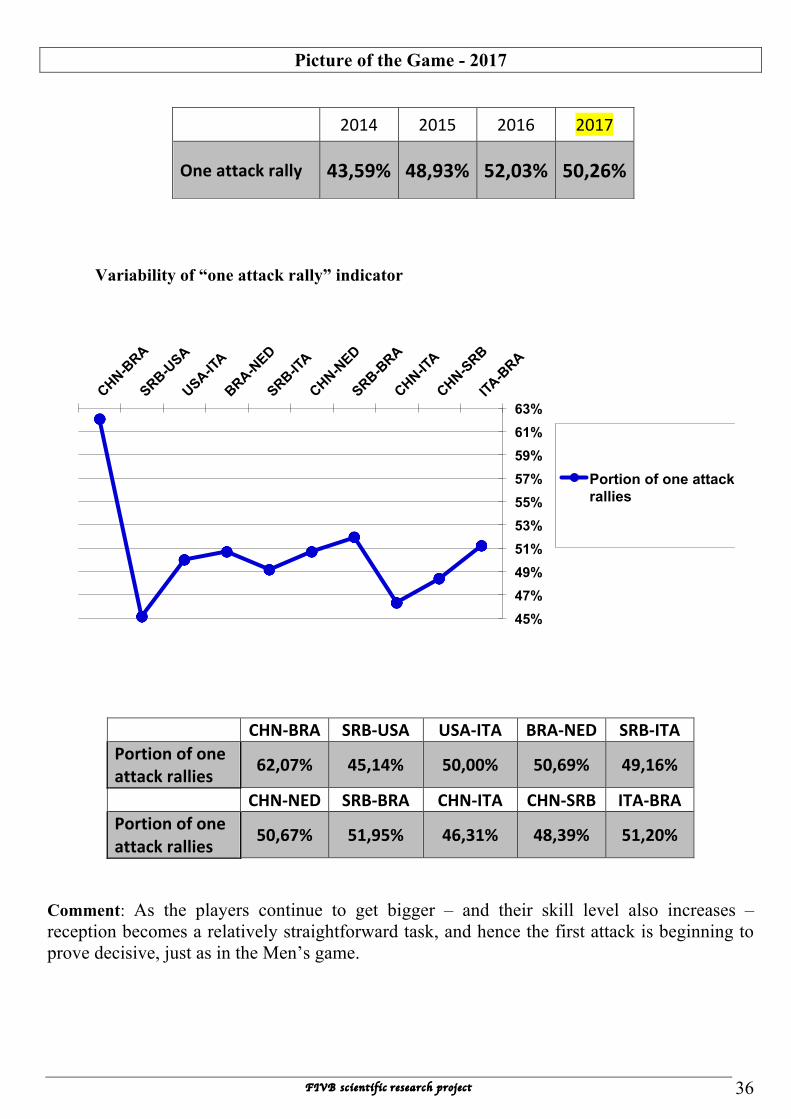
Variability of “one attack rally” indicator
CHN-BRA SRB-USA USA-ITA BRA-NED SRB-ITAPortionofoneattackrallies 62,07% 45,14% 50,00% 50,69% 49,16%
CHN-NED SRB-BRA CHN-ITA CHN-SRB ITA-BRAPortionofoneattackrallies 50,67% 51,95% 46,31% 48,39% 51,20%
Comment: As the players continue to get bigger – and their skill level also increases – reception becomes a relatively straightforward task, and hence the first attack is beginning to prove decisive, just as in the Men’s game.
45% 47% 49% 51% 53% 55% 57% 59% 61% 63%
Portion of one attack rallies
2014 2015 2016 2017
Oneattackrally 43,59% 48,93% 52,03% 50,26%

Picture of the Game - 2017
FIVB scientific research project 37
34%
66%
Two and more attack rally One and less attack rally
5. One and less attack rally – 65,73% of all rallies (with pseudo-rallies).
Dynamic of “one and less attack rally” indicator
2014 2015 2016 2017
Oneandlessattackrally 55,49% 60,94% 65,69% 65,73%
50,00%
55,00%
60,00%
65,00%
70,00%
Portionofoneandlessattackrallies
Picture of the Game - 2017
FIVB scientific research project 38
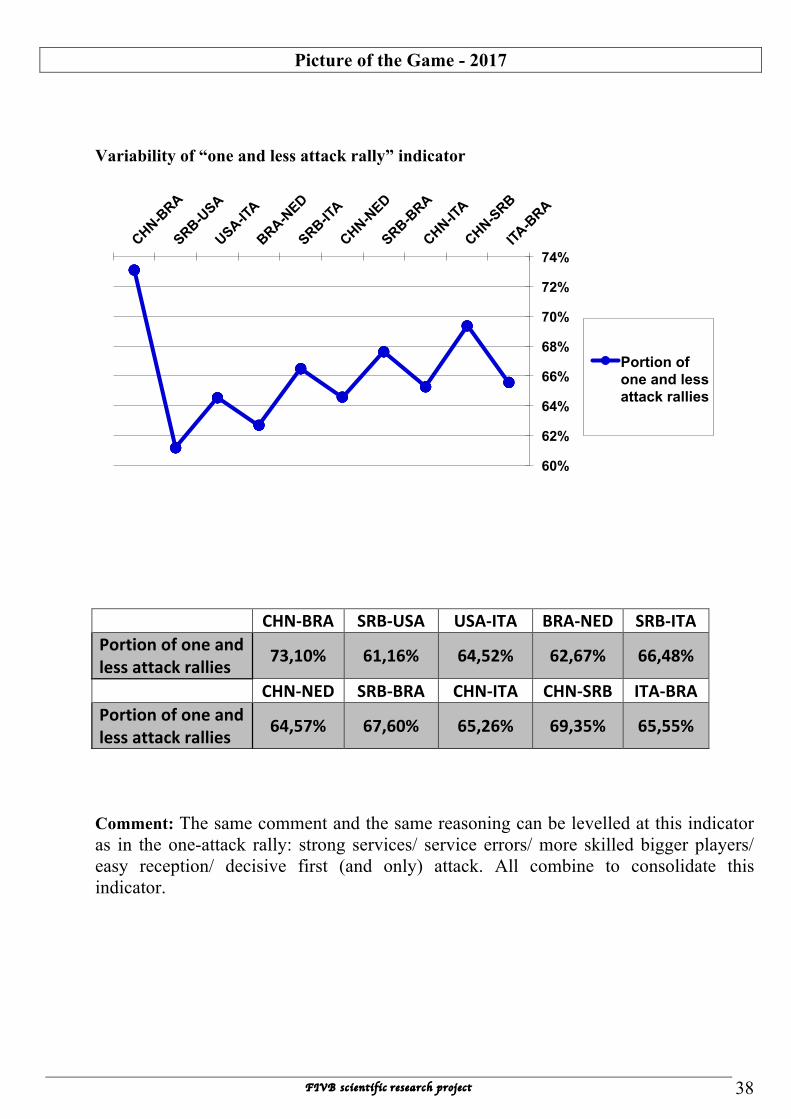
Variability of “one and less attack rally” indicator
Comment: The same comment and the same reasoning can be levelled at this indicator as in the one-attack rally: strong services/ service errors/ more skilled bigger players/ easy reception/ decisive first (and only) attack. All combine to consolidate this indicator.
60%
62%
64%
66%
68%
70%
72%
74%
Portion of one and less attack rallies
CHN-BRA SRB-USA USA-ITA BRA-NED SRB-ITAPortionofoneandlessattackrallies 73,10% 61,16% 64,52% 62,67% 66,48%
CHN-NED SRB-BRA CHN-ITA CHN-SRB ITA-BRAPortionofoneandlessattackrallies 64,57% 67,60% 65,26% 69,35% 65,55%

Picture of the Game - 2017
FIVB scientific research project 39
6. Average number of ball contacts during one rally (without pseudo-rallies)
2017 Value : 7,27
Dynamic of “contacts” indicator
6,00
6,20
6,40
6,60
6,80
7,00
7,20
7,40
7,60
7,80
8,00
Ballcontactsnumber
2014 2015 2016 2017Averagenumberofballcontactsduringonerally
7,9 7,72 7,56 7,27
Picture of the Game - 2017
FIVB scientific research project 40
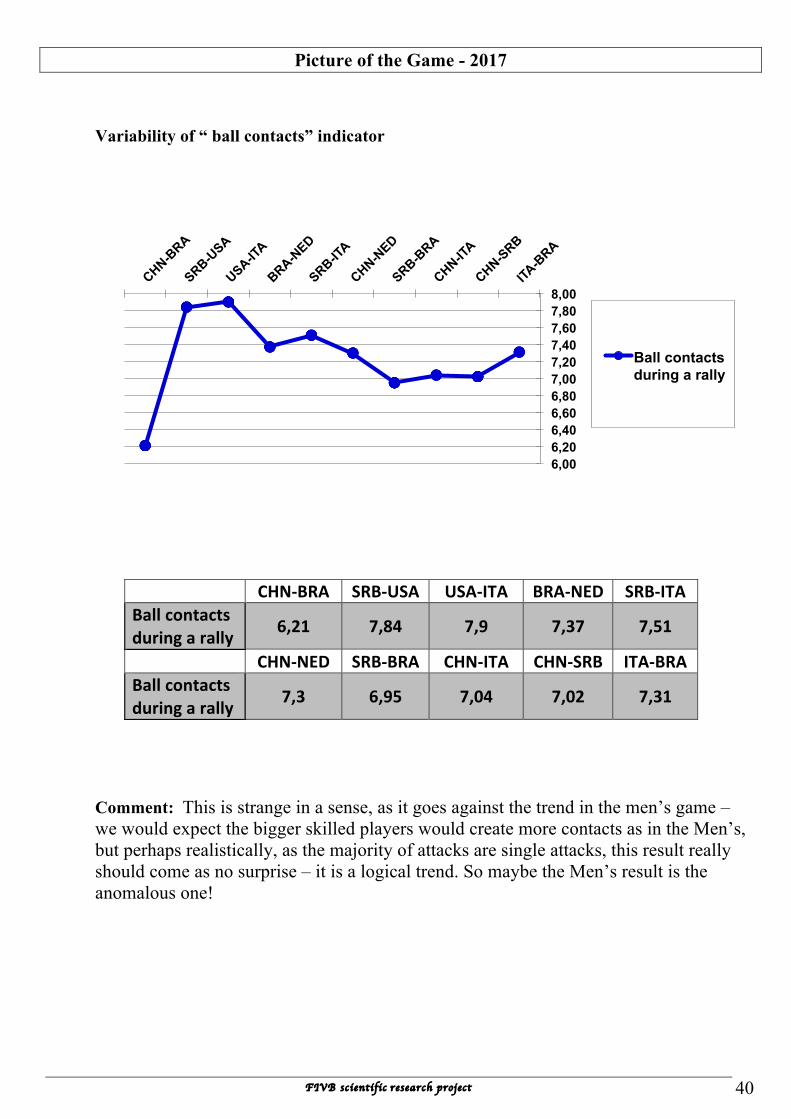
Variability of “ ball contacts” indicator
Comment: This is strange in a sense, as it goes against the trend in the men’s game – we would expect the bigger skilled players would create more contacts as in the Men’s, but perhaps realistically, as the majority of attacks are single attacks, this result really should come as no surprise – it is a logical trend. So maybe the Men’s result is the anomalous one!
6,00 6,20 6,40 6,60 6,80 7,00 7,20 7,40 7,60 7,80 8,00
Ball contacts during a rally
CHN-BRA SRB-USA USA-ITA BRA-NED SRB-ITABallcontactsduringarally 6,21 7,84 7,9 7,37 7,51
CHN-NED SRB-BRA CHN-ITA CHN-SRB ITA-BRABallcontactsduringarally 7,3 6,95 7,04 7,02 7,31

Picture of the Game - 2017
FIVB scientific research project 41
7. Structure of rallies
* Pseudo-rallies 15,47 %
* One attack rally 50,26 %
* More than one attack rally 34,27 %
Total: 100 %
Dynamic of “structure of rallies” indicator
15,47
50,26
34,27
pseudorallies
Oneattackrally
Morethanoneattackrally
0%
10%
20%
30%
40%
50%
60%
Pseudo-rallies
One-attackrallies
Morethanone-attackrallies

Picture of the Game - 2017
FIVB scientific research project 42
Variability of “structure of rallies” indicator
USA-NED THA-BRA CHN-NED RUS-BRA USA-CHN THA-RUSPseudo-rallies 15,44% 14,17% 15,66% 14,06% 10,49% 10,96%Oneattackrallies 44,85% 46,45% 48,50% 57,03% 51,75% 51,37%Morethanoneattackrallies 39,70% 39,37% 35,84% 28,91% 37,76% 37,67%
BRA-NED USA-RUS NED-RUS USA-BRA THA-CHN Pseudo-rallies 14,39% 15,91% 10,96% 16,67% 11,28% Oneattackrallies 64,60% 50,76% 58,97% 48,04% 49,62% Morethanoneattackrallies 21,01% 33,33% 30,07% 35,29% 39,10%
Comment: The trend continues – women’s volleyball is maintaining its downward shift to become more like the Men’s version – the “long rally” game may soon become history.
0%
10%
20%
30%
40%
50%
60% Pseudo-rallies
One attack rallies
More than one attack rallies

Picture of the Game - 2017
FIVB scientific research project 43
8. Attack-defence balance*
2017 value: 1,56
* number of rallies won on the opponent service divided on number of rallies won on own service
Remark: attack-defence balance without pseudo-rallies is 1,52 Dynamic of “attack-defence balance” indicator
2014 2015 2016 2017
Attack-defencebalance 1,5 1,47 1,64 1,56
1,30
1,35
1,40
1,45
1,50
1,55
1,60
1,65
1,70
Attack-defencebalance

Picture of the Game - 2017
FIVB scientific research project 44
Variability of “attack-defense balance” indicator
Comment: There is a small but noticeable shift towards the attack – but depends on who is playing.
CHN-BRA
SRB-USA
USA-ITA
BRA-NED
SRB-ITA
CHN-NED
SRB-BRA
CHN-ITA
CHN-SRB
ITA-BRA
Attack-defence balance
CHN-BRA SRB-USA USA-ITA BRA-NED SRB-ITAAttack-defencebalance 1,46 1,36 1,45 1,41 1,43
CHN-NED SRB-BRA CHN-ITA CHN-SRB ITA-BRAAttack-defencebalance 1,67 1,77 1,57 1,73 1,74
Picture of the Game - 2017
FIVB scientific research project 45
39%
61%
Rally won on own service
Rally won on opponent service
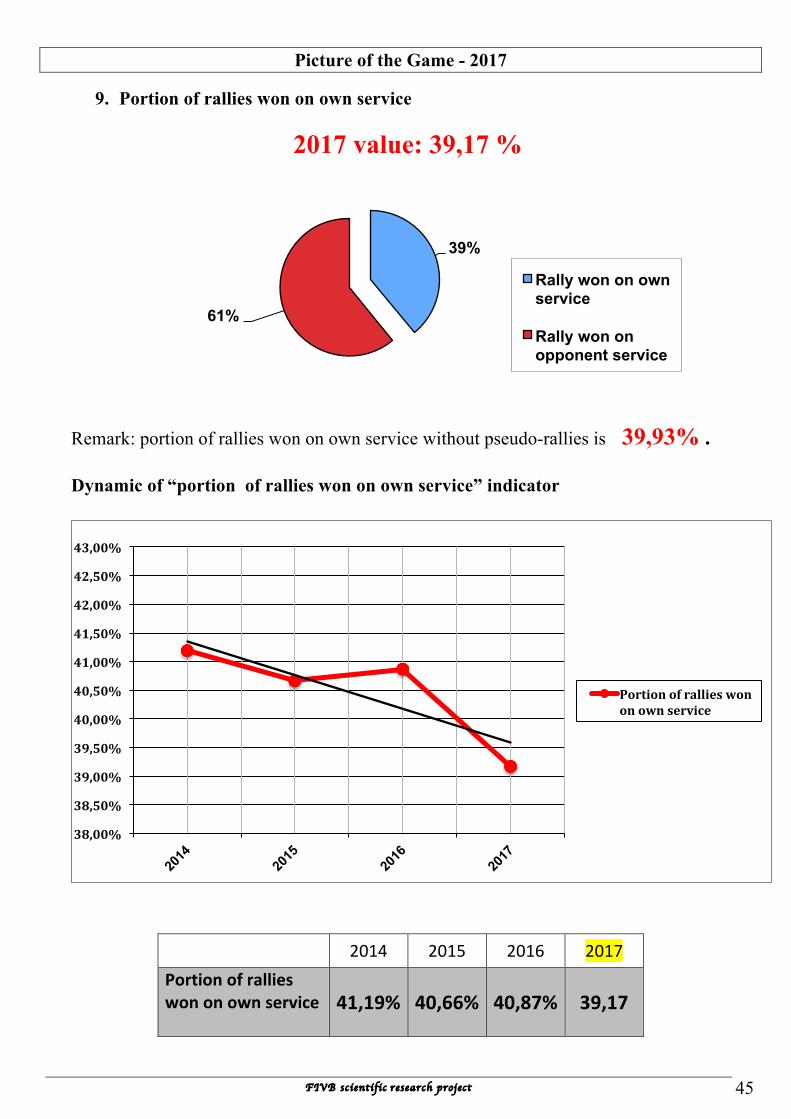
9. Portion of rallies won on own service
2017 value: 39,17 %
Remark: portion of rallies won on own service without pseudo-rallies is 39,93% . Dynamic of “portion of rallies won on own service” indicator
2014 2015 2016 2017Portionofrallieswononownservice
41,19% 40,66% 40,87% 39,17
38,00%
38,50%
39,00%
39,50%
40,00%
40,50%
41,00%
41,50%
42,00%
42,50%
43,00%
Portionofrallieswononownservice

Picture of the Game - 2017
FIVB scientific research project 46
Variability of “portion of rallies won on own service” indicator
Comment: Due to the relatively less powerful services in Women’s volleyball overall, we can understand some of the previous figures influencing flying ball, one or more attack rallies and so on. Here we see a little encouragement – the services are maintaining an edge despite the impact of the Libero in the serve-reception units: there has not been too much of a drop overall. That said, we need to maintain a watchful eye on this figure. If reception is too easy, if the service is weakened, then both combined will drive this figure in a direction which cannot be good for the entertainment value of the sport.
30
35
40
45
50
CHN-BRA
SRB-USA
USA-ITA
BRA-NED
SRB-ITA
CHN-NED
SRB-BRA
CHN-ITA
CHN-SRB
ITA-BRA
Portion of rallies won on own service (%)
CHN-BRA SRB-USA USA-ITA BRA-NED SRB-ITAPortionofrallieswononownservice 40,69% 42,23% 40,86% 41,47% 41,34%
Portionofrallieswononownservicewithoutpseudo-rallies
40,31% 45,09% 42,77% 41,36% 43,91%
CHN-NED SRB-BRA CHN-ITA CHN-SRB ITA-BRAPortionofrallieswononownservice 37,22% 36,31% 38,95% 36,56% 36,36%
Portionofrallieswononownservicewithoutpseudo-rallies
35,94% 37,09% 38,31% 36,73% 37,99%

Picture of the Game - 2017
FIVB scientific research project 47
10. Portion of aces after jump service
2017 value: 6,09 %
Dynamic of “portion of aces after jump service” indicator
2014 2015 2016 2017
Portionofacesafterjumpservice 2,57% 2,07% 1,63% 6,09
0,00%
1,00%
2,00%
3,00%
4,00%
5,00%
6,00%
7,00%
Portionofacesafterjumpservice(%)

Picture of the Game - 2017
FIVB scientific research project 48
Variability of “portion of aces after jump service” indicator
Comment: if teams move away from the float service to a jump service, then the likelihood is that the trend in the previous indicator can be reversed. Already we see that the jump service is proving a problem to receive when it is used.
0 2 4 6 8
10 12 14 16 18 20
CHN-BRA
SRB-USA
USA-ITA
BRA-NED
SRB-ITA
CHN-NED
SRB-BRA
CHN-ITA
CHN-SRB
ITA-BRA
Portion of aces after jump service (%)
CHN-BRA SRB-USA USA-ITA BRA-NED SRB-ITAPortionofacesafterjumpservice
0% 0% 5,71% 0% 5,55%
CHN-NED SRB-BRA CHN-ITA CHN-SRB ITA-BRAPortionofacesafterjumpservice
11,11% 11,11% 5,71% 18,37% 3,22%

Picture of the Game - 2017
FIVB scientific research project 49
11. Net crossings
2017 value: 2,18 %
Dynamic of “net crossings” indicator
Variability of “net crossings” indicator
2,05
2,1
2,15
2,2
2,25
2,3
2,35
2,4
2008OG 2012OG 2016OG 2017WGPFinal
2,4 2,4
2,22,18
Netcrossingsinallrallies
2
2,05
2,1
2,15
2,2
2,25
2,3
2,35
2,4
2,45
2,5
The ball crossing nets
The ball crossing nets without 0
Picture of the Game - 2017
FIVB scientific research project 50
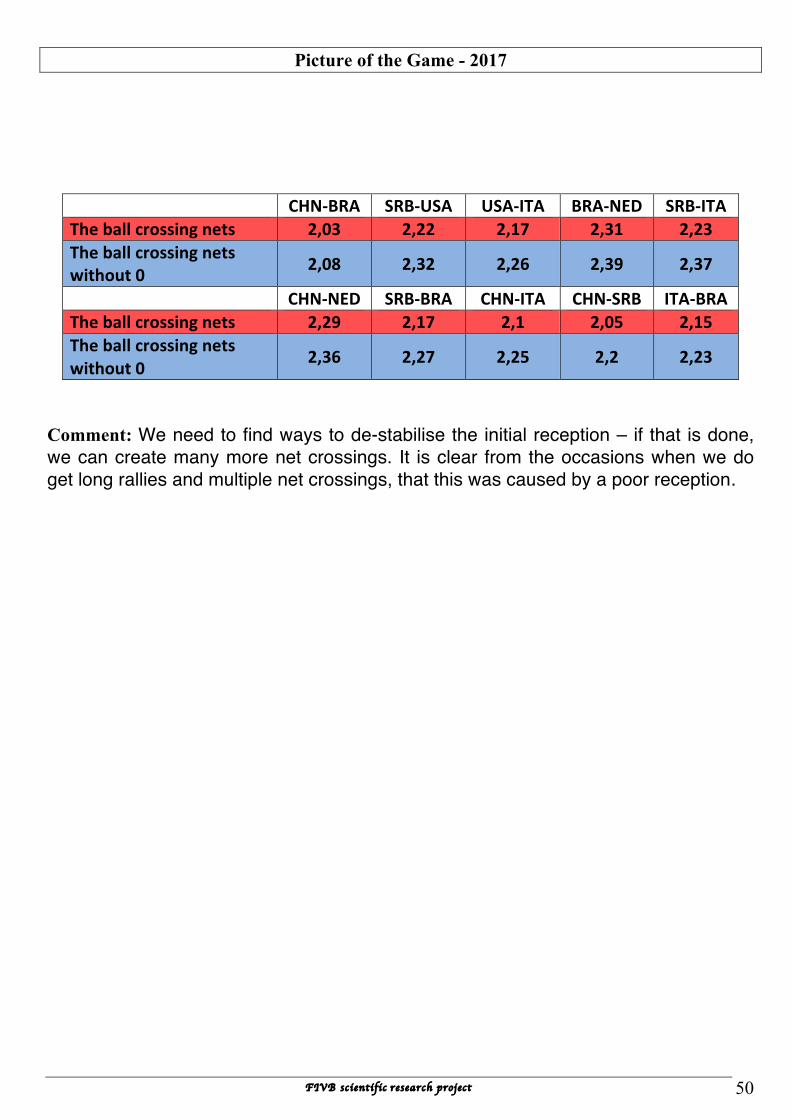
Comment: We need to find ways to de-stabilise the initial reception – if that is done, we can create many more net crossings. It is clear from the occasions when we do get long rallies and multiple net crossings, that this was caused by a poor reception.
CHN-BRA SRB-USA USA-ITA BRA-NED SRB-ITATheballcrossingnets 2,03 2,22 2,17 2,31 2,23Theballcrossingnetswithout0 2,08 2,32 2,26 2,39 2,37
CHN-NED SRB-BRA CHN-ITA CHN-SRB ITA-BRATheballcrossingnets 2,29 2,17 2,1 2,05 2,15Theballcrossingnetswithout0 2,36 2,27 2,25 2,2 2,23
Picture of the Game - 2017
FIVB scientific research project 51
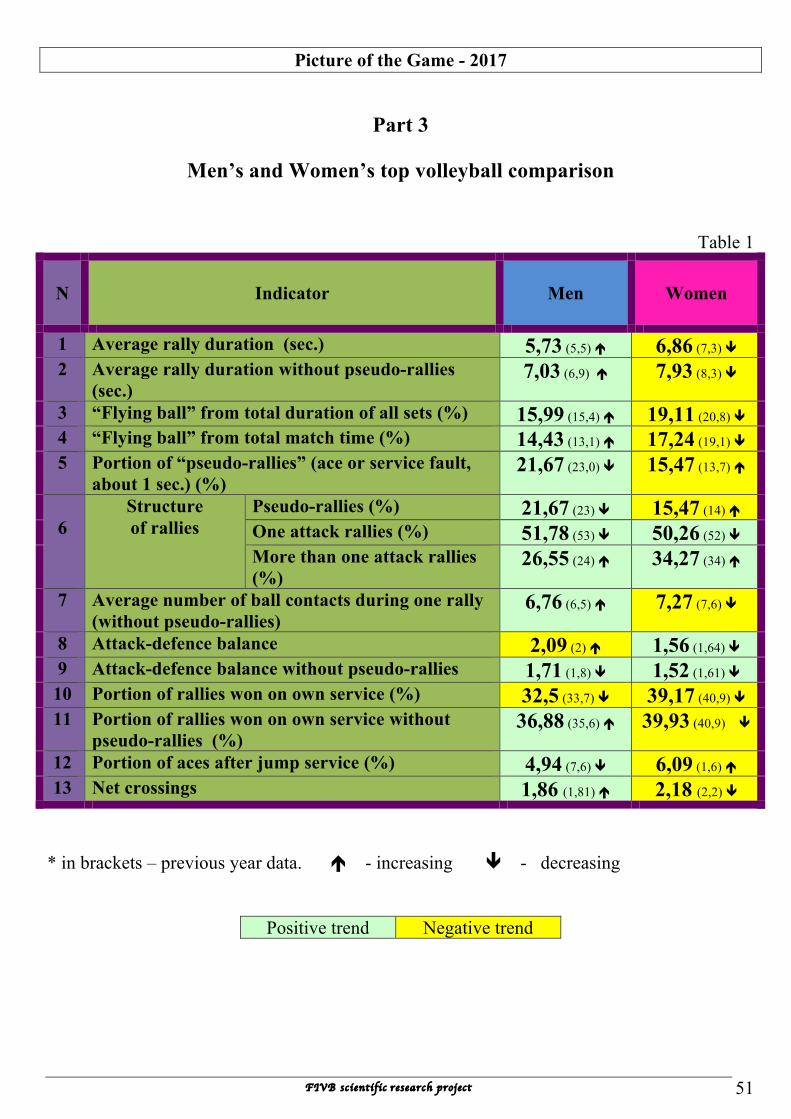
Part 3
Men’s and Women’s top volleyball comparison
Table 1
N
Indicator
Men
Women
1 Average rally duration (sec.) 5,73 (5,5) é 6,86 (7,3) ê
2 Average rally duration without pseudo-rallies (sec.)
7,03 (6,9) é 7,93 (8,3) ê
3 “Flying ball” from total duration of all sets (%) 15,99 (15,4) é 19,11 (20,8) ê
4 “Flying ball” from total match time (%) 14,43 (13,1) é 17,24 (19,1) ê
5 Portion of “pseudo-rallies” (ace or service fault, about 1 sec.) (%)
21,67 (23,0) ê 15,47 (13,7) é
6
Structure of rallies
Pseudo-rallies (%) 21,67 (23) ê 15,47 (14) é
One attack rallies (%) 51,78 (53) ê 50,26 (52) ê
More than one attack rallies (%)
26,55 (24) é 34,27 (34) é
7 Average number of ball contacts during one rally (without pseudo-rallies)
6,76 (6,5) é
7,27 (7,6) ê
8 Attack-defence balance 2,09 (2) é 1,56 (1,64) ê
9 Attack-defence balance without pseudo-rallies 1,71 (1,8) ê 1,52 (1,61) ê
10 Portion of rallies won on own service (%) 32,5 (33,7) ê 39,17 (40,9) ê
11 Portion of rallies won on own service without pseudo-rallies (%)
36,88 (35,6) é 39,93 (40,9) ê
12 Portion of aces after jump service (%) 4,94 (7,6) ê 6,09 (1,6) é
13 Net crossings 1,86 (1,81) é 2,18 (2,2) ê * in brackets – previous year data. é - increasing ê - decreasing
Positive trend Negative trend
Picture of the Game - 2017
FIVB scientific research project 52
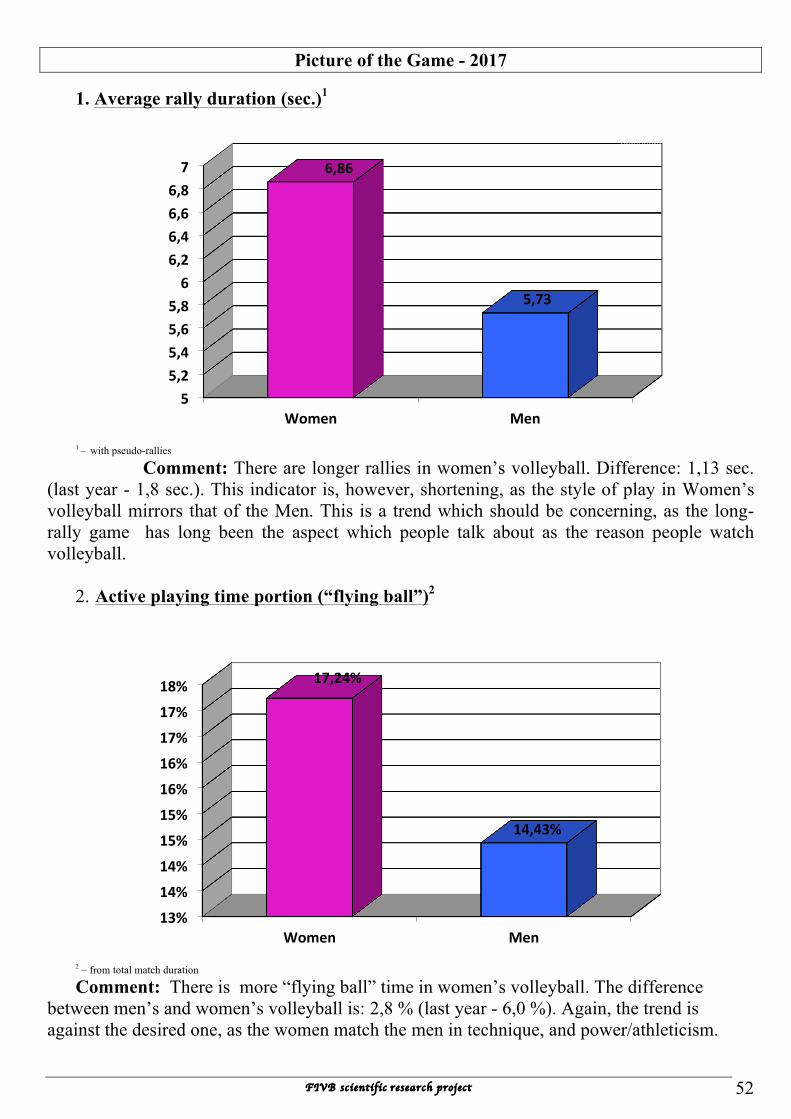
1. Average rally duration (sec.)1
1 – with pseudo-rallies
Comment: There are longer rallies in women’s volleyball. Difference: 1,13 sec. (last year - 1,8 sec.). This indicator is, however, shortening, as the style of play in Women’s volleyball mirrors that of the Men. This is a trend which should be concerning, as the long-rally game has long been the aspect which people talk about as the reason people watch volleyball.
2. Active playing time portion (“flying ball”)2
2 – from total match duration
Comment: There is more “flying ball” time in women’s volleyball. The difference between men’s and women’s volleyball is: 2,8 % (last year - 6,0 %). Again, the trend is against the desired one, as the women match the men in technique, and power/athleticism.
55,25,45,65,86
6,26,46,66,87
Women Men
6,86
5,73
13%
14%
14%
15%
15%
16%
16%
17%
17%
18%
Women Men
17,24%
14,43%
Picture of the Game - 2017
FIVB scientific research project 53
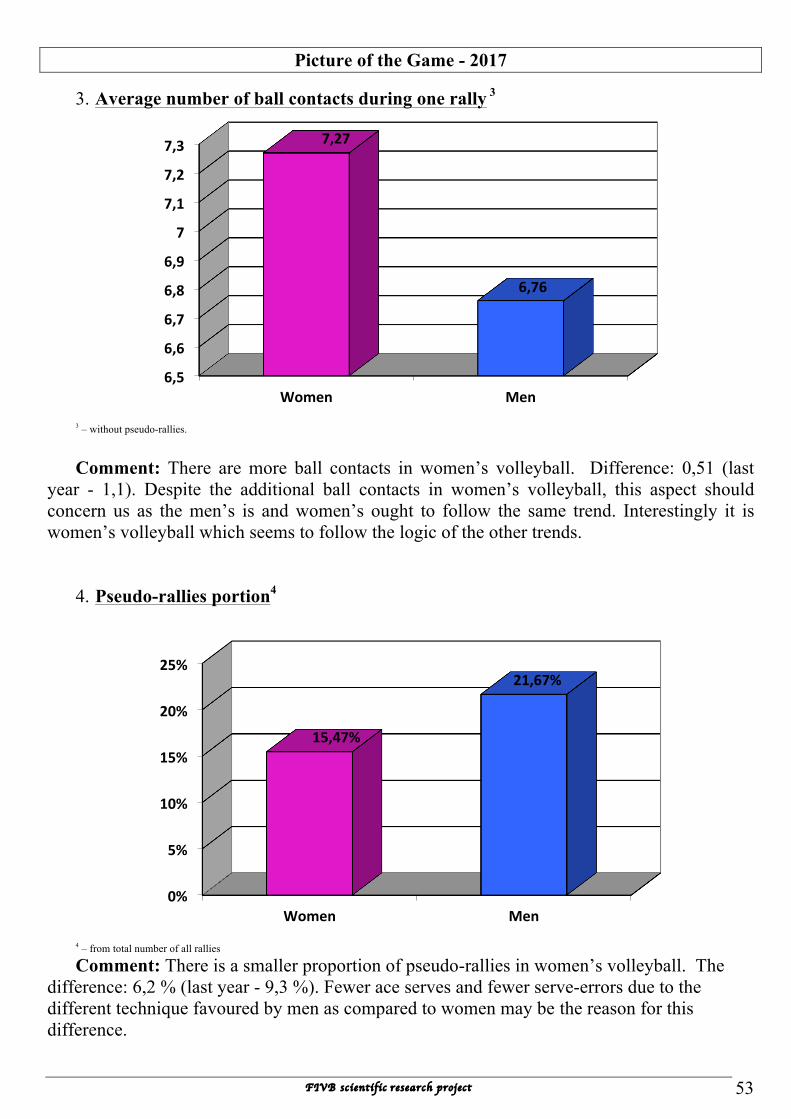
3. Average number of ball contacts during one rally 3
3 – without pseudo-rallies. Comment: There are more ball contacts in women’s volleyball. Difference: 0,51 (last
year - 1,1). Despite the additional ball contacts in women’s volleyball, this aspect should concern us as the men’s is and women’s ought to follow the same trend. Interestingly it is women’s volleyball which seems to follow the logic of the other trends.
4. Pseudo-rallies portion4
4 – from total number of all rallies Comment: There is a smaller proportion of pseudo-rallies in women’s volleyball. The
difference: 6,2 % (last year - 9,3 %). Fewer ace serves and fewer serve-errors due to the different technique favoured by men as compared to women may be the reason for this difference.
6,5
6,6
6,7
6,8
6,9
7
7,1
7,2
7,3
Women Men
7,27
6,76
0%
5%
10%
15%
20%
25%
Women Men
15,47%
21,67%
Picture of the Game - 2017
FIVB scientific research project 54
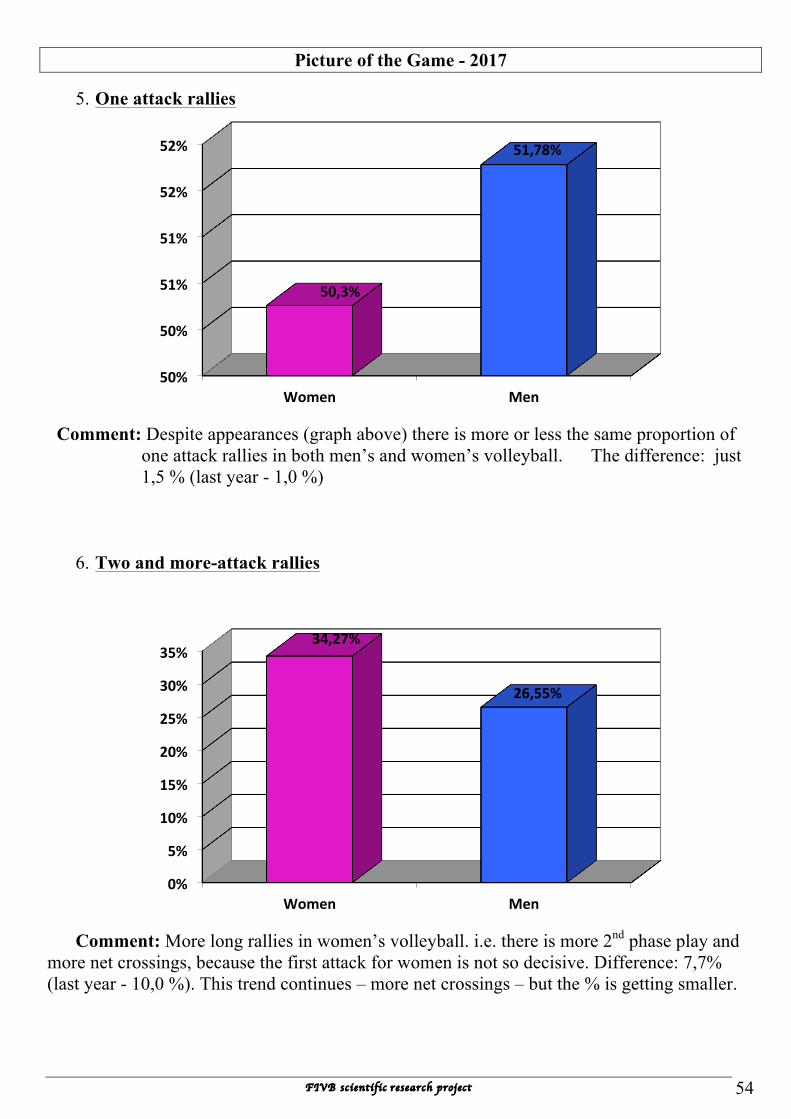
5. One attack rallies
Comment: Despite appearances (graph above) there is more or less the same proportion of
one attack rallies in both men’s and women’s volleyball. The difference: just 1,5 % (last year - 1,0 %)
6. Two and more-attack rallies
Comment: More long rallies in women’s volleyball. i.e. there is more 2nd phase play and
more net crossings, because the first attack for women is not so decisive. Difference: 7,7% (last year - 10,0 %). This trend continues – more net crossings – but the % is getting smaller.
50%
50%
51%
51%
52%
52%
Women Men
50,3%
51,78%
0%
5%
10%
15%
20%
25%
30%
35%
Women Men
34,27%
26,55%
Picture of the Game - 2017
FIVB scientific research project 55
22%
52%
26%
pseudo-rallies
One attack rally
More than one attack rally
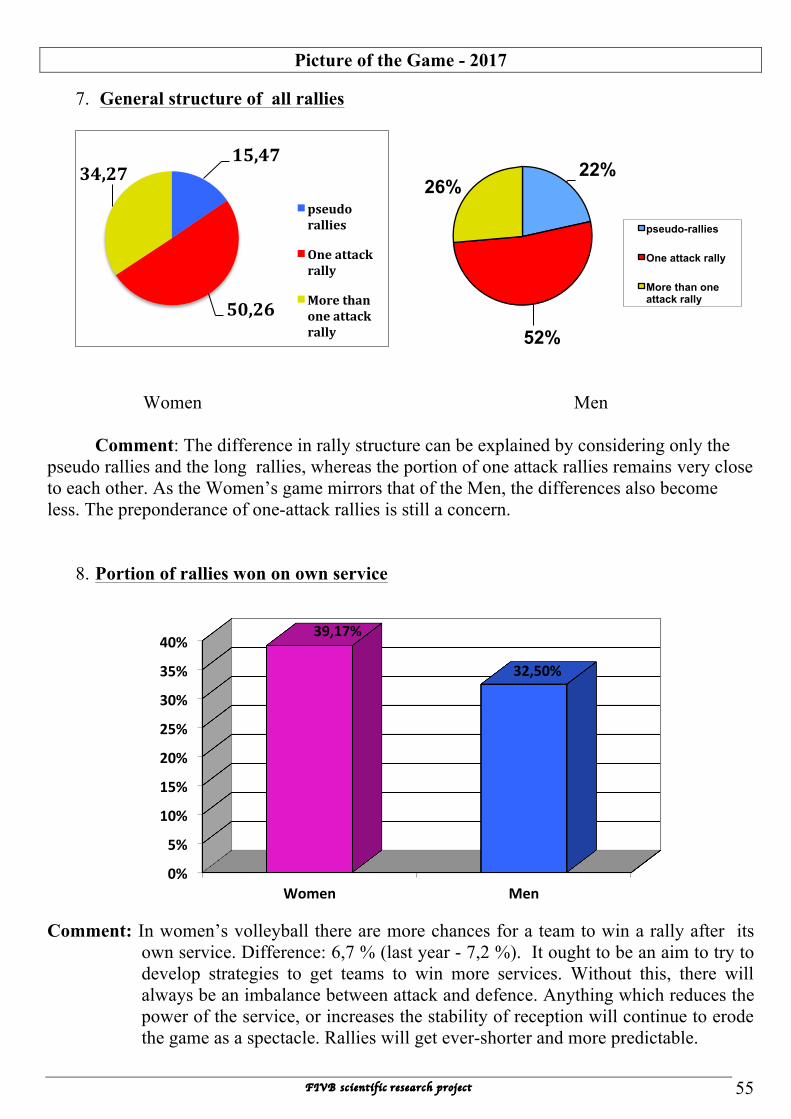
7. General structure of all rallies
Women Men
Comment: The difference in rally structure can be explained by considering only the pseudo rallies and the long rallies, whereas the portion of one attack rallies remains very close to each other. As the Women’s game mirrors that of the Men, the differences also become less. The preponderance of one-attack rallies is still a concern.
8. Portion of rallies won on own service
Comment: In women’s volleyball there are more chances for a team to win a rally after its
own service. Difference: 6,7 % (last year - 7,2 %). It ought to be an aim to try to develop strategies to get teams to win more services. Without this, there will always be an imbalance between attack and defence. Anything which reduces the power of the service, or increases the stability of reception will continue to erode the game as a spectacle. Rallies will get ever-shorter and more predictable.
15,47
50,26
34,27
pseudorallies
Oneattackrally
Morethanoneattackrally
0%
5%
10%
15%
20%
25%
30%
35%
40%
Women Men
39,17%
32,50%

Picture of the Game - 2017
FIVB scientific research project 56
9. Attack-defence balance5
5 – number of rallies won on the opponent service divided on number of rallies won on own service
Comment: Women’s volleyball is much more balanced regarding power of attack and ability to play in defence. Difference: 0,53 (last year - 0,36). While this remains favourable, at least in Women’s Volleyball, the trend has been against defence and pro-attack. It is much more attack-dominant in Men’s Volleyball, but unfortunately the Women re catching up fast as their height and athleticism increases year-on-year.
10. Net crossings
Comment: More net crossings in women’s volleyball. Difference – 0,32 General conclusion regarding men’s and women’s volleyball comparison: women’s volleyball becoming closer to men’s volleyball in terms of negative trends in the majority of indicators. This negative progression is becoming even more marked.
0
0,5
1
1,5
2
2,5
Women Men
1,56
2,09
1,7
1,8
1,9
2
2,1
2,2
Women Men
2,18
1,86
Picture of the Game - 2017
FIVB scientific research project 57
Part 4
Match and set duration

Picture of the Game - 2017
FIVB scientific research project 58
Match duration
Indicator
Men
Women
2015 year data
2016 year data
2017 year data
2015 year data
2016 year data
2017 year data
Average duration (min.)
111,0 113,4 124,8 94,0 90,7 127,4
Minimum registered duration (min.)
76 80 93 56 74 92
Maximum registered duration (min.)
149 142 143 179 135 152
Average number of sets in the
match
4,1 3,6 4,3 3,4 3,6 4,3
Comment: Gradual increase in match duration for men is not matched by the women – there is a significant upwards spike in match duration in Women’s Volleyball. This is in line with the increased number of sets played on average – the women are now averaging four sets, compared to the 2015 value of 3 sets. Interestingly the Men dipped in 2016 but have since recovered.
Picture of the Game - 2017
FIVB scientific research project 59
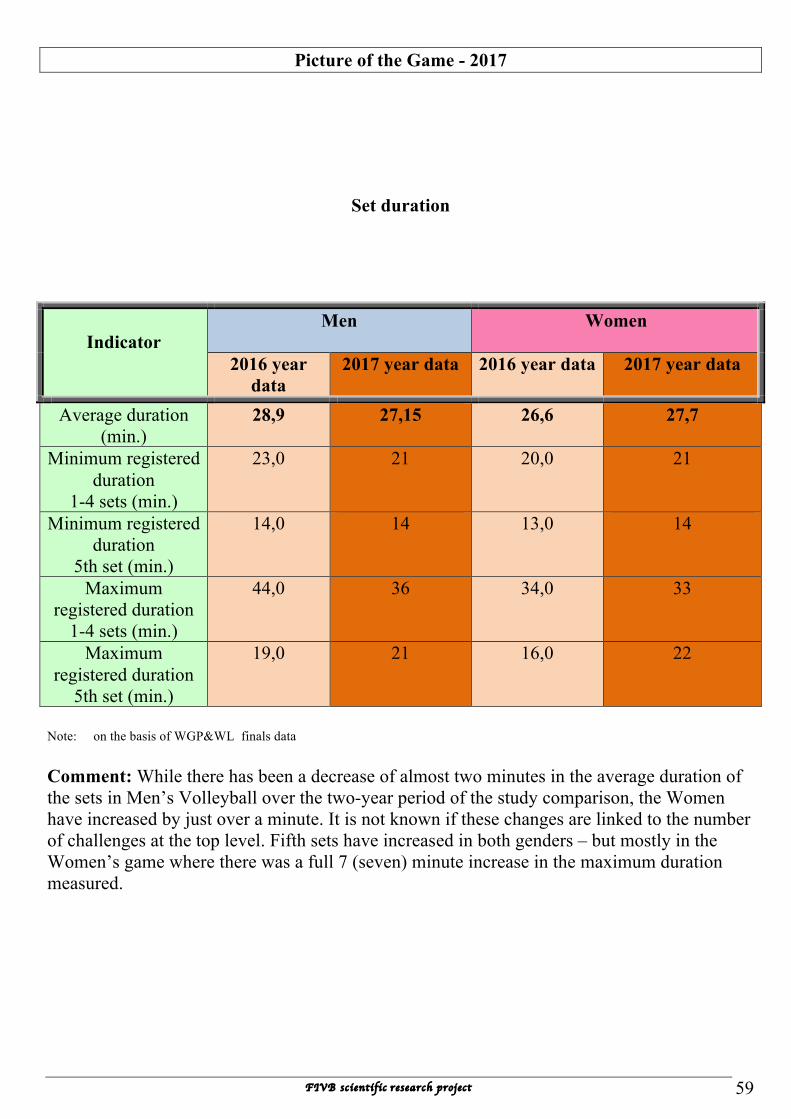
Set duration
Indicator
Men
Women
2016 year data
2017 year data 2016 year data 2017 year data
Average duration (min.)
28,9 27,15 26,6 27,7
Minimum registered duration
1-4 sets (min.)
23,0 21 20,0 21
Minimum registered duration
5th set (min.)
14,0 14 13,0 14
Maximum registered duration
1-4 sets (min.)
44,0 36 34,0 33
Maximum registered duration
5th set (min.)
19,0 21 16,0 22
Note: on the basis of WGP&WL finals data Comment: While there has been a decrease of almost two minutes in the average duration of the sets in Men’s Volleyball over the two-year period of the study comparison, the Women have increased by just over a minute. It is not known if these changes are linked to the number of challenges at the top level. Fifth sets have increased in both genders – but mostly in the Women’s game where there was a full 7 (seven) minute increase in the maximum duration measured.

Picture of the Game - 2017
FIVB scientific research project 60
54%
29%
17% 3 sets match
4 sets match
5 sets match 70% 17%
13% 3 sets match
4 sets match
5 sets match
30%
30%
40%
3 sets match
4 sets match
5 sets match 73% 0%
27% 3 sets match
4 sets match
5 sets match
10%
50%
40%
3 sets match
4 sets match
5 sets match
10%
50%
40%
3 sets match
4 sets match
5 sets match
Sets per match distribution
Men – 2015 Women - 2015
Men – 2016 Women - 2016
Men – 2017 Women - 2017

Picture of the Game - 2017
FIVB scientific research project 61
Comment: While there has been a decrease of almost two minutes in the average duration of the sets in Men’s Volleyball over the two-year period of the study comparison, the Women have increased by just over a minute. It is not known if these changes are linked to the number of challenges at the top level. Fifth sets have increased in both genders – but mostly in the Women’s game where there was a full 7 (seven) minute increase. So to summarise, we see more 3-1 matches in Women’s volleyball than hitherto – which may be due to the qualification process for top events – more strong teams contesting the early rounds can increase the proportion of longer matches. The longer 5th set can mean that both teams contested right to the very end – good for spectator tension! But we should not suggest that this is entirely healthy – we already know that rally length needs to increase to create spectator appeal; and that means increasing the power of the serve and decreasing the stability of reception. This will become even more marked in the next set of data – however, we have no way of evaluating the true impact of testing a modified service rule at the same time as testing a seven-set format.


