29
what is it about government that americans dislike? edited by john r. hibbing University of Nebraska–Lincoln elizabeth theiss - morse University of Nebraska–Lincoln

what is it aboutgovernment that
americans dislike?
edited by
john r. hibbingUniversity of Nebraska–Lincoln
elizabeth theiss-morseUniversity of Nebraska–Lincoln
PUBLISHED BY THE PRESS SYNDICATE OF THE UNIVERSITY OF CAMBRIDGEThe Pitt Building, Trumpington Street, Cambridge, United Kingdom
CAMBRIDGE UNIVERSITY PRESSThe Edinburgh Building, Cambridge cb2 2ru, uk40 West 20th Street, New York, ny 10011-4211, usa10 Stamford Road, Oakleigh, vic 3166, AustraliaRuiz de Alarcón 13, 28014 Madrid, SpainDock House, The Waterfront, Cape Town 8001, South Africa
http://www.cambridge.org
© Cambridge University Press 2001
This book is in copyright. Subject to statutory exceptionand to the provisions of relevant collective licensing agreements,no reproduction of any part may take place withoutthe written permission of Cambridge University Press.
First published 2001
Printed in the United States of America
Typeface Sabon 10/12 pt. System QuarkXPress [bts]
A catalog record for this book is available from the British Library.
Library of Congress Cataloging in Publication data
What is it about government that Americans dislike? / edited by John R. Hibbing, Elizabeth Theiss-Morse.
p. cm.—(Cambridge studies in political psychology and public opinion)Includes bibliographical references and index.ISBN 0-521-79181-2 – ISBN 0-521-79631-8 (pb.)1. Public administration—United States. 2. Public opinion—United States.
3. Political culture—United States. 4. Political psychology. I. Hibbing, John R.II. Theiss-Morse, Elizabeth. III. Series.JK2443.W483 2001320.973–dc21 00-054665
isbn 0 521 79181 2 hardbackisbn 0 521 79631 8 paperback
Contents
Figures page x
Tables xii
Contributors xv
Introduction: Studying the American People’s Attitudes Toward Government 1john r. hibbing and elizabeth theiss-morse
Part I: When Do Americans Tend to Be Dissatisfied with Government?
1. Political Trust Revisited: Déjà Vu All Over Again? 9jack citrin and samantha luks
2. We’re All in This Together: The Decline of Trust in Government, 1958–1996 28john r. alford
3. Were the Halcyon Days Really Golden? An Analysis of Americans’ Attitudes about the Political System, 1945–1965 47stephen earl bennett
4. Public Trust in Government in the Reagan Years and Beyond 59Virginia a. chanley, thomas j. rudolph, and wendy m. rahn
vii
Part II: With Which Governmental Institutions Do AmericansTend to Be Dissatisfied?
5. Public Confidence in the Leaders of American Governmental Institutions 83lilliard e. richardson, jr., david j. houston, and chris sissie hadjiharalambous
6. Linking Presidential and Congressional Approval During Unified and Divided Governments 98jeffrey l. bernstein
7. Is Washington Really the Problem? 118eric m. uslaner
8. Explaining Public Support for Devolution: The Role of Political Trust 134marc j. hetherington and john d. nugent
Part III: Do Actions on the Part of Politicians CauseAmericans to Be Dissatisfied with Government?
9. On Red Capes and Charging Bulls: How and Why Conservative Politicians and Interest Groups Promoted Public Anger 157amy fried and douglas b. harris
10. A Reassessment of Who’s to Blame: A Positive Case for the Public Evaluation of Congress 175david w. brady and sean m. theriault
11. Process Performance: Public Reaction to Legislative Policy Debate 193carolyn l. funk
Part IV: How Is Dissatisfaction with Government Measuredand Incorporated into Political Theory?
12. Trust in Federal Government: The Phenomenon and Its Antecedents 209diana owen and jack dennis
13. The Psychology of Public Dissatisfaction with Government 227tom r. tyler
Contents
viii
14. The Means Is the End 243john r. hibbing and elizabeth theiss-morse
References 251
Index 271
Contents
ix
x
Figures
2.1. Trust Government in Washington to Do What Is Right page 31
2.2. Trust Government in Washington Most or All of the Time 31
2.3. Trust Government in Washington Most or All of the Time by Race 34
2.4. Trust Government in Washington Most or All of the Time by Education 35
2.5. Trust Government in Washington Most or All of the Time by Age 36
2.6. Trust Government in Washington Most or All of the Time by Income 37
2.7. Trust Government in Washington Most or All of the Time by Party Identification 40
2.8. Trust Government in Washington Most or All of the Time by Ideology 41
2.9. Trust and Proportion Citing Foreign Affairs or Defense as the Number One Problem 46
4.1. Government Trust, Responsiveness, and Confidence, 1980:1 to 1997:4 63
9.1. The Ideological Confidence Gap, 1982–94 167
13.1. The Impact of Experience on the Evaluation of Legal Authorities 234
xi
Figures
13.2. Influences on Judgments About the Fairness of a Legal Procedure 238
13.3. Aspects of Experience Influencing Performance Evaluations and Legitimacy 239
13.4. Competence and Benevolence as Antecedents of Evaluation 241
xii
Tables
1.1. Trends in Political Trust, 1964–96 page 15
1.2. Correlations Between Political Trust and Approval Ratings 18
1.3. Correlation Coefficients Between Presidential Approval and Congressional Approval by Political Awareness 19
1.4. Explaining Political Trust 21
3.1. Americans’ Trust in Government, 1958 and 1964 54
4.1. F-Tests of Blocks of Coefficients 70
4.2. VAR Results 72
5.1. Logit Results for Confidence in Legislative Leaders 92
5.2. Logit Results for Confidence in Executive Branch Leaders 94
5.3. Logit Results for Confidence in Judicial Leaders 95
6.1. Models of Legislative Approval, Divided and Unified Governments 109
6.2. Correlation Between Congressional and Presidential Approval, Controlling for Strength of Partisanship, 1990 111
6.3. Correlation Between Congressional and Presidential Approval, Controlling for Cynicism, 1990 112
6.4. Correlation Between Congressional and Presidential Approval, Controlling for Political Knowledge, 1990 113
6.5. Correlation Between Congressional and Presidential Approval, Controlling for Strength of Partisanship and Political Knowledge, 1990 114
6.6. Correlation Between Congressional and Presidential Approval, Controlling for Cynicism and Political Knowledge, 1990 114
7.1. Regression Estimates for Preference for State or Federal Government 124
7.2. Regression Estimates for Trust in Levels of Government 126
7.3. Regression Analysis of Trust in State Government by Party Identification 131
8.1. Descriptive Statistics for Explanatory Variables 144
8.2. Proportion of People Identifying Federal and State Government as the Level They Have the Most Faith in, by State Law, Efficiency of State Government, and State Fiscal Capacity, 1996 144
8.3. Whether Respondent Identifies Federal Government as the One in Which He or She Has the Most Confidence (Logistic Regression Estimates) 146
10.1. Explaining the Public’s Disapproval of Congress 186
10.2. Who Gets Media Coverage? A Multivariate Regression Answer 190
11.1. OLS Regression Estimates of Negative Affect in Response to Congressional Debate 201
11.2. Mean Response to Debate Conditions by Individual Differences in Conflict Avoidance on Index of Negative Affect 202
12.1. Multiple Regression Analysis (OLS) of Institutional Support 220
13.1. The Role of Procedural Justice in Shaping Evaluations of the Legitimacy of the Supreme Court 235
13.2. The Role of Procedural Justice in Shaping Evaluations of Congress 236
xiii
Tables

13.3. Elements of Fair Decision-Making Procedures: The Supreme Court 239
13.4. Elements of Fair Decision-Making Procedures: Congress 240
xiv
Tables

1
Political Trust Revisited: Déjà Vu All Over Again?
jack citrin and samantha luks
9
A good politician is quite as unthinkable as an honest burglar.—H. L. Mencken
introduction1
Trust, once again, is the word on everyone’s lips. In the early 1990s, pollsrecorded a new decline in confidence in America’s politicians and government institutions (Lipset 1995; Nye 1997). To many observers(Burnham 1997; Tolchin 1996), the electoral tremor of 1994 expressedfeelings of deep anger that subsequent partisan bickering and legislativegridlock would surely reinforce. Good economic times seemed to stopthe rot in trust, but with Bill Clinton’s travails, Cassandra-like predic-tions abounded about how a new rise in cynicism toward politics wouldaffect the capacity to govern (Apple 1998).
Such worries are not new, of course. Domestic turmoil in the late1960s and early 1970s fueled similar anxieties about “the alienatedvoter” (Schwartz 1973), confidence “gaps” (Lipset and Schneider 1987),and a “crisis of competence” (Sundquist 1980). These convulsive eventsalso spawned empirical research into the causes and significance of polit-ical trust (Miller 1974a; Citrin 1974; Citrin et al. 1975; Wright 1976;Hart 1978; Craig 1993). While no one disputed that confidence in gov-ernment had declined after 1964, the meaning of this trend was con-troversial from the outset (Miller 1974a; Citrin 1974). The so-calledMiller–Citrin debate (1974) centered on two issues: (1) Whether the dropin trust recorded by the American National Election Studies (ANES) signified a growing rejection of the political regime, in Easton’s
1 An earlier version of this chapter, titled “Revisiting Political Trust in an AngryAge,” was presented at the 1997 Annual Meeting of the Midwest Political ScienceAssociation.
(1965b) sense of the term (Miller), or just more dissatisfaction withincumbent authorities (Citrin); and (2) Whether the main source of risingmistrust was disapproval of the policies of both main parties (Miller) orunhappiness with the performance of the sitting national administration(Citrin).
The recent oscillations in the public’s outlook—the loss of trustbetween 1988 and 1994 and the upward bounce between 1994 and1996—thus provide an opportunity to reconsider these conflicting inter-pretations and to formulate a unifying account of the entire pattern ofchange. The present inquiry explores continuity and change in the foun-dations of political trust and cynicism by analyzing the ANES surveysfrom 1964 to 1996 and the 1992–94–96 Panel Study.2 We begin by com-menting on the literature concerning the meaning of political trust. Next,we propose and test a modified version of the model proposed by Citrinand Green (1986) to explain cross-sectional variations in trust between1980 and 1996. The principal modification is to incorporate attitudestoward Congress as a predictor. This provides a more comprehensiveassessment of the influence of performance evaluations and helps iden-tify the effects of changes in the political as well as the economic contexton the institutional focus of mistrust.
support for the system or trust in incumbents?
This argument about the “object” of the conventional trust in govern-ment measures seems settled (Norris 1998; Craig 1993). Easton (1965b)assumed that support for the regime would be more enduring and per-vasive than support for incumbent authorities or their policies. He alsomaintained that the implications of an erosion of support would varydepending on the level of the system. The concept of regime refers to thepolity’s core principles and values and to its operating rules. Yet the itemsmaking up the standard survey indicators of political trust and confi-dence explicitly ask about the “government in Washington,” “adminis-trators,” or the “people running” the government or a particular branchof it. Many Americans who give cynical responses to these items never-theless express pride for “our system of government” (Citrin 1974;Lipset 1995). Additional evidence that these questions stimulate opin-ions about incumbents is that Republicans consistently are more trust-ing than Democrats when their party occupies the White House, and viceversa (Pew Research Center 1998; Luks and Citrin 1997). Finally,
J. Citrin and S. Luks
10
2 These data were obtained from the InterUniversity Consortium for Political andSocial Research and UC DATA, Survey Research Center, University of California,Berkeley.

between 1980 and 1986, favorable beliefs about the incumbent presi-dent’s performance and character along with an improved economy trig-gered an across-the-board rise in trust (Citrin and Green 1986). Moregenerally, the trend in political trust closely tracks changes in the nationalmood, as indicated by questions about whether or not the country is “onthe right track” (Pew Research Center 1998). From Easton’s theoreticalperspective, the fluctuating impact of short-run events is seen as fallingmore heavily on evaluations of current office-holders than on supportfor the political regime as a whole (Norris 1998).
At a minimum, the ANES trust index fails to discriminate between“alienated” cynics, who truly reject the political system, and “perfor-mance” or “partisan” cynics, who merely dislike the party in power, the incumbent president, or current government policies. But it seemsclear that the latter group is the more numerous. For one thing, to saythat one can trust the government to do what is right “only some of the time” hardly bespeaks a desire to transform existing processes orinstitutions.
On the other hand, political trust and presidential popularity are notidentical. Many who approve of the president express mistrust of government “in general;” there is no evidence that trust soared whenGeorge Bush’s approval rating reached 91 percent just after the Gulf War.One explanation for the sluggishness in political trust is that a compo-nent of people’s responses to the usual measures is a “ritualistic” disdainfor politicians as a class (Citrin 1974). Another is that “the governmentin Washington” means more than just the president, so his short-runsuccess need not mitigate disapproval of how other institutions, such asCongress, are performing. And to the extent that mistrust reflects a per-ceived gap between democratic values and entrenched practices, the persistence of low levels when presidential approval climbs arguablyindicates that there has been some loss of support for regime processes(Norris 1998).
Upon reflection, the debate between Miller and Citrin probably posedtoo stark a distinction between support for the political system and trustin the government of the day. It is not simply that these attitudes areempirically interrelated, even in a stable regime like the United States(Citrin et al. 1975). In addition, both concepts have multiple referents.For example, the desire to reform the two-party system is a criticism atthe regime level, even if it does extend to rejection of other institutionalarrangements. Similarly, in the American political system, the key incum-bents include both executive and legislative actors. Citrin and Green(1986) argue that feelings about the president drive changes in the levelof political trust in part because the presidency dominates news coverage of current politics (Graber 1997). However, they do not
Political Trust Revisited
11
explicitly consider the role of attitudes toward Congress, which Feldman(1983) concludes is the cognitive focus of the ANES trust in governmentquestions.
Since “the government in Washington” encompasses both president andCongress, the specific actors whose conduct provokes one’s overall levelof political trust may vary across individuals or time. Hibbing and Theiss-Morse (1995) argue that the public does make distinctions in how theyevaluate individual institutions. Furthermore, divergent attitudes towardthe president and Congress may be more prevalent in a period of dividedgovernment. These considerations prompt our attention to how the polit-ical context may condition the relative influence of feelings about presi-dent and Congress on one’s overall sense of trust in government.
If many streams flow in (or out) of the reservoir of political trust, thenwhether feelings about the president or about Congress have the heavierimpact should depend on how people allocate responsibility for nationalsuccesses or failures. In other words, reactions to events, doubtless medi-ated by news coverage, may determine the institutional focus of politi-cal trust as well as its overall level. For example, it is plausible thatcongressional scandals and follies, including the abortive effort at a payraise, widespread check kiting, and misuse of campaign funds, con-tributed to the rise in cynicism between 1990 and 1992.
Whatever the institutional focus of mistrust at any given time, the par-ticular aspect of either presidential or congressional conduct that elicitspublic disaffection is another significant empirical question. For example,is it perceptions of the president’s perceived job performance, policies,or personal character that most strongly influence overall feelings of trustin government? Disentangling the relative influences of these beliefs iscomplicated, since they are inevitably interrelated. Politicians use state-ments about policy to convey messages about their personal qualities, sosomeone who approves of the administration’s generous attitude towardthe poor is likely to view the president as compassionate. Similarly,approval of a forceful foreign policy should reinforce beliefs that thepresident is a strong leader. Competence and integrity generally are citedas critical for favorable assessment of political institutions and leaders,but, as the trajectory of opinion toward President Clinton indicates, pos-itive ratings on these traits do not always go together. Thus, in this analy-sis, we shall explore how the political and economic context may affectthe chosen criteria for assessing the government’s trustworthiness.
hypotheses, data, and method
Trust refers to expectations of future behavior and is based on beliefsabout the trustee’s competence and sense of fiduciary responsibility
J. Citrin and S. Luks
12
(Barber 1983). Accordingly, one can conceive of mistrust as resultingfrom a gap between expectations and perceived outcomes. Orren (1997)distinguishes between long-term influences on mistrust, such as the suspicion of power endemic to American political culture and the lack of deference to authority that comes with modernization, and short-run influences, such as national conditions, evaluations of the government’s performance, dissatisfaction with policy, and media cover-age of scandals and government corruption. The explanation developedhere focuses on the role of the more immediate political factors. Ourspecial concern is the stability, at the theoretical level, of the causes ofpolitical trust. We ask whether the same factors explain trust when theaggregate level is rising as when it is falling, when a Democrat is presi-dent as when a Republican, and when government is unified as when itis divided.
Our starting point is the model of political trust proposed by Citrinand Green (1986). They emphasize the role of presidential leadership andevaluations of the nation’s economy in causing the rise in trust duringthe early 1980s. Our expectation is that these factors remain significantin the 1990s too. However, we modify the Citrin–Green account to con-sider the influence of evaluations of congressional performance. Since thecognitive association of Congress and “the government in Washington”is natural, satisfaction with this institution also should predict politicaltrust.
The biennial ANES data make it possible to track changes in the focusof popular discontent. The nature of the political environment and theflow of information about current reality should affect which institutionsand what specific aspects of their behavior are salient when respondentsare asked about their overall level of trust in government as a whole. Forexample, news about corruption in government may concentrate onmembers of Congress. If “priming” effects are potent (Iyengar andKinder 1987), then when one asks about trust in government, wide-spread exposure to this information should result in a stronger causalinfluence for attitudes toward Congress as opposed to feelings about theincumbent president. In Zaller’s (1992) terms, the accessibility of storedinformation about Congress will make it an important consideration informing opinions about the government’s trustworthiness.
Turning to methodological issues, the data we analyze are the ANESsurveys. In tracking aggregate trends, we start with the 1964 electionstudy. The multivariate analysis begins with the 1980 survey, however,because the earlier surveys did not include measures of key explanatoryvariables such as presidential character and attitudes toward Congress.We follow Citrin and Green (1986) in using a two-item version of theTrust in Government Index rather than the five-item measure previously
Political Trust Revisited
13
used by Miller (1974a) and Citrin (1974). The truncated measure simplysums responses to the questions “How much of the time do you thinkthat the government in Washington can be trusted to do what is right?”and “Would you say that the government is pretty much run by a fewbig interests looking out for themselves or that it is run for the benefitof all people?”3 Finally, in reporting trends in trust we employ thesummary Percentage Difference Index, which is computed by subtract-ing the proportion of cynics (two cynical responses) from trusting (twotrusting answers) respondents in each designated group. In estimatingthe multivariate model of trust in government, we use ordinary leastsquares regression.
social and political contours of change inpolitical trust
The “Reagan recovery” in political trust ended during his second term,due in part to the corrosive effects of the Iran-Contra revelations (Krosnick and Kinder 1990; Citrin, Green, and Reingold 1987). Trustcontinued to crumble through the Bush presidency. The decline was var-iously attributed to the bickering and gridlock characteristic of dividedgovernment, the deteriorating economy, Bush’s lack of charisma whencompared to his predecessor, and congressional scandals. The 1992 elec-tion brought unified government, but no end to gridlock, investigationsof official malfeasance, or economic anxiety. President Clinton’s first twoyears in office witnessed another upsurge in mistrust, with scores on theANES index reaching their nadir in 1994. Just as in 1984, sustained eco-nomic growth and increased presidential popularity produced a rise intrust between 1994 and 1996.
Table 1.1 compares the trend in political trust among major social andpolitical groups. These data have theoretical relevance in that the patternof social cleavages is a clue to the motivational basis of mistrust. Forexample, if rich and poor or black and white move in opposite direc-tions, an implication is that ideological disagreement over distributionalissues are salient. On the other hand, if most groups move in the samedirection, it is more likely that perceptions of performance on “valence”
J. Citrin and S. Luks
14
3 The resultant three-point index clearly is highly correlated with the earlier, longermeasure. Citrin and Green initially employed the truncated version because some ofthe other items were not included in the surveys they analyzed. In addition, the itemsabout “wasting our tax money” and “crooked administrators” omitted from theshort version have a ritualistic flavor and somewhat different objects that on theirface are more specific and less “regime-like.” In addition, replication of the analysisusing the longer version of the trust in government index does not affect the results.
15
(continued)
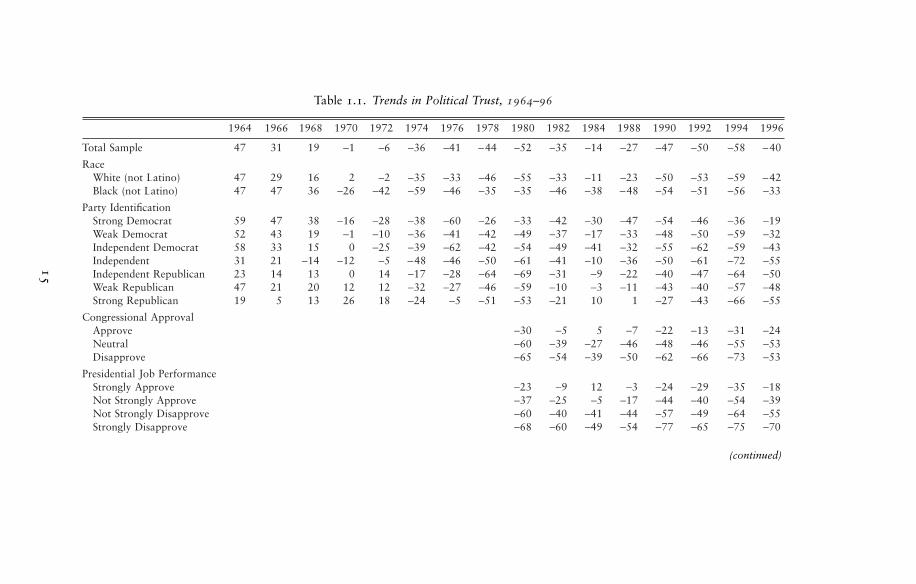
Table 1.1. Trends in Political Trust, 1964–96
1964 1966 1968 1970 1972 1974 1976 1978 1980 1982 1984 1988 1990 1992 1994 1996
Total Sample 47 31 19 -1 -6 -36 -41 -44 -52 -35 -14 -27 -47 -50 -58 -40
RaceWhite (not Latino) 47 29 16 2 -2 -35 -33 -46 -55 -33 -11 -23 -50 -53 -59 -42Black (not Latino) 47 47 36 -26 -42 -59 -46 -35 -35 -46 -38 -48 -54 -51 -56 -33
Party IdentificationStrong Democrat 59 47 38 -16 -28 -38 -60 -26 -33 -42 -30 -47 -54 -46 -36 -19Weak Democrat 52 43 19 -1 -10 -36 -41 -42 -49 -37 -17 -33 -48 -50 -59 -32Independent Democrat 58 33 15 0 -25 -39 -62 -42 -54 -49 -41 -32 -55 -62 -59 -43Independent 31 21 -14 -12 -5 -48 -46 -50 -61 -41 -10 -36 -50 -61 -72 -55Independent Republican 23 14 13 0 14 -17 -28 -64 -69 -31 -9 -22 -40 -47 -64 -50Weak Republican 47 21 20 12 12 -32 -27 -46 -59 -10 -3 -11 -43 -40 -57 -48Strong Republican 19 5 13 26 18 -24 -5 -51 -53 -21 10 1 -27 -43 -66 -55
Congressional ApprovalApprove -30 -5 5 -7 -22 -13 -31 -24Neutral -60 -39 -27 -46 -48 -46 -55 -53Disapprove -65 -54 -39 -50 -62 -66 -73 -53
Presidential Job PerformanceStrongly Approve -23 -9 12 -3 -24 -29 -35 -18Not Strongly Approve -37 -25 -5 -17 -44 -40 -54 -39Not Strongly Disapprove -60 -40 -41 -44 -57 -49 -64 -55Strongly Disapprove -68 -60 -49 -54 -77 -65 -75 -70

16
Table 1.1 (continued)
1964 1966 1968 1970 1972 1974 1976 1978 1980 1982 1984 1988 1990 1992 1994 1996
Personal Financial SituationCompared to Last Year
Better 44 30 9 -2 -31 -28 -30 -45 -20 1 -15 -36 -40 -51 -30Same 30 16 -4 -6 -36 -44 -47 -48 -33 -19 -29 -53 -50 -59 -43Worse 13 6 -3 -28 -41 -51 -56 -61 -47 -32 -44 -55 -57 -67 -53
Affect Toward Major PartiesPositive–Positive 48 43 29 -12 -17 -46 -12 14 -9 -17 -25 -44 -20Positive–Neutral 61 27 4 -25 -36 -43 -23 -6 -20 -18 -35 -38 -27Positive–Negative 46 18 -11 -44 945 -52 -42 -25 -30 -63 -54 -62 -43Neutral–Neutral 52 18 -1 -36 -42 -52 -26 -4 -29 -45 -44 -56 -32Negative–Neutral 36 8 -33 -51 -57 -62 -49 -27 -27 -63 -64 -70 -49Negative–Negative 0 12 -32 -69 -75 -77 -49 -45 -46 -77 -66 -84 -70
Note: Entries are percentage difference index scores: the percentage of respondents giving two trusting responses to the trust government and big inter-est items, minus the percentage giving two cynical responses.Source: American National Election Studies.
questions such as peace and prosperity are motivating responses abouttrusting the government.
Our results support the latter interpretation. Just as in earlier decades,the recent data find few demographic fault-lines in the public’s outlook.The decline in trust after 1986 was an across-the-board phenomenon(Alford, this volume; Pew Research Center 1998). Blacks and whites,men and women, young and old, rich and poor consistently moved inthe same direction. Table 1.1, however, also points to the influence ofsupport for the incumbent president on trust in government. During the Reagan-Bush years, whites expressed more trust than blacks; withClinton in office, the opposite is true.
The evidence of strong period effects in Table 1.1 indicates that what-ever one’s party affiliation or ideological identification, one swims withthe cynical (or trusting) tide. For example, both strong Democrats andstrong Republicans became more trusting between 1994 and 1996. Butthere is also a partisan component in changing attitudes. All groupsbecame more trusting during Reagan’s first term, but the largest shifttook place among Republican identifiers. With Clinton in the WhiteHouse, Democrats changed the most. Nevertheless, we do find thatrespondents who are negative about both major parties tend to be morecynical than any other group, including those who like the “ins” anddislike the “outs.”4
Table 1.1 also supports earlier findings about the significance of eco-nomic conditions in influencing the level of trust in government (Citrinand Green 1986; House and Mason 1975). In the 1990s, as earlier,people whose financial situations are improving express more politicaltrust than those whose circumstances are worsening. Interestingly, thisrelationship seemed relatively weak in 1994, perhaps because economicissues were less salient during an election dominated by the Republicanattack on the size and ineffectiveness of the federal government.
president and congress?
The bivariate relationships reported in Table 1.1 also show that approvalof how both the president and Congress are doing is associated con-sistently with generalized feelings of political trust. This relationship persists in the 1990s, when the level of public approval of Congressdropped sharply. Moreover, as shown in Table 1.2, the size of the correlations between trust in government scores and approval of the
Political Trust Revisited
17
4 This analysis was based on Wattenberg’s (1996) technique of summing the numberof “likes” and “dislikes” expressed in open-ended responses about the Democra-tic and Republican parties (Luks and Citrin 1997).
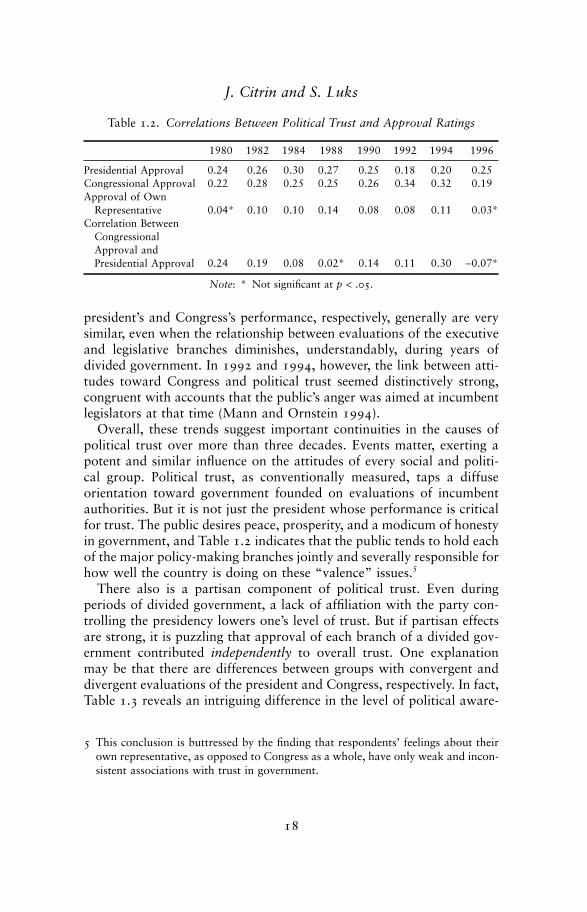
president’s and Congress’s performance, respectively, generally are verysimilar, even when the relationship between evaluations of the executiveand legislative branches diminishes, understandably, during years ofdivided government. In 1992 and 1994, however, the link between atti-tudes toward Congress and political trust seemed distinctively strong,congruent with accounts that the public’s anger was aimed at incumbentlegislators at that time (Mann and Ornstein 1994).
Overall, these trends suggest important continuities in the causes ofpolitical trust over more than three decades. Events matter, exerting apotent and similar influence on the attitudes of every social and politi-cal group. Political trust, as conventionally measured, taps a diffuse orientation toward government founded on evaluations of incumbentauthorities. But it is not just the president whose performance is criticalfor trust. The public desires peace, prosperity, and a modicum of honestyin government, and Table 1.2 indicates that the public tends to hold eachof the major policy-making branches jointly and severally responsible forhow well the country is doing on these “valence” issues.5
There also is a partisan component of political trust. Even duringperiods of divided government, a lack of affiliation with the party con-trolling the presidency lowers one’s level of trust. But if partisan effectsare strong, it is puzzling that approval of each branch of a divided gov-ernment contributed independently to overall trust. One explanationmay be that there are differences between groups with convergent anddivergent evaluations of the president and Congress, respectively. In fact,Table 1.3 reveals an intriguing difference in the level of political aware-
J. Citrin and S. Luks
18
5 This conclusion is buttressed by the finding that respondents’ feelings about theirown representative, as opposed to Congress as a whole, have only weak and incon-sistent associations with trust in government.
Table 1.2. Correlations Between Political Trust and Approval Ratings
1980 1982 1984 1988 1990 1992 1994 1996
Presidential Approval 0.24 0.26 0.30 0.27 0.25 0.18 0.20 0.25Congressional Approval 0.22 0.28 0.25 0.25 0.26 0.34 0.32 0.19Approval of Own
Representative 0.04* 0.10 0.10 0.14 0.08 0.08 0.11 0.03*Correlation Between
Congressional Approval and Presidential Approval 0.24 0.19 0.08 0.02* 0.14 0.11 0.30 -0.07*
Note: * Not significant at p < .05.
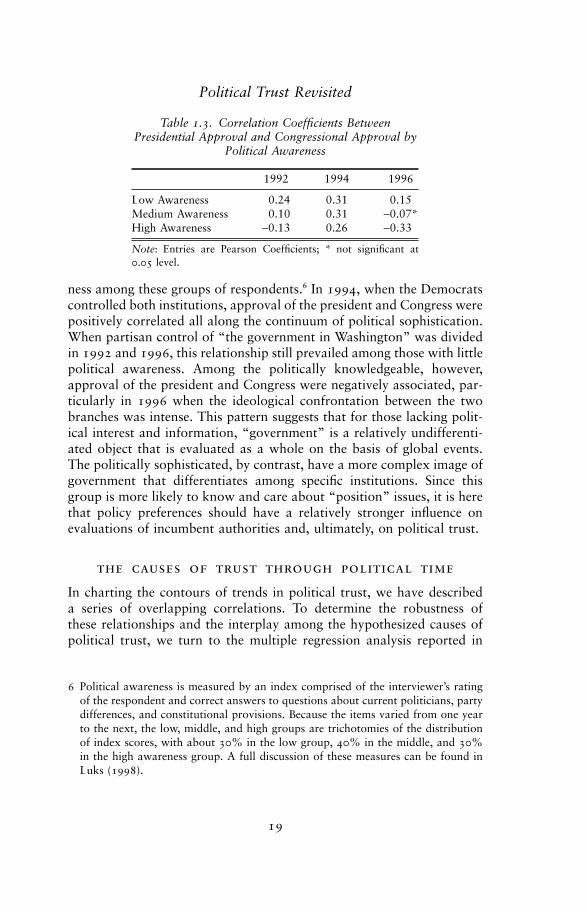
ness among these groups of respondents.6 In 1994, when the Democratscontrolled both institutions, approval of the president and Congress werepositively correlated all along the continuum of political sophistication.When partisan control of “the government in Washington” was dividedin 1992 and 1996, this relationship still prevailed among those with littlepolitical awareness. Among the politically knowledgeable, however,approval of the president and Congress were negatively associated, par-ticularly in 1996 when the ideological confrontation between the twobranches was intense. This pattern suggests that for those lacking polit-ical interest and information, “government” is a relatively undifferenti-ated object that is evaluated as a whole on the basis of global events.The politically sophisticated, by contrast, have a more complex image ofgovernment that differentiates among specific institutions. Since thisgroup is more likely to know and care about “position” issues, it is herethat policy preferences should have a relatively stronger influence onevaluations of incumbent authorities and, ultimately, on political trust.
the causes of trust through political time
In charting the contours of trends in political trust, we have described a series of overlapping correlations. To determine the robustness of these relationships and the interplay among the hypothesized causes ofpolitical trust, we turn to the multiple regression analysis reported in
Political Trust Revisited
19
6 Political awareness is measured by an index comprised of the interviewer’s ratingof the respondent and correct answers to questions about current politicians, partydifferences, and constitutional provisions. Because the items varied from one yearto the next, the low, middle, and high groups are trichotomies of the distributionof index scores, with about 30% in the low group, 40% in the middle, and 30%in the high awareness group. A full discussion of these measures can be found inLuks (1998).
Table 1.3. Correlation Coefficients BetweenPresidential Approval and Congressional Approval by
Political Awareness
1992 1994 1996
Low Awareness 0.24 0.31 0.15Medium Awareness 0.10 0.31 -0.07*High Awareness -0.13 0.26 -0.33
Note: Entries are Pearson Coefficients; * not significant at0.05 level.
Table 1.4.7 The model estimated revises the Citrin and Green (1986)equation by adding the respondent’s approval of Congress as a predictedvariable and by coding age as a series of categorical variables. Feldman(1983) maintains that trust in government reflects evaluations of insti-tutions (such as Congress) more than reactions to individual leaders(such as the president). Yet the capacity of the average citizen to makethe distinction between institution and incumbent is an open question.In any event, since neither feelings about the presidency as an institutionnor approval of specific congressional leaders are measured, this hypoth-esis cannot be tested directly.8
The main finding of Table 1.4 is continuity in the underpinnings ofpolitical trust. Whether a Republican or Democrat is president, whetherthere is unified or divided partisan control of national government, andwhether times are good or bad, the underlying structure of causality isessentially the same. As one would predict, the effects of demographicgroup membership on political trust generally are mediated by the influ-ences of political predispositions or beliefs about presidential or con-gressional performance. More significantly, the causal influences of bothparty affiliation and ideological orientation also are explained by theintervening role of approval of incumbent authorities.
The inclusion of evaluations of Congress as a predictor does not alterthe finding that both the president’s job performance and his personalimage significantly affect trust in government (Citrin and Green 1986).Table 1.4 also shows that economic judgments retain a significant inde-pendent effect on political trust in the full model, even after we con-trolled for the impact of beliefs about the performance of incumbentauthorities. The model includes both reports about one’s own and thenation’s economic situation as predictors; in every year, one or both ofthese interrelated indicators has a significant causal influence. Finally,these data confirm the speculation that approval of Congress has aninfluence on political trust, independent of how one evaluates the presi-dent, and that the relative causal impact of these feelings is roughly thesame.9
J. Citrin and S. Luks
20
7 The table reports results for the presidential election years of 1980, 1984, 1988,1992, and 1996. The surveys before 1980 did not include questions about approvalof presidential or congressional performance. In addition, we include the off-year1994 study because of our interest in assessing the contextual influence of eventsfocusing on the performance of Congress.
8 When the question about how respondents evaluate their own member of Con-gress is added as a predictor, this variable fails to achieve a statistically significanteffect on trust in government.
9 The presidential approval variable is scaled from 1 to 5, whereas approval of con-gress is scaled from 1 to 3, making the magnitude of its unstandardized regression
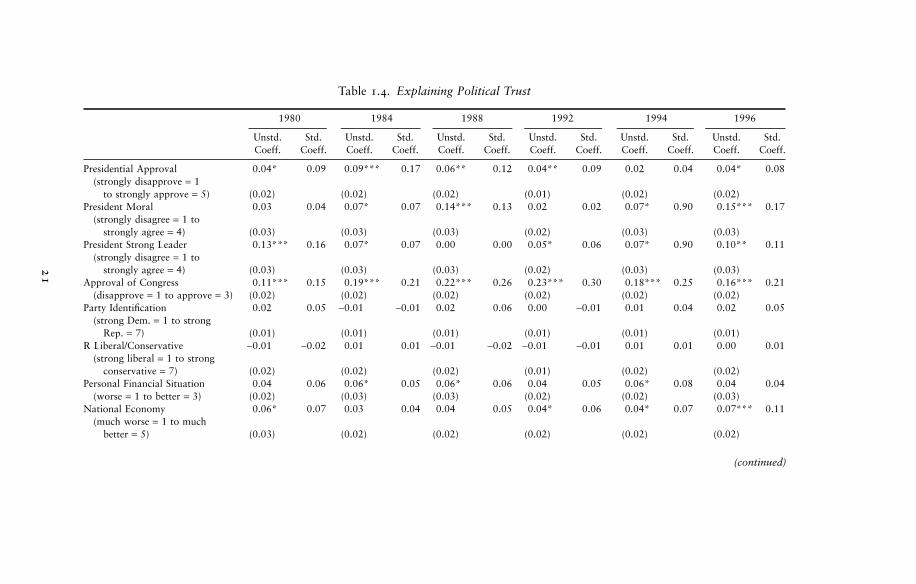
Table 1.4. Explaining Political Trust
1980 1984 1988 1992 1994 1996
Unstd. Std. Unstd. Std. Unstd. Std. Unstd. Std. Unstd. Std. Unstd. Std.Coeff. Coeff. Coeff. Coeff. Coeff. Coeff. Coeff. Coeff. Coeff. Coeff. Coeff. Coeff.
Presidential Approval 0.04* 0.09 0.09*** 0.17 0.06** 0.12 0.04** 0.09 0.02 0.04 0.04* 0.08(strongly disapprove = 1
to strongly approve = 5) (0.02) (0.02) (0.02) (0.01) (0.02) (0.02)President Moral 0.03 0.04 0.07* 0.07 0.14*** 0.13 0.02 0.02 0.07* 0.90 0.15*** 0.17
(strongly disagree = 1 to strongly agree = 4) (0.03) (0.03) (0.03) (0.02) (0.03) (0.03)
President Strong Leader 0.13*** 0.16 0.07* 0.07 0.00 0.00 0.05* 0.06 0.07* 0.90 0.10** 0.11(strongly disagree = 1 to
strongly agree = 4) (0.03) (0.03) (0.03) (0.02) (0.03) (0.03)Approval of Congress 0.11*** 0.15 0.19*** 0.21 0.22*** 0.26 0.23*** 0.30 0.18*** 0.25 0.16*** 0.21
(disapprove = 1 to approve = 3) (0.02) (0.02) (0.02) (0.02) (0.02) (0.02)Party Identification 0.02 0.05 -0.01 -0.01 0.02 0.06 0.00 -0.01 0.01 0.04 0.02 0.05
(strong Dem. = 1 to strong Rep. = 7) (0.01) (0.01) (0.01) (0.01) (0.01) (0.01)
R Liberal/Conservative -0.01 -0.02 0.01 0.01 -0.01 -0.02 -0.01 -0.01 0.01 0.01 0.00 0.01(strong liberal = 1 to strong
conservative = 7) (0.02) (0.02) (0.02) (0.01) (0.02) (0.02)Personal Financial Situation 0.04 0.06 0.06* 0.05 0.06* 0.06 0.04 0.05 0.06* 0.08 0.04 0.04
(worse = 1 to better = 3) (0.02) (0.03) (0.03) (0.02) (0.02) (0.03)National Economy 0.06* 0.07 0.03 0.04 0.04 0.05 0.04* 0.06 0.04* 0.07 0.07*** 0.11
(much worse = 1 to much better = 5) (0.03) (0.02) (0.02) (0.02) (0.02) (0.02)
(continued)
21

22
Table 1.4 (continued)
1980 1984 1988 1992 1994 1996
Unstd. Std. Unstd. Std. Unstd. Std. Unstd. Std. Unstd. Std. Unstd. Std.Coeff. Coeff. Coeff. Coeff. Coeff. Coeff. Coeff. Coeff. Coeff. Coeff. Coeff. Coeff.
Age17–29 -0.03 -0.02 0.02 0.01 0.01 0.00 0.11* 0.06 -0.17** -0.11 -0.03 -0.01
(0.06) (0.07) (0.06) (0.05) (0.06) (0.07)30–44 0.04 0.02 0.01 0.00 -0.13* -0.08 0.05 0.03 -0.12* -0.09 0.03 0.02
(0.07) (0.06) (0.06) (0.04) (0.05) (0.06)45–59 -0.12 -0.07 0.03 0.01 0.03 0.02 0.07 0.04 -0.08 -0.05 0.14* 0.08
(0.07) (0.07) (0.06) (0.05) (0.06) (0.06)Female -0.08* -0.06 0.09* 0.06 -0.04 -0.02 0.02 0.02 0.02 0.01 -0.05 -0.03
(0.04) (0.04) (0.04) (0.03) (0.04) (0.04)Nonwhite 0.03 0.02 -0.03 -0.01 -0.09 -0.04 0.01 0.00 -0.13* -0.06 -0.07 -0.03
(0.07) (0.07) (0.06) (0.05) (0.06) (0.06)Non-South 0.00 0.00 -0.06 -0.04 0.03 0.02 -0.01 -0.01 0.09* 0.06 -0.07 -0.04
(0.05) (0.05) (0.04) (0.03) (0.04) (0.04)Education 0.02 0.03 0.02 0.03 0.04* 0.06 0.00 0.00 0.00 0.00 0.02 0.03
(low = 1 to high = 5) (0.02) (0.02) (0.02) (0.02) (0.02) (0.02)Income 0.00 -0.01 -0.02 -0.02 0.05* 0.06 -0.02 -0.03 -0.02 -0.03 -0.02 -0.03
(low = 1 to high = 5) (0.02) (0.02) (0.02) (0.02) (0.02) (0.02)Constant 0.60 0.48 0.17 0.67 0.55 0.20
(0.17) (0.15) (0.15) (0.12) (0.17) (0.18)R-squared 0.10 0.15 0.18 0.14 0.13 0.14N 1,002 1,403 1,350 1,790 1,102 1,292
Note: Entries are unstandardized and standardized OLS coefficients; standard errors in parentheses. * p < .05. ** p < .01. *** p < .001.Source: American National Election Studies.

Political Trust Revisited
23
The increased influence of the approval of Congress variable in the1992 and 1994 data supports our contention that events channel atten-tion to the trustworthiness of specific institutions. The political contextalso may influence which dimensions of presidential character inspiretrust. Citrin and Green (1986) hypothesized that during periods of crisisand national pessimism, the public craves direction and strong leader-ship. Table 1.4 shows that in the 1988, 1994, and 1996 surveys, thebelief that the president was moral was a strong influence on trust ingovernment. In 1992, however, no such relationship emerged, but theimage of the president as a strong leader did matter. We speculate, there-fore, that while scandals such as Iran-Contra or Whitewater may primepeople to tie confidence in government to their leader’s integrity, whenthe state of the economy is the most salient political issue, trust is basedmore strongly on perceptions of the president’s competence than hismoral rectitude.
discussion
We have revisited earlier debates about the meaning of political trust byexamining public opinion in the early 1990s when the nation’s dominantmood seemed angry and disillusioned. Deja vu. Now, as before, dis-satisfaction with the state of the nation, filtered through evaluations ofincumbent authorities, underpins a loss of generalized confidence in gov-ernment. Whatever the roots of political trust in early socialization(Easton and Dennis 1969; Jennings and Niemi 1981), lifelong opennesscorresponds most to this attitude toward government. When opinionmoves, people of all ages and background tend to shift in the same direction.
While our analysis relies exclusively on the ANES Trust in Govern-ment items, the General Social Survey Confidence in Institutions questions produce similar results (Brehm and Rahn 1997). The 1998Pew Survey confirms that the performance of government and opinionsabout the dishonesty and self-interestedness of political leaders are the main causes of distrust. This study also speculates that worry aboutthe moral health of American society is suppressing the rise in political
coefficients appear larger. In addition, the presidential approval, president moral,and president strong leader variables are interrelated, of course, and including allthree as predictors “splits” the variance accounted for by any one. If one rescalesthese variables and compares the standardized coefficients, approval of Congressgenerally has an apparently stronger effect than any single one of the three indi-cators concerning the president although not stronger than their joint effect, exceptin 1992 and 1994.

J. Citrin and S. Luks
24
confidence engendered by a thriving economy. Nevertheless, most citi-zens with mistrusting attitudes view themselves as frustrated, not deeplyangry.
The foundations of trust in government, then, are largely political innature. Though fundamentally correct, the account proposed by Citrinand Green (1986) is incomplete. Approval of Congress, an excluded vari-able in their original model, turns out to be a robust predictor of trustin government scores. A broader view of the institutional focus of polit-ical trust permits a more nuanced explanation of shifts in the public’soutlook. Attitudes toward Congress seemingly were more importantsources of political trust in the early 1990s than previously, we believe,because of heightened attention to its performance during a period ofintense executive–legislative conflict and the involvement of prominentlegislators in a series of scandals.
One obvious task for future research, therefore, is to identify the ingre-dients of generalized approval of Congress, much as Citrin and Greendecomposed evaluations of the president into beliefs about performance,policy, and personality. In the same vein, is approval of Congress basedupon ideological agreement with the majority party’s policies, opinionsabout prominent leaders such as the speaker of the House, or judgmentsabout the fairness of internal rules and procedures?
A second question to explore concerns the manner in which peoplecombine their attitudes toward the presidency and Congress, respectively.For the less politically engaged segment of the public, an undifferenti-ated image of government seems to prevail, fueling an apparent tendencyto project feelings about one institution onto the other. More generally,the impact of divided government on the foundations of political trust deserves additional study. By impeding change and enhancing the need to compromise, this circumstance increases the frustration ofthose at both ends of the ideological spectrum. This may accentuate the impact of policy dissatisfaction on confidence in government,although the institutional focus of mistrust would differ for liberals andconservatives.
Our explanation of trends in the level and focus of political trustemphasizes the role of “contextual” factors. This broad term, however,fails to specify what features of the political environment are salient andwhen. Indeed, a faint odor of tautology emanates from the propositionthat satisfaction with the conduct of incumbent authorities is the prox-imate cause of trust in government. We therefore need to probe thenature of earlier links in the causal chain. The economy matters forapproval of the president, but it is not all that matters; the erosion ofpolitical trust began in the mid-1960s when times were good (Lawrence1997). A comprehensive account of political trust should consider the
role of economic and social conditions, the public’s perceptions of thenation’s problems, and citizens’ expectations of government in shapingevaluations of political leaders. Clearly too, there may be group differ-ences in these expectations and perceptions that depend on people’sunderlying values and interests. The Pew Study (Pew Research Center1998) concluded that cynicism about the honesty of leaders is especiallycritical to distrust among Americans who came of age after Vietnam andWatergate, while performance failures are more important to older generations.
How people interpret the current state of the nation is also a functionof what and how they learn about political events and outcomes. Herethe interplay between “reality” and “mediality” is significant. Do real-world cues or media frenzies change or reinforce opinions about thetrustworthiness of government? The Reception–Acceptance model’saxioms regarding the impact of prior attitudes and political sophistica-tion on one’s susceptibility to news stories (Zaller 1992) is a useful starting point for addressing this question. For example, some have spec-ulated that the reason that allegations about President Clinton’s perjuryand adultery had a limited impact is that cynicism about all politicalleaders is already deeply entrenched.
implications
Anxiety about the consequences of declining political trust is one moti-vation for diagnosing its causes. In addressing the “so what” question,it is important to disentangle the specific objects of eroding trust. Since so many Americans mistrust politicians as a class while remainingdeeply attached to the political community and to underlying democra-tic principles, a drop in confidence, even if sustained, poses little threatto the stability of existing institutions. Moreover, to some degree thelong-run increase in political cynicism reflects a change in how peoplespeak about politics. The dominant discourse is critical. From talk showsto Saturday Night Live, no one hesitates to mock and denigrate thenation’s top leaders. But as linguistic standards change, so may the emo-tional significance and behavioral implications of verbal expressions ofmistrust.
Criticism of the political process does not necessarily imply disen-gagement. Political cynicism, at least as measured by the ANES items,does not stimulate voter apathy (Luks and Citrin 1997). There is no rela-tionship between trust and turnout at the individual level, and the polit-ically cynical and trusting are equally likely to engage in more intenseforms of electoral participation such as attending rallies or displayingbumper stickers (Citrin and Luks 1998).
Political Trust Revisited
25

Political mistrust stimulates voice rather than exit. There is a strongassociation between mistrust and voting against the incumbent presi-dent or his party’s candidate. This anti-incumbent effect remains statis-tically significant even after one imposes a rigorous set of controls (Hetherington 1997; Luks and Citrin 1997). Thus, rising mistrust, ifbased on realistic assessments of governmental performance, may con-tribute to the maintenance of democratic accountability through elec-toral change.
On a day-to-day level, government functions smoothly when citizensvoluntarily obey the law, even when it entails personal sacrifice. Forexample, belief in the fairness of authorities boosts compliance in pay-ing taxes (Scholz and Pinney 1995) and a willingness to comply withgovernment-sponsored restrictions on water usage (Tyler and Degoey1995). This implies that widespread trust facilitates the mobilization ofcitizens when the government proposes policies requiring cooperationand sacrifice. Still, there is little evidence that lower levels of politicaltrust have produced a nation of scofflaws.
In bemoaning the decline of trust in the 1960s and 1970s, several the-orists “blamed the victim” (Crozier, Huntington, and Watanuki 1975);weakening confidence was due to the excessive demands of citizensrather than the failures of ruling elites. Today, a populist perspectiveseems more appropriate. Trust is a gamble that others will act responsi-bly on one’s behalf. So continued trust is rational only if it is earned(Hardin 1993). It may be wise to give someone with an established reputation the benefit of the doubt, but foolish to entrust one’s intereststo a proven failure.
The political relevance of declining trust in government may lie in howa suspicious climate of opinion shapes the decisions of politicians ratherthan the actions of ordinary citizens. It is often argued that when thereservoir of trust is low and people are unwilling to give their leaders thebenefit of the doubt, the government becomes timid, shunning innova-tion and failing to make necessary, if potentially costly, commitments. Apresident who lacks credibility cannot use his bully pulpit effectively.Whether this is worrisome, however, depends on the wisdom of the pro-posed undertakings.
A cynical climate of opinion probably emboldens opposition forces,fueling demands for changes in public policy. The erosion of trust inrecent decades almost certainly contributed to the passage of conflict ofinterest regulations, changes in campaign finance rules, ethics commit-tees in Congress, term limits in many states, and even the independentprosecutor law. Taken together, these measures significantly altered howgovernment functions, without constituting a revolution in the normalsense of that term.
J. Citrin and S. Luks
26
Since a return to the confidence levels of the 1960s seems unlikely, thefact that mistrust is not always malign is comforting. The most obviousbasis for increasing trust would be consistently effective performance,particularly in the economic domain. The belief that government has auniversal realm and must deal with virtually every important problem,however, makes setbacks inevitable. Moreover, the proliferation of com-bative social movements and the ideological polarization of the politicalparties undermine the development of a consensus on how to solve theseproblems. Add to this the cultural revolution that has shattered oldertraditions of deference to authority and media practices that accentuatethe negative about politics. In sum, the cynical zeitgeist is unlikely tovanish.
In this context, shared values are another potential basis for boostingtrust. People are more likely to trust authorities whose personal charac-teristics imply this mutuality of interests. The American dilemma isreaching common ground in a diverse society where every faction canadvocate its particular viewpoint. Finally, trust may be based on thebelief that institutional processes encourage dutiful conduct and punishwrongdoing. Reforms that demonstrate commitment to these norms thuscan have symbolic as well as substantive importance. As this suggests,political trust is never fully realized; its production is an ongoing processof exchange between citizens and authorities.
Political Trust Revisited
27


