WHAT IS NOT COOL ABOUT THE CURRENT CLIMATE WARMING? A guide to assist the teaching of climate change in K-12 grades Sophie Warny, Ph.D. Department of Geology and Geophysics & Museum of Natural Science Louisiana State University Dianne Lindstedt Louisiana Sea Grant College Program Louisiana State University
Transcript
WHAT IS NOT COOL ABOUT THE CURRENT CLIMATE WARMING? A guide to assist the teaching of climate change in K-12 grades
Sophie Warny, Ph.D.
Department of Geology and Geophysics
& Museum of Natural Science
Louisiana State University
Dianne Lindstedt
Louisiana Sea Grant College Program
Louisiana State University
Table of Contents
I N T R O D U C T I O N
C H A P T E R 1 C O M P O N E N T S O F E A R T H C L I M A T E S Y S T E M
Geological Time Scale and Dating ........................................................ 4
C H A P T E R 3 E A R T H ’ S C L I M A T E H I S T O R Y
Tectonic-Scale Control on Climate Change .......................................... 8
Orbital-Scale Control on Climate Change ........................................... 10
Natural Green-House Gases Control on Climate Change .................. 15
Industrial Age and Future Climate Changes ....................................... 22
C H A P T E R 4 C L I M A T E C H A N G E A N D L O U I S I A N A
C H A P T E R 5 H O W T O B E C O M E A B E T T E R C I T I Z E N
C H A P T E R 6 S C H O O L S A C T I V I T I E S
Activities Group 1: Sea Level Change .................................................. 29
Consequences of sea-level changes on humans ....................... 32
Consequences of sea-level changes on food-web ..................... 33
Activities Group 2: Physical Properties ............................................... 35
Green House Gases Activity .............................................. 35 Water Circulation .......................................................... 39
Forcing Mechanisms on ice (ice-cube) .................................. 41
Activities Group 3: Getting the Data ................................................... 42
Drilling an Ice Core…, or a Mud Core ................................... 42
Activities Group 4: Reading and Writing ............................................. 43
Brainstorming in Lafitte’s Island ........................................ 43
R E F E R E N C E S
Introduction These two words “Climate Change” are now part of our daily life. We hear about it weekly in the news. In Louisiana, hurricanes Katrina and Rita changed our everyday life and society forever. Are such major hurricanes and the high hurricane activity in the Gulf of Mexico these past few years a result of climate change? This is still a controversial subject, but one point is clear, the climate is warming. Predicting future climate changes and the relationship with effects (such as hurricanes) is an extremely difficult task because the climate system is very complex, with buffers and enhancers that can slow down or multiply the rate at which our planet respond to increased temperatures. There are very little resources that are geared at explaining the big concept of climatic change to the public, teachers, and students, and to allow them to fully understand what is going on, and where the main scientific questions still lies. Our goal with this new resource is to share recent scientific discoveries and understanding of Earth and how its climate has been changing over time via a simplified, but hopefully complete modern review of scientific knowledge. Our approach is to provide the followings:
1) An overview of Earth’s climate system. 2) An set of background information on the process of scientific inquiry regarding
climate change research. This is an important chapter as it takes you into scientific quests and hopefully portrayed how scientists get their paleoclimate data. It is divided it in two. First, we propose a series of example on how past-climates are being reconstructed. Second, we provide a quick overview on how these data are being dated.
3) The next chapter provides detail information on the mechanisms of climate change, answering questions such as why climate have been changing and what will happen in the future.
4) In the next chapter, we review some examples of the consequences of climate change on Louisiana.
5) By then, we hope we gave you sound proofs that we indeed need to take action and play a role in slowing climate warming. This chapter give ideas and guidance to help everyone become a better Earth citizen and help fight global warming.
6) We complete this review with a series of activities for the classroom. If you have any questions or would like to know more about the climate change research performed at LSU, our exhibits, and our outreach programs, please contact us at: Sophie Warny Department of Geology and Geophysics Museum of Natural Science Louisiana State University 70803 Baton Rouge, Louisiana [email protected]
Dianne Lindstedt Education Coordinator Louisiana Sea Grant Program Louisiana State University 70803 Baton Rouge, Louisiana [email protected]
Chapter I: The components of Earth’s climate system As far as we know, Earth is the only known planet to have a climate favorable enough to allow the existence of life. But we shouldn’t take it for granted. Some geographic area are very vulnerable to climate change, specifically low-lying area like Louisiana where just one-meter of sea-level change could dramatically altered are coastal cities, fishing, and oil industries. Before we can discuss how the climate evolves, we need to understand the climate system that Earth is made off. This is important because each part of the system interacts with one another and influences the climate.
Figure adapted after an original figure from Ruddiman, 2008.
As shown in the figure above, the five components of the climate system are:
a) The Hydrosphere Oceans, rivers, lakes, and groundwater made up Earth’s hydrosphere. Even though, 99% of the water is in the oceans, the other components are the key partners of an ocean, allowing it to replenish its nutrient content. One key component in the role of oceans in the climatic regulation is the fact that ocean can store a lot of heat, and a lot of soluble carbonate (keep this in mind, it will be important later on). In addition of this storage capacity, oceans are great to transport and distribute heat from the equator to the poles. The main world current is known as the conveyor belt and moves around the word from areas of warm, fresher, surface water towards zones of denser, colder, saltier waters circulating as a deeper current. This current plays an important role in the distribution of heat in most of the world’s oceans. Therefore, this current is fundamentally controlling the climate, and a change in its direction or intensity would have a
major impact. Such changes already happened in the past. For instance, as you will read further in details, the isolation of the Antarctic continent to the South, and the subsequent creation of the Antarctic Circum Polar current, blocked the conveyor belt to the South and changed global climate and our environment drastically (see section on plate tectonic for more details).
b) The Cryosphere Ice sheets, glaciers, ice caps, snow, frozen lakes and frozen rivers form the cryosphere. Because of its light color, the crysophere plays an important role in what’s called albedo. Albedo refers to the reflecting properties of surfaces. The extremes are white surfaces, with an albedo close to 1; and black surfaces with albedos close to 0. Because the very light coloration of the cryosphere, snow, ice, etc. reflects most of the solar radiation that hits it. It means that it prevents Earth’s surface underneath to become too warm and few radiation are being absorbed. The other fundamental importance of the cryosphere is as a source of “water storage”, which in turn, controls global sea levels.
Antarctica today (Image credit: Philip Bart, LSU).
c) The Atmosphere Simply put, the atmosphere is what’s comprise between Earth’s surface and out of space. It is composed of various layers. The lower layer is the most “mobile” layer. This is where the air convects, distributing air masses from hot to cold regions. The main components that made up the air are nitrogen (~78%), oxygen (~21%), argon (~0.9%), carbon dioxide
(~0.035%), water vapor (up to 3%), and traces of other gazes such as methane, nitrous oxide, Chlorofluorocarbons (CFCs), and ozone. The last six are green house gases. They trap some of the solar radiation on Earth, allowing the Earth to be warmer than it would normally be. Because the composition of the atmosphere and its ability to trap heat (greenhouse effect – see Chapter 3 and 4) is the key element to our future climate, below is a description of the main greenhouse gases and their sources.
Carbon dioxide (CO2) accounts for 50 percent of the greenhouse gases in the atmosphere. It is naturally emitted from decaying plants and animals, during volcanic eruptions, during respiration in living organisms, and anytime organic matter (especially the fossil fuels – coal, oil, natural gas, and wood) burns. Carbon dioxide emissions are 25 percent higher today than they were 200 years ago, and human activities are mostly to blame. Today’s highly mechanized world burns fossil fuels to produce the energy needed for transportation, manufacturing, and producing electricity. This energy is not recyclable. As these activities increase, more fossil fuel must be burned, and an increase in atmospheric carbon dioxide occurs. Deforestation also adds to the increase in CO2 level. When forests are cleared for agricultural, residential, and industrial development, fewer trees remain to use CO2 from the atmosphere during photosynthesis.
Methane (CH4) is produced naturally as microbes break down organic matter in the absence of oxygen. This happens in water-logged conditions such as rice paddies and marsh areas, and in the digestive tracts of farm animals and termites. As human population growth has escalated during the last century, more and more rice and cattle have been raised, driving the emission of methane to higher levels. Today, methane accounts for 20 percent of greenhouse gases. To make matters worse, methane has the capacity to absorb more heat per molecule than carbon dioxide, so its impact on global warming could be immense, should levels continue to rise.
Nitrous Oxide (N2O), better known as “laughing gas” by those who depend on its anxiety-relieving properties in the dentist’s office, is emitted during the burning of fossil fuels and the breakdown of nitrogen-containing fertilizers used in agriculture. It makes up 15 percent of the greenhouse gases.
Chlorofluorocarbons (CFCs) are a family of manmade chemicals that have been used in a number of industrially important processes since their invention in the 1930s. The best known CFC is Freon, which is used as a coolant in refrigerators, freezers, and air conditioning systems. Other CFCs are used as foaming agents to produce materials such as Styrofoam, as cleaning agents for sensitive electronic equipment such as computer chips, and as propellants in aerosol cans. At the outset, these synthetic chemicals were heralded as a boom to modern life. They were easy and inexpensive to make, had a variety of useful applications, and appeared safe to use. Today, they account for 15 percent of earth’s greenhouse effect and, like methane, have a greater heat-absorbing capacity than carbon dioxide, molecule for molecule. CFCs have also been linked to a breakdown in the stratospheric ozone layer, which protects organisms on earth from the harmful effects of ultraviolet radiation.
Ozone (O3) is produced naturally in the outer reaches of the stratosphere. High-energy solar radiation breaks apart free oxygen (O2). Some of these highly reactive oxygen atoms combine with oxygen molecules to form the three-atom molecules called ozone.
These three-atom molecules of oxygen form a thin, protective shield around the earth that absorbs and reflects most of the harmful ultraviolet radiation from the sun. Since ozone gains heat in the process of absorbing solar radiation, it is considered a greenhouse gas. It does not, however, contribute to the enhanced greenhouse effect. In contrary, its amount in the stratosphere is decreasing. The ozone hole that is found above Antarctica is therefore of great concern for the scientific community because the planet is loosing its shield against the Sun’s ultraviolet radiation.
This NASA satellite data image shows the size of the ozone hole (in blue) above Antarctica. The ozone layer helps protect against excessive ultraviolet light. Today, this ozone hole is three times the size of the United States! (Image credit: NASA Goddard)
Water vapor (H2O) is part of the water cycle on earth, and as such, is vital to life. However, one of the properties that makes water so important to life – its ability to absorb and hold heat, thus modifying the environment – also makes it a greenhouse gas in the atmosphere As the climate warms on earth, liquid water evaporates, becoming water vapor in the atmosphere. This vapor, in turn, holds more heat energy radiating from the earth.
d) The Lithosphere There are various ways the lithosphere influence climate. First and foremost, the position of continents, governed by plate tectonic, is one of the key factors controlling the climate. Second, the topography of a region (mountain, plains, etc.) influences the way a region interacts with the atmosphere. Finally, the composition of Earth’s lithosphere varies. It is composed of soils, sedimentary rocks, igneous rocks, or methamorphic rocks, and all have diverse ways of absorbing/returning solar energy to the atmosphere. The formation of surface igneous rock, through volcanic activity might be the most stressful to a climate, as volcanic eruption are associated with gas emission that can drastically changed the atmospheric composition.
e) The Biosphere The biosphere is everything living on Earth. A land covered with vegetation, such as this scene from Louisiana, will have a profound effect on climate. Today, deforestation is one of the major factor in the diminished ability of Earth to naturally trap CO2. It is therefore on of the main contributor to the increased CO2 concentration in the atmosphere. (Photo credit: Sophie Warny).
The way these five main system components interact over a long period of time, in a specific region, is what makes up the climate of a region.
Chapter II: Scientific Inquiry Now that we reviewed what are the elements of the climate system, we need to learn about the evolution of the climate during Earth’s past’s history. To do so, we will take a quest into how scientists are learning about past climate changes, and how they go about dating these environmental changes. Because we are dealing with dating the Earth record, the question of time scale is a major issue, because one that we do not deal with on an everyday basis. So why is geological-time scale such a hard concept to grasp? The main reason is because this timeframe is far more extended that our usual concept of time. Earth formed 4,550,000,000 years ago! Human life started about 3,500,000 years ago with an extinct hominid, Australopithecus afarensis (known as “Lucy”), who lived in Africa. You probably wonder how can we know anything about such a distant past? We certainly don’t know everything, but we have a very good idea for period of time for which rock deposits can be found. We mainly have information for period of times that covered the past 540,000,000 years, since a period called the Cambrian. Most of the rocks deposited before than, have been altered too much to allow what we call a paleo-environmental reconstruction. The first section of this chapter will give you some concrete examples of the ways scientists are acquiring data on past-environments. The second part will explain some of the methods that are used to date these paleoenvironmental reconstructions.
Section IIa: Reconstruction of Paleoenvironments So, how exactly do we conduct a paleo-environmental reconstruction and find out about the climate that took place during previous geological time, in various regions. As a geologist, we mainly study four “mediums” that contains or are “archives” of past climates. The principal one consists of a type of rock deposited mainly by water, these are called sedimentary records. Lakes have records that span a few thousands years, but ocean have records that can go back as far as several millions of year (up to 170 millions of years). At the time of their deposition, the sediments that make up the sedimentary rock incorporated plants and animals that lived in the region, unknowingly “archiving” data on past climate for scientists. Another important medium is ice. In addition to the study of rocks and ice, plants and animals remains also give fundamental clues on the past. Nowadays, physical and geochemical properties of the particles are also increasingly used as paleo-climate indicators (see section on geochemistry). Here are a few examples of the paleo-climate methods used:
1) Paleontology Paleontology is one of the oldest geological field, and one that have proven to be extremely reliable over the past 150 years of scientific research. A paleontologist is a
geologist who studies fossils. Fossils are the remnant of plants and animals that once lived on Earth. Microfossils are like treasure boxes, tiny fossils of forams, pollen, sponge spicules, or algae, tell us about the type of plants and animal that used to live on our planet, and therefore, the type of environments the planet once had. One of the specialties of paleontology is palynology. A palynologist focuses on studying microfossils of pollen and algae that are extracted from cores of sediment. Some cores such as piston cores are just a few meters deep and give information on a short amount of time. But some cores obtained via major drilling operation such as those of the IODP (International Ocean Drilling Program) can be several kilometers long and give you information on Earth’s climate history over millions of years. Cores almost always contain fossil evidence of various animal and plants that used to lived in the area at the time of deposition, and were incorporated into the fossil record at the time of their death, via wind, run off, or sedimentation in the water column. For instance, a palynologist who studies pollen from cores collected in Antarctica can reconstruct the vegetation that once covered the now icy continent. Based on the vegetation cover, the palynologist can derive the temperature and precipitation that made up the climate in Antarctica because the pollen found corresponds to a specific plant. And some plants have specific requirements to grow. For instance, Antarctic deep-sea cores show a dramatic change in plant pollen originating from the continent, indicating that the continent was one covered by lush temperate forests that were replaced by colder climate tundra. This information is corroborated by work of sedimentologists (geologist studying sedimentary pattern) as they found evidences showing advanced of glaciers at the same time as evidence of vegetation replacement was observed.
a) Cape Roberts Project drill rig. CRP’s mission was to collect samples below the sea floor to document paleoenvironmental changes, the history of the East Antarctic ice sheet, and the tectonic history of the Transantarctic Mountains (Photo credit: John Wrenn). B) Sediment core samples recovered during the 2001 CRP campaign near McMurdo station (Photo credit: Sophie Warny). C) Palynologist analyzing microscopic samples of fossilized Nothofagus pollen (displayed on screen). Samples were recovered from cored sediments buried below Ross Sea (Photo credit: Sophie Warny).
The other groups of fossils studied by palynologists and micropaleontologists are planktons. The plankton includes a series of protists forming either shell (diatoms, foraminifers, coccoliths, and radiolaria) or cysts (dinoflagellates). Some of the species are climate sensitive and can give very detailed information on sea water temperature, salinity, and ice cover. Another fossil group that is very important in reconstructing climate are the corals. Corals need light and clear water to grow so they grow their colonies at sea level. This characteristic makes them perfect indicators of past-sea levels. For instance,
previous corals colony can be found today 50 m below seafloor. This indicate – if the area did not subside – that sea-level in this region could have fall by a maximum of 50 meters since the time when this coral colony was living. 2) Geophysics In Louisiana, geophysicists mainly use their tool for oil exploration by mapping oil-baring units. But geophysicists can also study past climate using their tool to map units deposited by ice-sheet advances and retreats as a consequences of climate cooling or warming. When the geophysicist uses seismic data to gather images of the rocks buried under the seafloor, they can visualize debris left by ice-sheet retreats and advances, and therefore judge how severe past climate warming (ice-sheet retreats) and glaciations (ice-sheet advances) were.
a) Airguns, below orange floats, deployed from the back deck of the Nathaniel B. Palmer IBR/V, release compressed air into the water column. Sound waves reflect from geologic boundaries, and travel back to the surface where they are recorded by pressure sensitive cables. B) Former LSU student, Pres Viator, analyzing seismic data in the dry lab of the N.B. Palmer IBR/V, during his midnight to noon shift as seismic data are recorded 24 hours per day (Photo credit: Philip Bart, LSU). C) Line-drawing interpretation and seismic reflection profile showing surfaces eroded by ice sheet advance across Ross Sea. Age control is based on diatom stratigraphy (Image credit: Philip Bart, LSU)
3) Geochemistry A geochemist evaluates the composition of water, rocks, and atmosphere and uses it to reconstruct past climatic conditions. One of the very important methods born from geochemistry is the use of oxygen isotopes. The oxygen-isotope method is one of the best proxy method used today around the world to reconstruct sea-level changes. A proxy is calculated data that is measured when the original source is not there anymore. Some of the main evidence for cooling and sudden growth of ice on Antarctica comes from chemical measurements of tiny fossilized plankton, called foraminifera, in deep ocean sedimentary drill cores. In this case, the oxygen isotope chemistry of the foraminifera is used to reconstruct the temperature of the ocean water they once lived in and the amount of ice that existed on continents at the time. So how does it work? The Foraminifera (or forams) are a class of marine, microscopic, single-celled organisms. Forams use dissolved ions (Ca+2 and CO3
-2) that are available in the seawater where they live to create their calcite shell (CaCO3). Most of these foram species are benthic, that is, they live on or in seafloor sediments. Others are planktonic; these live in the water column, close to the sea surface. Both groups are present as fossils in marine sediments.
a) Scanning electron microscope image of a benthic foram. b) Scanning electron microscope image of a planktonic foram (Images credit: Lorene Smith, LSU for the LSU MNS Antarctic Exhibit).
In the calcium carbonate (CaCO3) shells of forams, three kinds of oxygen atoms are present. These are called isotopes of oxygen. They all have 8 protons, but the number of neutrons is 8 (in the isotope called oxygen-16 or 16O), 9 (in 17O), or 10 (in 18O). The ratio of 18O to 16O in a foram shell depends on the temperature of the water in which the foram lived, and on the ratio of 18O to 16O in the water. Because of this unique characteristic, geologists can estimate seawater temperatures in the past by using measuring the oxygen isotope ratios in foram shells found in sediment cores (see graph below). Why is that so? The light isotope of oxygen (16O) is preferentially removed from the ocean to the atmosphere through photosynthesis by surface-dwelling plankton. It is evaporated, and, when conditions are cold enough for ice sheets to form on land, it is incorporated into snow and ice, and not returned into the ocean, leaving the ocean enriched in the heavier isotope (18O). During warmer intervals, when ice sheet is melting, the light 16O is returned to the ocean, and the ratio of 18O on 16O is then lowered, to a degree that reflects the amount of ice or snow that melted. For instance, it is the measurement of the relative amounts of the heavy and light isotopes of oxygen that provide the evidence for a rapid drop in temperature and ice growth on Antarctica about 34 million years ago.
Estimated average temperatures in the Southern Ocean in the Cretaceous Period. Temperatures decreased during much of this time, but rose between 66.5 and 65 million years ago (Image credit: redrafted for the LSU MNS Antarctic Exhibit; graph simplified from B. T. Huber, R. D. Norris, and K. G. McLeod, 2002, Geology, v. 2; foram image by Dr. B. Huber, Smithsonian Institution.)
4) Computer Modeling Climate modelers feed data provided by geologists and geochemists into their mathematical system and provide via computer simulations of components such as
atmospheric circulation, some perspective and trends on how the system might have evolved in the past for period for which we do not have data. These model are also increasingly use to estimate how the system might evolve in the future.
For more recent climatic evolution, scientists use satellites, and other modern technology such as air sensors, and new laboratory techniques. For these “younger” times, other groups are joining the research performed by geologists. For instance:
1) Oceanographers One of the fields of oceanography is the study the circulation of water masses in the oceans and how they affect the atmospheric circulation and general climate.
2) Meteorologists This field studies the historical and recent circulation of the atmosphere.
3) Glaciologists Glaciologists study ice core. Ice samples are analyzed just like sediment samples, but instead of having detritic accumulation, here you work with deposition of snow, ice, trapped fine sediment (possibly wind-blown), and air bubbles. The oldest ice record obtained to date is relatively young geologically speaking, with an age of “only” 700,000 years old (from Antarctica). Ice cores are dated by quantifying ice flow, or by counting yearly layers, or where possible, by radiometric dating if volcanic ash layers are found. Old air bubbles can be analyzed to find out about the quality of air thousand years ago. They are most notably studied to analyze past concentrations in greenhouse gases such as carbon dioxide (CO2) and methane (CH4). The Vostok Ice Core, in Antarctica provided the most amazing results to date. Indeed, the CO2 concentration measured from this core shows oscillations that are lined up with variations in marine 18O, which is a measure of changes in ice volume (see section above on geochemistry), meaning that ice sheets were small at time of high CO2
concentrations (maximum measured is 300 ppm), and vice versa, the ice sheet was large at time of low CO2 concentrations (minimum measured is 180 ppm). This co-variation between ice-sheet extent and CO2 concentrations is the “alarm bell” that got the scientific community worried about green house gazes. The terrifying point is not that ice reacts to fluctuations in CO2 concentrations, but the fact that in the past 700,000 years, natural variations in CO2 concentrations ranged between 180 and 300 ppm. Our current CO2 concentration is ~ 370 ppm, and it is increasing daily.
Ice cores collected in Lake Vostok, Antarctica (Photo credit: Melanie Conner, NSF)
4) Dendroclimatology Trees are good archives of past climate, but only for the few last hundreds to thousands (rarely) of years. The concept of using tree rings to estimate past climate is simple. In general, tree rings are wider when conditions favor growth, narrower when the climatic conditions are not optimal for the species. Using this basic assumption, scientists can estimate past recent local climates.
5) Historians Our most recent history is best documented thanks to historians. They look into archives collected by our ancestors to define recent climate changes (the last 2,000 years or so).
Section IIb: Geological Time Scale and Dating An important question is how do we date these paleoenvironments? There are various techniques. The most common ones are the following:
1) Radiometric Dating This technique uses the measure of radioactive isotopes decay in rocks – or in the shell of the animals that incorporated the radioactive isotope (14C). In this case, the “parent” isotope of one element has a specific mass but is unstable, so it will naturally decay into a stable “daughter” isotope, of another element that has a lighter mass. Their atomic number remains the same. The passage from one element to the other occurs in a very organized way, and the rate of the decay is well known and constant. So, time is calculated by measuring the quantity of a radioactive parent isotope and its daughter isotope in the same rock. Decay times are different for different isotope, so different “parent” isotope are used for dating a wide range of rock deposits. For instance, the Potassium/Argon method is used for rocks older that 100 Myr, while the 14C (Carbon/Nitrogen) method is only good to date rocks that are younger than 50,000 years.
2) Biostratigraphic Correlation Hundred of thousands of studies from sites all around the world have provided many data on the fossil records since the Cambrian age. These millions of data have been assemble over the years and biostratigraphers now have a good idea of what types of fossils are found in which stratigraphic units (rock of similar age around the world). In most cases, the same species have developed on Earth at the same time and subsequently became extinct. Most of them existed on Earth for “brief”, well document period of time. The direct consequences is that, when known fossils or association of fossils, are found in sediment deposits, the type of fossil found give a good age range for this unit. The least amount of time an animal or plant lived on Earth, the more precise the datation will be.
3) Magnetostratigraphy This chronostratigraphic technique is used to date sedimentary and volcanic sequences. During sedimentation, tiny grains of magnetic minerals (a few micrometres) fall through the water column and orient themselves with Earth's magnetic field. Once the sediments are compacted and the rocks are formed, the orientation is locked. The Earth’s magnetic field has been changing its polarity from normal to reverse over geological history. If the ancient magnetic field was oriented similar to today's field (North Magnetic Pole near the North Rotational Pole) the strata retain a Normal Polarity. If the data indicate that the North Magnetic Pole was near the South Rotational Pole, the strata exhibit Reversed Polarity. Today, scientists have collected thousands of data around the world and have established a dated series of reversal in polarity, that are obviously the same all around the world.
4) Orbital Tuning Once an age for a rock is known with a short range, the age can be refined using the correlation to orbital cycles of the Earth. This technique is called orbital tuning. The fluctuations in Earth orbital cycles are known as Milankovitch cycles. As these are very cyclic (repetitive), scientists have exported these cycles to past period via mathematical and astronomical calculations. Therefore, one can find out to which part of the cycle a specific association of the orbital components is linked, and refine a biostratigraphic or magnetostratigraphic age.
5) Varves Counting This is an excellent technique, but only valid for very recent records. It gives the most precise date, with a year-by-year archive. How does it work? In the cases of lake deposits, layers (or varves) show a periodic pattern that is linked to changes in seasons. The pattern consists in alternation of dark to light-colored layers. The dark layers are rich in organic material and are deposited in the winter, the light layers are richer in minerals and are deposited in the summer.
6) Dendrochronology Similarly to the valve technique, trees grow a peripheral ring every year. A thick layer of lighter wood tissue is formed by rapid growth of cellulose in spring, and followed by thin dark layers that indicate the end of growing season during the coldest months. Using three rings for datation is called dendrochronology.
Chapter III: Earth’s climate history In the previous chapter, we reviewed some of the main techniques scientists use to reconstruct past environments and climate, and how they date them. Countless studies have allowed scientists to have a good general idea of Earth’s main phases of climate change over the past 500 Ma or so. In this chapter, we analyze what are the possible causes of these changes. So what is the best way to understand when and why the Earth’s climate changed? Answering the question “When?” is the first step. Everything is a question of time. As we mentioned in our introduction, as far as Earth is concerned, time is not the concept we are use to in our daily life. Earth time is also called the geological time, and this concept is not always easy to visualize. Yet, we strongly feel that understanding the geological time-scale is the best way to analyze and understand the evolution of Earth’s climate. For this reason, we adopted the approach presented by Ruddiman (2008). In this book, each key player is organized according to the time-scale at which it played or plays a role, from long-term to short-term, following a natural course. We will start by presenting the “big picture” changes in climate that occurred as the continents were migrating. Then we will analyze the additional changes that took place in response to changes in the Earth’s orbit, and, as the atmosphere and its gases composition changed naturally, and later… not-so naturally, as our modern societies developed.
Section IIIa: Tectonic-Scale Control on Climate Change The climate’s largest scale controlling factors are the ones linked to the concept of plate tectonic, a concept first published in 1914 by Alfred Wegener. This concept explains how continents slowly drift across the Earth’s surface as a results of Earth’s structure (its upper mantle is divided into 12 plates) and internal heat. In his work, Wegener retraced the positions of the continents to their original mega-continent structure called Pangaea. The resulting phenomenon such as volcanism, earthquake, and mountain ranges creation occur over millions of years. In the process, it affected and still affects a region’s climate. Here are a few very basic examples on how plate tectonic acts as the overlying controlling factor on climate change:
a) The most obvious one is geographical location. A continent drifting from the equator to a more polar location will have his entire climate profoundly transformed.
b) The other is altitude. A region that is being uplifted (creation of mountains) becomes colder as uplift proceeds (temperature is lower when altitude is higher). Furthermore, mountain ranges interact with the atmosphere and influence other conditions, for instance, by blocking clouds and increasing the amount of precipitation a region receives.
c) Another example is the effect on global current. In the case of the Antarctic for instance, its isolation and drifting to its current southern pole position had far reaching consequences. After drifting to the pole, a Circumpolar current formed around Antarctica, further preventing warm equatorial water to reach the Antarctic coast, locking this continent in polar condition. This has an impact not only on Antarctica, but on the entire ocean circulation, as cold Antarctic water are trapped to the pole, and cannot interact as deeply with the conveyor’s belt.
The separation of Australian and Antarctic plates was followed by the opening of the Drake Passage, which led to the development of the cold Circumpolar Current that prevented warm equatorial currents from penetrating towards the Antarctic, thus causing the cooling and continental-scale ice-sheet expansion. (Image credit: Image drafted for the LSU Museum of Natural Science Antarctic Exhibit).
Section IIIb: Orbital-Scale Control on Climate Change The Earth orbits around the Sun. The components of the orbit fluctuate over time in a predictable (cyclic) manner. The changes are linked to changes in gravitational attractions between planets, their moon, and the Sun. These changes alter the amount of solar radiation that Earth receives. These cycles are called Milankovitch cycles after a Yugoslavian scientist who first discovered and calculated them. Since, hundreds of examples of these cycles have been observed in well-dated (by radiometric and biostratigraphic methods) geological rock records from all around the world.
Milankovitch’s reconstruction of past variation in Earth’s three orbital components. (Image credit: graph edited from T.E. Graedel and P.F. Crutzen, Atmospheric change, W.H.Freeman, 1993. Image redrafted for the LSU Museum of Natural Science Antarctic Exhibit).
The Earth’s orbit is composed of three major components: 1) The precession The Earth wobbles slightly on its axis of rotation (like a top), giving rise to a precession or wobble. This variation has a time period of about 23,000 years. To put these rotations in perspective, the Earth rotates daily on itself (creating nights and days), rotate yearly around the sun (creating the seasons), and rotate or wobble around its tilt axis once every 23,000 years (changing the position of the seasons along the orbital path). 2) The tilt or obliquity The angle of tilt of Earth’s rotation axis cycles also varies, and ranges between 21.5º to 24.5º. The time interval of one cycle from low to high angle is about 41,000 years. Changes in tilt means that there are very little differences between seasons when the tilt is low, and that there are amplified difference between seasons when the tilt is high. These changes are felt the most at the poles. 3) The eccentricity The shape of Earth’s orbit around the Sun changes cyclically too, from a circular to an elliptical shape. A circular orbit has a low eccentricity while an elliptical orbit has a higher eccentricity. The time interval of one cycle from low to high eccentricity is about 100,000 years.
Heat that Earth receives from the sun varies following these cycles as the proximity from the Sun varies. Such changes, as expected, introduce periodic climate changes on time scales of 23, 41, and 100 thousand years. These ultimately have controlled changes from glacial to interglacial cycles on Earth over thousands to millions of years.
Schema representing the three components of Earth’s orbit. From left to right are: Precession (period of 23,000 years), Tilt (period of 41,000 years), and Eccentricity (period of 100,000 years).
(Image credit: LSU Museum of Natural Science Antarctic Exhibit).
Does Earth’s movement have consequences for life today in places like Antarctica? Yes! As the Earth moves around the sun, it follows a path called its orbit. It takes a year for the Earth to go around the sun once. Because the Earth is tilted, when one side of the orbit, the South Pole, is pointing partly toward the sun it is summer in the Southern Hemisphere. In this position, the North Pole does not get any light, this is winter in the Northern hemisphere. Then, at the opposite side of the orbit, the North Pole points partly toward the
sun and the South Pole away from the sun, which makes it summer in the Northern Hemisphere and winter in the Southern. While all this is happening, the Earth also spins around once every twenty-four hours, creating day and night for us in Louisiana, and for most of the planet. However, the light from the sun can’t reach the Pole that faces farthest away from the sun so it’s dark there all day, while the Pole closest to the sun gets sunlight twenty-four hours a day.
Section IIIc: Natural Green-House Gases Control on Climate Change If you come visit the Museum of Natural Science on the LSU campus, your will find some fossilized remains of animals that once lived in Louisiana. One of them is a mastodon. Fossils of mastodons are common in Louisiana. Excavations have uncovered mastodons in the Mississippi River Valley at Angola Prison, and beside Bayou Manchac in Ascension Parish. Mastodons have also been found in loess exposures near Tunica Bayou and Little Bayou Sarah in West Feliciana Parish. Some of the most interesting specimens found in our state are often associated with loess sediments. This is not surprising as that type of silty sediment is blown by the wind during glacial period, a type of climate in which mastodon thrived. Some mastodons found are about 21,000 years old, a period known as our last glacial-maximum.
Mastodon palate found in Tunica Hills, Louisiana (see feet for scale). This specimen is part of Dr. Schiebout’s collection, LSU Museum of Natural Science.
The type of sedimentary deposit and the mastodons found in Louisiana confirms that our state too, just like the rest of the U.S., Canada, Europe and Asia, went through a glacial phase just a little over 20 thousands years ago. Mastodons are believed to have become extinct as the climate became too warm and these large mammals were unable to adapt. But at the time they lived and roamed the plains of what is now Louisiana, sea level was about 110 m lower than today! How could that happen? Simply because a large quantity of the World’s water supply was “stocked” as ice over various continents.
So, 21,000 years ago, Louisiana’s climate was a lot more colder. Yet, 21,000 years ago, the continents were pretty much where they are now, and mountain ranges and today’s overall landscape were formed. In addition, because of the cyclic nature of Earth’s orbit, the summer and winter insolation levels 21,000 years ago were very similar to what they are today. This means that the two major factors controlling Earth climate (plate tectonics and Earth’s orbit) cannot explain why 21,000 years ago, Louisiana enjoyed a much colder climate, with a low cold/dry tolerant vegetation cover, and a much wider coastline, than what we have today. There is mainly one major difference between today’s world and 21,000 years ago. This difference is that CO2 concentration in the atmosphere were much lower 21,000 years ago. This is a long introduction, but the point is, this is the type of multi-disciplinary observations that confirm to scientists that CO2 has indeed a major impact on the Earth climate, and most definitely is the key player for anything concerning short-scale climate change predictions. This is the one factor that should be the primary focus of our society. Therefore, we will review green house gases and specifically CO2 in details starting below (discussing natural CO2) and in the next section (discussing industrial CO2). Let’s start with the natural CO2 and ask ourselves: When are CO2 and other green-house gases good for our planet? They are good when you have just the right, natural amount of CO2 in the atmosphere. For instance, the reason the planet Venus is so much warmer than Earth (warmer than its closest distance to the Sun would explain) is because its atmosphere is extremely rich (96%) in CO2 and therefore traps much more of the Sun radiation. Our atmosphere is mainly composed of water vapor, much less CO2 (only .02%) and other gases that do not trap the solar radiation as much. Earth has just the right natural greenhouse gases to allow most of the planet to have nice, warm temperatures that makes Earth such a wonderful place to live. Another example is the protection that some gazes offer. The ozone layer high in the atmosphere protects us from some of the most dangerous radiation of the Sun. When looking at natural CO2, another important question to understand past climates is: Did CO2 concentration changed before human existed on Earth? Yes it did! On Earth, the carbon is mainly stored in rocks. Over geological time, carbon has been released in the atmosphere naturally thanks to input from volcanic activity. It also has been removed naturally via chemical weathering and trapping in shells of plankton or via precipitation that removes the free HCO3
- from oceans. These natural CO2 removal or input processes have been keeping our planet at decent temperature, even at time of higher release, as the some natural removal processes acted as buffers. One of the important player in carbon cycle, and an important factor in long-term climate change is the progressive development of life on Earth, first with algae, then basic land plants, followed by flowering plants. Plants definitely played a role in CO2 reduction in the atmosphere. So, if CO2 concentration changed naturally in the past, why should their increase worry us now? This is what we will discuss in the next chapter.
Section IIId: Industrial Age and Future Climate Change So why should we be worried about the concentration in CO2 now? According to the position of plates and Earth’s precession, our planet should be going through an ice age. When you compare with the case study during the Last Glacial Maximum, the main difference is the concentration in CO2 in the atmosphere. We now know that Earth’s atmosphere has undergone natural fluctuations in its CO2 concentration over Earth history, as a result of volcanic activity (related to plate tectonic) and associated release of CO2 in the atmosphere, and the development of life on Earth that influenced the CO2 reduction. So, what is really alarming, is that CO2 levels are now higher than ever since our society existed on this planet. If green house gases concentration keep rising, so will the temperatures, and so will global sea levels. The anthropogenic or industrial CO2 is creating what is called an enhanced greenhouse effect, where the greenhouse gases that trap heat within the surface of the atmosphere are increasingly introduced in the atmosphere by human activity, so that Earth natural buffers are saturated or destroyed (with deforestation for instance), temperature keep rising, ice melt, and global sea-level keep rising. Historical perspective Since the industrial revolution about 100 years ago, our modern climate has been monitored and archived in details by meteorologists thanks to tools giving precise data on temperature and precipitation. These historical data monitor large swings in temperatures that are really differences in the weather from year to year. The major difference between weather and climate is that climate is a trend. When you assemble all the yearly weather data, you can find, over-imposed, an average curve that clearly shows that the climate as warmed by 0.6°C since the industrialization (~1°C). It might not seem like much, but it is a much higher rate than the natural average temperature change, this is a clear evidence of climate warming. And this “mild” higher temperature has already induced the melting of ice-sheet and mountain glaciers, resulting in 11 cm of sea-level rise, and recent reports shows that ice is melting in Greenland and Antarctica at markedly accelerated rate. In addition to trends provided from these historical data and clues found in various geological record, one discovery brought the final proof to scientists that fluctuations in CO2 concentrations are even more tightly linked to climate changes than the scientific community was even suspecting. The correlation found in these data is undeniable. The Holly Grail of CO2–induced Climate Change This discovery was made in Vostok, Antarctica, and published for the first time in 1987. The Vostok ice core demonstrated a close link between carbon dioxide and temperature through the last glacial cycle. When you look at the Vostok graph, the upper curve represents the CO2 concentration in parts per million as measured from tiny air bubble from the ice core. Each air bubble captured at one time tiny fraction of “old atmosphere”. The lower curve is the reconstruction of atmospheric temperature from measurements of the isotope oxygen (see chapter on geochemistry for details on this technique). Both curves are plotted against age, thousands of years Before Present, with the present at the far left.
As is clearly visible in the graph, in the past 160,000 years, each increase trend in CO2 in the atmosphere is associated to a period of climate warming, and vice versa.
The Vostok Curves (Image credit: From J.M. Barnola et al., Nature 329 (1987): 408-414, p. 410.)
This is what confirmed that yes, CO2 concentration controls temperature and ultimately sea-level changes. With these new data in mind, let’s come back to our question: Why should the current CO2 concentration increase trouble us now as they have been changing naturally in the past? If you take a second look at the graph, you can read that the natural variations observed for the past 160,000 years ranged from 180 to 300 ppm. And actually, newer data have extended the record to the past 400,000 years, showing the same ranges from 180 to 300 ppm. Well, industrialization and deforestation have raised the CO2 concentration today to an amazing high 370 ppm. This has not happened on Earth since at least 400,000 years. And not surprisingly, as it is predicted by the Vostok’s record, the temperature of the Earth is starting to follow the same trend as our greenhouse gases concentration and is gradually increasing. The question is not anymore Is climate warming?, but it is When and how much? One of the main question scientists have now is why the climate warming is not more intense with level of CO2 that are so high in the atmosphere. Climate modelers are working on simulation by changing the atmospheric CO2 and see how various levels affects atmospheric and ocean temperature. They use value ranging from 100 to 1000 ppm of CO2. Modelers use a pre-industrial CO2 value of 280 ppm. The simulation shows a non-linear increase in temperature following the CO2 increase, showing that Earth reacts strongly to the first changes and than adapts to the new system. Because of this non-linear reaction, the remaining uncertainty for climate warming is how much will the temperature rise, and how fast will the ice-sheet react.
This brings the notion of nature’s feedback to changes. Indeed, we are not sure whether the Earth system will mainly act as an amplifier (positive feedback) or as a buffer (negative feedback), or somewhere in between. Examples of these effects taken from Ruddiman (2008) are the following:
a) Positive feedback: A decrease in the amount of heat energy sent on Earth by the Sun would allow ice to spread across high-latitude regions that were not previously covered. Because the ice reflects far more sunlight than do bare ground, an increase in their extent should decrease the amount of heat taken up by Earth’s surface and further cool the climate in those regions. Or, oppositely, if more energy from the Sun arrives and causes ice sheet to retreat, more sunlight will be absorbed and will create further climatic warming. So positive feedback act as amplifier both ways.
b) Negative feedback: These mute climate changes, and in these cases, some
components of Earth’s climate respond in such a way as to reduce the initial changes.
These feedback factors are extremely complex because they involve the interaction of all entities of Earth’s climate system (see chapter on this topic earlier in this book). So this is definitely the big unknown and scientists are not sure how many of these factors will react, and with which intensity, to mute or accelerate the current warming. So, what do we know for sure? We know that there is a general match between CO2 concentration and ice volume. We know that the temperature is currently warming because CO2 concentrations are increasing in the atmosphere because of human factors. What we do not know is how Earth will react in the future to this increase in CO2 concentration. We do not know how much CO2 concentration will be in the future because some countries such as China are just now starting their own industrial revolution. Will all of the ice sheet melt, or will some buffer mechanisms take place and slow the melting by finding new ways to trap CO2 and remove it from the atmosphere? Some potential reservoirs for CO2 are vegetation, soil, shells or marine organisms, and new rocks. In brief, we know the ice will melt, but we do not know the extant. So what do you think… can we go back to an ice-free World as it once was? Let’s hope not for Louisiana. One thing is certain, if we keep on the current path, there will be far more CO2 released in the atmosphere in the next century than what we currently have, unless we find new technology and change our way of life and become better at conservancy. The warming expected to be associated with such high concentration has not been seen on Earth since the Eocene, a time where ice was absent from the planet, and sea-level was much higher.
Chapter IV: Consequences of climate change on Louisiana Over the life of Earth, sea level has been fluctuating between times of low sea-level (regressions) and times of high-sea level (transgressions), because of natural causes (see previous chapter on tectonic, orbital cycles, and natural green house gases). If sea-level keep rising because of enhanced green house effect, how will Louisiana look? It would look a lot like it used to look during the Eocene, when our state was part of the sea-floor. Some of the proofs are in the Louisiana fossil record. Fossils of giant whales (Basilosaurus – we are proud to report that we have one of the most complete specimen of this whale in our collections at LSU) can be found in the region of Shreveport, indicating that our Gulf coast border used to be way up North, and Louisiana was under water. If Antarctica was to melt today, global sea-level would change by approximately 100 meters. We are far from this happening, but a small 6-meter rise would be sufficient to have Louisiana coastline migrate to Baton Rouge.
LANDSAT 7 satellite images of Louisiana’s coastline. On left: southern Louisiana today. On right: Digital elevation model showing the expected north migration of coastline if the global sea-level were to rise by only 6 feet. (Image credit: Michael Blum, LSU)
Sea level rise will initiate several negative effects.
1. Many low-lying Gulf Coast lands will become inundated with water. Among the first to be affected will be the Florida Keys and other barrier islands. Flooding may drive people from homes and businesses in coastal cities such as Houston, Biloxi, Mobile, New Orleans, and Tampa. The cost of battling the onslaught of the sea will be enormous; options will include raising homes and buildings off the ground and building dikes, sea walls, elevated beaches and artificial barrier islands.
2. Some wetland habitats such as estuaries, salt marshes, mangrove swamps, freshwater marshes, and bogs will diminish, be partially displaced inland, or
completely disappear. These habitats are home to many species of small animals, nesting or resting sites for migratory birds, and nurseries for a variety of fish and shellfish species. The fishing industry will be severely affected by the loss of these wetlands.
3. People living in coastal areas that depend on groundwater as a source of drinking water will find their water supply tainted as salt water seeps into coastal aquifers.
Weather extremes may increase.
1. The number and severity of tropical storms and hurricanes in the Gulf of Mexico may increase.
2. Forest fires may increase as drought makes the soil dry and vegetation brittle. 3. Winter storms resulting from the collision of air masses may increase in number
and severity. When most, warm air from the Gulf of Mexico collides with a cold, polar-northern front, blizzard conditions result.
Agriculture patterns will change.
1. Higher atmospheric temperatures will cause more evaporation of water from lakes, rivers, oceans, and the soil. In areas where water bodies are few, the evaporation will lower water tables, deplete aquifers, and result in periods of severe drought. The opposite will occur in areas where surface water is abundant. Increased evaporation will produce more clouds, rain, and increased incidence of flooding.
2. Many of the crops that clothe and feed people – cotton, soybeans, corn, wheat, rice – are sensitive to changes in temperature and precipitation As climate patterns change, the yield of these crops will decline.
3. Less land will be available for agriculture as sea level rise and flooding inundate and erode coastal river delta crop lands.
Biodiversity will decline as more species become threatened, endangered, and extinct.
1. A warming global climate will cause a change in the distribution of species. Forests will move away from the equators, toward the poles – some coniferous forests may become deciduous forests, while some deciduous forests may be replaced with grasslands. As the dominant vegetation in a habitat changes, so do the type of animal species that inhabit it.
2. As oceans warm, current patterns and the distribution of marine life will change. Some organisms will die in the warmer water. Coral reef communities will be hard hit for two reasons. First, the survival of the tiny coral animals, which build the reef, depends on a symbiotic relationship with certain algae. When water temperature rises, the coral expel the algae and eventually die. Second, rising sea level will cause the water to become deeper over the reef. This will prevent the penetration of light required by algae for photosynthesis. (The algae provide food for the coral). Coral reefs provide habitat for about a third of the ocean’s tropical fish and other marine organisms. Thus, as the coral in the Gulf of Mexico decline, so will the entire reef community; this, in turn, will affect the commercial fishing industry.
3. Insect species will possibly benefit from global warming, for fewer will freeze during the winter. That means that more insects will survive to destroy crops and spread diseases such as malaria, yellow fever, and encephalitis.
For your information, here are some summary facts concerning global warming: The IPCC, in their 3rd assessment report published in 2001 came to the following conclusions about 20th century climate: • global average surface temperature has increased by 0.6ºC • snow and ice cover has reduced by 10% • global average sea level has risen by 0.2 m • CO2 has increased by 31% since 1750 • CH4 has increased by 151% since 1750 • greenhouse gas concentrations are the highest they have been in the last 400,000 years (from ice core evidence) • present changes in climate have not occurred naturally in the past • present warming is not part of the natural climate cycle • warming is a result of human activities. The current and predicted increases in temperature and greenhouse gases will take Earth’s climate back to the same conditions that existed in the greenhouse world over 34 million years ago – a time when Antarctica did not have an ice sheet. Even with sustained warming for the next 200–300 years, major loss of Antarctica’s ice would probably take thousands of years. However, scientists are growing increasingly concerned about the future stability of the smaller West Antarctic Ice Sheet that could collapse much sooner than the larger more stable East Antarctic Ice Sheet. Could this happen in the next few hundred years? We don’t know, but let’s just look at the recent situation. Louisiana's coast is disappearing at a rate of 25 square miles per year, the equivalent to losing over a football field every 38 minutes! In the past 70 years, more than 1,900 square miles of coastal Louisiana have been lost. So, if even only the smallest Antarctic ice sheet, the West Antarctic Ice Sheet (WAIS), that contains 3,840,000 cubic kilometers of ice volume, was melting, sea-level would rise by 5m, and the present day coastline would move more than 20 miles inland – that’s enough to drown a large part of Louisiana! If scientific data and model-driven prediction, or the melting of polar ice-cap, and collapse of entire block of the Antarctic ice-sheet are not enough proofs that climate warming is happening, the almost complete destruction of one of the US greatest cities, New Orleans, should hopefully force our policy makers to start enforcing this issue. The short-term answer to save our coast and our fishing and tourism industries is to build higher levees, moving population up North to higher ground, and redirect our economy to other domain. But the immediate action needed is to have a global plan to reduce deforestation and CO2 emission. This has to happen today while scientists and engineers are looking for ways to sequestered CO2 – the holly grail today. Iceland is the pioneer in this endeavor, and if they succeed, they will give the world a mean to survive by reducing atmospheric CO2 until emissions are under control.
Chapter V: How to become a better Earth citizen and help fight global warming Ok, so, if you are not a policy makers, the CEO of a major oil company, or a scientist on the verge of finding the best bio-fuel or a way to sequester CO2, but there are still actions you can take. Your action can help slow down the crisis and give more time to the scientific community, policy makers, and industrials to adapt without creating an economical crisis. We selected a few “no-brainer” actions from an article published in Times (04/09/2007). The selection is based on what is easily done in a State such as Louisiana. These little tips can really make a difference and are easy to adopt in our State.
1. Get a nice reusable grocery back and stop using plastic bags 2. Recycle, recycle, recycle… we can’t emphasize this enough (paper, cans, glass) 3. When you leave your house in the morning, turn down the AC 4. In the wonderful Louisiana’s Fall and Spring, do you really need AC? 5. Turn off all unused appliances (computers, Ipods, TV, radio, etc.) 6. Turn off all lights when leaving your house or work place 7. Change your light bulb to fluorescent light bulb 8. Collect rainwater and use it for gardening, car washing, etc. 9. Plant trees in your yard and in your community 10. Plant a bamboo fence (large bamboo are great to absorbs CO2) 11. Plant a vegetable garden 12. Buy vintage clothing 13. Bike or walk to school, the grocery store and work when you can 14. Adopt the 20-minute rule – live close to your work, schools, stores, etc. 15. Buy a car that will give you better mileage, and carpool 16. Buy energy-efficient appliances 17. Better insulate your house 18. Limit the use of AC, and in the Spring and Fall, open your windows 19. Buy the fresh produce at local farmers market 20. Buy local brand (coffee, water, etc.) to avoid transportation costs (fuel and CO2) 21. Limit the use of electric tool (i.e., rake leaves by hand – plus it’s a good exercise)
Thank you for doing your part.
Chapter VI: Schools activities
Group 1: Activities on Sea Level Change Note to Diane: I try to think of good groupings of activities so that we touch on all domains. Here are ideas below. I also just pasted the old activity into some of the grouping and added some titles… Consequences of sea-level changes on humans The activity we did at Polar Palooza with play-doh as land and town, and ice melting. Tim will send his text for this.
Consequences of climate changes on food-web Diane, as we are in Louisiana, we should do something showing how hurricanes affect the fisheries, aquaculture in coastal Louisiana. I’m sure one of your colleagues have a good story and pictures on that (oyster, etc.) and maybe your student could create an activity around this?
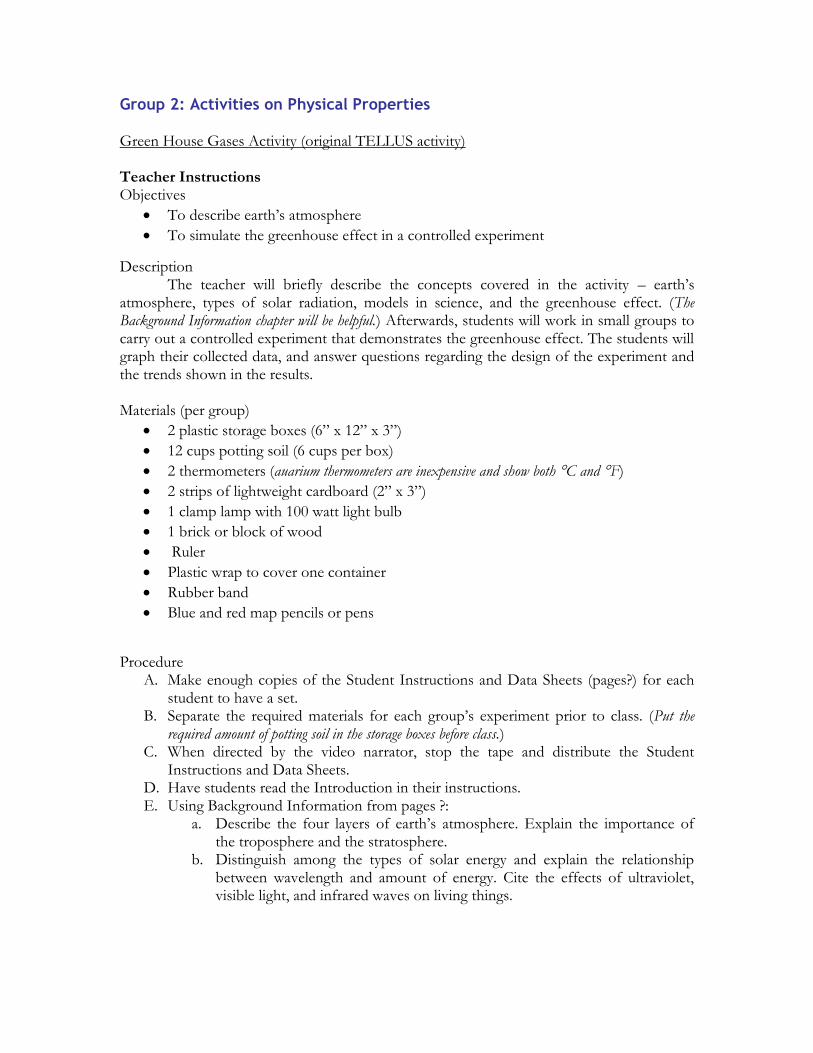
Group 2: Activities on Physical Properties Green House Gases Activity (original TELLUS activity) Teacher Instructions Objectives
To describe earth’s atmosphere
To simulate the greenhouse effect in a controlled experiment
Description The teacher will briefly describe the concepts covered in the activity – earth’s atmosphere, types of solar radiation, models in science, and the greenhouse effect. (The Background Information chapter will be helpful.) Afterwards, students will work in small groups to carry out a controlled experiment that demonstrates the greenhouse effect. The students will graph their collected data, and answer questions regarding the design of the experiment and the trends shown in the results. Materials (per group)
2 plastic storage boxes (6” x 12” x 3”)
12 cups potting soil (6 cups per box)
2 thermometers (auarium thermometers are inexpensive and show both C and F)
2 strips of lightweight cardboard (2” x 3”)
1 clamp lamp with 100 watt light bulb
1 brick or block of wood
Ruler
Plastic wrap to cover one container
Rubber band
Blue and red map pencils or pens
Procedure A. Make enough copies of the Student Instructions and Data Sheets (pages?) for each
student to have a set. B. Separate the required materials for each group’s experiment prior to class. (Put the
required amount of potting soil in the storage boxes before class.) C. When directed by the video narrator, stop the tape and distribute the Student
Instructions and Data Sheets. D. Have students read the Introduction in their instructions. E. Using Background Information from pages ?:
a. Describe the four layers of earth’s atmosphere. Explain the importance of the troposphere and the stratosphere.
b. Distinguish among the types of solar energy and explain the relationship between wavelength and amount of energy. Cite the effects of ultraviolet, visible light, and infrared waves on living things.
c. Describe how infrared radiation reacts with greenhouse gases to warm the air around the earth – the greenhouse effect. (Use a transparency of the diagram shown on page ? of the Background Information.)
F. Explain the significance of models in science.
A model is a means of describing something by using diagrams, formulas, or representative structures. Examples are road maps, bridges made from toothpicks, and 3-D models of molecules made of wire and jellybeans. When dealing with an object or idea that in reality is very difficult to work with (because it is large, small, or complex), scientists often experiment with models in order to learn more about the phenomenon.
Tell the students that they will be making and using a model of earth’s atmosphere to investigate the greenhouse effect.
G. Following the diagram in the Student Instructions, demonstrate how to set up the experiment. While demonstrating:
a. Ask students to correlate the various parts of the model – light, soil, air, plastic wrap – to the corresponding parts of the earth system – sun, surface of the earth, atmosphere, greenhouse gases.
b. Have students distinguish the experiment setup (covered container) from the control setup (open container).
c. Ask students to predict whether temperatures will vary between the two containers. Have them give reasons for their predictions.
d. Explain how and why the thermometers used in the experiment must be zeroed.
In order to get a true picture of the difference in temperature change between the control and experimental setups, both thermometers must have the same initial reading (room temperature) at the beginning of the experiment. (See letter L below for a description of how to zero the thermometers.)
H. Temperature readings will be taken from both containers every minute for 15 minutes. The teacher will keep track of the time and alert students when to read the thermometers.
I. Divide each class into groups of 4 students each. Each group will choose two persons to read the thermometers (the observers) and two to record data (the recorders).
J. Ask one person from each group to get the materials for the experiment. K. Allow time for the students to set up their equipment. L. Tell students to take an initial temperature reading (time – 0), before covering the
experimental setup with plastic. If the thermometer readings do not agree: a. Determine the difference between the high and low reading. b. Add the difference to the low thermometer’s reading so the initial reading for
both thermometers will be the same. (This is called zeroing the instruments.) c. The number must be added to each reading taken from the low thermometer
throughout the experiment. (Tell the recorders for each group to add the number of degrees for zeroing into each box under the low thermometer on the Data Sheet now, so they will not forget as the experiment progresses.
M. Make sure each group’s experiment is set up correctly. N. Make the classroom as free of drafts and light as possible – close the windows,
window shades, doors, and turn off the lights.
O. At the signal to begin, each group will turn on its light. Alert the class as each minute passes. At each signal, the observer will determine the thermometer’s temperature to
the nearest 0.5C and the recorder will write the temperature in the appropriate box on the Data Sheet.
P. After the experiment is finished, have students within the same group swap data so they have results from both the control and the experimental containers.
Q. Allow time for students to graph their data – control data in blue and experimental data in red – and answer the Summary Questions on the back of the Data Sheet.
R. Call on one of the student from each group to summarize the changes observed during the experiment.
The temperature in each container warms and then levels off. The temperature in the covered container (experimental setup) levels off at a higher temperature. Explain that when the amount of heat and light entering the container is equal to the amount leaving the container, an equilibrium temperature has been reached.
S. Discuss the answers to the Summary Questions at the end of the Data Sheet. T. Continue the video program.
Extension Have students vary the experiment to test the effect of the following:
Moist soil
Soil type – garden soil, sand, and sod (soil and grass).
Increasing the amount of carbon dioxide. (place a dish of marble chips and dilute hydrochloric acid on the soil to produce extra CO2 in the experimental setup; cover both containers with plastic wrap).
Amount of ventilation. (Vary the amount of covering on several containers – one-fourth, one-half and three fourths open.)
[This activity was adapted in part from Session 2: “Modeling the Greenhouse Effect” which is part of Global Warming and the Greenhouse Effect, a GEMS Project published by Lawrence Hall of Science, University of California at Berkely. 1990.] TEACHER KEY – ACTIVITY 1 Data will vary slightly depending on room temperature and type of thermometers used, however, the trend should be similar to the one shown on the table and graph that follow. insert table Summary Questions
1. Why did the temperature rise in both containers? Light and heat energy from the light bulb entered both containers warming the air around the thermometer.
2. Why did the temperature in the container covered with plastic wrap rise higher than the temperature in the open container? The warm air in the open container mixed with cooler air outside the container, but the warm air inside the closed container was separated from the cooler air by the plastic wrap.
3. How was this experiment similar to what happens inside a closed car parked in a sunny location on a cold, winter day?
Light and heat energy from the sun move into the car, but because the windows are closed, the heat energy cannot escape, so the air inside the car becomes warm even though the temperature outside the car is cooler.
4. In this activity you made a model of the earth and its atmosphere. Tell what each of the following parts represented. The light bulb – the sun or solar energy The potting soil – the earth The air in the container – earth’s atmosphere The plastic wrap – greenhouse gases
5. Did your group observe other similarities between the greenhouse model (the covered container) and the real earth’s atmosphere? Condensation collected on the inside surface of the plastic wrap similar to the way water droplets condense in the atmosphere to become clouds – part of the water cycle.
6. Models, though useful, are not perfect examples of the phenomena they represent, because variables are often involved that cannot be represented in the model. In what ways was this model different from the real earth’s atmosphere?
Earth’s atmosphere does not have a solid barrier like the plastic wrap.
The light bulb emitted visible light and infrared radiation; the sun emits these plus cosmic rays, gamma rays, ultraviolet radiation, and radio waves.
Weather conditions such as wind and rain, which are a part of the real earth’s atmosphere.
Student Instructions Introduction Many objects and events (phenomena) studied in science are too small, too large, or too complicated to work with directly. In these cases, scientists often create representations (models) of the phenomenon in question and then experiment with the model to learn more. The greenhouse effect is a phenomenon that occurs in earth’s atmosphere. In this activity you will create a model of earth’s atmosphere in order to investigate this phenomenon. The greenhouse effect involves the interaction between various gases in earth’s atmosphere and a type of radiant energy called infrared waves. Radiant energy from the sun travels through space in waves. The shorter the wavelength of the radiation, the greater its energy. Some types of radiation have so much energy that they can harm or even kill living cells and organisms; gamma radiation and some forms of ultraviolet radiation are in that category. Other types of radiation, such as radio waves, have such long wavelengths (some more than six miles long) that their energy is harmless to organisms. Infrared radiation has wavelengths a little longer than visible light. These rays give a feeling of warmth on our skin. In fact, anything giving off heat – a fire, a hot iron, a toaster, or even your body after strenuous exercise – is emitting infrared radiation. Most of earth’s atmosphere (99 percent) is composed of nitrogen and oxygen. Both of these gases are transparent to infrared radiation, but some gases in the remaining one percent absorb the heat of infrared radiation, thus warming earth’s atmosphere. Because these gases – carbon dioxide, water vapor, nitrous oxide, methane, chlorofluorocarbons
(CFCs), and ozone – trap heat in a manner similar to the transparent panels of a greenhouse, they are collectively called greenhouse gases. Using the following procedure, your group will make a model of earth’s atmosphere and will carry out a controlled experiment that demonstrates the greenhouse effect. Procedure
1. Collect the materials required for setting up the experiment. 2. Select two from the gropu to be observers and two to be recorders. One observer-
recorder team will monitor the control container and the other team will monitor the experimental container.
3. Work together to set up the experiment as shown in the diagram above.
Lay a thermometer on top of the soil in each container so that the numbers can be easily read. Cover the bulb end of each thermometer with a piece of cardboard to protect it from the direct rays of the light bulb.
Adjust the clamp lamp on the brick or block o wood so that the bulb is about 10cm from the surface of the soil.
Once the experiment begins, you will be recording temperature readings to the
nearest 0.5C each minute for 15 minutes – your teacher will keep track of the time and signal when to read the thermometer.
Which container will be the control setup?
__________________________________________
Which container will be the experimental setup?
__________________________________________
What is the temperature on each of your thermometers? (All gropu members should agree on the temperature readings.)
Control Setup __________C
Experimental Setup __________C Both thermometers should have the same reading – room temperature. If they do not agree, determine the difference between the high and low reading.
Difference between high and low readings = __________C Add that number (the difference) to the low reading so the number of degrees recorded on the Data Sheet for both thermometers at the beginning of the experiment is that same – this is called zeroing the instruments. The same number of degrees must be added to each reading taken from the low thermometer throughout the experiment. On the Data Sheet, add the number of degrees for zeroing into each box under the low thermometer, so you will not forget as the experiment progresses.
4. Cover the experimental setup with plastic wrap, then secure the plastic with the rubber band. The control setup will not have a cover.
5. Attach the clamp lamp and bulb to a block of wood or ring stand so the bottom of the bulb is about 10 cm from the top of the soil and centered between the two
containers. Plug the lamp’s cord into the nearest electrical outlet, but DO NOT turn the lamp on.
6. Ask your teacher to check your setup. 7. When all groups are ready, the teacher will give the signal to turn the lamp on. At the
end of each minute, the teacher will signal for the observers to determine the temperature in the containers. The recorders will write the temperature on the Data Sheet.
8. At the completion of the experiment, dismantle the setup and put the supplies in their storage site.
9. Exchange data within your group so each person has all the data for both the experimental and control groups.
10. Graph your data in the space provided on the Student Data Sheet.
The x-axis is for the independent variable (time) and the y-axis is for the dependent variable (temperature).
Use blue and red pens or pencils to distinguish the control data (blue) from the experimental data (red).
11. Answer the Summary Questions on the back of the Data Sheet.
Extension Follow the same basic directions, but vary the experiment by testing on of the following:
Moist soil
Soil type – garden soil, sand, and sod (soil and grass)
Increasing the amount of carbon dioxide (place a dish of marble chips and dilute hydrochloric acid on the soil to produce extra CO2 in the experimental setup; cover both containers with plastic wrap).
Amount of ventilation (one-fourth, one-half and three-fourths open).
insert data sheet
Summary Questions 1. Why did the temperature rise in both containers? 2. Why did the temperature in the container covered with plastic warp rise higher than
the temperature in the open container? 3. How was the experiment similar to what happens inside a closed car parked in a
sunny location on a cold, winter day. 4. In this activity you made a model of the earth and its atmosphere. Tell what each of
the following parts represented.
The light bulb – The potting soil – The air in the container – The plastic wrap –
5. Did your group observe other similarities between the greenhouse model (the covered container) and the real earth’s atmosphere?
6. Models, though useful, are not perfect examples of the phenomena they represent, because there are often variables that cannot be represented in the model. In what ways was this model different from the real earth’s atmosphere.
The greenhouse effect allows the earth to maintain an average temperature warm enough for living things to survive. What would happen if the atmosphere contained more greenhouse gases? Some scientists believe the greenhouse effect is becoming stronger. Continue watching the video to find out more about the enhanced greenhouse effect.
Water Mass Circulation This is an activity presented by Tim McCollum at the Polar Palooza workshop in Baton Rouge. Tim agreed to let us use his activity and will send his text soon.
a) top and, b) side view of water mass stratification based on physical properties of water. Warmer water (red) are lighter and tend to float while colder water (blue) is heavier and sink to the bottom. (Photos credit: a) Sophie Warny, and b) Diane Lindsted).
Water and Ice Physical Properties – the case of the ice cube melting and weight This is an activity presented by one of the Andrill teachers at the meeting in Florida. Good activity to discuss the graph of water’s physical properties (pressure and temperature). I sent an email to this teacher: Kate S. Pound: [email protected] But I have not heard back from her.
Group 3: Activities on getting the data Drilling an ice core… or a mud core. If you live in Louisiana, chances are that drilling an ice core will not be one of the easiest things you can do… but we do have plenty of mud. And the overall concept is the same. Maybe your student could come up with a series of activity to drill a mud core from a lake, or a wet ground around a school, and analyze what is in it???
Group 4: Activities on Reading and Writing
Lafitte’s Island (original TELLUS activity) Teacher Instructions Objectives
To brainstorm possible consequences of global warming
To practice creative writing ckills
Description Students will work in small groups to brainstorm possible consequences to a small
barrier island and its inhabitants should average global temperatures rise by 5F (2C) during the next 50 years. They will use their predictions to write an ending for the scenario described in “Lafitte’s Island.” Someone from each gropu will read the ending to the class. Materials (per group) One copy of the Student Instructions for Activity II – Lafitte’s Island Procedure
A. Make copies of the Student Instructions (pages 25-27) for each group. B. When cued by the narrator, stop the video and divide the class into groups of 4
to 5 students each. C. Ask the students to close their ryes and imagine that they are Jean while you read
the story. (Jean is both a male and female name.) D. Keeping their eyes closed, have the students silently reflect on the story by
considering the following: a. How did the story make them feel? b. Would they like living on Lafitte’s Island? Why? c. What were some of the characteristics of the island that might be
affected by sea level rise? d. How might the peoples’ lives change, if sea level rises?
E. Working within their group, have the students follow the directions in their procedure section:
a. Estimate how much the Gulf of Mexico might rise if there is an average
temperature increase of 5F (2C) over the next 50 years. (This is a hypothetical situation, but students should try to be realistic – advise them to choose between one and twelve feet).
b. Predict how this sea level rise will affect Lafitte’s Island and the people who live there. (Encourage students to reread the story for ideas.)
c. Write a description of the daydream that includes possible consequences to the island and its inhabitants. Bring Jean back to the present and relate a possible course of action in response to his/her futuristic thoughts.
d. Have each group choose one person to read the ending to the class. If time permits, groups could act out rather than read the ending.
F. Return to the video for the remainder of the program.
Student Instructions Imagine that you are a teenager who lives on a barrier island along the coast of the Gulf of Mexico. Your name is Jean. Your family has lived on this sandy, marsh island since your great-great grandparents settled here in the late 1800s. Your family members are not the only inhabitants of the island. Your village has a population of 556 people. The island is 20 miles long and 5 miles wide. At its highest point, it is only four feet above sea level. The water surrounding the white-sand island is clear and has a deep blue color. A coral reef teeming with anemone, starfish, sponges, and a huge variety of tropical fish has formed atop several sunken oil platforms. This artificial reef borders the gulf side of the island. On the mainland side, the land curves inward to form a quiet lagoon frequented by playful dolphins and, occasionally, sea turtles. Weather on the island is usually warm and breezy – even during the winter, there are very few cold days. The air is humid and smells of the salty, gulf spray. Tropical storms and hurricanes come in the summertime and fall, but the village people have learned, through the years, to prepare for the strong winds, waves, and rain. Damage can usually be repaired within a few days after a hurricane passes. The island is so beautiful and rich in biodiversity that tourism has begun to grow. People boat to the island for snorkeling, sunbathing, picnicking, and shopping for crafts. In fact, the island has become so popular that the state is planning to build a bridge to connect the island to the mainland. Presently, the only way to the mainland is by ferry, by private boat, or in emergencies, by helicopter. Small as the island is, it has provided a means of livelihood for the village for many generations. With the exception of a few storeowners, most families make a living by fishing the coral reef, lagoon, and bay waters. When not in school, you help your dad set crab traps, gig in the lagoon for flounder, and trawl for shrimp and fish. He sells most of the catch on the mainland at the fish market. The remainder becomes gumbo, etoufee, or bisque in the family’s stock pot. Modern conveniences such as radios, televisions, and bicycles are purchased on the mainland with money made from fishing. Vegetables for the family are grown in a community garden located in the center of the island, where the saltwater rarely intrudes. Several people from the village make reed baskets from the smooth cordgrass that grows on the bayside of the island. Tourists are eager to buy these baskets when they visit the island. The growth of plants on the island depends on freshwater from daily afternoon showers. The people of the village also depend on these showers, because the rain keeps the island’s pond and cisterns are the source of fresh water for the entire village. The pond also provides habitat for frogs, freshwater fish, and wading birds. During the spring and fall, many colorful migratory birds stop along the grassy edge of the pond to rest and eat as they fly to and from nesting sites on the mainland. Experiences on the island teach you many things about life, but you must also go to school. Nine months out of each year you and your friends climb aboard a ferry at 6 am in the morning to make the 8 mile trip to a school on the mainland. There, you learn history, math, science and English. You also learn about ways the world is changing. Every village is not exactly like yours. Further inland, there are huge cities. People zoom by in automobiles, driving hurriedly to and from work and shopping. Airplanes fly through the sky, taking people to and from far away places. Factories smoke with activity, producing all sorts of modern conveniences – appliances, plastics, gasoline, and fertilizer. Even the fields between cities are
full of activity as tractors plow and plant row after row of crops such as cotton, soybeans, corn, and rice. Yes, life on the mainland is quite different from life on the island. Although you enjoy learning about city life, you are most happy back on the island. After school and on weekends, your time is spent mending nets, washing down boats, laughing with friends, and searching for treasures that might have washed up on the beach. Life on the island is slow paced, peaceful, predictable, and safe. But that, too, may be changing. You have learned at school that the average global temperature is rising. Some scientists are predicting that, as the temperature rises, polar ice will begin to melt into the ocean and seawater will warm. Both of these events will cause the sea level to rise, covering more land. Some scientists are also predicting htat hurricanes will occur more often and with more severity in the Gulf of Mexico. Because you live on an island, sea level rise could threaten your whole way of life. You begin to read books and watch television programs concerning this global warming trend. One afternoon on the boat ride home from school, you begin to daydream…
What if earth’s average temperature does rise 5F by the middle of the next century? How will this affect Lafitte’s Island? What will life on the island be like then? Procedure
1. Estimate how much sea level will rise (choose a number between 1 and 12 feet) if the
average global temperature increases by 5F during the next 50 year period. ____________________________________
2. Using your estimate as a guide, answer the following questions about possible changes to Lafitte’s island.
a. How might some of the island’s physical characteristics (amount of land, location and amount of salt and fresh water, type of weather) change?
b. How will plant species be affected? c. How will animal species be affected? d. How will the change affect recreating (swimming, sailing, picnicking, etc.)
and tourism? e. Will the fishing industry be affected? How? f. Will Jean’s community be more crowded than it is now? Why?
3. Using your responses to these questions plus any other ideas discussed in your group, write a description of Jean’s daydream in the space provided below. At the end of the daydream, bring Jean back to the present, and relate what course of action could be taken in response to his/her futuristic thoughts.
4. Choose one person from your group to read Jean’s daydream to the class. (If time permits, your group may choose to act out the daydream.)
insert Geologic Timetable
EVALUATION QUESTIONS Multiple choice – Select the BEST answer for each statement.
1. the phenomenon that explains how certain gases trap heat in earth’s atmosphere is called the
a. hot house syndrome b. hydrologic cycle c. greenhouse effect d. thermal incline
2. which area on the graph below represents a glacial (ice age) period? a. A b. B c. C
3. Infrared radiation is a. Felt as heat b. A type of solar radiation c. Absorbed by greenhouse gases d. All of the above
4. Which of the following situations might cause the earth’s climate to warm? a. Earth tilts on its axis away from the sun b. The amount of atmospheric oxygen increases c. The amount of carbon dioxide dissolved in the ocean increases d. Chlorofluorocarbon (CFCs) levels in the atmosphere increase
5. Water vapor is considered a greenhouse gas because it a. Absorbs heat b. Condenses to form clouds that, in turn, prevent some solar radiation from
reaching earth c. Is part of the water cycle d. Combines with sulfur dioxide in the atmosphere to form sulfuric acid
6. The graph below shows a. The greenhouse effect b. What the temperature will be in the year 2000 c. An increase in the average global temperature during the last 100 years d. That global warming is being caused by an increase in atmospheric carbon
dioxide. 7. Deforestation is the mass removal of trees from an area. Deforestation contributes
to global warming by a. Reducing the amount of oxygen produced during photosynthesis b. Increasing the amount of carbon dioxide released during respiration c. Reducing the amount of carbon dioxide used by trees for photosynthesis d. Increasing the amount of water vapor released into the atmosphere during
transpiration. 8. The layer of the atmosphere where weather – rain, snow, wind, hurricanes – occurs
is called the ____. a. Thermosphere b. Mesosphere c. Stratosphere d. Troposphere
9. Ozone in the upper atmosphere protects the earth from the harmful effects of
a. Ultraviolet radiation b. Visible radiation (light) c. Infrared radiation d. Radio waves
10. Which layer of the atmosphere contains the protective ozone shield a. Thermosphere b. Mesosphere c. Stratosphere d. Troposphere
11. Besides coal, another example of a fossil fuel is a. Geothermal heat b. Wind c. Natural gas d. Sunlight
12. If used more often, which energy source listed below could help reduce the amount of carbon dioxide accumulating in the atmosphere?
a. Electricity b. Sunlight c. Gasoline d. Coal
13. The Gulf Coast mainland is protected from the full force of hurricanes by natural formations that form parallel to the shoreline. They are called
a. Barrier islands b. Levees c. Sea walls d. Spoil banks
Use the diagram and chart below as a reference in answering questions 14 and 15. insert chart and diagram
14. The highest temperature was recorded at a. Noon, outside the greenhouse b. Noon, inside the greenhouse c. 2 pm, inside the greenhouse d. 2 pm, outside the greenhouse
15. at what rate did the temperature rise inside the greenhouse between 10 am and noon?
a. 1 C/hour
b. 2C/hour
c. 3C/hour
d. 4C/hour
Short Answer – Using your best writing skills – spelling, punctuation, grammar – respond to the following statements.
1. Explain the similarities between earth’s atmosphere and a greenhouse. 2. Name three possible consequences of global warming and climatic change.
a. b. c.
3. Describe three actions that you, as an individual, can take to reduce greenhouse gases in the atmosphere.
a. b. c.
Evaluation Answers Multiple choice
1. C 2. B 3. D 4. D 5. A 6. C 7. C 8. D 9. A 10. C 11. C 12. B 13. A 14. C 15. B
Short Answer 1. Similarities between earth’s atmosphere and a greenhouse include:
The glass (plastic) panels of a greenhouse an earth’s atmosphere are both transparent to solar radiation (sunlight).
Light that hits plants and soil in the greenhouse is absorbed and then emitted as infrared radiation; the same phenomenon occurs as light hits earth’s surface, objects, and living things.
The air inside a greenhouse is warmer than the air outside because infrared radiation is trapped inside by the glass panels of the greenhouse. In a similar way, the air around the earth is kept warm because carbon dioxide and other greenhouse gases absorb infrared radiation (heat), preventing its escape into outer space.
2. Possible consequences of global warming and climatic change include: (Refer to Background Information for further explanation.)
Sea level rise will cause flooding, loss of wetland habitats, and saltwater intrusion into drinking supplies.
Severe weather may increase – tropical storms, hurricanes, winter storms, and drought.
More forest fires will occur during droughts.
Agriculture patterns will change.
Biodiversity will decline. 3. Many individual actions can help reduce greenhouse emissions. Refer to the Background
Information on page ? for possible answers.
References The following books, pamphlets, and journal articles were used in producing the original Tellus climate change module, and this new revision. Adler, Tina. “As the Globe Warms, Keep An Eye on Storms,” Science News, January 7,
1995. Vol. 147, No. 1, page 7. Baskin, Yvonne, Ecologists Put Some Life Into Models of a Changing World.” Science,
Vol. 259, March 1993, page 1694. Beat the Heat: The CO2 Challenge, Scholastic, Inc. 1992. Canning, Douglas J., “Global Climate Change and Sea Level Rise,” Current, Vol. 10. No.
3, 1991, pp. 8-12. CFCs, the Environment and the Search for Solutions, Freon Products Division, Du Pont
Company B-13229, Wilmington, DE 19898, (302) 774-2099. Free publication. Curtis, Helena and N. Sue Barnes, Biology, Fifth Edition. Worth Publishers, Inc. New
York. 1989. “Energy Conservation: A Cure for the Greenhouse Effect?” Texas Energy and Mineral
Resources, Texas A&M University, Vol. 15, No. 3, April-May 1989. “Future Conditional: Global Climate Change,” Resources for the Future, 1616 P
Street, MW. Washington DC 20036 (202) 328-5000. (28 minute videotape). Global Warming, Bay Area Air Quality Management District, 939 Ellis Street, San
Francisco, CA 94109 (415) 771-6000. 1991. Free publication. Global Warming: Fact or Fiction, Louisiana Sea Grant College Program. Louisiana
State University, Baton Rouge, LA 70803-7507, (504) 399-6448 (?) Global Warming: Meeting a Global Challenge Through Individual Action, National
Audubon Society, Schlitz Audubon Center, 1111 East Brown Deer Road, Milwaukee, WI 53217.
Golden, Richard and Cary Sneider, “The Greenhouse Effect in a Vial,” The Science Teacher, May 1989, page 57.
Hocking, Colin, Cary Sneider, John Erickson, and Richard Golden, Global Warming and the Greenhouse Effect, GEMS, Lawrence Hall of science. 1990. University of California, Berkeley, CA 94720. (415) 642-7771.
How the Weatherworks, 1995 Catalog. 1522 Baylor Avenue, Rockville, MD 20850. Johnson, Rebecca L., The Greenhouse Effect: Life on a Warmer Planet. Lerner
Publishing Co. Minneapolis, MN, 1990. McQuaid, John, “Oceans of Trouble,” The Times Picayune, New Orleans, LA. Sunday,
March 24, 1996. A-37 – A-44 (A special 7-day series.) Miller, G. Tyler, Jr. Living in the Environment, Eighth Edition, Wadsworth Publishing
Co. Belmont, CA, 1994. Motavalli, Jim. “Some Like It Hot,” E the Environmental Magazine, Vol VII, No. 1,
February 1996. Monastersky, Richard, “Health in the Hot Zone,” Science News, Vol. 149, April 6,
1996, pages 218-219. Rosenthal, Dorothy B. and Richard Golden, Global Warming, Climate Protection
Institute: a project of Earth Island Institute, San Francisco, CA, 1991. Ruddiman, William, F., 2008. Earth’s Climate Past and Future. Second Edition. W. H.
Freeman and Company, New York, 388 pp.
Stanley, Steven, M., 2005. Earth System History. Second Edition. W. H. Freeman and Company, New York, 567 pp.
Scientific Assessment of Climatic Change, IPCC, 2001 reports. Wallace, Robert A., Jack L. King, and Gerald P. Sanders, Biology The Science of Life,
Second Edition. Scott, Foresman and Co. Glenview, IL, 1986.