36
What is RISK? Robin Autenrieth, Professor Dept. of Civil Engineering Dept. of Env. & Occup. Health Summarized by Priscilla Metting And Richard Powers
| Date post: | 20-Dec-2015 |
| Category: |
Documents |
| View: | 220 times |
| Download: | 1 times |
What is RISK?
Robin Autenrieth, ProfessorDept. of Civil Engineering
Dept. of Env. & Occup. Health
Summarized byPriscilla Metting
And Richard Powers
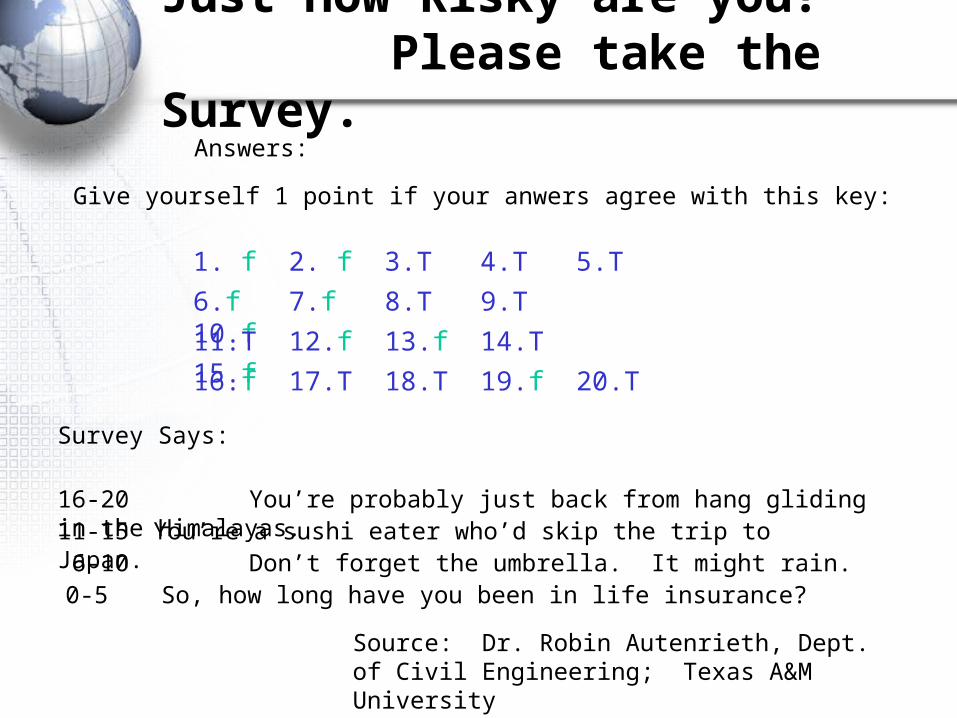
Just How Risky are you? Please take the Survey.
Answers:
Give yourself 1 point if your anwers agree with this key:
1. f 2. f 3.T 4.T 5.T
6.f 7.f 8.T 9.T 10.f
11.T 12.f 13.f 14.T 15.f
16.f 17.T 18.T 19.f 20.T
Survey Says:
16-20 You’re probably just back from hang gliding in the Himalayas.11-15 You’re a sushi eater who’d skip the trip to Japan. 6-10 Don’t forget the umbrella. It might rain.0-5 So, how long have you been in life insurance?
Source: Dr. Robin Autenrieth, Dept. of Civil Engineering; Texas A&M University
Risk
• possibility of loss or injury • the degree of probability of such
loss (Webster's dictionary online)
Risk
• Since risk means the the degree of probability of an injury or loss; it follows that risk can be quantified
• Often to a very
precise degree
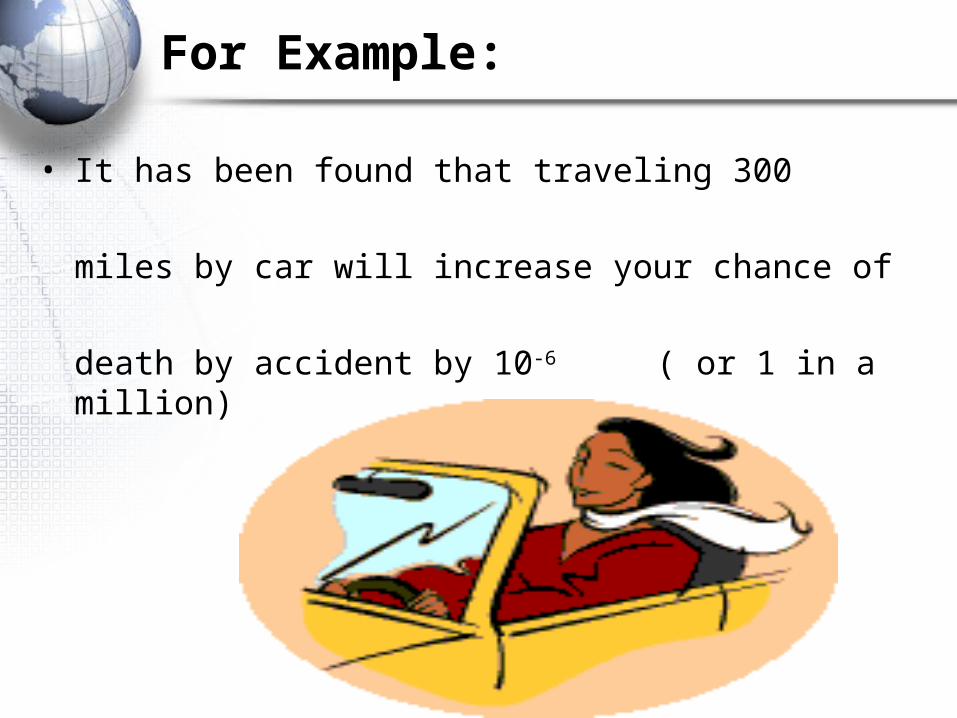
For Example:
• It has been found that traveling 300
miles by car will increase your chance of
death by accident by 10-6 ( or 1 in a million)
Which of these activitieswould cause you to increase your risk of dying by 10-6 ?
Traveling 300 miles by jet
Traveling 6 minutes by canoe
Spending 1 hour in a coal mine
Which of these other activities increase your risk of death by accident by 1 in one million? (cont.)• Traveling 1000 miles by jet would increase
your chances of dying in an accident by 1 in a million, but traveling 300 miles would increase it less than that. So, in terms of risk of death, flying is safer than driving.
Which of these activities would cause you to increase your risk of dying by 10-6? (cont.)
• Traveling 6 minutes by canoe is the correct answer.
• Believe it or not your risk of dying as a result of an accident is greater spending just a few minutes in a canoe than it is flying from San Antonio to Harlingen and back.
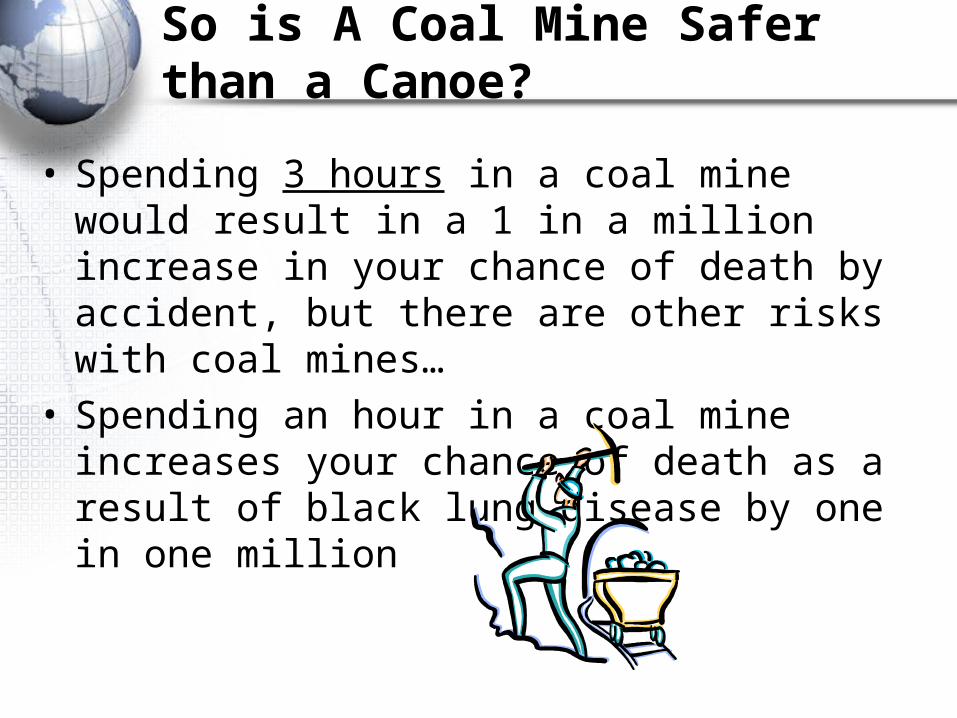
So is A Coal Mine Safer than a Canoe?
• Spending 3 hours in a coal mine would result in a 1 in a million increase in your chance of death by accident, but there are other risks with coal mines…
• Spending an hour in a coal mine increases your chance of death as a result of black lung disease by one in one million
Which of these is more risky?
• Living 2 days in New York City or Boston
• Living with a cigarette smoker for 2 months
• Living within 20 miles of a nuclear power plant for 20 years
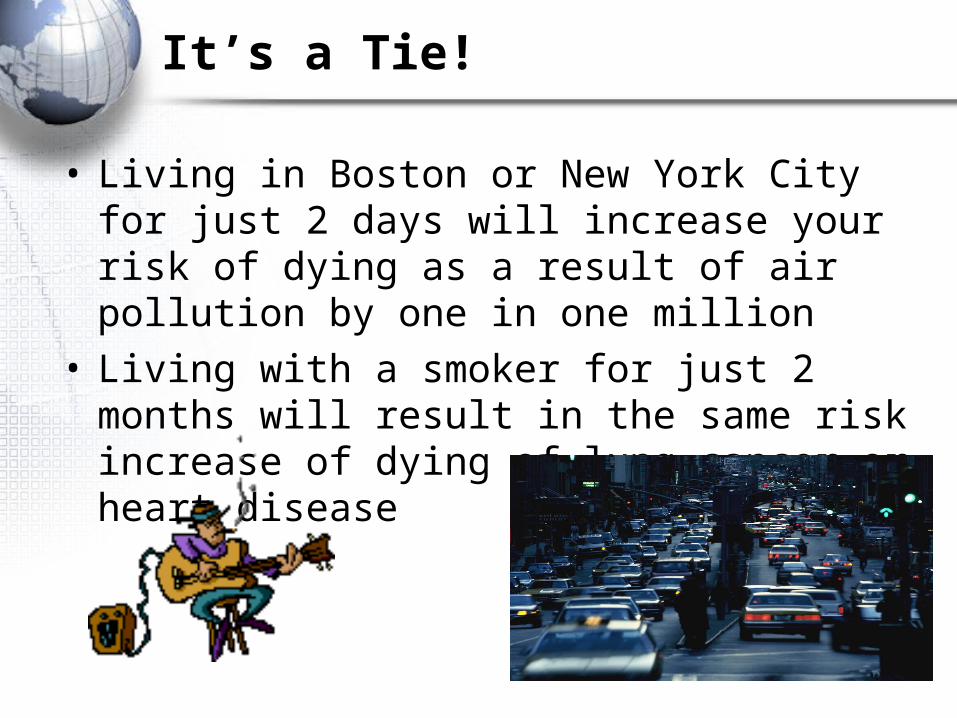
It’s a Tie!
• Living in Boston or New York City for just 2 days will increase your risk of dying as a result of air pollution by one in one million
• Living with a smoker for just 2 months will result in the same risk increase of dying of lung cancer or heart disease
What about the Nuclear Power Plant?
• You would have to live within 20 miles of a nuclear power plant for 150 years to increase your risk of dying by cancer caused by radiation by as much as living in New York or Boston for 2 days or living with a smoker for 2 months
• You’ll probably be dead in
150 years anyway!
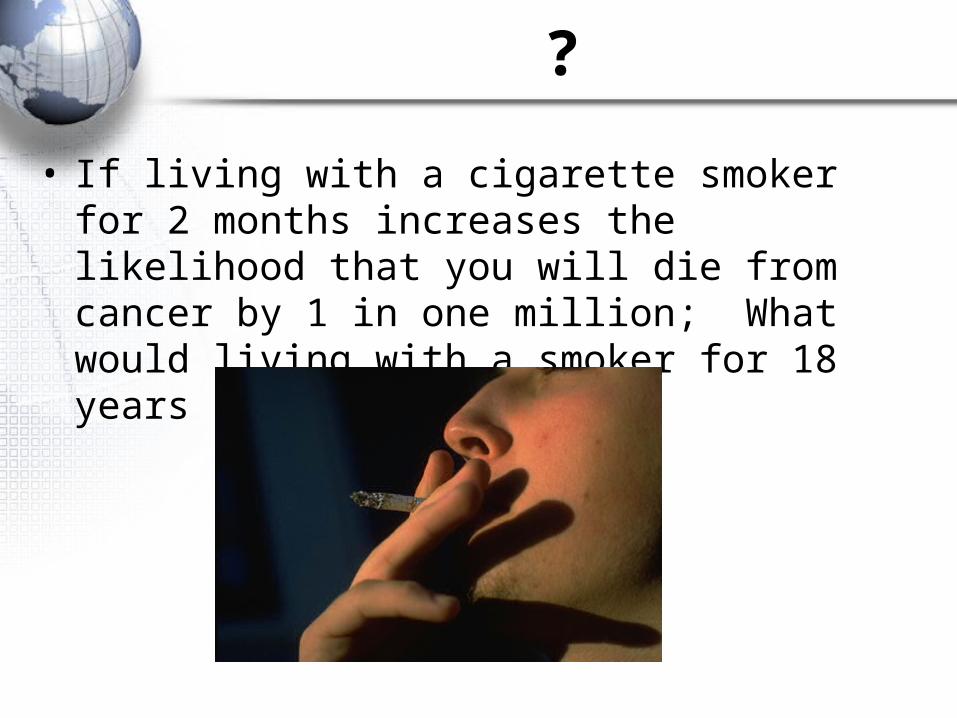
?
• If living with a cigarette smoker for 2 months increases the likelihood that you will die from cancer by 1 in one million; What would living with a smoker for 18 years do to your chances?
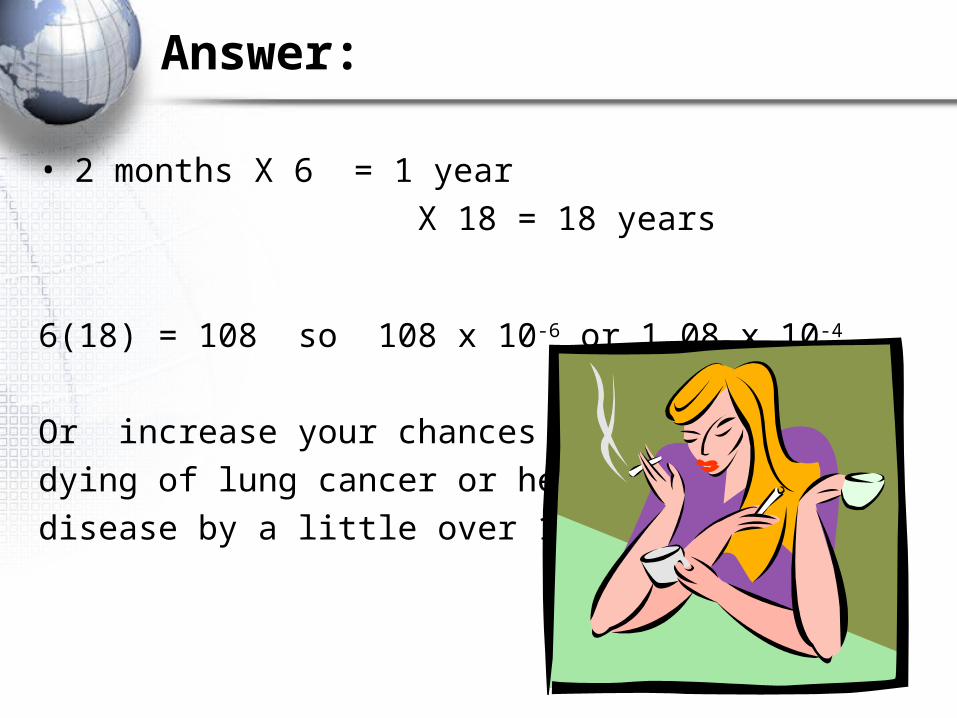
Answer:
• 2 months X 6 = 1 year
X 18 = 18 years
6(18) = 108 so 108 x 10-6 or 1.08 x 10⁻⁴
Or increase your chances of
dying of lung cancer or heart
disease by a little over 1/10,000
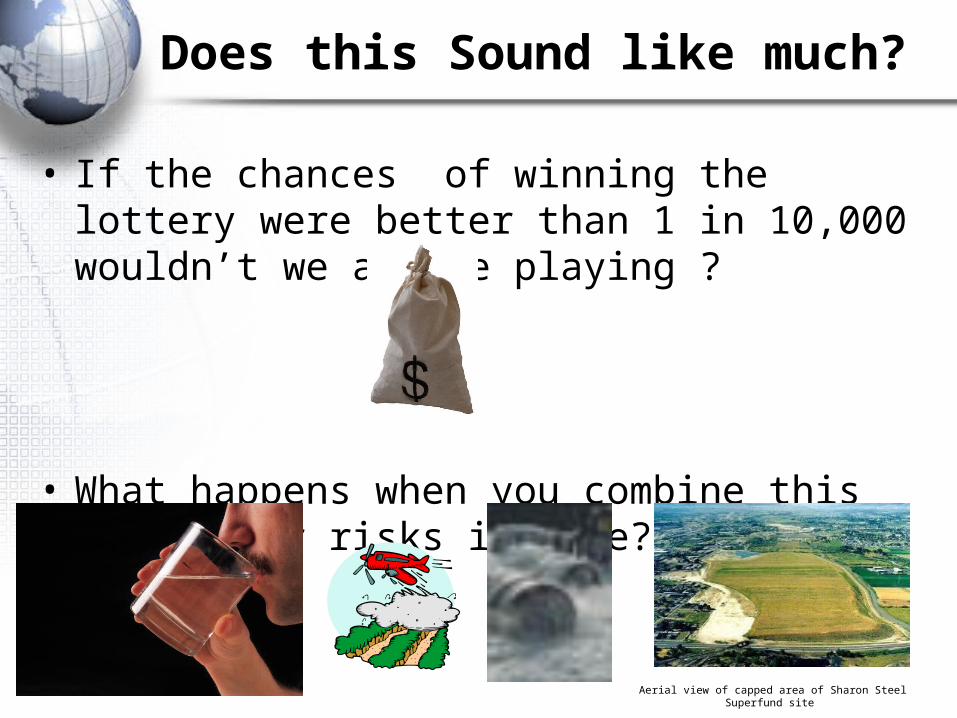
Does this Sound like much?
• If the chances of winning the lottery were better than 1 in 10,000 wouldn’t we all be playing ?
• What happens when you combine this with other risks in life?
Aerial view of capped area of Sharon Steel Superfund site
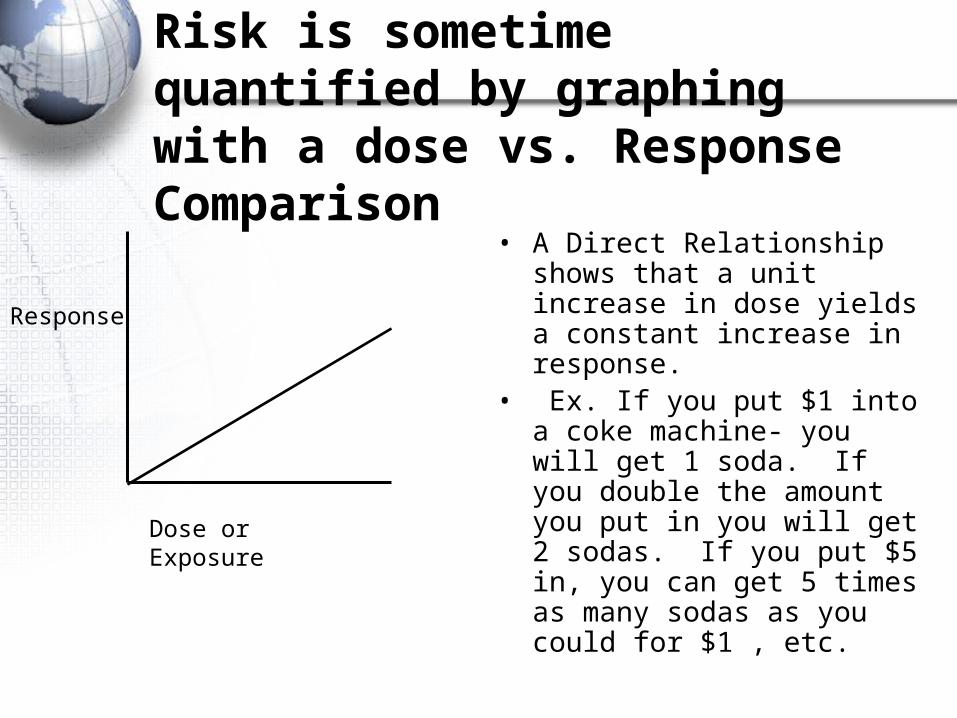
Risk is sometime quantified by graphing with a dose vs. Response Comparison
Response
• A Direct Relationship shows that a unit increase in dose yields a constant increase in response.
• Ex. If you put $1 into a coke machine- you will get 1 soda. If you double the amount you put in you will get 2 sodas. If you put $5 in, you can get 5 times as many sodas as you could for $1 , etc.
Dose or Exposure
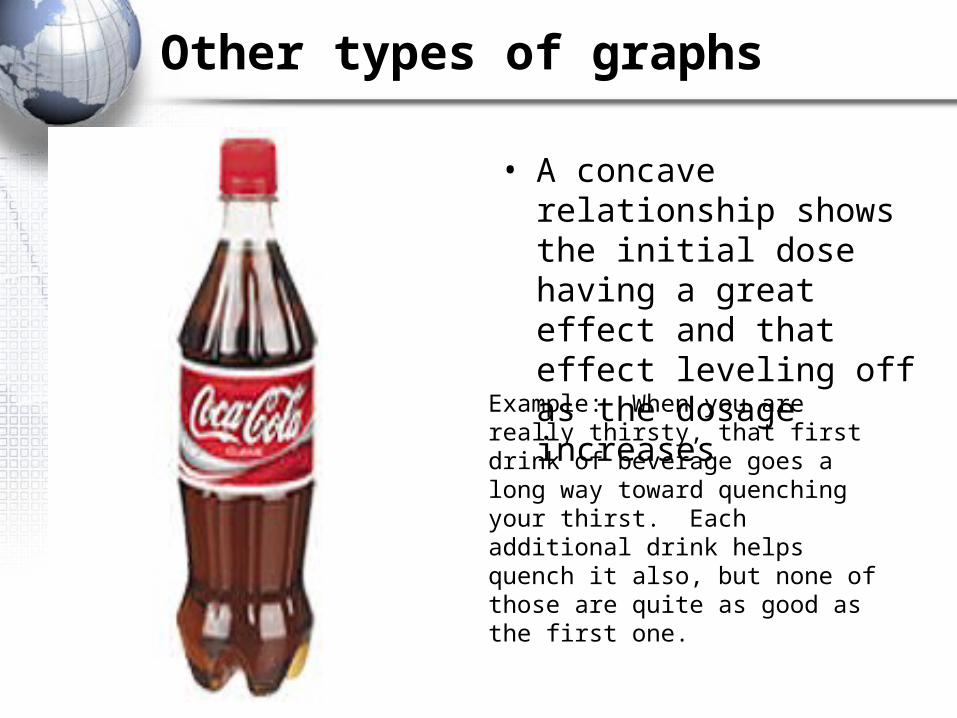
Other types of graphs
• A concave relationship shows the initial dose having a great effect and that effect leveling off as the dosage increases
Response
Dose or Exposure
Example: When you are really thirsty, that first drink of beverage goes a long way toward quenching your thirst. Each additional drink helps quench it also, but none of those are quite as good as the first one.
Types of Graphs
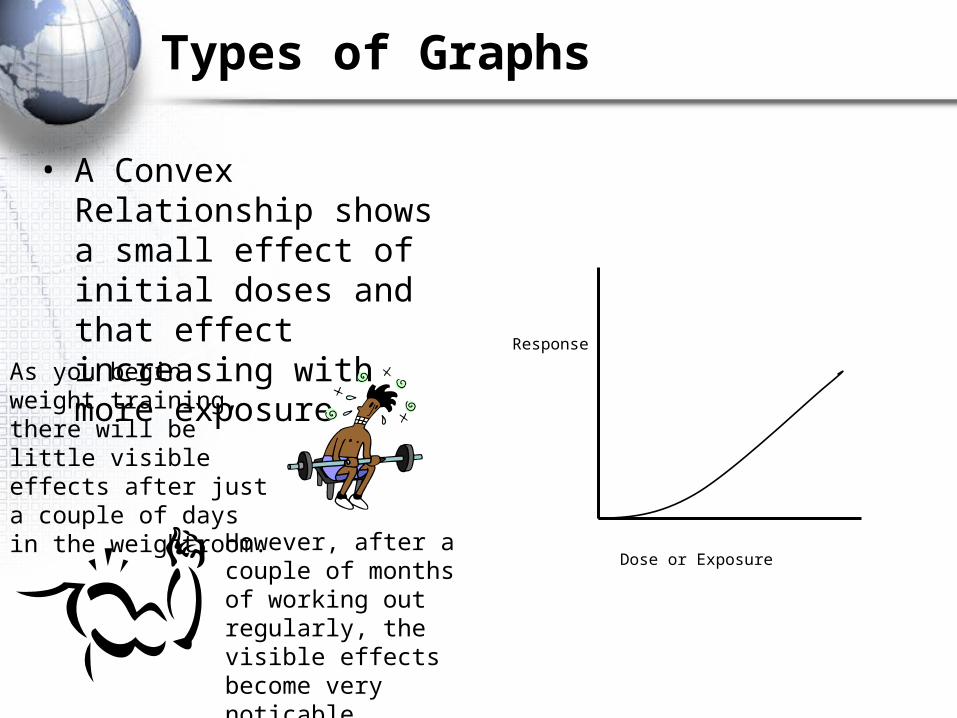
• A Convex Relationship shows a small effect of initial doses and that effect increasing with more exposure Response
Dose or Exposure
As you begin weight training, there will be little visible effects after just a couple of days in the weightroom.
However, after a couple of months of working out regularly, the visible effects become very noticable
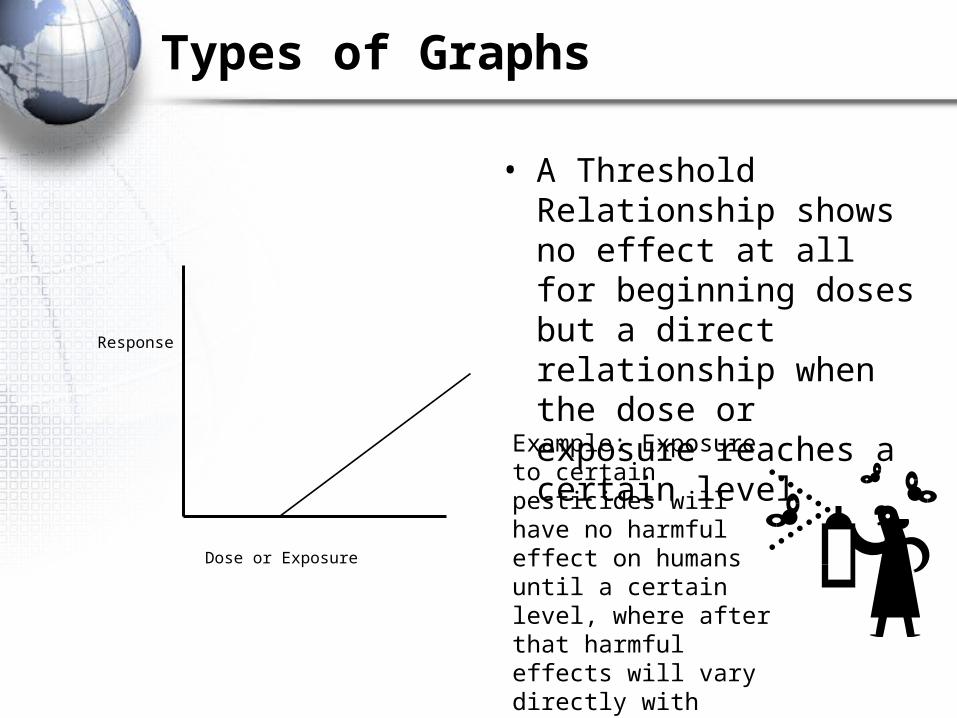
Types of Graphs
• A Threshold Relationship shows no effect at all for beginning doses but a direct relationship when the dose or exposure reaches a certain level
Response
Dose or Exposure
Example: Exposure to certain pesticides will have no harmful effect on humans until a certain level, where after that harmful effects will vary directly with additional exposure
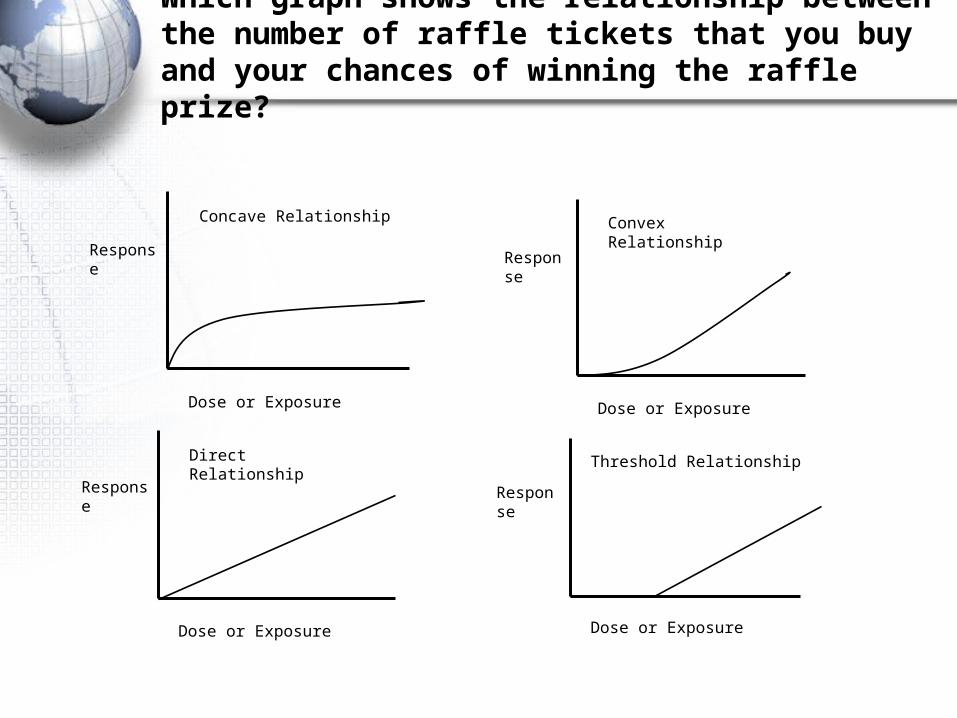
Which graph shows the relationship between the number of raffle tickets that you buy and your chances of winning the raffle prize?
Response
Dose or Exposure
Concave Relationship
Response
Dose or Exposure
Convex Relationship
Response
Dose or Exposure
Direct Relationship
Response
Dose or Exposure
Threshold Relationship
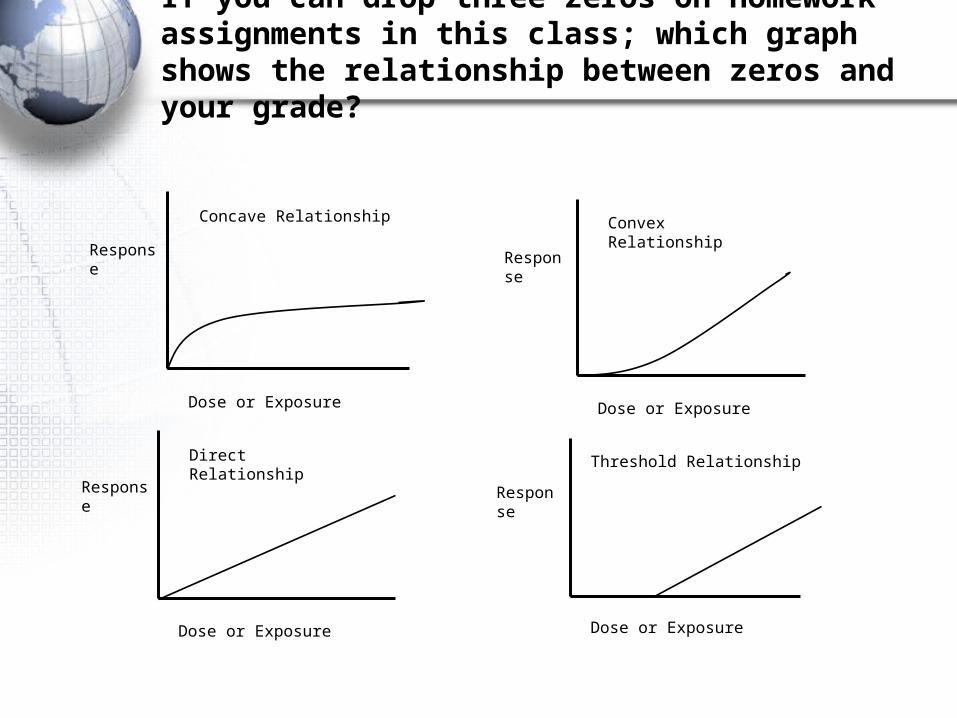
If you can drop three zeros on homework assignments in this class; which graph shows the relationship between zeros and your grade?
Response
Dose or Exposure
Concave Relationship
Response
Dose or Exposure
Convex Relationship
Response
Dose or Exposure
Direct Relationship
Response
Dose or Exposure
Threshold Relationship
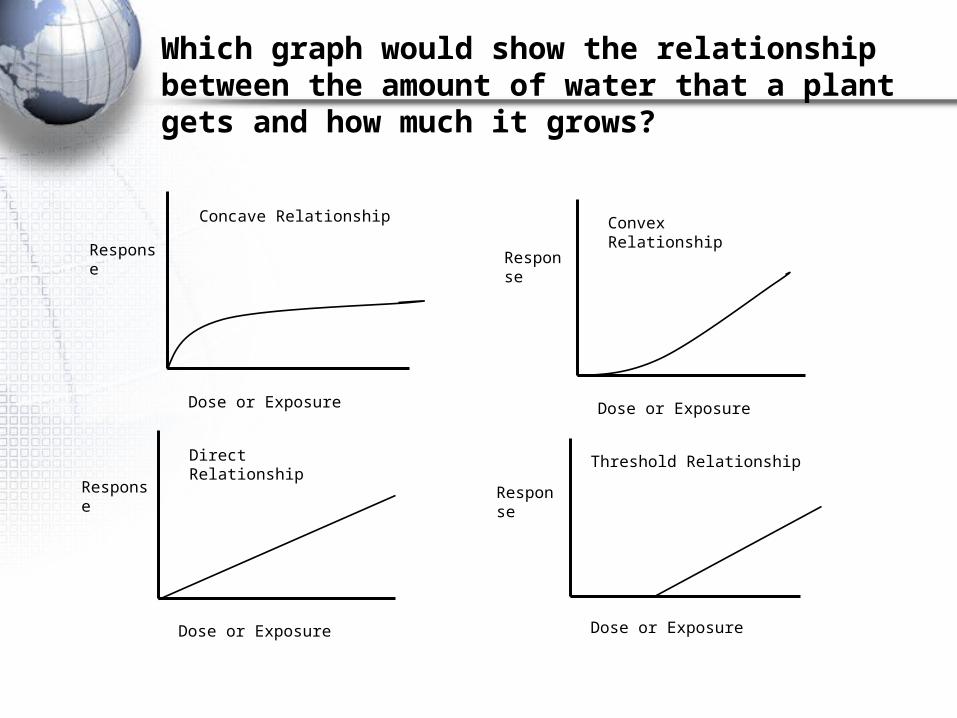
Which graph would show the relationship between the amount of water that a plant gets and how much it grows?
Response
Dose or Exposure
Concave Relationship
Response
Dose or Exposure
Convex Relationship
Response
Dose or Exposure
Direct Relationship
Response
Dose or Exposure
Threshold Relationship
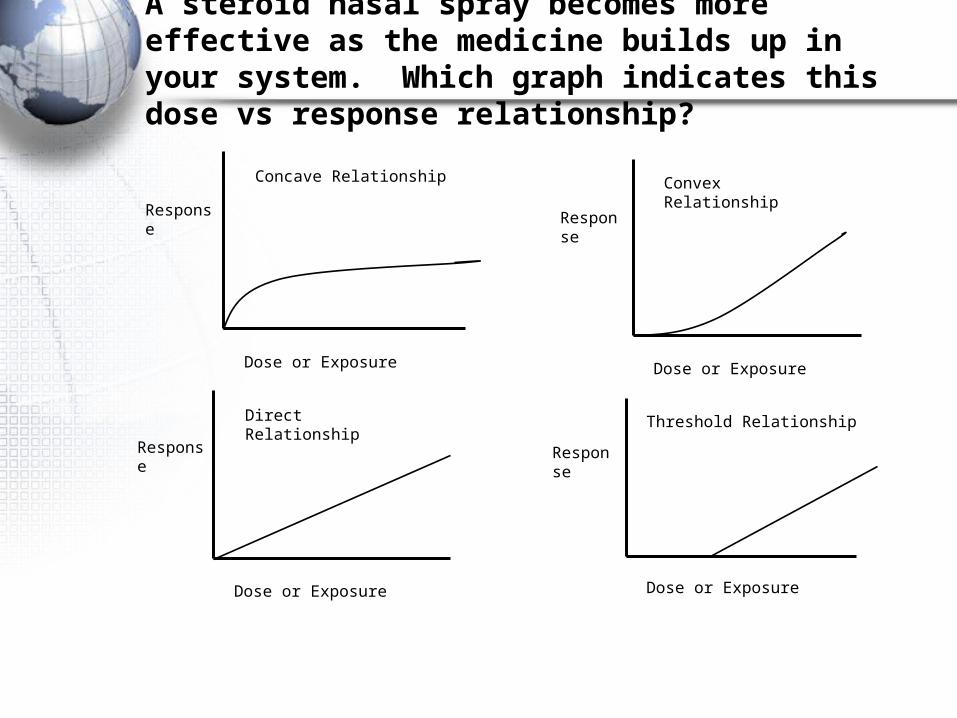
A steroid nasal spray becomes more effective as the medicine builds up in your system. Which graph indicates this dose vs response relationship?
Response
Dose or Exposure
Concave Relationship
Response
Dose or Exposure
Convex Relationship
Response
Dose or Exposure
Direct Relationship
Response
Dose or Exposure
Threshold Relationship
What is GIS?
Geographical Information Systems
Francisco Olivera, Ph.D., P.E.Department of Civil EngineeringTexas A&M University
Summarized by Priscilla Metting and Richard Powers
What is GIS?
• Geography is information about the earth's surface and the objects found on it, as well as a framework for organizing knowledge. GIS is a technology that manages, analyzes, and disseminates geographic knowledge.
• GIS links location to information (such as people to addresses, buildings to parcels, or streets within a network) and layers that information to give you a better understanding of how it all interrelates. You choose what layers to combine based on your purpose.
United State Geological Society
• Check this out!
• www.usgs.gov
• To get to the Seamless Data Distribution System, National Center for Earth Resources Observation and Science go www.usgs.gov and scroll down and click on the Seamless Data Distribution link
Why Use GIS?
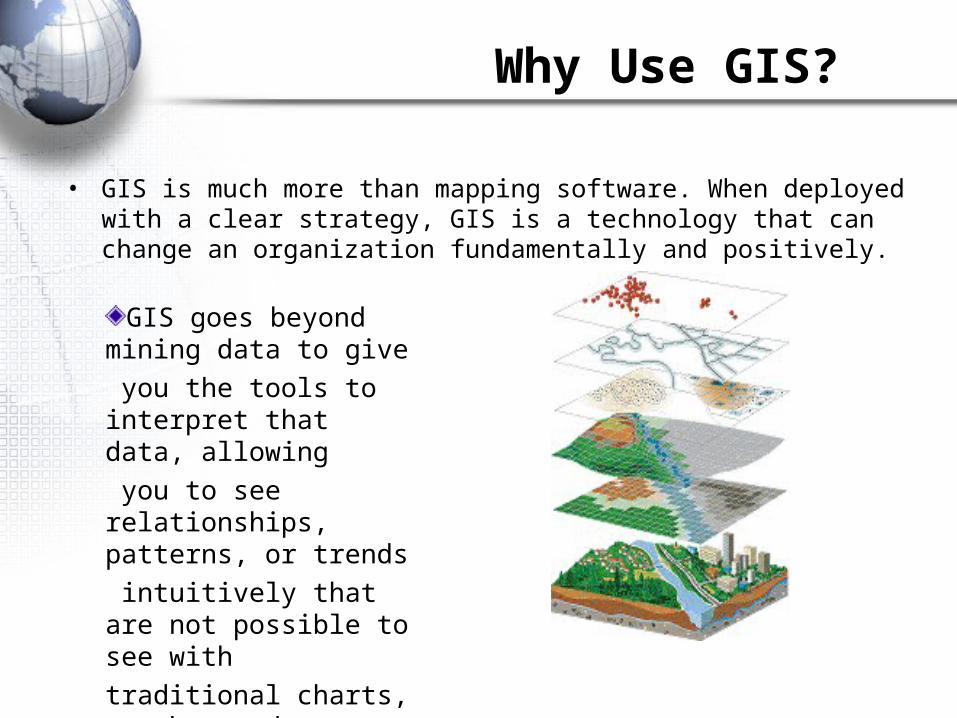
• GIS is much more than mapping software. When deployed with a clear strategy, GIS is a technology that can change an organization fundamentally and positively.
GIS goes beyond mining data to give you the tools to interpret that data, allowing you to see relationships, patterns, or trends intuitively that are not possible to see with traditional charts, graphs, and spreadsheets.
Delay between Sensing and Response in
Water Contamination Events
Elizabeth C. Bristow and Kelly Brumbelow
Department of Civil Engineering
Texas A&M University
Summarized by
Priscilla Metting and Richard Powers
TVDBC: A Five-Stage Model for Response Delay
• T – Transmission
• V – Verification
• D – Drafting
• B – Broadcasting
• C- Compliance
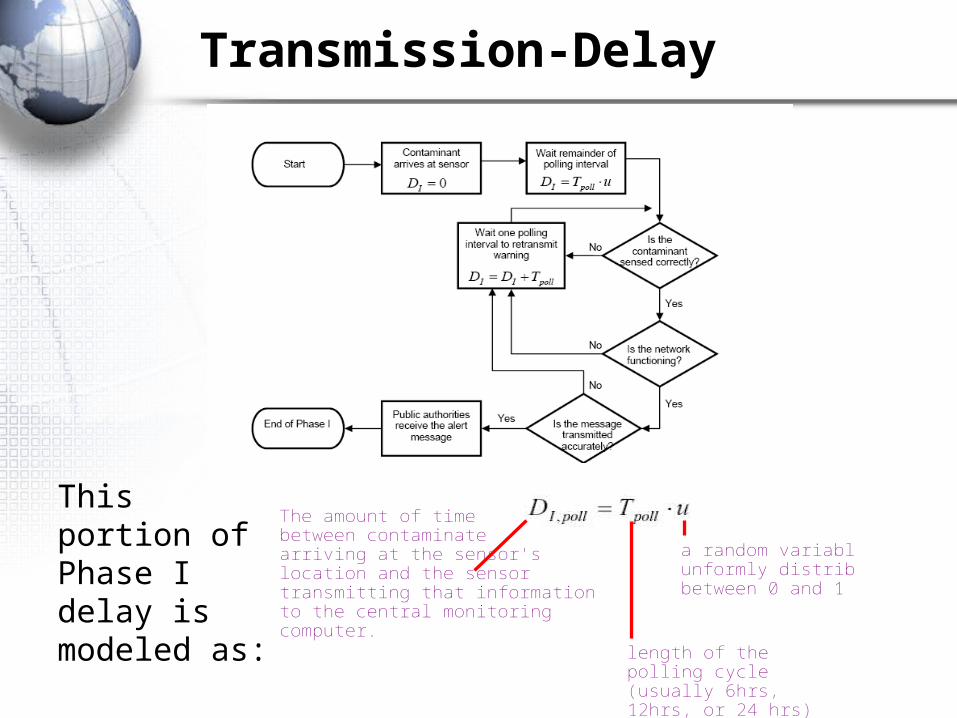
Transmission-Delay
This portion of Phase I delay is modeled as:
a random variableunformly distributed between 0 and 1
length of the polling cycle(usually 6hrs,12hrs, or 24 hrs)
The amount of time between contaminate arriving at the sensor's location and the sensor transmitting that information to the central monitoring computer.
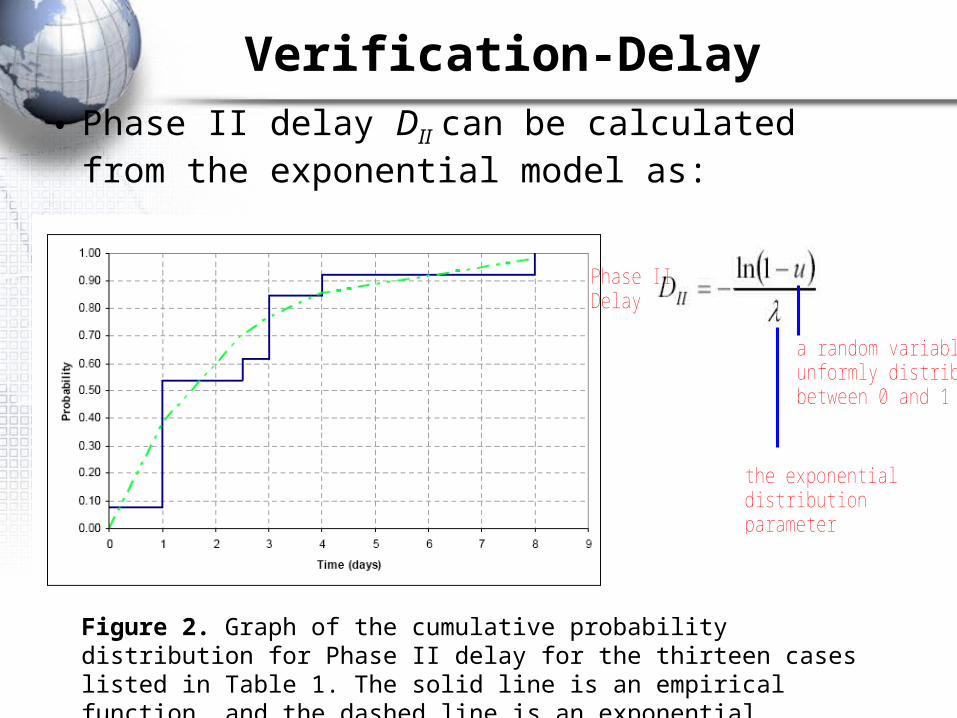
Verification-Delay
• Phase II delay DII can be calculated from the exponential model as:
Figure 2. Graph of the cumulative probability distribution for Phase II delay for the thirteen cases listed in Table 1. The solid line is an empirical function, and the dashed line is an exponential distribution fit to these data.
Phase IIDelay
a random variableunformly distributed between 0 and 1
the exponentialdistributionparameter
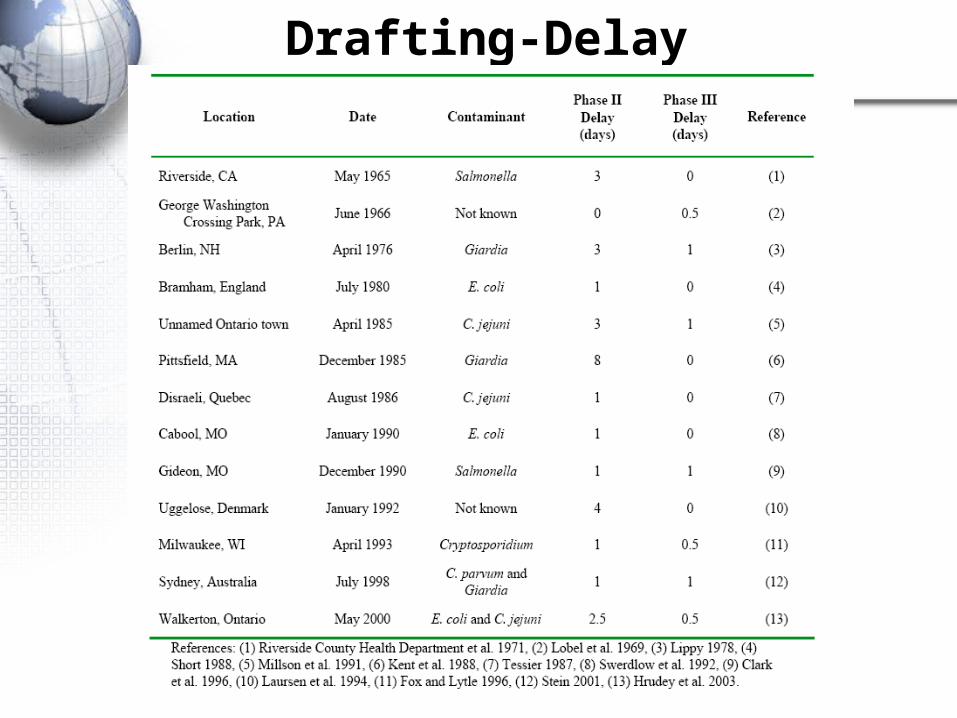
Drafting-Delay
Broadcasting-Delay
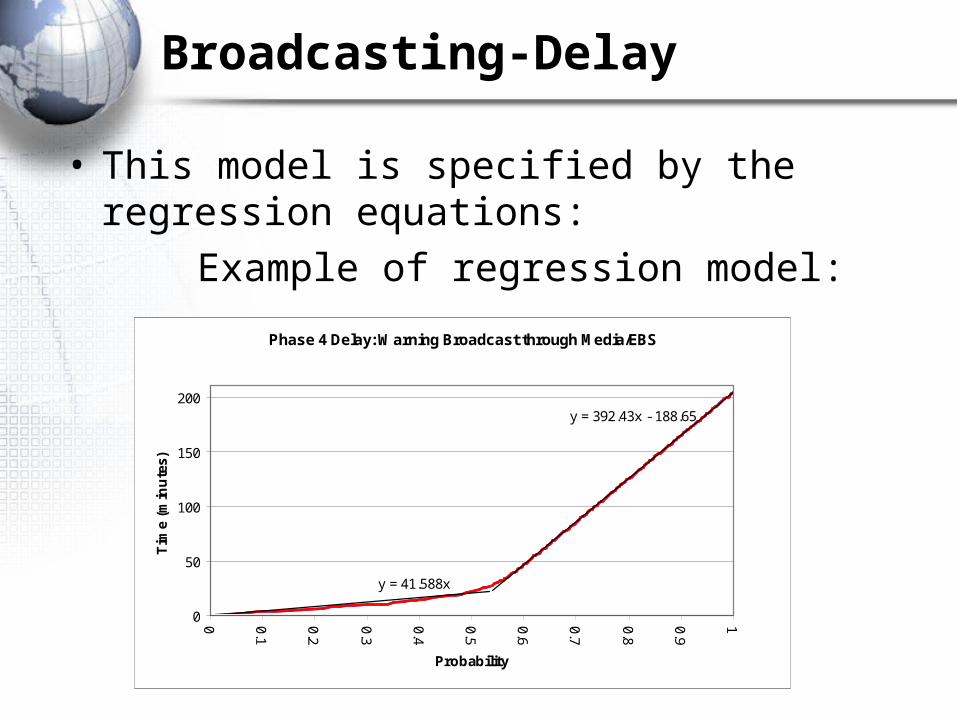
• This model is specified by the regression equations:
Example of regression model:
Phase 4 Delay: Warning Broadcast through Media/EBS
y = 392.43x - 188.65
y = 41.588x
0
50
100
150
200
0 0.1
0.2
0.3
0.4
0.5
0.6
0.7
0.8
0.9
1
Probability
Tim
e (m
inu
tes)
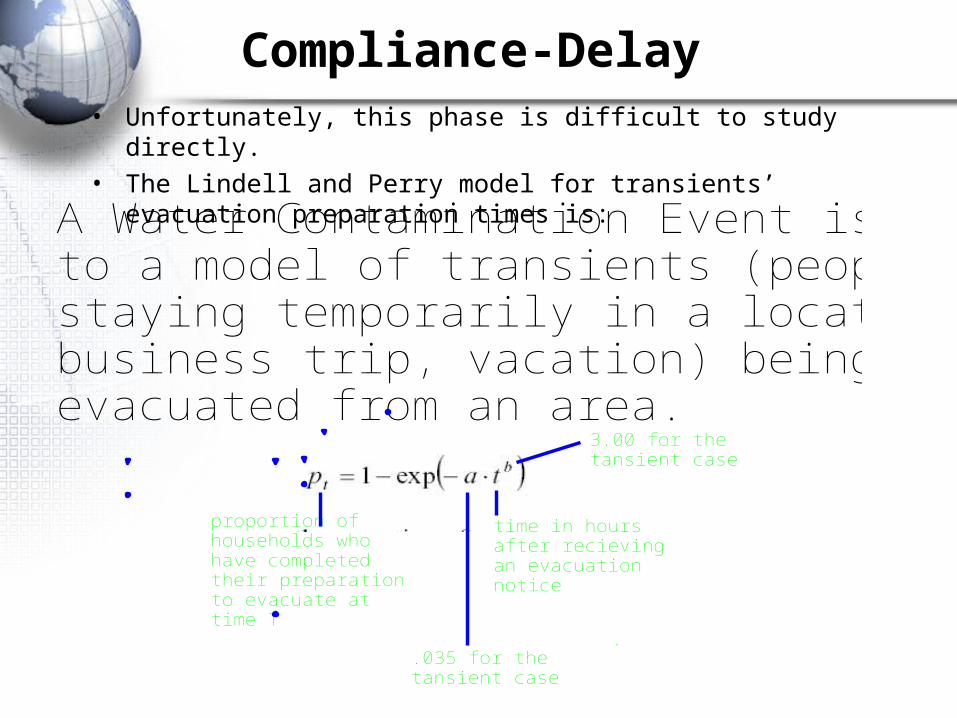
Compliance-Delay• Unfortunately, this phase is difficult to study directly.• The Lindell and Perry model for transients’ evacuation preparation
times is:
A Water Contamination Event is similar to a model of transients (people staying temporarily in a location (ex. business trip, vacation) being evacuated from an area.
proportion of households whohave completed their preparation to evacuate at time T
time in hoursafter recievingan evacuationnotice
.035 for the tansient case
.
3.00 for the tansient case
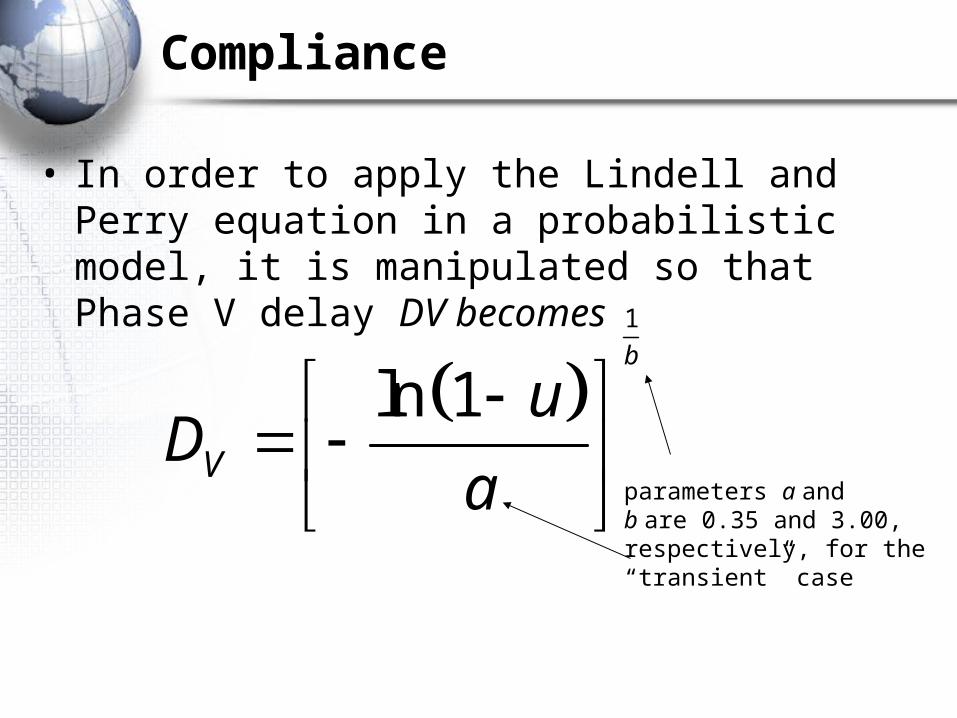
Compliance
• In order to apply the Lindell and Perry equation in a probabilistic model, it is manipulated so that Phase V delay DV becomes
1
ln 1b
V
uD
a
parameters a andb are 0.35 and 3.00, respectively, for the “transient” case
REFERENCES
Books and Articles– Bristow, Elizabeth and Brumbelow, Kelly: Department of Civil Engineering, Texas
A&M University “Delay between Sensing and Response in Water Contamination Events”
– Kammen, Daniel and Hassenzahl, David: Should We Risk It?
Web Resources– www.gis.com– www.epa.gov– www.decisioneering.com– www.riskworld.com
– http://www.usgs.gov/– http://seamless.usgs.gov/
Personal Consultations– Dr. Robin Autenrieth: Department of Civil Engineering, Texas A&M University– Dr. Kelly Brumbelow: Department of Civil Engineering, Texas A&M University– Dr. Francisco Olivera: Department of Civil Engineering, Texas A&M University


