The undersigned hereby certify that they have read and recommend to the Faculty of
Graduate Studies for acceptance a thesis entitled “WHAT IS THE EFFECT OF
GARMENT WORK ON WOMEN’S HEALTH AND EMPOWERMENT IN INDIA?
AN ANALYSIS OF INDIA’S NATIONAL FAMILY HEALTH SURVEYS” by Nirupa
Varatharasan in partial fulfillment of the requirements for the degree of Master of
Science.
Dated: December 9th, 2011
Supervisor: _________________________________
Readers: _________________________________
_________________________________
iii
DALHOUSIE UNIVERSITY
DATE: December 9th, 2011
AUTHOR: Nirupa Varatharasan
TITLE: WHAT IS THE EFFECT OF GARMENT WORK ON WOMEN’S HEALTH AND EMPOWERMENT IN INDIA? AN ANALYSIS OF INDIA’S NATIONAL FAMILY HEALTH SURVEYS
DEPARTMENT OR SCHOOL: Department of Community Health & Epidemiology
DEGREE: MSc CONVOCATION: May YEAR: 2012
Permission is herewith granted to Dalhousie University to circulate and to have copied for non-commercial purposes, at its discretion, the above title upon the request of individuals or institutions. I understand that my thesis will be electronically available to the public. The author reserves other publication rights, and neither the thesis nor extensive extracts from it may be printed or otherwise reproduced without the author’s written permission. The author attests that permission has been obtained for the use of any copyrighted material appearing in the thesis (other than the brief excerpts requiring only proper acknowledgement in scholarly writing), and that all such use is clearly acknowledged.
_______________________________ Signature of Author
iv
TABLE OF CONTENTS
List of Tables .................................................................................................................... vi
List of Figures .................................................................................................................. vii
Abstract ........................................................................................................................... viii
List of Abbreviations Used .............................................................................................. ix
Acknowledgements ........................................................................................................... x
1.1 Introduction .............................................................................................................................. 1 1.2 Theoretical Framework & Objectives .................................................................................... 2 1.3 Review of Literature ................................................................................................................ 4 1.3.1 The Work Environment of the Garment Industry .................................................................. 4 1.3.2 Health Care Provision Overview ............................................................................................ 6 1.3.2.1 Health Care Legislature……………………………………………………………….…..6
1.3.2.2 Health Care Utilization in India………………………………………………………….8
1.3.2.2.1 Access to Health Care…………………………………………………..…...…10
1.3.2.2.2 Barriers to Health Care Services……………………………………………….11
1.3.2.2.3 Health Care Utilization and Access to Health Care Services for Female Garment Workers in India …………………………………..………………....13
1.3.3 Challenges in Women's Empowerment ................................................................................ 15 1.3.3.1 Gender Equality in India ………………………….…………………………………….15
2.1 Study Population .................................................................................................................... 23
2.1.1 The National Family Health Survey, India ........................................................................... 23 2.2 Data Analysis .......................................................................................................................... 25
3.1 Demographic Data ................................................................................................................. 29
v
3.2 Health Care Utilization and Barriers to Care Data ............................................................ 34 3.2.1 Descriptive Statistics ............................................................................................................. 34
4.1 Demographics ......................................................................................................................... 54 4.2 Health Care Utilization and Barriers to Care ..................................................................... 56 4.3 Women's Empowerment and Domestic Violence................................................................ 58
Table A: Health Care Utilization Measures Across Comparison Groups .............................. 69 Table B: Women’s empowerment and Domestic Violence Indicators .................................... 77
vi
LIST OF TABLES
Table 1 Comparison chart of India’s three National Family Health Surveys .........24 Table 2 Demographic characteristics of comparison Groups ................................30 Table 3 Comparison chart of demographic indicators for garment workers from NFHS-2 to NFHS-3...........................................................................33 Table 4 Select health care utilization characteristics across all three comparison groups. ....................................................................................35 Table 5 Barriers to accessing medical advice or treatment across all three
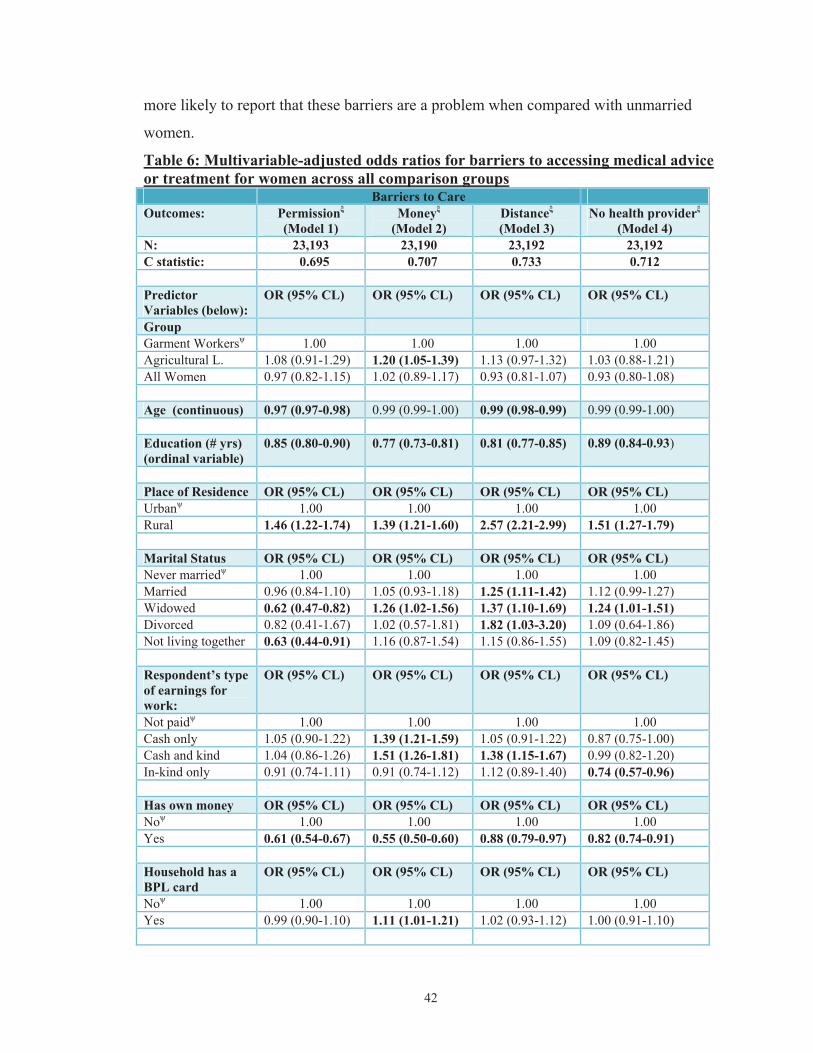
comparison groups ....................................................................................39 Table 6 Multivariable-adjusted odds ratios for barriers to accessing medical advice or treatment for women across all comparison groups ..................42 Table 7 Multivariable-adjusted odds ratios for barriers to accessing medical advice or treatment for ever-married women across all comparison groups ........................................................................................................44 Table 8 Select women’s empowerment and domestic violence indicators .............46 Table 9 Multivariable-adjusted odds ratios for respondent alone/respondent and husband jointly making decisions for currently married women across all comparison groups ....................................................................52
Figure 2 Women working in domestic market-oriented Indian garment factory visited during internship ...........................................................................21
Figure 3 Women working in an export-oriented Indian garment factory visited during internship .......................................................................................22
Figure 4 A home-based tailoring operation (informal employment) run by this woman in southern India, visited during internship ..................................22
viii
ABSTRACT Evidence suggests that employment for women can reduce poverty and inequality resulting in improved living standards. The garment industry is an important source of income for Indian women. This thesis tested the effects of garment work as an income source on women’s health-care utilization practices and decision-making in comparison to both agricultural labourers and general women in India. Cross-sectional data collected from India’s National Family Health Survey-3 were used to generate descriptive statistics. Statistical modeling was used to test the effect of garment work on a) barriers to health care services and b) decision-making abilities of Indian women. Results suggest garment workers are younger, more educated, urban, and wealthier, make more cash earnings, and have more access and control over their own money as compared to agricultural labourers. Results indicate female garment workers report facing fewer barriers to accessing health care services. As well, access to cash earnings increases their decision-making abilities.
ix
LIST OF ABBREVIATIONS USED
ASHA Accredited Social Health Activist ANC Antenatal Care ANM Auxiliary Nurse Midwife ANOVA Analysis of Variance BPL Below the Poverty Line CGHS Central Government Health Scheme CHC Community Health Centre CSDH Commission on Social Determinants of Health CSR Corporate Social Responsibility DALY Disability-Adjusted Life-Years DGFASLI The Directorate General Factory Advice Service and Labour Institutes ESIS Employee State Insurance Scheme ILO International Labour Organization JAP Jan Aushadhi Programme JSY Janani Suraksha Yojana LHV Lady Health Visitor MDG Millennium Development Goals MNC Multinational Corporations MOHFW Ministry of Health and Family Welfare MPW Multipurpose Worker NFHS National Family Health Survey NGO Nongovernmental Organization NRHM National Rural Health Mission OBC Other Backward Class PHC Primary Health Centre RSBY Rashtriya Swasthya Bima Yojna SDH Social Determinants of Health SES Socio-Economic Status TBA Traditional Birth Attendant UFWC Urban Family Welfare Centre UHC Urban Health Centre UHP Urban Health Post UN United Nations UNFPA United Nations Population Fund UNW United Nations Women (UN Entity for Gender Equality and the
Empowerment of Women US United States of America WHO World Health Organization WTO World Trade Organization
x
ACKNOWLEDGEMENTS
I would like to express my sincere gratitude to my advisory committee: Dr. Judith
Read Guernsey, Dr. Pantelis Andreou, and Dr. John C. LeBlanc. I would like to thank
them for their continued guidance, patience, support, and insightful advice, especially Dr.
Guernsey who has practiced endless patience with me and for encouraging me along
every hurdle. The majority of this project could not have been completed without Dr.
Andreou’s time and statistical advice as well as Dr.LeBlanc’s wisdom and sagely advice.
I would also like to thank Tina Bowdridge, Craig Gorveatt, Brenda Brunelle, Jodi
Lawrence and Shelley Buckingham for their patience and support in everything. I would
also like to thank fellow students in the department of Community Health &
Epidemiology for their infinite words of wisdom, empathy and encouragement. Finally, I
would like to thank Dalhousie University and the Community Health & Epidemiology
Department, especially Dr. Mikiko Terashima, Dr. Kathleen MacPherson and Dr.Gordon
Flowerdew. Without the support of the Canadian Institute of Health Research, The Rural
Center, and the Canadian International Development Agency this project would not have
been possible. Lastly I would like to thank my family and loved ones.
Thank you.
1
CHAPTER 1: INTRODUCTION
1.1 INTRODUCTION
The World Health Organization (WHO) established the Commission on Social
Determinants of Health (CSDH) in 2005 on the principle that improving the Social
Determinants of Health (SDH) would vastly reduce the many inequities in health(1). The
Commission’s final report launched in 2008 had three overarching themes: To: 1.)
Improve daily living conditions 2.) Tackle the inequitable distribution of power, money
and resources and c) Measure and understand the problem and assess the impact of
action(2). Employment falls under the first theme: to improve daily living conditions.
According to the WHO, “Employment and working conditions have powerful effects on
health equity. When these are good, they can provide financial security, social status,
personal development, social relations and self-esteem, and protection from physical and
psychosocial illness”(2). Employment for women can reduce poverty and inequality
resulting in improved living standards. The garment industry is an important source of
income for Indian women.
India, the largest democracy in the world, had a population of 1,170,938,000 people in
2010(3). The Indian garment industry "provides direct employment to over 33million
people and is the second largest provider of employment after agriculture"(4). About
21.9% of total manufacturing jobs in India belong to the garments industry with smaller
factories and home-workers making up a large portion of India’s informal sector of over
433 million(5). As such, the garment industry represents a large source of revenue for
Indians, especially to Indian women. Approximately 80-90% of all supplier communities
of textile and clothing manufacturers are female. Researchers in the field have suggested
that workers often lack social support systems, including such aspects as child care,
employment insurance, and pensions, (6). Since, "developing countries produce half the
world’s textile exports and nearly three-quarters of the world’s clothing exports"(7), the
actual social and economic impact that the garment industry can have in the lives of these
women and their families is enormous. The first step to achieving good health and
empowerment outcomes for this population is to conduct an environmental scan and
2
accurately describe the current state of health, health care utilization, and the current state
of empowerment in female garment workers.
The Millennium Development Goals (MDGs) set by world leaders at a United Nations
summit in the year 2000 outline eight specific goals which address many facets of
extreme poverty(8). This project addresses MDG3 which aims to promote gender
equality and empowerment of women. The importance of MDG3 is great, as Amartya
Sen made clear, “There is overwhelming evidence that women's empowerment through
schooling, employment opportunities, et cetera, has the most far reaching effects on the
lives of all – men, women and children...”(9)
The present study uses data collected from the latest Indian National Family Health
Surveys (NFHS), NFHS-3 which was conducted in 2005-06. The surveys are analogous
to Canada’s Community Health Surveys and include self-reported information on the use
of health-care services, health behaviours, economic characteristics, and demographics.
To date three phases of data collection and analysis have been conducted for the NFHS.
The focus of this thesis is to test the effects of garment work as an income source on
health care utilization and the prevalence of barriers to accessing health care between
female garment workers in comparison to both women in agricultural labour (the
occupation most women in India participate in) and women in general in India. Of
particular interest is whether women’s empowerment indicators such as decision making
and gender role attitudes differ between these occupational groups. It is particularly
crucial to understand complex social relations—i.e., gender roles in labour and
household—to uncover whether garment work is a catalyst in empowering women to take
part in more active decision making and in decreasing barriers to accessing health care
services.
1.2 THEORETICAL FRAMEWORK & OBJECTIVES
The theoretical framework (Figure 1) for this study attempts to simplify complex
connections between women’s employment, empowerment and barriers to health care.
3
The focus of this framework is on garment work as a source of income and its
relationship to women’s health and empowerment. The framework is not an exhaustive
compilation of the different factors and connections between these concepts but instead
provides a clear presentation of the hypothesis that is to be tested.
Figure 1: Theoretical Framework
Figure 1 suggests that garment work provides women with cash earnings, which give
them access to their own money. This framework of empowerment expects that this
access to personal monies results in a) decreased barriers to accessing medical advice or
treatment and b) increased decision-making abilities regarding their own health and
earnings.
Using the proposed theoretical framework the study attempted to test the following
questions through the use of India’s latest National Family Health Survey (NFHS-3):
1.) Does garment work positively affect health care utilization practices and decrease
the prevalence of barriers for accessing health care services for female garment
workers in comparison to both women in general, and women in agricultural
labour in India?
2.) Does garment work increase indicators of women’s empowerment such as self-
reported decision-making for female garment workers in comparison to both
women in general, and women in agricultural labour in India?
Garment Work Cash Earnings Access to own money
Barriers to Accessing Medical Advice/Treatment Decision-Making Abilities (regarding earnings and health)
4
The current scientific literature on garment workers has generally provided insight into
occupational illnesses and injuries experienced by women working in garment factories.
As well as some background context about the general state of health care for women in
India. There have been no studies reported to the literature that have used India’s
National Family Health Surveys to examine these questions for female garment workers
in India. The following review of literature provides a general overview of empirical
evidence in the conditions of garment workers regarding: 1) their work conditions; 2)
access to health services and welfare; and 3) challenges in women's empowerment which
would affect their health.
1.3 REVIEW OF LITERATURE
1.3.1 The Work Environment of the Garment Industry
Researchers have characterized garment factory buildings as having inadequate
ventilation(10), unsafe drinking water, insufficient washroom facilities and workers
frequently denied washroom breaks by supervisors (11). As well, some factories do not
have fire exits or fire alarms and violate many fire codes (10). Working in the different
sectors of the garment industry has shown to result in various occupation related health
problems (12)(13). Informal garment workers who work as tailors from home are not
captured in scientific literature.
The most commonly reported occupational diseases in the garment industry are:
byssinosis (exposure to endotoxins from bacteria found on cotton), infections (from
contaminated drinking water), musculoskeletal disorders (mostly lower back pain and
sciatica from static positions), stress-related disorders (harassment by supervisors and
domestic violence at home), dermatitis (toxic chemicals) and needle-stick injuries
(outdated machines and lack of protective gear) (14). Female-specific health issues are
also reported: “Women of reproductive age are susceptible to specific adverse effects on
reproduction, like abortions and malformations of the fetus from exposure to toxic
chemicals in the work place”(14). However, the most common complaints expressed by
women have been experiences of dysmenorrhoea, menstrual irregularities, anemia, severe
abdominal pain, as well as urinary tract infections (11).
5
The Directorate General Factory Advice Service and Labour Institutes (DGFASLI)
reports an incidence rate of 3.94 industrial injuries per thousand workers employed in all
textiles in 2005, signifying the second highest incidence rate after the electricity, gas and
steam sector (15).
Historically, the working environment in the garment industry has been characterized by
poor working conditions. However, the boom of the garment industry in India,
specifically the increase in multinational companies that engage export-oriented factories
with required socially responsible workplace policies have led to some positive changes
to the working environment of garment workers who work in these export-oriented
factories. As major multinational corporations (MNCs) like Wal-Mart and Inditex
outsource to countries like India, supplier factories attempting to attract their business are
improving their workplace conditions and providing workers with social support. The
recent popularity and increasing adherence to Corporate Social Responsibility (CSR)
principles by MNCs and governments internationally also plays a role in building higher
ethical standards in supplier factories (16). CSR was established to provide guidelines for
MNCs to actively and publically practice ethical responsibility and social and
environmental sustainability while conducting business overseas and within their own
borders(16). In fact, for the year 2009 DGFASLI reports an increase in the number of
crèches (day care centre’s in the workplace) to 5326 from 5085 in 2007, increase in full-
time medical officers to 2586 from 2142 in 2007 and an increase in ambulance vans to
2273 from 2126 in 2007 in registered factories in India(15) (17) . However informal
garment workers working from home do not have access to these services.
As part of a CIDA-funded graduate student internship I and other members of our team
had the opportunity to visit several export-oriented garment factories as well as informal
home-based operations in the southern state of Karnataka, India in the fall of 2010. We
observed that general managers of garment factories, especially those that are export-
oriented, have recognized the importance of maintaining high quality work environment
standards for the benefit of the health of their employees and their factory’s output. Many
MNCs place certain conditions on supplier factories, one of which is to have an in-house
6
ambulatory room with a full-time nurse or medical officer. During our visits we observed
various models of in-house ambulatory care rooms depending on the size and business
capacity of the factory. Although, these ambulatory care rooms can be beneficial for the
garment worker if she falls ill or is injured at work, it does not provide her with access to
preventive forms of health care, such as primary health care facilities for her or her
family. However informally run home-based operations garment do not provide access to
these services.
1.3.2 Health Care Provision Overview
1.3.2.1 Health Care Legislature
After gaining independence from the United Kingdom in 1947, India’s health policy, was
affected by a strong egalitarian ideology leading to the provision of health care to be the
sole responsibility of the government(18). The government however, did not officially
recognize health as an essential component of human development. A combination of
low political will, low investment, poor policies, and unsuccessful programmes resulted
in poor quality health care services provided by the public sector(18). The private sector,
which was already prevalent at the time of independence continued to grow rapidly, “to
become the default option in many cases. In an unregulated environment, neither the
private sector nor the public sector provided an assurance of quality or access”(18).
Quality in providing health care services is heavily influenced by several factors: high
rates of absenteeism amongst health care professionals, lack of proper knowledge or
qualification (one study showed that 40% of private providers in rural Rajasthan did not
have medical degrees, with 20% not having completed secondary school education),
inadequate supply of drugs and poor working environments(19). According to the
NFHS-3, 58% of households cited 'poor quality of care' as the main reason for why they
did not utilize government facilities (20).
Health care costs in India have soared for a multiplicity of reasons: a physician-centered
approach to healthcare leading to an underproduction and underuse of other health
professionals, an imbalance that favours specialist-delivered hospital-based high-tech
7
medical care over primary care, poor resource allocation, weak regulations and wide-
spread corruption (one study reported 77% of doctors and 67% of hospital staff accepted
bribes to provide proper treatment during admission (19).) Currently, the majority of
health care services in India is delivered privately, with 65% of households seeking
health care from the private medical sector(20).
Due to the increasing inequalities and inequities in health care provision, the Indian
government has recently proposed some schemes to promote universal health care in
India such as the National Rural Health Mission (NRHM), the Janani Suraksha Yojana
(JSY), the Rashtriya Swasthya Bima Yojna (RSBY) and the Jan Aushadhi Programme
(JAP) (For more information on these programs consult (18). These programs will likely
benefit informal garment workers who work from home or in other home-based
operations.
Although, India’s economy has seen consistent growth in recent years, total expenditure
on health was 4.2% of its GDP in 2009(21), of which 1.1% (2008-2009) accounted for
public expenditure on health(19). Indeed, India has not increased its investment in or
efficiency of health care, the Human Development Index ranks India as 119 among 169
countries with comparable data(22). Health care services are largely paid for out-of-
pocket “with India having one of the highest proportions of household out-of-pocket
health expenditures in the world. -71.1% in 2004-05”(19) and is a major cause of poverty
for many low and middle income families with 39 million additional people becoming
poverty-stricken every year as a result(19), this effect is not distributed equally across the
population. There is a large disparity in health care services based on factors such as
gender, caste (a social stratification in India based on ancestry and therefore immutable),
wealth, education and geography (19). For example, in rural India during 2005-06, the
mortality rate for infants born to mothers with no education was 71.1 per 1000 livebirths,
however the same rate was 29.6 per 1000 livebirths for mothers with 12 or more years of
education (20).
8
The extent of economic development of the different states in India is closely associated
with the health of its population, for example people who live in the state of Madhya
Pradesh have a life expectancy of 56 years, whereas the life expectancy is 74 years for
those who live in the state of Kerala(19). As well, the disparity in states’ expenditures on
health plays a major role in whether the state can provide sufficient and suitable physical
access to good-quality health care services. “For example, per person public health
expenditures in Bihar were estimated to be INR 93 compared with INR 630 in Himachal
Pradesh in 2004-05”(19). The quality of health-care services also have extreme
variations, a small population of people with means have access to the best possible care,
whereas the large majority cannot access the most basic or essential health care services,
especially in rural areas(18). In fact, the inequalities that exist in resource allocation by
states perpetuate urban-centered curative services, which “suggest an urban bias and rural
disadvantage in access to health-care services”(19).
The right to health and the right to health care were officially established in the National
Health Bill by the Indian government in 2009. The Bill was written to allow the legal
system to formally recognize these rights and to also address the social determinants of
health(19). However, the limitations that exist within India’s institutions to implement
policies that will bring about equity in health care have yet to be addressed.
1.3.2.2 Health Care Utilization in India
According to the WHO, life expectancy at birth for females and males born in India are
66 and 63, respectively (23). The probability of death for children under the age of 5 is 66
per 1000 live births, which is higher than the regional average for southeast Asia (59 per
1000 live births)(23). Representing 18% of deaths and 20% of disability-adjusted life-
years (DALYs), India signifies a large portion of the global burden of childhood related
mortality and illness(19).
Health care utilization is commonly measured in terms of: a.) visits to health care
providers (physician visits, specialist visits etc.) b.) type of health care facility used
(public hospital, community health centre etc.) c.) type of service sought (family
9
planning, immunization etc.) and health care coverage (private health insurance etc.).
Patterns of health care utilization are important to study as it provides information on
differential use of health care services across populations, for example in India, 10% of
people in urban households have health insurance as opposed to only 2% in rural
households(20), this would have an impact on their use of health care services. Analyzing
various relationships with health care use, such as the effect of socioeconomic status
(SES) on health care utilization allows for appropriate changes to be made to existing
policies to increase improved health care outcomes.
In India, according to the NFHS-3, only 5% of households reported that at least one
member of their household was covered by a health scheme or health insurance(20). Of
those with coverage, 28% had privately purchased insurance, 26% were covered by the
Employee State Insurance Scheme (ESIS) and the third most dominant form of coverage
was under the Central Government Health Schemes (CGHS) with 20% of people
reporting using CGHS(20). Interestingly, both the ESIS and CGHS are mandatory or
government run schemes and to a large extent the “existing insurance is largely limited to
a small proportion of people in the organized sector”(24). Having health coverage plays a
large role on whether people can access health care services or not. The ESIS is
particularly relevant for this study as a majority of garment workers in the organized
sector in India are covered under ESIS.
The ESI Act in India was enacted in 1948 in order to allow for sick workers to have
access to medical benefits as well as cash benefits equal to about half their daily wage per
day for a period of 56 days per year(25). The Act also entitles employees to have access
to ESI maintained hospitals to seek medical treatment, which is provided by the State
Government. However, during our visits to garment factories garment workers reported
difficulties in attaining sick leave and accessing care during hospital hours, this is echoed
in the literature(11). As well, wage deductions per sick day are also quite common. If a
worker is absent too often due to illness, she runs a high risk of being fired from her
position(11) since this is a country with a large supply of workers. Informal garment
workers do not have access to this benefit. Therefore, many females continue to work in
10
strenuous work environments with their illnesses and without access to medical advice or
treatment thereby risking converting their acute disease into a chronic illness.
The quality of health care delivered also has an impact on health care use, which in turn
can lead to better health outcomes in a population. According to the NFHS-3, 36% of
women visited a health facility or health camp for themselves or their children in the
three months preceding the survey, of those 87% reported that the health care provider
respected their privacy when needed and 65% of women reported that their last visit to a
facility was very clean(20). The percentage of women who reported visiting a clean
facility increases with increasing education and increasing wealth quintiles(20). There is
very little literature on health care utilization by female garment workers in India,
especially studies that specifically address the quality of care that is available to them.
1.3.2.2.1 Access to Health Care
Access to health care is a complex multidimensional concept and it can be measured in
several ways. Health care utilization is one measure of access. Early definitions of access
include that of Aday and Andersen who proposed that “it is perhaps most meaningful to
consider access in terms of whether those who need care get into the system or not”(26).
They also differentiate between ‘having access’ which means having the ability to use a
service if required and ‘gaining access’ which “refers to the initiation into the process of
utilizing a service”(26). In order to have access to health care services, there must first be
a sufficient supply of health care services(26). The effect of having an adequate supply
of health care services on access is that these services will be available whenever it is
wanted or needed. Service availability can be measured using a number of indicators, the
most common being measures such as the number of doctors or hospital beds per
capita(26).
Mooney suggested that the costs of travel and other costs related to obtaining care can
also be used as a measure of service availability from a health economic perspective(26).
He argued that “access is wholly a question of supply; utilization is a function of both
supply and demand…It is important to stress that equality of access is about equal
11
opportunity: the question of whether or not the opportunity is exercised is not relevant to
equity defined in terms of access”(26). Several factors affect the supply of health care,
most notably the efficient allocation of resources between primary, secondary and tertiary
care, human resources, and the effect of geography on physical access to health care
services(19).
Service availability or adequacy of supply is one measure of access, but perhaps another
more useful measure would be the actual utilization of health care services, in terms of
affordability, physical accessibility and acceptability of services. Often health care
services are available and yet many encounter difficulties in accessing these services.
Therefore Donabedian suggested that “the proof of access is use of service, not simply
the presence of a facility”(26). Pechansky and Thomas added to this discussion by
developing the ‘degree of fit’ between patients and the health care system(26). Pechansky
and Thomas “extended the concept of access beyond service availability, to consider the
personal, financial and organizational barriers to service utilization”(26).
1.3.2.2.2 Barriers to Health Care Services
Personal barriers to accessing health care services are often encountered when a patient
first identifies their own need to utilize health care services and actively makes the
decision to seek care. At this point the patient’s own set of social and cultural practices
and beliefs, their own opinion of their needs as well as their attitude and past experiences
with health care services will shape the patients decision to access health care services
(26). Personal barriers are exemplified by the non-uptake of recommended preventive
services and low patient compliance. In India, 7% of all women report that getting
permission to go for treatment is a big problem(20), speaking to the effect of cultural and
social practices.
Geography also affects a patient’s ability to access health care. Distance to health care
facilities is a larger hurdle for families living in rural areas, for example distance to health
facilities was a big problem for 33.2% of women living in rural residences in comparison
to 8.3% women living in urban neighbourhoods. Also, need for transport was a big
12
problem for 30.8% of rural women as opposed to 6.6% of urban women; these findings
would be similar to what we would find in a Canadian context. Another barrier that
women reported in relation to distance to health care facilities was not wanting to go
alone to seek medical advice or treatment, where 15.1% of women from rural areas cited
not wanting to go alone as a big problem whereas 4.7% of urban women reported the
same.
Financial barriers to accessing care are prevalent globally. The cost of health care can
affect health care utilization. There are costs associated with all aspects of health care
utilization, such as user charges for specific services, prescription medication, costs as a
result of time lost from work or travelling to and from a health care facility(26).
Gulliford states that “equal costs do not necessarily give equal access”(26), implying that
the impact of charges at the point of service affects different SES groups differently. This
is demonstrated by 34.8% of women in the lowest wealth index in India citing money as
a big problem to accessing medical advice or treatment as opposed to 3.0% of women in
the highest wealth index (20). The removal of financial barriers to health care has shown
to enhance women's health. “Evidence from several countries shows that removing user
fees for maternal health care, especially for deliveries, can both stimulate demand and
lead to increased uptake of essential services” (27). The complications of removing
financial barriers to care must be taken into account.
Organizational barriers include long waiting lists and waiting times before obtaining
treatment. The median waiting time for seeing a health care provider as reported by
women in the NFHS-3 is 21 minutes (range 15-30 minutes) before being offered services
(20). These barriers can be a consequence of poor design of health care services,
systematic variations in referral practices from primary to secondary care, and ineffectual
policies which result in the “inefficient use of existing capacity”(26). Other barriers that
women reported to encounter in the NFHS-3 are a concern that no provider would be
available (22.7%), that no female provider would be available (18.7%),and that no drugs
would be available (22.9%)(20). These barriers address the issue of acceptability as a
dimension of access, acceptability defined as “the match between how responsive health
13
service providers are to the social and cultural expectations of individual users and
communities”(28).
In recognition of these barriers, the quest for optimal access is never ending. Rogers et al
defined optimal access as “providing the right service at the right time in the right
place”(26). Central to the concept of access is the ability to provide appropriate and
adequate health care resources to address the various needs of different groups. Equity is
popularly defined as “fairness in access for groups with equivalent needs. This horizontal
form of equity may be assessed with respect to health service availability, health service
utilization or health care outcomes”(26). Equity in access is essential as it intertwines
notions of social justice and fairness into the equation. Health care utilization is often the
preferred measure of access, with the “relationship between utilization and need being
expressed in the form of use/needs ratios”(26). Inequity in access to health care is
difficult to assess as the health problems, health care needs, priorities and values of
different groups are so diverse. Access, in short, is multi-dimensional and difficult to
measure appropriately, although health service availability, health service utilization or
health service outcomes are all accepted indicators of access, equity may be the most
important measure albeit the most difficult to test(26).
1.3.2.2.3 Health Care Utilization and Access to Health Care Services for Female Garment
Workers in India
The literature addressing health care utilization patterns and access to health care services
for female garment workers, specifically in India is limited, especially for informal
garment workers. A study by Haque et al. conducted in Dhaka, Bangladesh found that
most female garment workers from factories once sick, accessed treatment primarily from
pharmacies (43.7%) followed by government hospitals (9.7%), Ayurvedic doctors (9.3%)
and homeopaths (6.0%) (29). Poor females in India fall victim to rationing, referring to
the distribution of curative healthcare among sick members of a family with limited
resources (29). A well-balanced diet is required for maintaining good health, especially
when working long hours in stressful conditions. One study found that the incidence of
anemia in female garment workers in certain factories in Bangalore to be as high as
14
29.6% (30), this is most likely attributed to a diet deficient in valuable nutrients. Many
workers also report cases of irritable bowel disease and parasites acquired through
drinking water from contaminated sources(30). Women do not always have access to
wholesome food and clean water to overcome their sickness due to low wages and large
family sizes(31). Existing literature does not clearly describe health care utilization
patterns of female garment workers, nor does it specifically report on the barriers that
they face in accessing health care services. It is important to note that encouraging
positive health practice behaviours in female garment workers is key, as women tend to
be “excellent carriers or multipliers of healthy behaviours for the family and society at
large(32).”
As previously mentioned, the boom of the garment industry in India, specifically the
export-oriented factories have brought about some positive changes. As major companies
like Wal-Mart and Inditex outsource to countries like India, factories attempting to attract
their business are improving their workplace conditions and providing workers with
social support. Gokaldas Exports Limited (GEL) is perhaps India’s largest apparel
exporter and is located in Bangalore. Clients include everyone from Nike to Zara
(Inditex). GEL aims to promote social initiatives by providing their employees and their
families with access to free healthcare centers and making available an ambulance that is
on call 24x7(33). However, GEL does not offer any further descriptions on what their
medical centres are equipped with or whom they staff.
Studies on occupational disease in anonymous garment factories in India mention
‘ambulance rooms,’ but never characterize them. Studies lack specific information
regarding: a.) the number of these centers that exist b.) the types of services they offer c.)
how they operate and d.) who staffs them(34). Silpasuwan et al. evaluated occupational
health nursing units in textile factories in Bangkok(35) from the nurse’ and management’
viewpoints. This descriptive study concluded: “1.) The quality of health care services in
the workplace is a significant part of quality assurance in the health and safety of the
work force. 2.) Service quality can be evaluated by its structure, process, and outcome.
3.) Quality of nursing service units could be improved by management’s attention to unit
15
design, arrangement of nursing units, and nurses’ education. 4.) Qualification of nurses
employed in occupational health nursing units should be mandated”(35).
The health care services provided to informal garment workers are not captured in the
literature.
1.3.3 Challenges in Women's Empowerment
1.3.3.1 Gender Equality in India
The United Nations Women (UNW) defines empowerment as composed of important
elements such as “gaining the ability to generate choices and exercise bargaining power,”
and “developing a sense of self-worth, a belief in one’s ability to secure desired changes,
and the right to control one’s life”(36). The United Nations Population Fund (UNFPA)
stress important issues that affect women’s empowerment throughout their life cycle:
access to good reproductive health; stewardship of natural resources; and economic,
educational and political empowerment(37). Gender-based discrimination prevents
women from obtaining gender-equality in these matters.
Disparities between genders exist worldwide, however this difference is much more
prominent in developing countries such as India(27). The United Nations update on the
Millennium Development Goals reports that this disparity in gender begins at a very early
age, notably for girls born into impoverished households or living in rural communities
where they are at a distinct disadvantage(38). Differences in both biology and behaviour
result in a longer life span in general for women(11). In Asia especially “these
advantages are overridden by gender-based discrimination so that female life expectancy
at birth is lower than or equal to that of males”(27) Women have shown to face greater
barriers in accessing health care services particularly because of gender-based
inequalities such as education, income and employment.
Worldwide women are targeted for developmental programmes, especially those that
address maternal and child health(20). Women tend to be the primary caregivers in their
households thus targeting and providing them with tools for empowerment will help
16
remove their low status in Indian society(20). The removal of this barrier will increase
not only maternal and child welfare but also other demographic outcomes. “An
understanding of the status and empowerment of women in society and within their
households is thus critical to promoting change in reproductive attitudes and behaviour,
especially in patriarchal societies”(20). There is a wide gap in knowledge regarding
women's empowerment indicators specifically for female garment workers.
1.3.3.1.1 Employment
Employment is used as a proxy indicator of women’s empowerment. Associated with
employment is the control over income. If women have access to their own financial
resources, several studies suggest that women have more bargaining and decision-making
power at home(36). The NFHS-3 reports that nationally only 43% of currently married
women between the ages 15-49 were employed sometime in the 12 months preceding the
survey(20). Of those women, 51% earned only cash and 13% earned both cash and in-
kind payments, and about one in four women did not receive any payment at all(20).
Notably, 99% of currently married men aged 15-49 were employed in the same period
and 92% earned cash for their work(20). Therefore it is interesting to note that “not only
are currently married women less than half as likely as currently married men to be
employed, but when employed, they are only 70% as likely as men to be paid only in
cash and five times as likely as men to not receive any earnings at all”(20).
Employment rates in currently married women increase from 31% in women between the
ages 15-19 to 50% in women between the ages 35-39 and then decline to 45% in the
oldest age group of 45-49(20). Employment of women also varies across the different
states in India. Employment for women (currently married) in Punjab was 23% in
contrast to 76% in Arunachal Pradesh(20). In contrast there was little variation in
employment patterns across states for currently married men in India. In all states 96% or
more men were employed at some time during the past 12 months before the survey(20).
Employment provides women with their own source of income which in turn reduces
gender based inequalities and improves women’s empowerment.
17
1.3.3.1.2 Control over Earnings
Control over cash earnings is an important indicator of financial empowerment. Notably,
“ a married woman’s ability to convert earnings into empowerment in her own household
may also depend on the perceived relative importance of these earnings to the
household”(20). In India, according to the NFHS-3 most employed women (currently
married) who earned cash decided alone (24%) or jointly with their husbands (57%) how
to spend the money that they earned(20). Interestingly, 15% of these women said that the
husband mainly decides how to spend their earnings, whereas one in six women do not
participate at all in making these decisions(20), “the proportion of women who
themselves mainly decide the disposition of their own earnings increases with age,
education and wealth, whereas the proportion for whom the husband mainly decides,
decreases with age, education and wealth”(20). According to the World Bank, when
women play larger roles in deciding how household money is spent, a larger share gets
spent on child and welfare expenditures(20).
1.3.3.1.3 Decision Making
Another important indicator of empowerment is the ability to make your own decisions
about your healthcare, mobility and other freedoms. In India as a total, 27% of currently
married women make their own decisions about their own health care, 9% make
decisions about major household purchases, 32% make decisions about daily household
purchases and 11% make their own decision about visiting their family or relatives(20).
The rest of the women make these decisions jointly with their husband, mainly by their
husband, or by someone else entirely. Employment with cash earnings increases the
likelihood of women participating in decision making(20).
1.3.3.1.4 Access to Own Income
Access to multiple financial resources also plays an important role in allowing for
financial flexibility and providing increased choices. In India “45 percent of all women
aged 15-49 say that they have some money that they can use; 15 percent have a bank or
savings account that they themselves use; 39 percent know of a programme that gives
money to women to start or expand a business of their own; and only 4 percent of all
18
women have ever taken a loan from such a programme”(20). These indicators increase
for women who are employed for cash.
1.3.3.1.5 Freedom of Movement
Freedom of movement is a major element of women’s autonomy and empowerment,
especially in a patriarchal country like India(20). Women in India were asked by the
NFHS-3 about their freedom of movement. The responses were: 38% were allowed to
travel alone to places outside their village or community, 51% were allowed to go to the
market by themselves and 48% were allowed to go to a health facility by themselves(20).
Again, employment for cash increases a woman’s freedom of movement.
1.3.3.2 Domestic Violence
1.3.3.2.1 Domestic Violence in the Indian Context
Gender role attitudes such as the perceived expectations of behaviour, rights and
privileges based on sex need to be rejected in order to decrease gender-based
discrimination and achieve gender equality. This is a fundamental aspect of women’s
empowerment. A normative behaviour that is commonly accepted in India, especially in
the less educated and rural dwelling population is the ‘right’ of husbands to have power
over their wives’ behaviour and bodies through whatever means necessary(20). Women
who believe that husbands should control their wives may be perceived to be less
empowered and their acceptance of these norms are worth noting(20). Attitude of wife-
beating was assessed by the NFHS-3, to which 41% of women answered that a husband
is justified in beating his wife ‘if she shows disrespect for her in-laws’, 35% found wife
beating acceptable ‘if she neglects the house or children’, and 20% found wife-beating
justified ‘if she doesn’t cook food properly’(20).
1.3.3.2.2 Consequences of Garment Work
Several studies suggest that domestic violence is also unabated in the lives of Indian
female garment workers(39)(40). Rocca et al assessed domestic violence as an
unintended consequence of women’s empowerment in India. The authors noted that two-
thirds of participants reported working before marriage, most of whom worked as
19
garment factory workers. Fifty-six percent of these women had experienced physical
domestic violence; 27% reported having experienced physical domestic violence in the
past 6 months(41). Marital violence can be a crime of power, “a sadistic assertion of
control which is not limited to a particular section of the society”(42). Unfortunately,
domestic violence is seen as a ‘private family matter’ and thus remains largely invisible
in Indian society. “Women speak of being beaten till they lose their teeth or miscarry;
hammered till they lose consciousness; or even being set ablaze”(42). At times the
violence is so great that women resort to suicide. Shrivastava says every year in Mumbai
alone there are at least 500 cases of suicides among city housewives (42). Mental torture
is another overt form of abuse by husbands: women are frequently isolated from family
and friends, demeaned in front of others, and denied money(42). Indian society is slowly
building social supports to help these women in times of need, but bureaucracy still
predominates in many women’s shelters. “Some [shelters] do not admit a person till she
can prove that she has been married, others do not admit children with the women, some
give shelter for such short durations that it is of no use”(42).
On average, factory-based female garment workers work 9-10 hour shifts only to go
home and cook, clean the house, and feed and take care of any children and elderly
family also living with them(42). The multiple roles filled by women inevitably leads to
mental and physical fatigue or burnout(32) without any support. When women are sick,
what are the consequences for them and their family? There is a lack of research
addressing this multifaceted question. Female garment workers are sometimes the sole
breadwinners for the family or support an already struggling household with their meager
income(11).
Importantly, working women in India feel that “their obligation, domestic and outside
work, often caused imbalances one way or the other, resulting in mental and physical
tension, anxiety and worry”(42). Therefore, the inner conflict of dual commitment itself
may submit these workers to stress related illnesses. A study assessing working women
(in both the organized and unorganized sector) in North Bengal, India found that 40%
from organized and 36% from unorganized sectors felt that their families were neglected
20
because they did not have enough time for domestic chores(42). As well, 24% from the
organized sector and 8% from the unorganized sectors felt that it was impossible to care
for their children while they worked outside. Concurrently, 24% of children of women in
the organized sector and 28% of children of women in the unorganized sector did not like
their mothers working outside(42). The traditionalist attitude of husbands may be one
reason that 24% of women from the organized sector and 50% of women in the
unorganized sector have marital maladjustment(42). Therefore, working women feel that
they do not have enough time for household duties, caring for their children, and their
husbands.
The prevalence of sexual harassment and abuse is noted to occur in the workplace but is
seldom reported for fear of losing employment(43). Women who are widowed, deserted,
divorced or are single mothers are often subject to stigmatization and discrimination(10).
In addition, “women's low status in society, their burden of work and the violence they
experience”(27) all contribute to mental ill health.
Reports of community harassment of female garment workers have been identified in the
literature. At work, garment workers are charged with meeting hourly production targets
and if these are not met are faced with verbal and physical abuse(11). One worker says, “I
have been verbally abused many times whenever I don’t meet the production targets and
cloth lengths were thrown at my face”(11). Female garment workers have also reported
episodes of sexual harassment by mainly male supervisors. These supervisors frequently
make comments with sexual overtones or engage in unwelcome physical contact.
Unfortunately, women workers tolerate such indecencies in order to keep their jobs. “The
supervisor talks to me sweetly and in a personal way. He does not touch me but I feel
harassed by his way of talking. I have to tolerate it if I want to keep my job”(11) says one
garment worker.
As seen in the review above, current literature generally reviews the state of health and
health care for women in India as well as report on common occupational injuries of
garment workers. However, similar outcomes of health and health case, as well as factors
21
influencing health and health care decision making within female garment workers,
especially those who work in the informal sector have not been studied in detail. As of
yet, no study has been published using India’s NFHSs to study female garment workers'
health and health care access issues in India. The focus of this paper, therefore, is to
characterize whether health care utilization and the prevalence and severity of barriers to
accessing health care differs between female garment workers in comparison to both
women in agricultural labour (the occupation most women in India participate in) and
women in general in India.
Figure 2: Women working in domestic market-oriented Indian garment factory visited during internship
22
Figure 3: Women working in an export-oriented Indian garment factory visited during internship
Figure 4: A home-based tailoring operation (informal employment) run by this woman in southern India, visited during internship
23
CHAPTER 2: METHODS
2.1 STUDY POPULATION
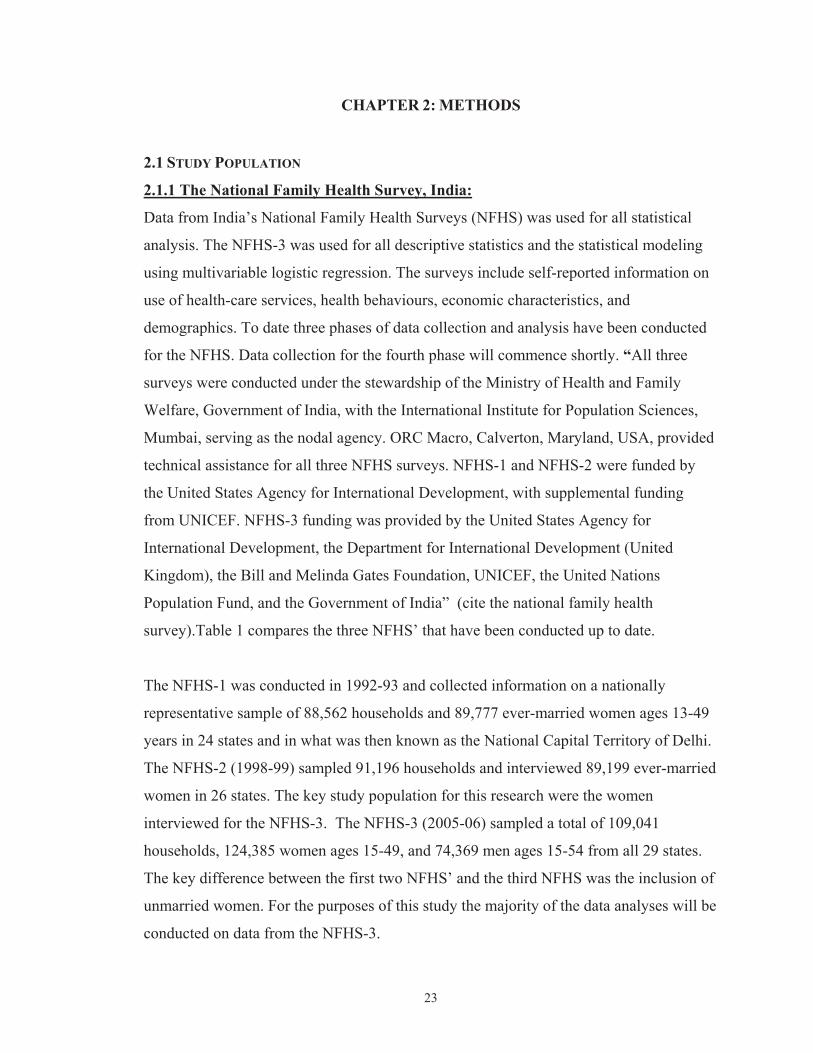
2.1.1 The National Family Health Survey, India:
Data from India’s National Family Health Surveys (NFHS) was used for all statistical
analysis. The NFHS-3 was used for all descriptive statistics and the statistical modeling
using multivariable logistic regression. The surveys include self-reported information on
use of health-care services, health behaviours, economic characteristics, and
demographics. To date three phases of data collection and analysis have been conducted
for the NFHS. Data collection for the fourth phase will commence shortly. “All three
surveys were conducted under the stewardship of the Ministry of Health and Family
Welfare, Government of India, with the International Institute for Population Sciences,
Mumbai, serving as the nodal agency. ORC Macro, Calverton, Maryland, USA, provided
technical assistance for all three NFHS surveys. NFHS-1 and NFHS-2 were funded by
the United States Agency for International Development, with supplemental funding
from UNICEF. NFHS-3 funding was provided by the United States Agency for
International Development, the Department for International Development (United
Kingdom), the Bill and Melinda Gates Foundation, UNICEF, the United Nations
Population Fund, and the Government of India” (cite the national family health
survey).Table 1 compares the three NFHS’ that have been conducted up to date.
The NFHS-1 was conducted in 1992-93 and collected information on a nationally
representative sample of 88,562 households and 89,777 ever-married women ages 13-49
years in 24 states and in what was then known as the National Capital Territory of Delhi.
The NFHS-2 (1998-99) sampled 91,196 households and interviewed 89,199 ever-married
women in 26 states. The key study population for this research were the women
interviewed for the NFHS-3. The NFHS-3 (2005-06) sampled a total of 109,041
households, 124,385 women ages 15-49, and 74,369 men ages 15-54 from all 29 states.
The key difference between the first two NFHS’ and the third NFHS was the inclusion of
unmarried women. For the purposes of this study the majority of the data analyses will be
conducted on data from the NFHS-3.
24
Table 1: Comparison chart of India’s three National Family Health Surveys National Family Health Surveys NFHS-3 NFHS-2 NFHS-1 Year Conducted
2005-2006 1998-1999 1992-1993
Sample Size
All Men Age: 15-54
74369
All Women Age: 15-49
124,385
N/A
Ever-married
Women Age: 15-49
89,199
N/A
Ever-married
Women Age: 13-49
89,777 Sample Design
“The target sample size for each state in NFHS-3 was estimated in terms of the number of ever-married women in the reproductive ages to be interviewed since a large number of the key indicators to be estimated from NFHS-3 refer to ever-married women in the reproductive ages of 15-49”.(44)
“The initial target sample size was 4,000 completed interviews with ever-married women in states with a 2001 population of more than 30 million, 3,000 completed interviews with ever- married women in states with a 2001 population between 5 and 30 million, and 1,500 completed interviews with ever-married women in states with a population of less than 5 million”. (44)
“In addition, because of sample-size adjustments required to meet the need for HIV prevalence estimates for the high HIV prevalence states and Uttar Pradesh and for slum and non-slum estimates in eight selected cities, the sample size in some states was higher than that fixed by the above criteria.”(44)
“The urban and rural samples within each state were drawn separately and, to the extent possible, the sample within each state was allocated proportionally to the size of the state’s urban and rural populations.”(44)
“A uniform sample design was adopted in all the states. In each state, the rural sample was selected in two stages: the selection of Primary Sampling Units (PSU's), which are villages, with probability proportional to population size (PPS) at the first stage, followed by the random selection of households within each PSU in the second stage.”(44)
In urban areas, a three-stage procedure was followed. In the first stage, wards were selected with PPS sampling. In the next stage, one census enumeration block (CEB) was randomly selected from each sample ward. In the final stage, households were randomly selected within each sample CEB”(44)
Similar sampling was used for both the NFHS- 1&2 minus the HIV prevalence. Sample Weights
“NFHS-3 is designed for self weighting at the domain level. The domains are the urban and rural areas of each state, and the slum and non-slum areas of each of the eight selected cities. This means that all households and individuals in the same domain will share a common household weight and individual weight, respectively.”(44)
“The design weight is the inverse of the overall sampling fraction in each domain. The overall sampling fraction is the product of the selection probabilities at each sampling stage (two stages in rural areas and three stages in urban areas). “(44)
“The design weight was adjusted for household non-response in the calculation of the household sampling weight. The household sampling weight was further adjusted for individual non-response to obtain the individual sampling weight. Both adjustments for non-response were done at the domain level in order to preserve the self-weighting nature of the sample within domains.”(44)
25
Sample Weights
National Family Health Surveys
“The sampling weights were further normalized at the national level to obtain national standard weights and at the state level to obtain standard state weights for each of the 29 states. The national standard weights were normalized so that the total number of weighted cases equals the total number of unweighted cases at the national level. The state standard weights were calculated to ensure that the total number of weighted cases equals the total number of unweighted cases for each state.”(44)
“ Weights for the men’s subsample, the HIV subsample, and the subsample of women selected for the domestic violence section of the questionnaire were calculated in a similar way.” (44)
Standard Error
“The NFHS-3 sample is the result of a multi-stage stratified design, and, consequently, it was necessary to use more complex formulae. The computer software used to calculate sampling errors for NFHS-3 is programmed in SAS. This procedure uses the Taylor linearization method for variance estimation for survey estimates that are means or proportions.”(44)
The Jackknife repeated replication method is used for variance estimation of more complex statistics such as total fertility rate and child mortality rates. In addition to the standard error, the design effect (DEFT) for each estimate is also computed, which is defined as the ratio between the standard error using the given sample design and the standard error that would result if a simple random sample had been used.”(44)
Definition of garment workers: In the women’s questionnaire of all three NFHS’, an open
-ended question was asked about women’s occupation. The responses were then recoded
into appropriate categories during the data processing stage. For the purposes of this
paper, the term Garment Worker encompasses all women who have been employed in the
past 12 months and were employed as spinners, weavers, knitters, dyers, tailors, dress-
makers, sewers, upholsterers and related workers at the time of survey data collection.
The combining of similar but different occupations may affect the accuracy of the results.
Similarly, agricultural laborers were all women who have been employed in the past 12
months and were employed as agricultural labourers at the time of survey data collection;
these women were already coded and grouped into one occupational category.
2.2 DATA ANALYSIS
Variables of interest were identified from the women’s questionnaire data set of the
NFHS-3 and imported into SAS Version 9.2. Two data sets were created, the first one
containing the two occupation groups: all garment workers (n=4983) and all agricultural
labourers (n=11,441) and the second containing all other women who were neither
garment workers nor agricultural labourers (all women sample). To reduce computational
burden, a third data set was created from the all women sample by randomly selecting a
26
subsample of women (n=21,583). Finally, the three datasets were merged to create the
working dataset containing all three samples: garment workers, agricultural labourers and
the all women (total n=38,001). The garment workers served as the referent group and the
other two as comparison groups for the multivariable logistic regression. Frequencies
and histograms were run to detect inaccuracies and to assess the distribution of data.
Duplicate variables were deleted.
Descriptive statistics were computed with a macro generated for categorical variables
using the SURVEYFREQ procedure in SAS. The SURVEYFREQ procedure is designed
to take into account the weights often found in survey data. The STRATA, CLUSTER,
and WEIGHT statements are used under the SURVEYFREQ procedure and provide
“sample design information for the procedure, so that the analysis is done according to
the sample design used for the survey, and the estimates apply to the study
population”(45). Descriptive statistics for continuous variables were analyzed using the
SURVEYMEANS procedure in SAS, which also allows us to adjust for survey design.
The STRATA, CLUSTER, and WEIGHT statements are also used to add survey design
information to the analysis. The state and place of residence (urban/rural) of respondents
were used for the STRATA statement, and cluster and weight variables provided by DHS
was used for the CLUSTER and WEIGHT statements for all data analyses. The Rao-
Scott modified chi-square test (a modified version of the Pearson chi-square test that
adjusts for design)(46) was used to identify whether categorical variables were
statistically (p<0.05) different across the three groups (garment workers =referent group,
agricultural workers, all women). Analysis of Variance (ANOVA) was used for
continuous and ordinal variables to test for differences between means across each
comparison group.
Odds ratios were computed for two broad outcomes (Barriers to accessing medical advice
or treatment and Women’s decision making) each relating to one of the two main
objectives. The two outcomes were each composed of 2-4 outcome variables, which were
selected based on significance attributed to them in the literature. Each outcome variable
27
was coded into a binary variable in order to analyze the sample using logistic regression,
excluding observations with missing values.
Variables of interest were identified from the literature to be considered for the
multivariate logistic regression. Firstly, bivariable analysis was conducted on variables of
interest using the SURVEYLOGISTIC procedure in SAS. “The
SURVEYLOGISTIC procedure fits linear logistic regression models for discrete
response survey data by the method of maximum likelihood. For statistical inferences,
PROC SURVEYLOGISTIC incorporates complex survey sample designs, including
designs with stratification, clustering, and unequal weighting”(45). Those variables with
a p-value of 0.25 (a p-value of 0.05 was not used at this step as important variables can
be overlooked(47) on the Wald chi-square test under the Type 3 Analysis of Effects in
PROC SURVEYLOGISTIC were considered for the multivariable logistic regression.
Once variables were selected from the bivariable analysis, they were used to model each
outcome using the original weights. Each model was re-weighted by dividing the original
weight with the sum of the actual weights used then multiplied by the number of
observations used. Each model was then re-run with the new weights followed by the
iterative process of variable selection to create the most parsimonious model using
forward selection. Insignificant (p>0.05) explanatory variables on the Wald chi-square
test under the Type 3 Analysis of Effects in PROC SURVEYLOGISTIC were removed
from the original model and the nested model was rerun. If the difference in the fit
statistics -2 log likelihood values (of the intercept and covariables) of the nested model
compared with the original model was insignificant (p>0.05) on the chi-square
distribution table, the variable was removed. If the difference was significant the
explanatory variable was kept and the next least significant explanatory variable was
added to begin the process again. Both Wald and -2 log likelihood tests were used to be
more conservative.
A POWER procedure was run in SAS to determine whether the sample size was
adequate. We have a power of 0.980 with an alpha equal to 0.05 to reject the null
hypothesis. The c statistic (the area under the ROC curve) was also analyzed as a measure
28
of accuracy of the model. The c statistic is a measure of goodness-of-fit and is used to
evaluate the fit of a logistic regression model. The c statistic ranges from 0.5 to 1.0 with
larger values indicative of better fit. According to Hosmer and Lemeshow, c statistic
values ranging from 0.69 to 0.76 show acceptable discrimination between observations at
different levels of the outcome, whereas values of 0.8 to greater than or equal to 0.9
demonstrate excellent discrimination(47).
29
CHAPTER 3: RESULTS
3.1 DEMOGRAPHIC DATA
Results suggest garment workers in India were younger than both agricultural labourers
and all women in India. Garment workers had a median age of 26 while agricultural
labourers had a median age of 30 and the all women group had a mean age of 27 as
reported in Table 2. Table 2 consists of select demographic characteristics of all three
comparison groups, a more comprehensive description can be found in the appendix
(Table A). Garment workers had a median height of 151.87cm and were shorter than all
women who had a median height of 152 cm. Agricultural labourers had a median height
of 150.54 cm making them marginally shorter than garment workers. Garment workers
had a median weight of 46.52 kg, agricultural labourers had a median weight of 42.70 kg
and all women had a median weight of 45.81kg (Table 2).
Garment workers (67%), agricultural labourers (87 %) and all women (80%) were mostly
Hindu, then Muslim. However more garment workers (27%) were Muslim than in either
the agricultural labourers (7%) or all women (14%) groups. The three other most popular
religions to which all three groups belonged to was Christianity, Sikhism and
Buddhism/Neo-Buddhism. There were significant differences (p<0.0001) in caste
distribution between the three groups. The majority of people in each comparison group
belonged to Other Backward Class’ (OBC): 43% of garment worker’s, 47% of
agricultural labourers and 39% of all women. The second most popular caste designation
for garment workers and all women was the ‘none of the above’ category: 37% and 35%
respectively, whereas agricultural labourers belonged to the scheduled caste (29%).
30
Table 2: Demographic Characteristics of Comparison Groups Demographics Garment Workers
(Referent Group) (4,983)
Agricultural Labourers
(11,441)
All Women (21,583)
Age (years) Median (Min-Max) Median (Min-Max) Median (Min-Max) Median age 25.65 (15.00-49.00) 29.71 (15.00-49.00) 27.01 (15.00-49.00)
Height (cm) Median (Min-Max) Median (Min-Max) Median (Min-Max) Median height 151.87
(130.00-196.90) 150.54
(100.0-198.90) 152.0
(107.50-198.70)
Weight (kg) Median (Min-Max) Median (Min-Max) Median (Min-Max) Median weight 46.52 (23.10-126.50) 42.70 (15.10-99.90) 45.81 (22.10-150.30)
Use of Alcohol % (n) SE % % (n) SE % % (n) SE %Drinks alcohol 0.96 (56) 0.25 4.48 (603) 0.43 1.91 (537) 0.16 Frequency of alcohol use among those who drink alcohol:
% (n) SE % % (n) SE % % (n) SE %
Almost every day 17.27 (6) 8.14 14.80 (85) 2.64 17.27 (73) 2.56 About once a week
19.86 (10) 8.56 46.82 (272) 3.26 45.16 (197) 3.18
Less often 62.69 (39) 12.77 37.47 (242) 3.36 36.47 (265) 3.12
More garment workers belonged to the never married category (34%) compared to 14%
of agricultural labourers and 21% of all women. Fifty-nine percent of garment workers
are married in contrast to 79% of agricultural labourers and 75% of all women. In
addition, 0.74% of garment workers are divorced compared to 0.30% of agricultural
labourers and 0.24% of all women.
32
Fewer garment workers (25%) had a BPL card in comparison to agricultural labourers
(40%). Twenty-four percent of the all women group had a BPL card. The three
comparison groups also belonged to different wealth indices. More garment workers
(34%) belonged to the ‘richer’ category than either the agricultural labourers (8%) or the
all women (23%). Also, more garment workers (54%) had completed secondary
schooling than either the agricultural labourers (15%) or the all women (40%) groups.
Garment workers (59%) lived predominantly (p<0.0001) in urban centers in contrast to
either the agricultural labourers (7%) or the all women group (49%). Garment workers
were distributed all over India, with the majority of them living in the state of Manipur
(18%) and Uttar Pradesh (11%) (Table A - appendix).
Garment workers were less likely to engage in risk-taking behaviours such as drinking
alcohol (0.96% used alcohol) and using tobacco (7% used tobacco) than both agricultural
labourers (4% used alcohol and 17% used tobacco) and all women (2% used alcohol and
90% didn’t use tobacco). As well, among those who did consume alcohol, garment
workers consumed less often than once a week (63%), whereas agricultural labourers
mostly consumed about once a week (47%) similar to all women (45%).
Table 3 presents a comparison of changes in several demographic indicators for garment
workers across two cross-sectional time points from data collected from both NFHS-3
and NFHS-2. The median age of garment workers decreased from 31 years of age to 26
years of age from the NFHS-2 to the NFHS-3. The number of Hindu garment workers
also decreased from 75% to 67%. The numbers of garment workers who belonged to
either the scheduled caste or other backward class (these are groups of historically
disadvantaged people in India) have increased since the NFHS-2. Garment workers are
also more educated, with 54% having completed secondary education in the NFHS-3
sample than the 37% who had completed secondary education in the NFHS-2. Garment
workers have also become more urban-centered, more of them work away from home,
more of them make cash only and work all year round since the NFHS-2.
33
Table 3: Comparison chart of demographic indicators for garment workers from NFHS-2 to NFHS-3
Demographics Garment Workers (4,983)
Garment Workers (1,979)
Survey NFHS-3 (2005-06) NFHS-2 (1998-99) Sample (ages 15-49) All women Ever-married women
Age (years) Median (Min-Max) Median (Min-Max) Median age 25.65 (15.00-49.00) 31.17 (15.00-49.00)
Don’t Know 0.06 (2) 0.04 0.49 (11) 0.18 Missing 0.31 (10) 0.14 0.00 (0) 0.00 Total 3013 1972 Total values were only indicated where (n) was not the same as the total reported above.
3.2 HEALTH CARE UTILIZATION AND BARRIERS TO CARE DATA
3.2.1 Descriptive Statistics
Table 4 illustrates select health care utilization characteristics across the three comparison
groups. More garment workers (5%) had at least one member of their household covered
by health insurance in comparison to agricultural labourers, of whom only 1% had at
35
least one member of their household covered. The two most popular forms of health
insurance held among those who were covered were: a) privately purchased commercial
health insurance plans and b) the Employee State Insurance Scheme (ESIS). Thirty-three
percent of garment workers had at least one member of their household covered by ESIS
in comparison to 13% of agricultural labourers and 28% of all women (p=0.0126).
Privately purchased commercial health insurance was held by at least one member of
32% of garment workers’ households, 41% of agricultural labourers’ households and
27% of all women households. (For descriptive statistics of other forms of insurance
held, consult Table A in the Appendix).
Table 4: Select health care utilization characteristics across all three comparison groups
Health Care Utilization Measures
Garment Workers(4,983)
Agricultural Labourers
(11,441)
All Women (21,583)
Health Insurance
% (n) SE % % (n) SE % % (n) SE %
Member of household covered by health insurance
5.24 (287) 0.55 1.01 (152) 0.14 5.71 (1470) 0.28
The type of insurance held among those covered:
% (n) SE % % (n) SE % % (n) SE %
Employee State Insurance Scheme
33.04 (85) 5.49 13.34 (29) 3.69 27.73 (396) 2.07
Other privately purchased commercial health insurance
31.53 (70) 4.50 40.89 (57) 6.61 27.35 (388) 1.76
General Health Problems
% (n) SE % % (n) SE % % (n) SE %
Diabetes 0.82 (48) 0.19 0.46 (51) 0.07 0.89 (248) 0.09 Goiter or other thyroid disorder
1.03 (68) 0.20 0.50 (70) 0.07 0.92 (231) 0.09
(In addition to asthma, these were the only health problems asked about)
CL: 0.50-0.60), distance (OR: 0.88 95% CL: 0.79-0.97), or no health provider (OR: 0.82
95% CL: 0.74-0.91) as barriers to accessing health care. Women who earned cash
compared to women were not paid at all were more likely (OR: 1.39 95% CL: 1.21-1.59),
to report that money was a barrier to accessing health care.
Women who lived in rural areas reported these barriers more frequently compared to
women who lived in urban areas (i.e. distance OR: 2.57 0. 95% CL: 2.21-2.99). An
increase in the number of years of education a woman had also decreased the likelihood
of her reporting that permission (OR: 0.85 95% CL: 0.80-0.90), money (OR: 0.77 95%
CL: 0.73-0.81), distance (OR: 0.81 95% CL: 0.77-0.85), or no health provider (OR: 0.89
95% CL: 0.84-0.93) were barriers to accessing medical advice or treatment. Widows are
42
more likely to report that these barriers are a problem when compared with unmarried
women.
Table 6: Multivariable-adjusted odds ratios for barriers to accessing medical advice or treatment for women across all comparison groups Barriers to Care Outcomes: Permission
Place of Residence OR (95% CL) OR (95% CL) OR (95% CL) OR (95% CL) Urban 1.00 1.00 1.00 1.00 Rural 1.46 (1.22-1.74) 1.39 (1.21-1.60) 2.57 (2.21-2.99) 1.51 (1.27-1.79) Marital Status OR (95% CL) OR (95% CL) OR (95% CL) OR (95% CL) Never married 1.00 1.00 1.00 1.00 Married 0.96 (0.84-1.10) 1.05 (0.93-1.18) 1.25 (1.11-1.42) 1.12 (0.99-1.27) Widowed 0.62 (0.47-0.82) 1.26 (1.02-1.56) 1.37 (1.10-1.69) 1.24 (1.01-1.51) Divorced 0.82 (0.41-1.67) 1.02 (0.57-1.81) 1.82 (1.03-3.20) 1.09 (0.64-1.86) Not living together 0.63 (0.44-0.91) 1.16 (0.87-1.54) 1.15 (0.86-1.55) 1.09 (0.82-1.45) Respondent’s type of earnings for work:
OR (95% CL) OR (95% CL) OR (95% CL) OR (95% CL)
Not paid 1.00 1.00 1.00 1.00 Cash only 1.05 (0.90-1.22) 1.39 (1.21-1.59) 1.05 (0.91-1.22) 0.87 (0.75-1.00) Cash and kind 1.04 (0.86-1.26) 1.51 (1.26-1.81) 1.38 (1.15-1.67) 0.99 (0.82-1.20) In-kind only 0.91 (0.74-1.11) 0.91 (0.74-1.12) 1.12 (0.89-1.40) 0.74 (0.57-0.96) Has own money OR (95% CL) OR (95% CL) OR (95% CL) OR (95% CL) No 1.00 1.00 1.00 1.00 Yes 0.61 (0.54-0.67) 0.55 (0.50-0.60) 0.88 (0.79-0.97) 0.82 (0.74-0.91) Household has a BPL card
Barriers to CareThe variable state of residence was included in all of the models but is not reported here.
Indicates referent response. Testing for interaction between Respondent’s type of earnings for work and Has own money was
significant for the Wald chi-square test at p<0.0001.
Table 7 shows the odds ratios and 95% confidence intervals for barriers to accessing
medical advice or treatment for all three comparison groups, however this table presents
finding specifically for ever-married women to analyze the effects of marriage.
Agricultural labourers more frequently reported that permission, money (statistically
significant), distance, and no health provider were barriers compared to garment workers.
The all women category more frequently reported that permission and money were
barriers to accessing care compared to garment workers; however these results were not
statistically significant. The odds of reporting that money was a barrier to accessing
health care services for agricultural labourers was 1.21 the odds of garment workers. The
odds in favour of money, distance, and no health provider being a problem decrease for
each increasing year of education for ever-married women.
Women who reported to have access to their own source of money were also less likely
to report that permission, money, and no health provider presented barriers. Women with
cash earnings were less likely to report that no health provider was a barrier (OR: 0.78
95% CL: 0.67-0.92) but more likely to report that money was a barrier (OR: 1.28 95%
CL: 1.09-1.50). An increase in the number of years husbands were educated served as a
protective measure against reporting that permission, money, distance and no health
provider were barriers. Women were asked to report on the number of marital control
issues they perceived their partner/husband to have. Women who reported that their
husband had six control issues were more likely to experience all four of the barriers to
accessing health care.
44
Table 7: Multivariable-adjusted odds ratios for barriers to accessing medical advice or treatment for ever-married women across all comparison groups Barriers to Care Outcomes: Permission Money Distance No health provider N: 13,530 13,528 13,529 13,530 C statistic: 0.725 0.726 0.743 0.716 Predictors: OR (95% CL) OR (95% CL) OR (95% CL) OR (95% CL) Group Garment Workers 1.00 1.00 1.00 1.00 Agricultural L. 1.07 (0.85-1.35) 1.21 (1.01-1.45) 1.15 (0.95-1.39) 1.07 (0.87-1.30) All Women 1.03 (0.82-1.30) 1.03 (0.86-1.22) 0.96 (0.79-1.15) 0.96 (0.79-1.17) Age 0.99 (0.98-0.99) 1.01 (0.99-1.01) 0.99 (0.99-1.01) 0.99 (0.99-1.00) Education 0.94 (0.87-1.03) 0.84 (0.78-0.90) 0.84 (0.79-0.90) 0.90 (0.84-0.96) Place of Residence OR (95% CL) OR (95% CL) OR (95% CL) OR (95% CL) Urban 1.00 1.00 1.00 1.00 Rural 1.43 (1.16-1.78) 1.36 (1.15-1.61) 2.56 (2.14-3.06) 1.32 (1.08-1.61) Marital Status OR (95% CL) OR (95% CL) OR (95% CL) OR (95% CL) Married 1.00 1.00 1.00 1.00 Widowed 0.67 (0.50-0.89) 1.23 (1.02-1.50) 1.03 (0.84-1.27) 1.13 (0.94-1.36) Divorced 0.69 (0.29-1.63) 0.82 (0.42-1.59) 1.30 (0.68-2.49) 0.84 (0.44-1.62) Not living together 0.52 (0.33-0.82) 0.90 (0.65-1.24) 0.81 (0.59-1.11) 0.77 (0.55-1.07) Respondent’s type of earnings for work:
OR (95% CL) OR (95% CL) OR (95% CL) OR (95% CL)
Not paid 1.00 1.00 1.00 1.00 Cash only 1.01 (0.84-1.22) 1.28 (1.09-1.50) 1.03 (0.87-1.20) 0.78 (0.67-0.92) Cash and kind 0.99 (0.79-1.24) 1.40 (1.14-1.72) 1.27 (1.03-1.56) 0.90 (0.73-1.11) In-kind only 0.94 (0.74-1.20) 0.96 (0.76-1.20) 1.16 (0.91-1.48) 0.75 (0.58-0.98) Has own money OR (95% CL) OR (95% CL) OR (95% CL) OR (95% CL) No 1.00 1.00 1.00 1.00 Yes 0.66 (0.57-0.75) 0.57 (0.51-0.64) 0.94 (0.83-1.07) 0.88 (0.79-0.99) Household has a BPL card
Outcomes: Permission Money Distance No health provider Freedom of movement:
OR (95% CL) OR (95% CL) OR (95% CL) OR (95% CL)
Respondent is allowed to go to the market:
Not at all 1.00 1.00 1.00 1.00 Alone 1.42 (1.11-1.83) 1.44 (1.15-1.81) 1.14 (0.88-1.47) 1.17 (0.92-1.49) With someone else only 1.70 (1.35-2.15) 1.28 (1.03-1.59) 1.11 (0.85-1.43) 1.47 (1.15-1.86) Respondent is allowed to go to a health facility:
OR (95% CL) OR (95% CL) OR (95% CL) OR (95% CL)
Not at all 1.00 1.00 1.00 1.00 Alone 0.88 (0.61-1.27) 0.94 (0.66-1.34) 0.74 (0.48-1.14) 0.85 (0.57-1.26) With someone else only 1.18 (0.83-1.68) 1.06 (0.77-1.48) 1.11 (0.73-1.69) 1.09 (0.74-1.60) Respondent is allowed outside this community:
OR (95% CL) OR (95% CL) OR (95% CL) OR (95% CL)
Not at all 1.00 1.00 1.00 1.00 Alone 0.29 (0.21-0.39) 0.53 (0.39-0.71) 1.02 (0.74-1.40) 0.93 (0.69-1.25) With someone else only
The variable state of residence was included in all of the models but is not reported here. Indicates referent response Interaction between Respondent’s type of earnings for work and Has own money was significant for the
Wald chi-square test at p<0.0001.
3.3 WOMEN’S EMPOWERMENT AND DOMESTIC VIOLENCE DATA
3.3.1 Descriptive Statistics
The percentage of garment workers who were currently working was 89% compared to
78% of agricultural labourers and 27% of all women (Table 8). In response to whether
garment workers worked seasonally or all year round, 69% of garment workers
responded that they worked all year, more than agricultural labourers of whom only 42%
worked all year. There are differences in where women work; 82% of garment workers
worked from home compared to 6% of agricultural labourers and 20% of all women.
Table 8 shows that garment workers were mostly paid in cash only (91%) with few in-
kind payments, compared to agricultural labourers of whom 19% received cash and kind
payments. For more detailed information on cash earnings consult Table B in the
appendix.
46
Table 8: Select women’s empowerment and domestic violence indicators Women’s
Empowerment Indicators
Garment Workers(4,983)
Agricultural Labourers (11,441)
All Women (21,583)
Employment: % (n) SE % % (n) SE % % (n) SE % Respondent worked in the last 12 months:
- - - - - -
No 0.00 (0) 0.00 0.00 (0) 0.00 68.91 (14,809) 0.56 In the past year 10.07 (458) 0.68 21.20 (2463) 0..75 4.18 (782) 0.23 Currently working
Not at all 13.33 (365) 1.10 13.68 (1354) 0.68 12.01 (1867) 0.40 Missing 0.00 (0) 0.00 0.04 (4) 0.02 0.05 (8) 0.02 Respondent is allowed to go to a health facility:
% (n) SE % % (n) SE % % (n) SE %
Alone 52.08 (2799) 1.36 47.45 (5622) 0.87 47.46 (11,552) 0.58 With someone else only
More garment workers (58%) had access to their own money than agricultural labourers
(47%) and the all women (43%) group. Also, 18% of garment workers had bank/savings
50
accounts compared to only 9% of agricultural labourers and 16% of all women. The
percentage of garment workers who knew about loan programs was 51% but only 14% of
garment workers had taken out loans, compared to 34% of agricultural labourers who
knew of loan programs but 18% had taken out a loan.
Freedom of movement was measured in the NFHS-3 by asking respondents if they were
allowed to go places by themselves, with other people or not at all. Fifty-seven percent of
garment workers reported that they could go to the market alone, 52% reported that they
could go to health facilities alone and 42% reported that they could go outside their
community alone, fewer agricultural labourers and all women were able to go to these
places alone.
Most garment workers had completed secondary education (54%) and 55% of them were
married to men who had also completed secondary education, compared to 46% of
agricultural labourers who were married to men with no education. Most garment
workers (58%) were married to men whose occupation was in the skilled and unskilled
manual labour sector while 57% of agricultural labourers were married to men in
agricultural labour. Thirty-six percent of women in the all women group were married to
men in the skilled and unskilled manual labour sector.
A subsample of women were asked about their perceptions of domestic violence in the
NFHS-3 survey. Several hypothetical domestic scenarios were presented to women and
they were asked if wife beating was justified in those cases. The two reasons for which
most garment workers thought wife beating was justified was a.) when wives
disrespected in-laws (42%) and b.) when wives neglected their children and households
(37%). Agricultural labourers showed similar patterns of justification and agricultural
labourers thought wife-beating was justified in the other scenarios more than both
garment workers and all women. Participants were also asked about their experience of
emotional and/or physical violence. Seventeen percent of garment workers reported
experiencing emotional violence compared to 22% of agricultural labourers. In addition,
13% of garment workers reported experiencing severe physical violence compared to
51
19% of agricultural labourers. For more data on domestic violence consult Table B in the
appendix.
3.3.2 Multivariable Logistic Regression
In the NFHS-3 currently married women were asked about their decision making
abilities. Respondents were asked: who in their household had the final say on various
aspects of their life. Their responses were coded into ‘Respondent Alone’, ‘Respondent
and Husband/Partner,’ ‘Husband/Partner Alone’, ‘Someone Else’, ‘Other’ and ‘Missing’.
For the multivariable logistic regression, the responses ‘Respondent Alone’ and
‘Respondent and Husband/Partner’ were grouped together and the responses
‘Husband/Partner Alone’, ‘Someone Else’, and ‘Other’ were grouped to create binary
outcomes. Descriptive statistics for decision making abilities can be found in the
appendix (Table B). Table 9 reports the odds ratios and 95% confidence intervals for
each decision, significant findings are made bold. Covariables were kept in the model if
they were a) statistically significant (p<0.05) on the Wald chi-square test, b) significant
based on the literature, or c) resulted in a significant change in the -2log likelihood
(intercept and covariables) fit statistic.
Table 9 illustrates that agricultural labourers (OR: 0.69 95% CL: 0.54-0.88) and all
women (OR: 0.75 95% CL: 0.58-0.98) are less likely to make decisions regarding how to
spend their earnings compared to garment workers. As well, agricultural labourers are
less likely to make decisions regarding their own health care (OR: 0.86 95% CL: 0.75-
0.99) when compared with garment workers. The odds in favour of having the final say
jointly with husband/partner on own cash earnings increased an estimated 4% for each
additional year of age and 38% for each increasing level of education for women. The
odds of women with a BPL card to report having the final say on own cash earnings
jointly with husband/partner was 0.80 times the odds of women without BPL cards to
report having the final say on own cash earnings.
Women, who reported having the freedom to go to the market alone were more likely to
engage in decision making on both their own earnings (OR: 1.76 95% CL: 1.33-2.33) and
their own health (OR: 1.82 95% CL: 1.55-2.14). The odds of women who agreed that
52
wife beating was justified if wife argued with partner to report having the final say on
own health care jointly with husband/partner was 0.80 times the odds of women who
disagreed that wife beating was justified if wife argued with partner, to report having the
final say on own health care jointly with husband/partner.
Table 9: Multivariable-adjusted odds ratios for respondent alone/respondent and husband jointly making decisions for currently married women across all comparison groups Decision Making Abilities Outcomes: Own earnings Own health N: 10,993 26,852 C Statistic: 0.747 0.690 Predictors: OR (95% CL) OR (95% CL) Group: Garment Workers 1.00 1.00Agricultural L. 0.69 (0.54-0.88) 0.86 (0.75-0.99) All Women 0.75 (0.58-0.98) 0.88 (0.76-1.01) Age 1.04 (1.03-1.05) 1.03 (1.02-1.03) Education 1.38 (1.25-1.52) 1.12 (1.07-1.03) Household has a BPL card
OR (95% CL) OR (95% CL)
No 1.00 1.00 Yes 0.80 (0.69-0.92) 0.88 (0.81-0.96) Has own money OR (95% CL) OR (95% CL) No 1.00 1.00 Yes 1.67 (1.44-1.93) 1.15 (1.05-1.25) Husband’s education 1.00 (0.94-1.07) 0.92 (0.89-0.95) Freedom of movement: OR (95% CL) OR (95% CL) Respondent is allowed to go to the market:
Not At all 1.00 1.00 Alone 1.76 (1.33-2.33) 1.82 (1.55-2.14) With someone else only 1.32 (1.02-1.71) 1.38 (1.19-1.59) Respondent is allowed to go to a health facility:
Not At all 1.00 1.00 Alone 1.64 (1.13-2.38) 1.22 (0.97-1.54) With someone else only 1.00 (0.71-1.42) 0.87 (0.70-1.08)
53
Outcomes: Own earnings Own health Perceptions of domestic violence:
OR (95% CL) OR (95% CL)
Wife beating justified if she argues with him
No 1.00 1.00 Yes 1.00 (0.87-1.16) 0.80 (0.73-0.87) The variables state of residence was included in both models but is not reported here.
Indicates referent response Interaction between Household has a BPL card and Has own money was
significant for the Wald chi-square test at p<0.0001.
54
CHAPTER 4: DISCUSSION
4.1 DEMOGRAPHICS
According to the NFHS-3, 59.7% of Indian women reported having no occupation. The
two most frequently reported occupations were agricultural labourers (9.2%) and garment
workers (4%). As two of the largest providers of employment for Indian women, the
effect of these occupations in the empowerment of women with regard to their decision -
making in health and health care access was important to analyze.
Garment workers were described using data from the most recent (2005-06) National
Family Health Survey (NFHS-3). Descriptive statistics suggested that garment workers
deviated less from the ‘all women’ category which is representative of all women in India
than the agricultural labourers. Generated frequencies portrayed garment workers as a
younger demographic group, most of whom had completed secondary education and
married men who were equally educated and also worked in skilled or unskilled manual
labour. Fewer garment workers were married compared to both the agricultural labourers
and the all women group. In our discussions with managers in garment factories from
Karnataka, India, many reported that most of their employees were young, unmarried
women who had just completed secondary education. This population provides the
garment industry with young fresh talent to fuel its business. The managers reported that
there was a high turnover rate as young women would work as garment workers until
they were married, at which point they would leave to have children and then return once
the children were older.
Descriptive statistics found that 82% of garment workers worked from home. Although
not distinguishable in the dataset, most of these garment workers most likely worked
informally as home-based tailors. The 18% of garment workers in our dataset who
worked away from home may be garment workers who work in factories. In contrast
94% of agricultural labourers worked away from home. As 69% of agricultural labourers
belonged to the poorest-poorer wealth index, most agricultural labourers farm on land
that does not belong to them whereas the 6% of agricultural labourers that do work from
55
home may be subsistence farmers. Occupation-specific information would be useful here
for further analyses.
Results suggested that more garment workers lived in urban centers (59%) instead of
rural areas. This finding may also be related to why garment workers are more educated
and wealthier than agricultural labourers. This may also be due to migration of garment
workers from rural areas to urban centers looking for work(48) both in factories or from
operating tailoring business’ that draws from the higher population density found in
cities. Agricultural labourers in contrast lived more so in rural areas (93%) than in urban
areas. This is not an unexpected finding, however this implies that agricultural labourers
are often deprived of the amenities found in urban arenas indicating an urban bias(19).
Fewer garment workers held BPL cards (25%) compared to agricultural labourers (40%)
and most reported to belong to the ‘richer’ wealth index (34%) whereas 38% of
agricultural labourers belonged to the ‘poorest’ wealth index. Therefore it appears that
based on employment alone garment workers have a higher SES. However, it is difficult
to say whether it is the occupation – garment work or whether the fact that they are more
educated, live predominantly in urban areas, and are married to more educated men that
keeps garment workers in the higher wealth bracket. It is important to note however that
91% of garment workers received cash only as their method of payment compared to
both agricultural labourers and all women, of whom only 46% and 54% respectively,
received cash only payments. This is consistent with results from NFHS-3 reports(20).
This finding does suggest that garment work as a mode of employment provides women
with more access to their own source of money when compared with agricultural
labourers.
Assessing crude changes in frequencies for certain demographic indicators collected over
two cross-sectional time periods from the NFHS-2 to NFHS-3 shows that garment
workers as a population have realized better outcomes in several areas. Results suggest
that garment workers have become more educated, are younger, more urban, more work
year-round and more make cash only and marry similarly educated men.
56
4.2 HEALTH CARE UTILIZATION AND BARRIERS TO CARE
Health insurance coverage was low amongst garment workers but was close to the
national average of 5% as represented by the all women comparison group in our study
and as reported in the NFHS-3 (20). However, this may be due to the fact that 80% of
garment workers in this sample worked from home and were most likely informal self-
employed workers without access to ESI benefits (factory working garment workers
would). One percent of agricultural labourers reported having a member of their
household covered by health insurance. This finding is supported by the fact that
agricultural labourers tended to marry men who also worked in agricultural labour, which
generally does not provide health insurance coverage. Having a member of the household
covered by health insurance proved to be protective against different barriers to health,
especially if women were married.
Garment workers who did report having a member in the household with insurance
tended to have Employee State Insurance Scheme and private insurance as the two most
popular forms of coverage and sought care primarily from private doctors followed by
care from government hospitals. This is consistent with national data from the NFHS-
3(20). The reason most commonly cited by garment workers for not using government
facilities was the poor quality of care delivered in government facilities; this was echoed
by agricultural labourers and women in general. This finding is also shown in the national
data from the NFHS-3(20).
Our hypothesis based on our theoretical framework was that garment workers would
report facing fewer barriers to accessing health care due to their access to more cash
earnings. This assumption proved to be true, however after controlling for a number of
covariables in our regression models, this assumption was only statistically significant for
money as a barrier (although the trend was similar for all other barriers as well). Garment
workers reported that money was less of a problem to accessing health care than it was
for agricultural labourers.
57
The regression models for all barriers: permission, money, distance and no health
provider all showed that women with access to their own money reported fewer barriers
to accessing medical advice or treatment. This speaks to the importance of employment,
more specifically garment work as an income source which helps to reduce poverty and
inequality resulting in improved living standards for garment workers and their families.
This is shown by 91% of garment workers receiving cash as their method of payment
unlike both agricultural labourers and all women, of whom only 46% and 54%
respectively, received cash as payments. Therefore our hypothesis that fewer garment
workers would report facing barriers such as permission, money, distance and no health
provider because they had access to their own cash earnings was reflected in the results
from the regression models.
As garment workers tended to be mostly populated in urban centers, fewer of them used
the services of grass roots health personnel like ASHA's, AWW's and LHV's who are
mostly in rural areas. Whereas 93% of agricultural labourers lived in rural India and often
used their services compared to garment workers who sought most of their care from
physicians who are rare in rural areas. This may explain why no health provider appears
to be a bigger problem for agricultural labourers than it is for garment workers, but it was
not a statistically significant finding.
Ever-married women, particularly widows reflected an interesting relationship with the
barriers. Widows were less likely to report that permission was a barrier to accessing
health care when compared with married women, but were also more likely than married
women to report that money was a barrier to accessing health care. These are interesting
findings as they speak to the independence of widows and their freedom of movement,
however as they may be the only income earners, money might be spread thin and
accessing medical advice might prove to be too expensive.
Married women’s experience of barriers to health care is heavily influenced by their
husband’s education levels, his control issues and her freedom of movement. The odds in
favour of reporting permission, money, distance and no health provider as barriers to care
58
decreased for each additional year of husband’s education. As well, when respondents
reported that their husband had six control issues compared to none the odds of them
reporting that permission, money, distance and no health provider were barriers increased
substantially. This indicates the large role that husband’s play in women’s access to
health care services. Therefore, this speaks to the importance of women having their own
income to assist them with overcoming barriers to health care services.
Several barriers such as permission, money, distance and no health provider to accessing
medical advice or treatment were assessed for garment workers, agricultural labourers
and women in general in India. In general, enabling factors for low self-reported barriers
were age, higher education levels, access to their own money and living in urban areas.
Women who were married were also affected by their husband’s education level, his
number of control issues as well as her freedom of movement. Women who reported cash
earnings were more likely to report that money was a barrier to accessing health care,
even though women who had their own money reported that money was not a barrier.
However, there was a significant interaction between the variables respondent’s type of
earnings and women having their own money at p<0.0001.
4.3 WOMEN'S EMPOWERMENT AND DOMESTIC VIOLENCE
More garment workers were employed all year (69%) compared to agricultural labourers
who were mostly seasonal workers (53%). Since garment workers worked year round and
had dependable employment they also had more money for their own use compared to
agricultural workers. Also, 91% of garment workers received cash payments compared to
agricultural labourers and all women who received no payment, cash and kind, and rarely
only cash. This resulted in less hard cash for these two comparison groups. In contrast,
99% of currently married men aged 15-49 in the NFHS-3 were employed, of which 92%
earned cash for their work(20). Therefore “not only are currently married women less
than half as likely as currently married men to be employed, but when employed, they are
only 70% as likely as men to be paid only in cash and five times as likely as men to not
receive any earnings at all”(20).
59
According to our hypothesis based off our theoretical model, having a source of income
provides women with increased decision-making abilities thereby acting as an
empowering tool. This was demonstrated in all of the regression models by women with
access to their own source of money reporting less barriers to health care and having
more decision making abilities. According to the NFHS-3, “The proportion of women
who themselves mainly decide the disposition of their own earnings increases with age,
education and wealth, whereas the proportion for whom the husband mainly decides,
decreases with age, education and wealth”(20). As previously mentioned, according to
the World Bank, when women play larger roles in deciding how household money is
spent, a larger share gets spent on child and welfare expenditures(20).
The results from this study show that employment with cash earnings increases the
likelihood of women participating in decision making (20). Women with access to their
own source of money had more say in the decisions that were measured. They had a final
say either alone or jointly with their partners on how their cash earnings were spent, how
their partner's cash earnings were spent, on their own health care, purchasing daily needs
and visiting family. As 58% of garment workers had money for their own use compared
to 47% of agricultural workers and 43% of women in general, garment workers were
more likely to have negotiating powers at home. The regression models for
empowerment showed that agricultural labourers and all women were less able to have
decision making powers regarding their own earnings and health compared to garment
workers. The importance of this finding lies in how garment work as an income source is
a tool in improving daily living conditions which address the social determinants of
health. Women who work as garment workers are given more opportunities to improve
their welfare as well as their families.
Living in urban areas and more years of education are also enabling factors for decision
making capabilities which is consistent with national level data(20). Women who were
older, had the freedom to go to the market or health facilities alone, and had their own
money had more decision making abilities. In India “45 percent of all women aged 15-49
say that they have some money that they can use; 15 percent have a bank or savings
60
account that they themselves use; 39 percent know of a programme that gives money to
women to start or expand a business of their own; and only 4 percent of all women have
ever taken a loan from such a programme”(20). These indicators increased for women
who were employed for cash. More garment workers were allowed to go to the market,
health facilities and outside of their community on their own than women in either of the
other groups. Women, whose household held a BPL card, were less likely to make
decisions regarding their own earnings or their own health. This once again illustrates the
need for the social determinants of health to be addressed. The finding that poorer women
are less able to make decisions regarding their health and earnings is an issue that affects
not only the woman herself, but her family and her society.
A normative behaviour that is commonly accepted in India is the ‘right’ of husbands to
have power over their wives’ behavior and bodies through whatever means
necessary(20). Women who believed that husbands’ should control their wives may be
perceived to be less empowered and their acceptance of these norms need to be
addressed(20). Perceptions of domestic violence play an important role in women’s
empowerment. Women who believed that wife beating was justified if she argued with
husband were less likely to make decisions regarding her own health. Garment workers
were all less likely to agree with wife beating which may have increased their likelihood
of making decisions and facing fewer barriers. For married women, the odds in favour of
making decisions regarding their own health increased for every year of husband’s
education.
The theoretical framework for this study highlighted the importance of garment work as
an important source of income for Indian women. The access to cash earnings provided
by garment work were expected to increase their cash earnings thereby increasing their
decision making abilities resulting in empowerment. This theory was backed up by the
results from this study which found that garment workers were more likely to have the
final say on decisions regarding their own cash earnings and their own health.
61
4.4 LIMITATIONS
The limitations to this study stem primarily from the fact that the NFHS uses self-report
data. This has many advantages but is also associated with several biases. One of the
biases that may play a role is volunteer bias by women who decided to participate being
inherently different from women who declined to take care part of the survey. There
might also be some recall bias, over reporting of positive health care indicators like the
number of health facility visits and the under reporting of the prevalence of domestic
violence. There are also other biases based on respondent's misinterpretation of questions,
such as the possible under reporting of general health problems due to lack of knowledge
of disease pathology. The survey design, large sample size and data collection through
the use of multilingual well trained interviewers helped to reduce sources of bias,
however findings may be subject to confounders and interactions which were not
addressed. As well, as multiple women were interviewed from the same household the
data might have an unknown degree of clustering. This results in a lack of independence
among individuals in the same cluster which can lead to complicated methodological
challenges in both design and analyses.
Other limitations to the study are found in the data analyses, such as the grouping of
various similar but different occupations (spinners, weavers, knitters, dyers, tailors, dress-
makers, sewers, upholsterers and related workers) into one umbrella garment worker
occupation category. As well, as 80% of garment workers reported working from home,
it was not known whether these women owned their own tailoring business at home,
worked on assignment, worked under an employer/family business, or self-employed it
was difficult to describe the group given a lack of specificity. Also, when respondents
were asked about their occupation if they reported to be a general labourer working in the
garment industry, they would have been coded simply as a labourer and would not have
been captured.
As well when variables were dichotomized for the multivariable logistic regression some
information was lost. As the NFHS is a health survey for the entire population of India,
the type of garment workers we pooled are representative of the garment workers in
62
India. However, the results would have been much richer if a survey particularly
designed for garment workers could have been employed. This would have provided data
specific to garment workers and would have enlightened us on whether these garment
workers worked for the export or domestic market, whether they moved to their current
address from somewhere else, where they left their children when they go to work and
other occupation specific questions.
4.5 FUTURE STUDIES
As the present study was mainly descriptive, it would be beneficial in future studies to
test for interactions amongst the different explanatory variables to detect at which levels
interactions were taking place to tease out exact relationships. As well, a deeper analysis
on confounder variables should be undertaken. The next step would be to conduct
primary data collection from garment workers in both formal and informal employment
in India to compare against our data. Comparing the similarities between this subsample's
characteristics to the nationally representative sample provided by the NFHS-3 may
provide more accurate results.
4.6 SUMMARY
Access to fair and consistent employment will reduce poverty and inequalities and
improve the daily living conditions of women and their families. The focus of this paper
was to test the hypothesis that garment work as a source of income for women would
provide more cash earnings resulting in decreased barriers to accessing health care
services and increased decision making abilities. Female garment workers were
compared to both women in agricultural labour (the largest source of employment for
Indian women) and women in general in India to see how they compared. This study used
descriptive statistics and multivariable logistic regression analyses to model whether
women’s empowerment indicators such as decision making, access to resources,
domestic violence, and gender role attitudes differed between these groups.
This study is the first to specifically report on Indian female garment workers using the
NFHS. We compared the effects of their occupation on their health behaviours and
63
measures of empowerment. We found that, in general, garment workers are younger,
more educated and more are unmarried, more urban, belong to a higher wealth index,
earn more cash and have more access and control over their own source of wealth
compared to agricultural labourers and women in general in India. Fewer garment
workers than agricultural or all women agreed that wife beating should be justified. On
average garment workers were married to men with more education and to men who also
worked in skilled and unskilled labour. These enabling factors resulted in garment
workers having more decision making powers on control over their own earnings and
control over their own health care.
These findings support hypotheses that access to income empowers women by allowing
them to take part in more decision making and reduces barriers to accessing health care
services. However, it is important to recognize the presence of more complex social
interactions. Garment work is an important source of income for women in India,
resulting in increased women’s empowerment. Therefore these data suggest that efforts to
ensure regular employment as well as healthy and safe working conditions would result
in broad public health benefits for women and their families.
64
BIBLIOGRAPHY
1. Labonte R, Schrecker T, Packer C, Runnels V. Globalization and Health: Pathways, Evidence and Policy. Routledge - Taylor & Francis Group; 2009.
2. WHO. WHO | Social determinants of health [Internet]. 2011 [cited 2011 Dec 1];Available from: http://www.who.int/social_determinants/en/
3. World Bank. India | Data [Internet]. [cited 2011 Sep 29];Available from: http://data.worldbank.org/country/india
4. CITI. CITI Confederation of Indian Textile Industry [Internet]. 2008 [cited 2011 Sep 29];Available from: http://www.citiindia.com/indian_overview.asp
5. National Centre for Labour. Introduction [Internet]. 2009;Available from: http://nationalcentreforlabour.org/about_us.html
6. Women Working Worldwide. Garment Industry Subcontracting Chains and Working Conditions. 2004.
7. United Nations. TNCs and the Removal of Textiles and Clothing Quotas. 2005.
8. United Nations Development Programme. What are the Millennium Development Goals? [Internet]. [cited 2011 Oct 3];Available from: http://www.undp.org/mdg/basics.shtml
9. Sen A. Commencement Address [Internet]. 2000 [cited 2011 Sep 29];Available from: http://commencement.harvard.edu/2000/sen.html
10. Paul-majumder P, Begum A. The Gender Imbalances in the Export Oriented Garment Industry in Bangladesh. Gender and Development. 2000;(12).
12. Chaari N, Amri C, Allagui I, Bouzgarrou L, Henchi M-A, Bchir N, et al. Work related asthma in the textile industry. Recent patents on inflammation allergy drug discovery [Internet]. 2011;5(1):37-44. Available from: http://www.ncbi.nlm.nih.gov/pubmed/21184667
13. Serra C, Kogevinas M, Silverman DT, Turuguet D, Tardon A, Garcia-Closas R, et al. Work in the textile industry in Spain and bladder cancer. Occup Environ Med [Internet]. 2008;65(8):552-559. Available from: http://www.ncbi.nlm.nih.gov/entrez/query.fcgi?cmd=Retrieve&db=PubMed&dopt=Citation&list_uids=18045847
65
14. Saiyed HN, Tiwari RR. Occupational health research in India. Industrial health [Internet]. 2004 Apr;42(2):141-8. Available from: http://www.ncbi.nlm.nih.gov/pubmed/15128163
15. Directorate General Factory Advice Service and Labour Institutes. Safety and Health Statistics Report [Internet]. 2005;Available from: http://dgfasli.nic.in/fact_stat08.htm#a16
16. Grant Thornton International. Corporate Social Responsibility: a necessity not a choice. 2008.
17. Directorate General Factory Advice Service and Labour Institutes. Safety and Health Statistics Report [Internet]. 2009. Available from: http://dgfasli.nic.in/info1.htm
18. Reddy KS, Patel V, Jha P, Paul VK, Kumar AKS, Dandona L. Towards achievement of universal health care in India by 2020: a call to action. Lancet [Internet]. 2011 Feb 26 [cited 2011 Aug 5];377(9767):760-8. Available from: http://www.ncbi.nlm.nih.gov/pubmed/21227489
19. Balarajan Y, Selvaraj S, Subramanian SV. Health care and equity in India. Lancet [Internet]. 2011 Feb 5 [cited 2011 Aug 5];377(9764):505-15. Available from: http://www.pubmedcentral.nih.gov/articlerender.fcgi?artid=3093249&tool=pmcentrez&rendertype=abstract
20. International Institute for Population Sciences (IIPS) and Macro International. National Family Health Survey (NFHS-3), 2005-06:India: Volume 1. 2007.
21. WHO. WHO | India: Country Profile [Internet]. 2009 [cited 2011 Oct 3];Available from: http://www.who.int/countries/ind/en/
22. United Nations Development Programme. International Human Development Indicators [Internet]. 2010 [cited 2011 Oct 3];Available from: http://hdrstats.undp.org/en/countries/profiles/IND.html
23. WHO. World Health Statistics - 2011. 2011.
24. WHO. Standards for Maternal and Neonatal Care [Internet]. 2006. Available from: http://www.who.int/making_pregnancy_safer/publications/standards/en/index.html
25. ESIC. ESIC Home Page [Internet]. 2011 [cited 2011 Oct 13];Available from: http://esic.nic.in/
66
26. Gulliford M, Figueroa-Munoz J, Morgan M, Hughes D, Gibson B, Beech R, et al. What does “access to health care” mean? Journal of health services research & policy [Internet]. 2002 Jul;7(3):186-8. Available from: http://www.ncbi.nlm.nih.gov/pubmed/18297380
27. WHO. Women and Health: Today’s evidence and Tomorrow's Agenda [Internet]. World Health Organization; 2009. Available from: http://whqlibdoc.who.int/publications/2009/9789241563857_eng.pdf
28. Peters DH, Garg A, Bloom G, Walker DG, Brieger WR, Rahman MH. Poverty and access to health care in developing countries. Annals of the New York Academy of Sciences [Internet]. 2008 Jan [cited 2011 Jul 6];1136:161-71. Available from: http://www.ncbi.nlm.nih.gov/pubmed/17954679
29. Haque MA, Begum HA, Fahmida H. Supply-side effect of health care facilities on productivity amongst the female workers in the readymade garment sector. Ibrahim Medical College Journal. 2008;2(1):4-8.
30. Brown DK, Downes T, Eggleston K, Kumari R. Human Resource Management Technology Diffusion through Global Supply Chains: Buyer-directed Factory-based Health Care in India. World Development [Internet]. 2009 Sep [cited 2011 Oct 11];37(9):1484-1493. Available from: http://dx.doi.org/10.1016/j.worlddev.2009.01.004
31. Iyer A, Sen G, George A. THE DYNAMICS OF GENDER AND CLASS IN ACCESS TO HEALTH CARE : EVIDENCE FROM RURAL KARNATAKA , INDIA. International Journal. 2007;37(3):537-554.
32. Linos A, Kirch W. Promoting Health for Working Women [Internet]. Springer; 2008 [cited 2011 Oct 11]. Available from: http://www.springer.com/public+health/book/978-0-387-73037-0
33. Gokaldas Exports Ltd. Gokaldas Exports Ltd. - Social Initiatives [Internet]. 2011 [cited 2011 Oct 13];Available from: http://www.gokaldasindia.com/social-initiatives.html
34. Joseph B, Kiran PR. A Stitch in Time: Annual Health Appraisal of Garment Industry Employees. Pakistan Journal of Medical Sciences [Internet]. 2008;24(1):4. Available from: http://pjms.com.pk/issues/janmar08/article/article21.html
35. Silpasuwan P, Viwatwongkasem C, Phalee P, Kalampakorn S. Evaluating Occupational Health Nursing Units in Bangkok Textile Factories. AAOHN J. 2006;54(2):69-74.
36. Cheston S, Kuhn L. Empowering Women through Microfinance. Program.
38. UN. The Millennium Development Goals Report 2009 [Internet]. 2009;Available from: http://www.un.org/millenniumgoals/pdf/MDG_Report_2009_ENG.pdf
39. Krishnan S. Do structural inequalities contribute to marital violence? Ethnographic evidence from rural South India. Violence against women [Internet]. 2005 Jun [cited 2011 Oct 12];11(6):759-75. Available from: http://www.ncbi.nlm.nih.gov/pubmed/16043570
40. Rao V. Wife-beating in rural south India: a qualitative and econometric analysis. Social science & medicine (1982) [Internet]. 1997 Apr [cited 2011 Oct 12];44(8):1169-80. Available from: http://www.ncbi.nlm.nih.gov/pubmed/9131741
41. Rocca CH, Rathod S, Falle T, Pande RP, Krishnan S. Challenging assumptions about women’s empowerment: social and economic resources and domestic violence among young married women in urban South India. International journal of epidemiology [Internet]. 2009 Apr [cited 2011 Aug 3];38(2):577-85. Available from: http://www.pubmedcentral.nih.gov/articlerender.fcgi?artid=2734072&tool=pmcentrez&rendertype=abstract
42. Kaila HL. Women, Work and Family. New Delhi: Rawat Publication; 2005.
43. WHO. Dying for Change: Poor people’s experience of health and ill-health [Internet]. World Health Organization World Bank Voices of the Poor; Available from: http://www.who.int/hdp/publications/dying_change.pdf
44. International Institute for Population Sciences. National Family Health Survey [Internet]. 2011 [cited 2011 Nov 5];Available from: http://www.nfhsindia.org/nfhs3.shtml
45. SAS Institute Inc. SAS Help and Documentation. 2010;
46. SAS Institute Inc. The SURVEYFREQ Procedure: Rao-Scott Chi-Square Test [Internet]. 2011 [cited 2011 Nov 5];Available from: http://support.sas.com/documentation/cdl/en/statug/63033/HTML/default/viewer.htm#statug_surveyfreq_a0000000221.htm
68
47. Bursac Z, Gauss CH, Williams DK, Hosmer DW. Purposeful selection of variables in logistic regression. Source code for biology and medicine [Internet]. 2008 Jan [cited 2011 Jun 22];3:17. Available from: http://www.pubmedcentral.nih.gov/articlerender.fcgi?artid=2633005&tool=pmcentrez&rendertype=abstract
Use of Alcohol % (n) SE % % (n) SE % % (n) SE %Drinks alcohol 0.96 (56) 0.25 4.48 (603) 0.43 1.91 (537) 0.16 Frequency of alcohol use among those who drink alcohol:
% (n) SE % % (n) SE % % (n) SE %
Almost every day 17.27 (6) 8.14 14.80 (85) 2.64 17.27 (73) 2.56 About once a week
19.86 (10) 8.56 46.82 (272) 3.26 45.16 (197) 3.18
Less often 62.69 (39) 12.77 37.47 (242) 3.36 36.47 (265) 3.12 Missing 0.19 (1) 0.19 0.91 (4) 0.47 1.10 (2) 0.78 Health Insurance
% (n) SE % % (n) SE % % (n) SE %
Member of household covered by health insurance
5.24 (287) 0.55 1.01 (152) 0.14 5.71 (1470) 0.28
The type of insurance held among those covered:
% (n) SE % % (n) SE % % (n) SE %
Employee State Insurance Scheme
33.04 (85) 5.49 13.34 (29) 3.69 27.73 (396) 2.07
70
Health Care Utilization Measures
Garment Workers(4,983)
Agricultural Labourers
(11,441)
All Women (21,583)
Central Government Health Scheme
6.74 (29) 1.99 17.14 (21) 5.07 20.32 (285) 1.87
Community Health Insurance Programme
7.43 (17) 2.22 11.07 (15) 3.09 4.96 (56) 0.84
Other health insurance through employer
5.58 (14) 1.96 3.18 (5) 1.50 6.60 (109) 1.04
Medical reimbursement from employer
10.94 (54) 3.25 7.20 (13) 3.33 10.12 (199) 1.23
Other privately purchased commercial health insurance
31.53 (70) 4.50 40.89 (57) 6.61 27.35 (388) 1.76
Other 3.66 (16) 1.50 6.08 (10) 2.89 4.15 (70) 0.78 General Health Problems
Health check-up 7.57 (177) 1.02 7.37 (266) 0.69 7.73 (682) 0.46 Other 0.16 (2) 0.12 0.16 (7) 0.07 0.08 (7) 0.03 Median (Min-Max) Median (Min-Max) Median (Min-Max) Median time waited for Service (min.):
At home 82.34 (4140) 1.28 6.01 (754) 0.48 20.05 (1315) 0.90 Away 17.53 (839) 1.27 93.83(10,670) 0.48 79.85 (5439) 0.90 Missing 0.13 (4) 0.08 0.16 (17) 0.04 0.10 (16) 0.04 Total 4983 11,441 6770 Respondent’s type of earnings for work:
% (n) SE % % (n) SE % % (n) SE %
Not paid 6.40 (307) 0.72 15.54 (2227) 0.93 28.45 (1754) 1.02 Cash only 91.40 (4525) 0.81 45.72 (4937) 1.11 54.39 (4068) 1.07 Cash and kind 1.44 (114) 0.28 19.45 (2169) 0.87 10.40 (575) 0.61 In-kind only 0.70 (34) 0.24 19.27 (2105) 1.24 6.70 (363) 0.54 Missing 0.69 (3) 0.06 0.02 (3) 0.01 0.05 (10) 0.02 Total 4983 11,441 6770 Among married women, cash earnings as compared to husband:
% (n) SE % % (n) SE % % (n) SE %
More than him 6.34 (187) 0.71 8.64 (487) 0.58 11.56 (398) 0.87 Less than him 82.02 (2085) 1.21 76.62 (4237) 0.90 69.67 (2079) 1.28 About the same 7.28 (173) 0.92 8.32 (474) 0.51 12.64 (401) 0.86
Someone else 8.28 (69) 0.96 10.75 (914) 0.59 12.22 (1550) 0.43 Other 2.70 (0) 0.43 1.72 (174) 0.22 3.03 (375) 0.24 Missing 0.00 (0) 0.00 0.09 (9) 0.04 0.07 (12) 0.02 Total 2736 8843 15,291 Who has the final say on making household purchases for daily needs:
Someone else 8.22 (220) 0.95 10.67 (907) 0.59 12.46 (1596) 0.44 Other 2.83 (76) 0.49 1.82 (180) 0.22 2.90 (370) 0.22 Missing 0.00 (0) 0.00 0.09 (9) 0.04 0.06 (10) 0.02 Total 2736 8843 15,291 Who has the final say on visits to family or relatives:
Not at all 13.33 (365) 1.10 13.68 (1354) 0.68 12.01 (1867) 0.40 Missing 0.00 (0) 0.00 0.04 (4) 0.02 0.05 (8) 0.02 Respondent is allowed to go to a health facility:
% (n) SE % % (n) SE % % (n) SE %
Alone 52.08 (2799) 1.36 47.45 (5622) 0.87 47.46 (11,552) 0.58 With someone else only
Not at all 4.74 (158) 0.58 4.91 (497) 0.35 4.59 (759) 0.25 Missing 0.00 (0) 0.00 0.02 (2) 0.02 0.06 (8) 0.03 Respondent is allowed to go to places outside this community:
% (n) SE % % (n) SE % % (n) SE %
Alone 41.76 (2333) 1.37 39.33 (4703) 0.84 37.62 (9235) 0.56 With someone else only