44
What is the relationship between pedagogy, student engagement and literacy? Daniel Bayer Tim McLeod, Nikki Nardelli, Sue Richards
| Date post: | 25-Dec-2015 |
| Category: |
Documents |
| Upload: | iris-phelps |
| View: | 215 times |
| Download: | 2 times |
What is the relationship between pedagogy, student engagement and
literacy?
Daniel Bayer Tim McLeod, Nikki
Nardelli, Sue Richards

http://www.youtube.com/watch?v=KdxEAt91D7k
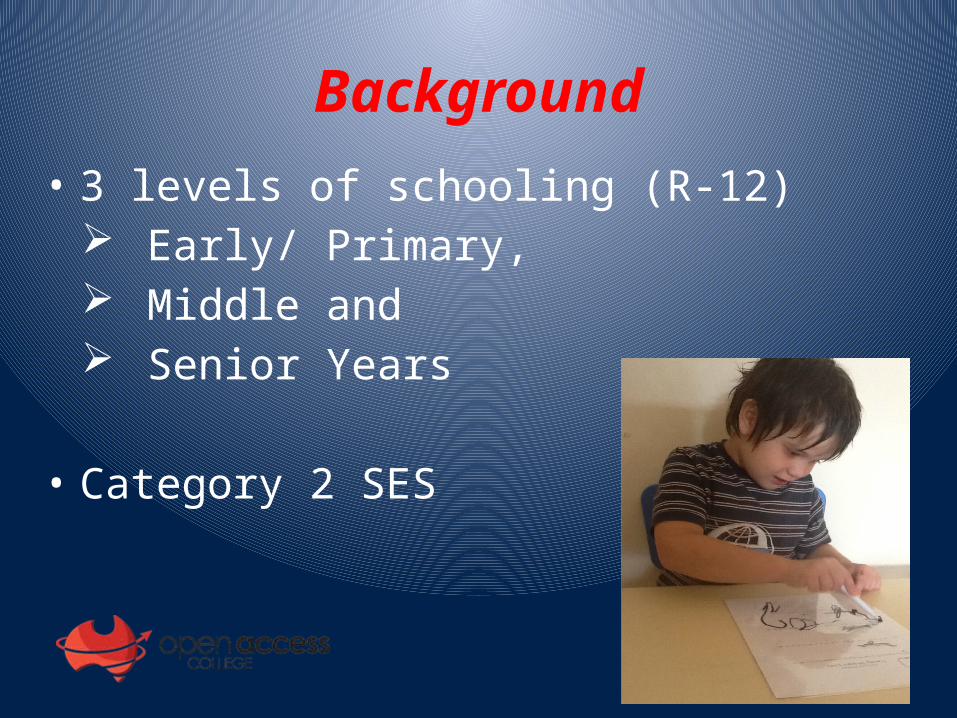
Background• 3 levels of schooling (R-12)
Early/ Primary, Middle and Senior Years
• Category 2 SES

ContextThe student cohort consists of students who enroll for a range of reasons
• Curriculum Choice
• Distance
• Travellers
• Vocational
• At Risk
• Medical (62%)
At Risk7% Curriculum
Choice (Total)
13%
Home Schooler
3%
Medical Issues (Total)62%
Overseas SA resident (home-based)
1%
Remote & Isolated
2%Travellers
8%
Vocational3%
Middle Years Review
Integrated, interactive, online units with a
student interest focus
Team of teachers
Individual Learning Plans
Differentiated curriculum
Literature ReviewThere is considerable research supporting the fact that literacy is integral to effective learning in all curriculum areas and across all phases of learning
Indeed Literacy is essential for students' life-long learning and for their active participation in work, family and civic life in this highly complex and networked world.
DETE Queensland Government, 2012, Literacy the key to Learning

Literacy FocusNational
Melbourne Declaration on Educational Goals for Young Australians (MCEETYA 2008)
Australian Curriculum
State Literacy directorate
East Adelaide Region Priority 1 Improved outcomes in Literacy and Numeracy iLit training

Literacy Focus OAC Literacy Plan R – 12
PALLS training
Site Improvement Plan
Staff training (Stepping Out, First Steps, Phonics)
Literacy for learning

Action ResearchQualitative data
Middle Years profile.
Parent, student and teacher questionnaires.
Student Engagement Matrix.
observation and anecdotal comments on the
implementation of various strategies.
anecdotal records of student progress and attitudes
Action ResearchQuantitative Data
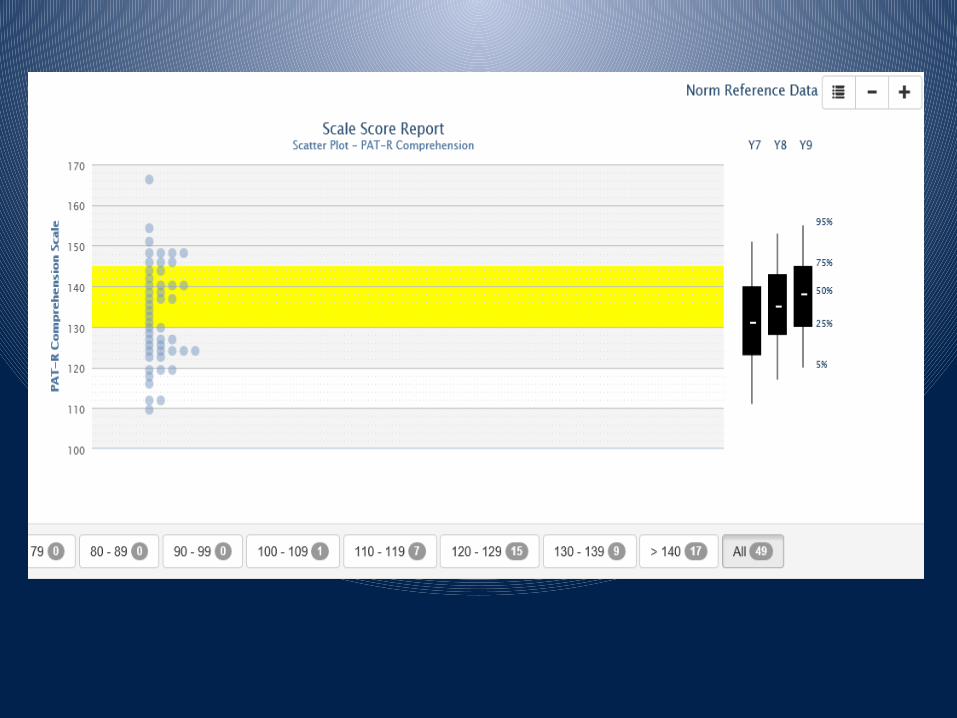
Student PAT Reading and Spelling.
Negotiated Learning Plans.
Attendance.
Work return.
Engagement Matrix.

to monitor your students’ overall development (improvement) in literacy and maths
to help inform the teaching program – identifying areas individual students need to develop (strengths and weaknesses)
Why use PAT Reading And PAT Maths?
The test raw score is the number of correct answers on a test.
The PAT scale score is the test raw score converted
The percentile rank tells you how your students compare to the wider Australian sample.
A stanine groups students of similar achievement.
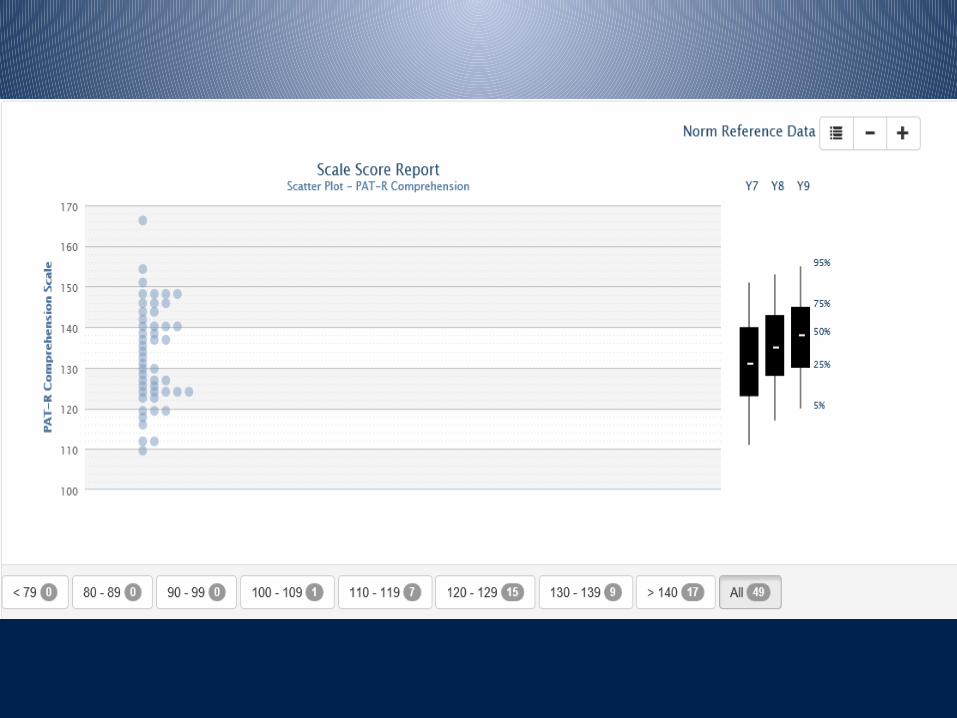
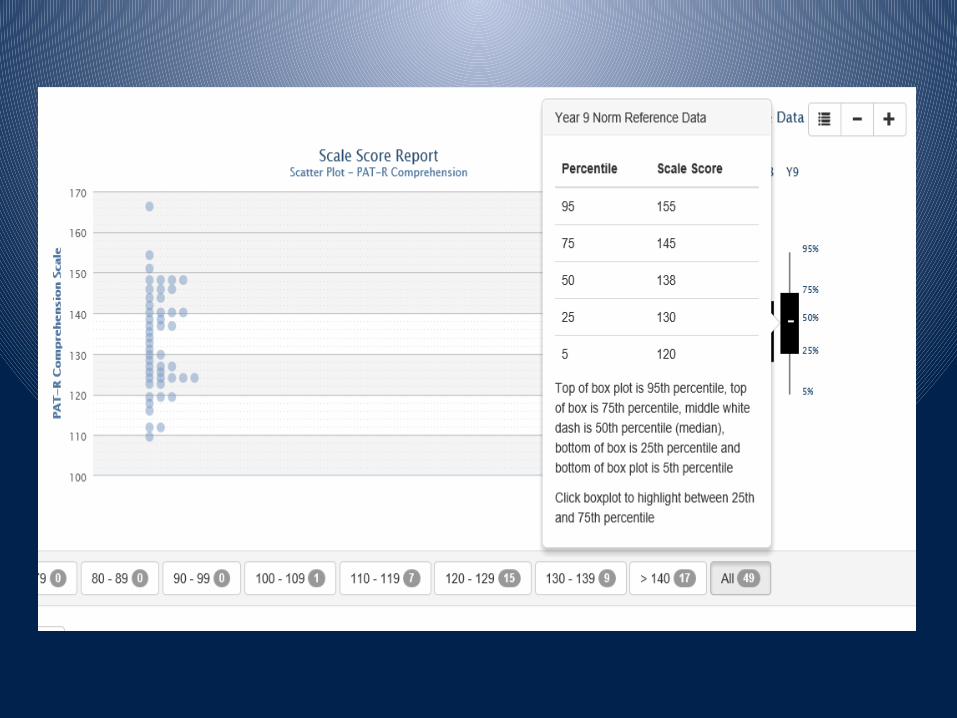
The Results
Stanine scores are derived from percentile ranks. Percentile ranks are divided into nine categories called stanines (short for ‘standard nine’) and the digits ‘1’ to ‘9’ are used as category labels.
Stanine scores are particularly useful for grouping students; however, it is recommended that only differences of two or more stanines should be regarded as indicating a real difference in performance.
Stanines
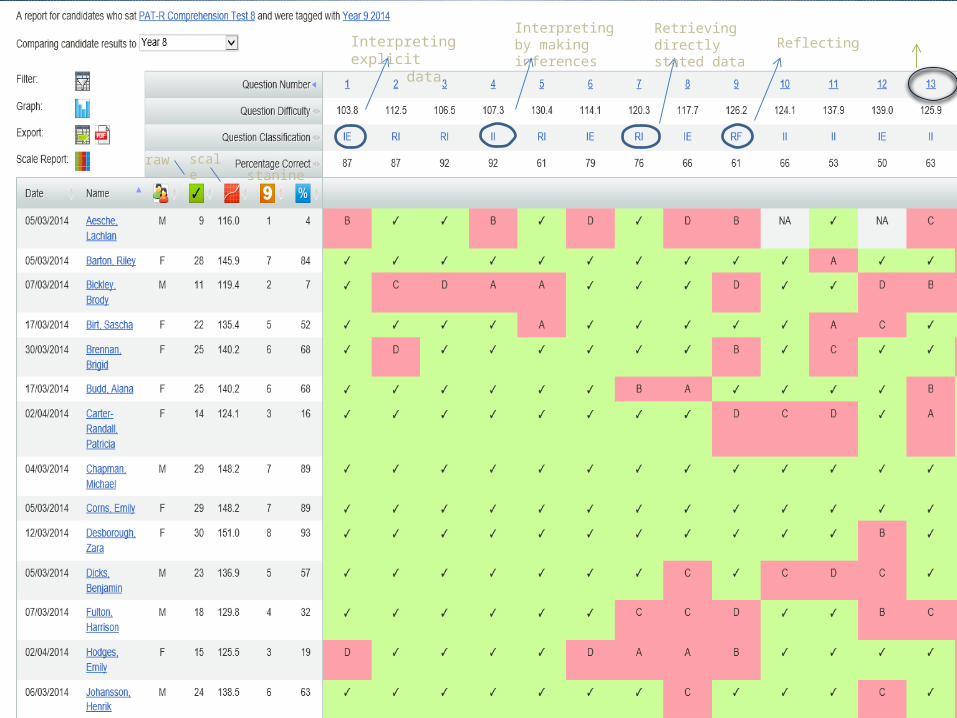
Interpreting explicit
data
Interpreting by making inferences
Retrieving directly stated data
Reflecting
Question number
raw scale stanine

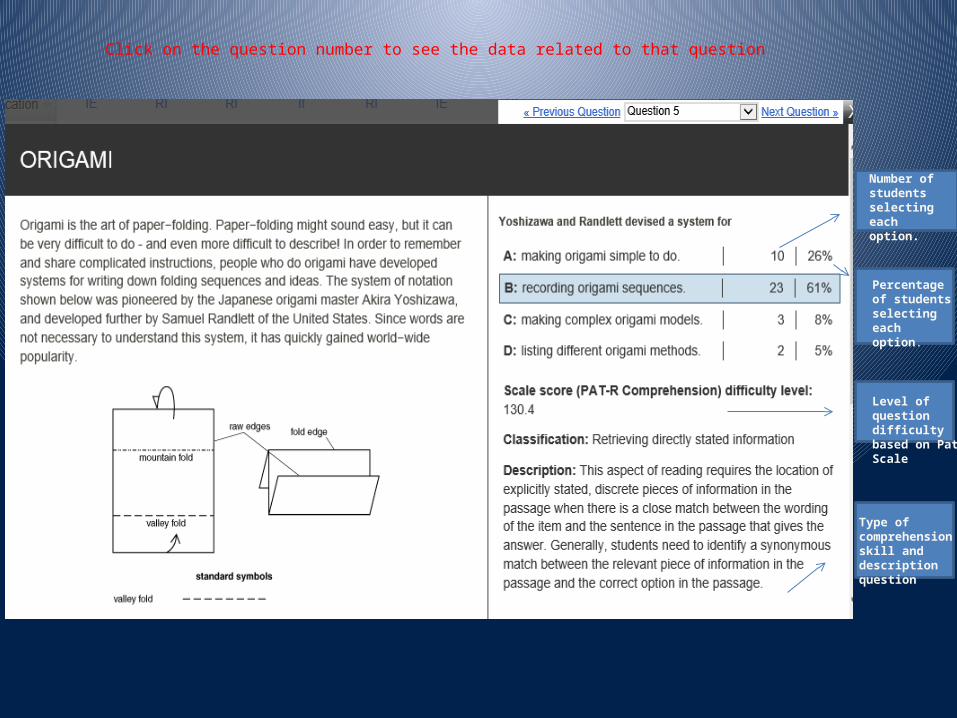
Click on the question number to see the data related to that question
Number of students selecting each option.
Percentage of students selecting each option.
Level of question difficulty based on Pat Scale
Type of comprehension skill and description question
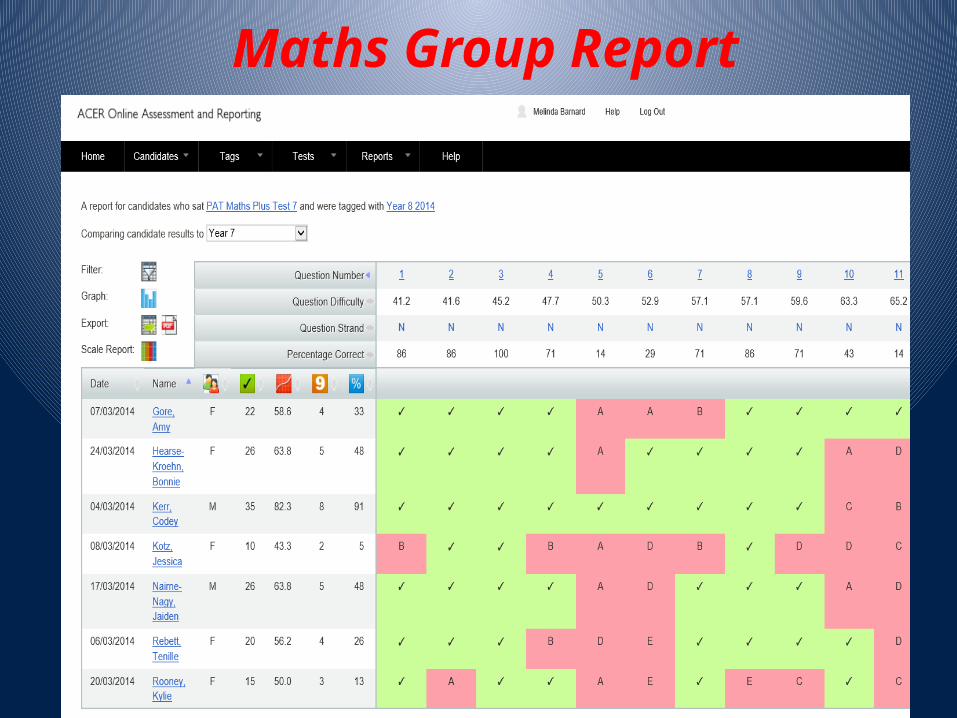
Maths Group Report


You can view the data in different ways

Shows us the amount of students who got that question right or wrong


Wave 3 DefinedWave 3 is about intervention for children for whom Quality First teaching and Wave 2 catch-up programmes are not enough. It may need to be a more intensive programme, involving more individual support or specialist expertise.Where it is working effectively, the waves model will have a funnelling effect, reducing through Quality First teaching the numbers requiring Wave 2 intervention, and through Wave 2 the numbers who need more intensive and individual help..

No. of students
% of students
Significantly disengaged 2 5Partly disengaged 11 24Moderately engaged 19 42Very engaged 8 18Extremely engaged 5 11
Significantly disengaged4%Partly
dis-en-
gaged24%
Moderately engaged42%
Very engaged
18%
Extremely engaged11%
RelationshipsStudent Engagement Data
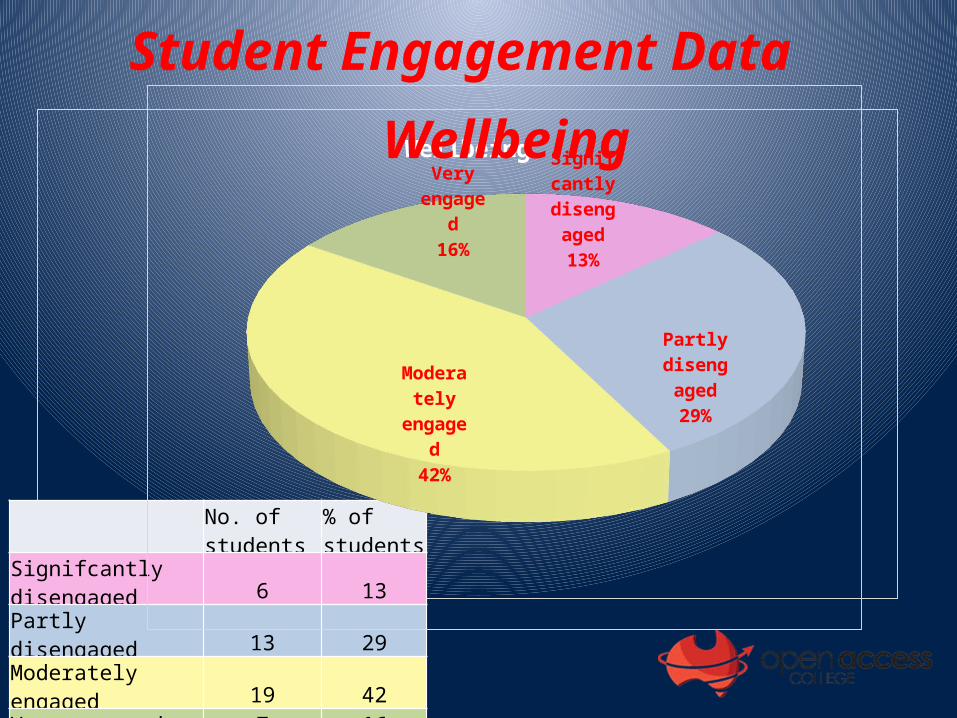
Wellbeing
Student Engagement Data
No. of students
% of students
Signifcantly disengaged 6 13Partly disengaged 13 29Moderately engaged 19 42Very engaged 7 16Extremely engaged 0 0
Sig-nif-
cantly dis-en-
gaged13%
Partly dis-en-
gaged29%
Moder-ately
engaged42%
Very engaged
16%
Wellbeing
No. of students
% of students
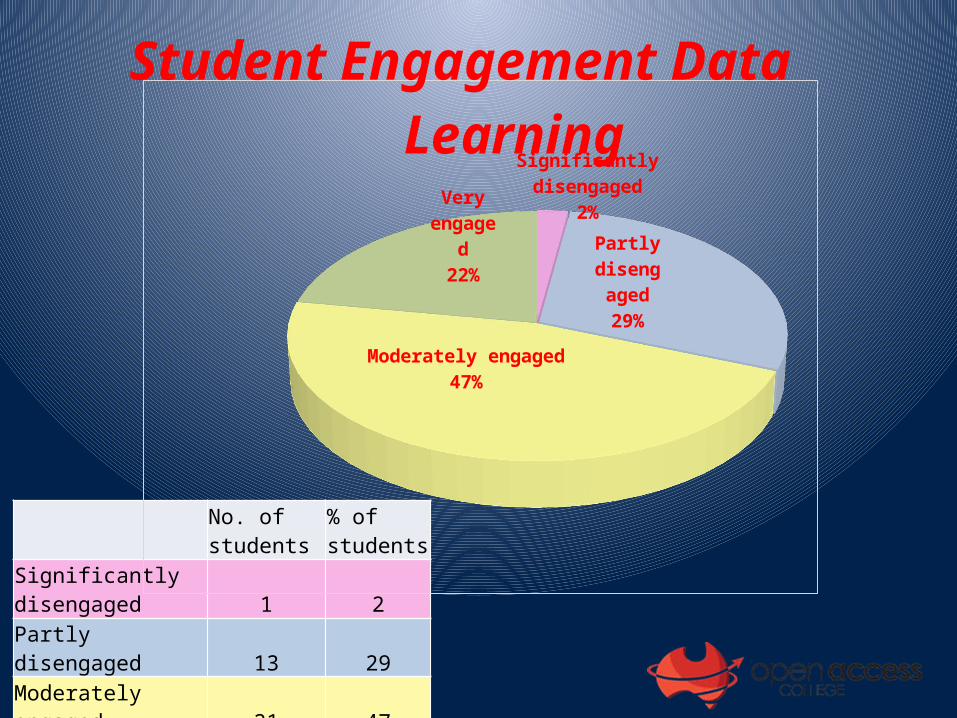
Significantly disengaged 1 2Partly disengaged 13 29Moderately engaged 21 47Very engaged 10 22Extremely engaged 0 0
Significantly disengaged2%Partly
dis-en-
gaged29%
Moderately engaged47%
Very engaged
22%
LearningStudent Engagement Data

No. of students
% of students
Wave 3 22 28Wave 2 20 25CaAAution 17 22Wave 1 20 25
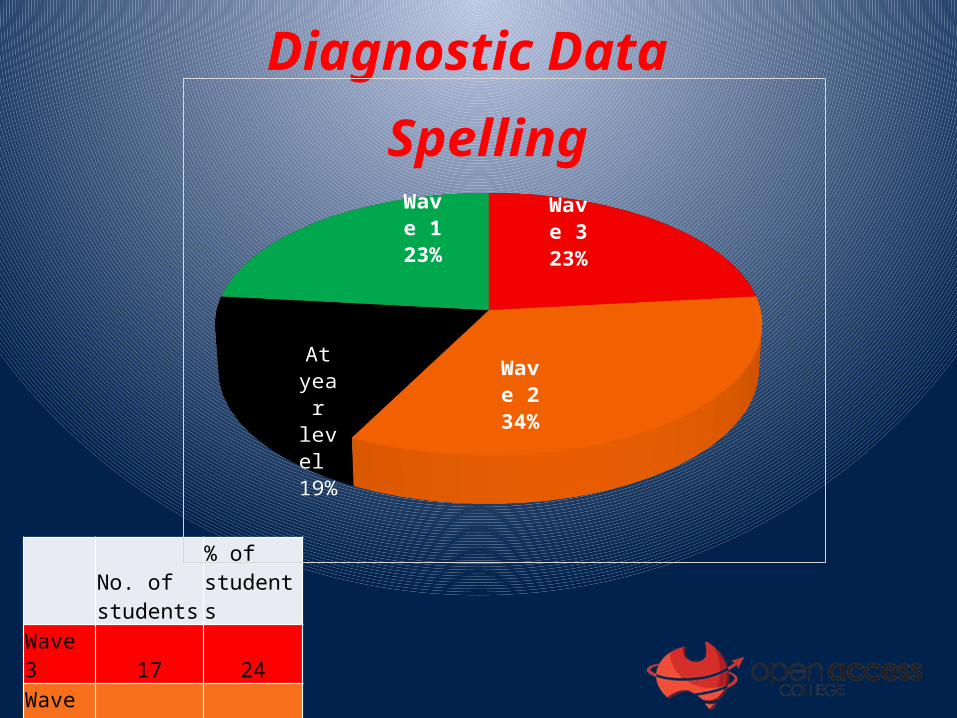
Diagnostic Data
Wave 328%
Wave 2
25%
At Leve
l22%
Wave 1
25%
Reading
No. of students
% of students
Wave 3 17 24Wave 2 25 34Caution 14 19Wave 1 17 23
Diagnostic Data
Wave 3
23%
Wave 2
34%
At year level 19%
Wave 1
23%
Spelling

No. of students % of studentsWave 3 40 49Wave 2 24 29Caution 10 12Wave 1 8 10
Wave 3
49%
Wave 2
29%
Cau-tion12%
Wave 110%
NumeracyDiagnostic Data

Like School Comparison
Reading OAC SES 2 schools
Wave 3 28% 5%
Wave 2 25% 10%
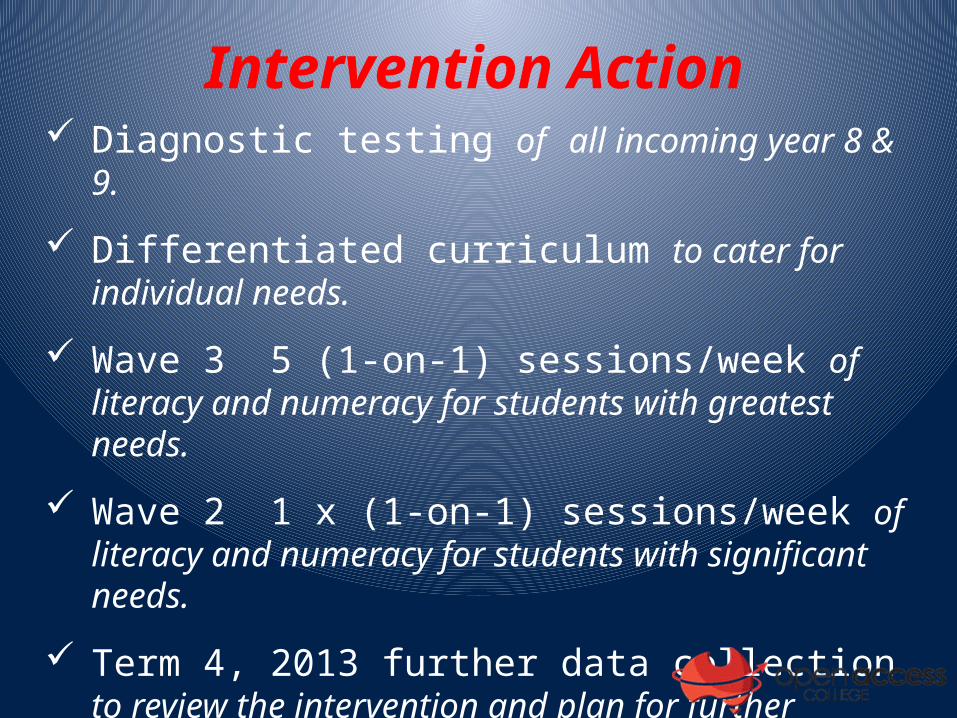
Intervention Action Diagnostic testing of all incoming year 8 & 9.
Differentiated curriculum to cater for individual needs.
Wave 3 5 (1-on-1) sessions/week of literacy and numeracy for students with greatest needs.
Wave 2 1 x (1-on-1) sessions/week of literacy and numeracy for students with significant needs.
Term 4, 2013 further data collection to review the intervention and plan for further action.

Practitioner Research Report
• Sarah Quinn, School of Education Uni SA Magill
• Interviewed a number of staff and students regarding the Wave 3 program
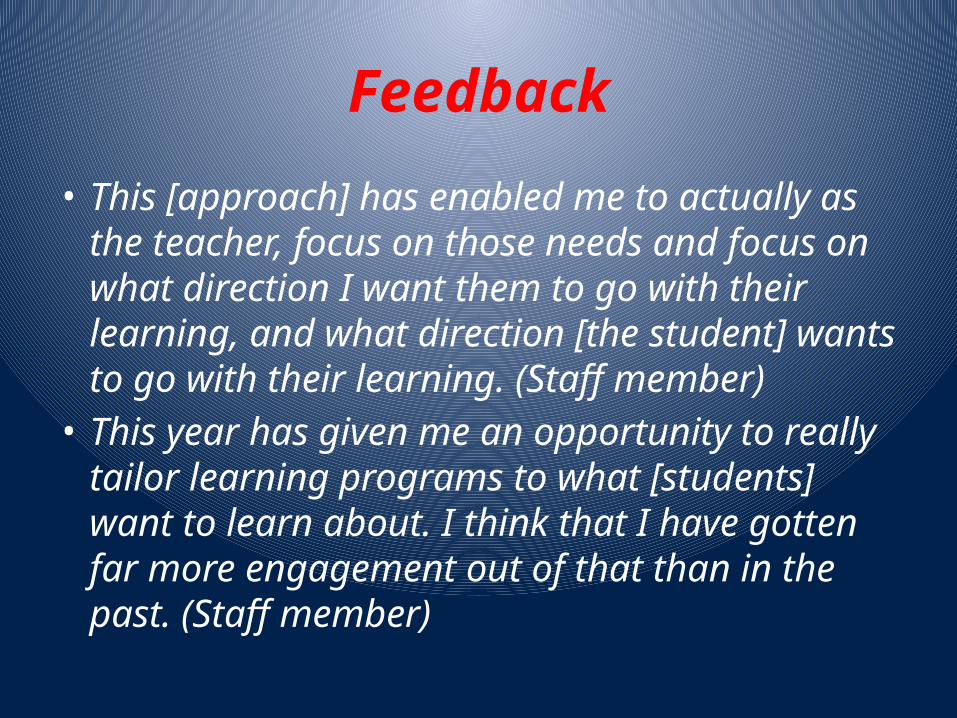
Feedback
• This [approach] has enabled me to actually as the teacher, focus on those needs and focus on what direction I want them to go with their learning, and what direction [the student] wants to go with their learning. (Staff member)
• This year has given me an opportunity to really tailor learning programs to what [students] want to learn about. I think that I have gotten far more engagement out of that than in the past. (Staff member)
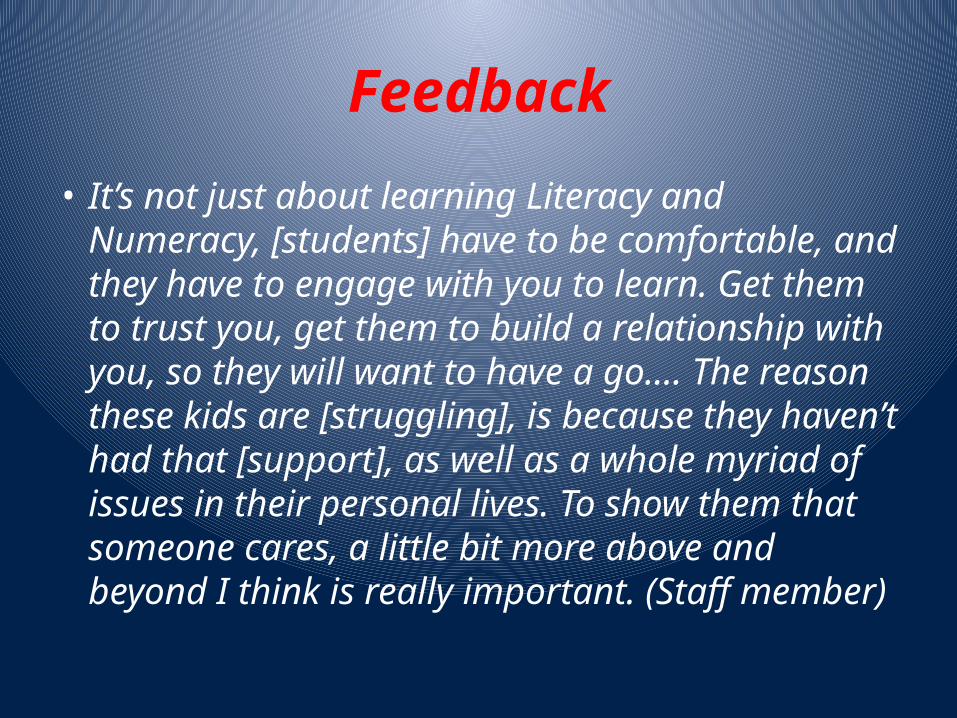
Feedback
• It’s not just about learning Literacy and Numeracy, [students] have to be comfortable, and they have to engage with you to learn. Get them to trust you, get them to build a relationship with you, so they will want to have a go…. The reason these kids are [struggling], is because they haven’t had that [support], as well as a whole myriad of issues in their personal lives. To show them that someone cares, a little bit more above and beyond I think is really important. (Staff member)
Feedback
• Because I have one to one classes, and instead of the teacher worrying about everyone else, they only have to worry about me. (Student participant)
• [Teachers] are always happy and they always want us to learn. (Student participant)

Changes
• As with all Action Based research we are constantly reviewing things.
• Changes made have been : • On line PAT testing• Wave 3 students now have 3 x 25 min per
week• Wave 3 students attend mainstream classes
New Programs
• We are part of a trial using a program called Fast Forword
• Being implemented in the next couple of weeks
• Also we are going to be running online Quicksmart Numeracy program when it comes online in July
ConclusionWe have already learnt from the process and
instigated some changes based on our Action Research
including:
extending testing and student support to incorporate
all students in Years 1 to 10.
valuing socialisation of the student so that Wave 3
learners now attend all their team/class lessons as
well as their support lessons.

Your School
• Does your school have any intervention programs?
• How would a wave 3 program look at your site?

References• Boyd, J, 2001, Effective Middle Schooling, Global Learning Communities,
Aust
• Deakin University, 2001, Literacy an Learning in the Middle Years- Major Report on the Middle Years Literacy Research Project, April 2001, Consultancy and Development Unit, Faculty of Education, Deakin UniversityAvailable at: http://www.eduweb.vic.gov.au/edulibrary/public/teachlearn/student/MYLiteracyFullReport.pdf
• DECS, 2011, ICAN & Mentoring: Student Engagement Matrix,
Government of South Australia
• DETE Queensland Government, 2012, Literacy the key to Learning, http://education.qld.gov.au/literacy/

References• Hattie, John A.C. (2009), Visible Learning: A Synthesis of over 800 Meta-
Analyses Relating to Achievement, Routledge, London
• Rowe, K, 2006, Effective Teaching Practices for students with and without learning difficulties: Constructivism as a legitimate theory of learning and teaching?, ACERhttp://research.acer.edu.au/cgi/viewcontent.cgi?article=1008&context=learning_processes&sei-redir


