February 6, 2012 Anita Arora, DMS Class 2012, in collaboration with the Dartmouth Atlas of Health Care What Kind of Physician Will You Be? End-of-Life Care and Its Effect on Residency Training We look to you, as a Dartmouth medical student nearing graduation, to help transform the quality and value of medical care. Your choice in a residency pro- gram will affect your ability both to care for patients and to lead improvements in patient care for many years. Surely, this is one of the most important decisions you will make in your medical career. Residency location and training curriculum are obviously pivotal factors in your ranking of programs. It is also important to know that each teaching hospital has its own style and culture of practice that represents a hidden training curriculum. This Dartmouth Atlas report will help you understand these less visible hospital characteristics that can have profound effects on how you care for patients during your training and when you are in practice. The report first provides background on variation in health care and then presents information about specific teaching hospitals. When you read the report, we would encourage you to consider the current problems and future opportunities in health care, and how your training can help you become a leader in tomorrow’s health care system. Wiley “Chip” Souba, MD, ScD, MBA Vice-President for Health Affairs and Dean of the Medical School, Dartmouth College John E. Wennberg, MD, MPH Founder and Director Emeritus, The Dartmouth Institute for Health Policy and Clinical Practice David C. Goodman, MD, MS Director of the Center for Health Policy Research, The Dartmouth Institute for Health Policy and Clinical Practice
Transcript
February 6, 2012
Anita Arora, DMS Class 2012, in collaboration with the Dartmouth Atlas of Health Care
What Kind of Physician Will You Be?End-of-Life Care and Its Effect on Residency Training
We look to you, as a Dartmouth medical student nearing graduation, to help transform the quality and value of medical care. Your choice in a residency pro-gram will affect your ability both to care for patients and to lead improvements in patient care for many years. Surely, this is one of the most important decisions you will make in your medical career.
Residency location and training curriculum are obviously pivotal factors in your ranking of programs. It is also important to know that each teaching hospital has its own style and culture of practice that represents a hidden training curriculum. This Dartmouth Atlas report will help you understand these less visible hospital characteristics that can have profound effects on how you care for patients during your training and when you are in practice.
The report first provides background on variation in health care and then presents information about specific teaching hospitals. When you read the report, we would encourage you to consider the current problems and future opportunities in health care, and how your training can help you become a leader in tomorrow’s health care system.
Wiley “Chip” Souba, MD, ScD, MBAVice-President for Health Affairs and Dean of the Medical School, Dartmouth College
John E. Wennberg, MD, MPHFounder and Director Emeritus, The Dartmouth Institute for Health Policy and Clinical Practice
David C. Goodman, MD, MSDirector of the Center for Health Policy Research, The Dartmouth Institute for Health Policy and Clinical Practice
A REPORT OF THE DARTMOUTH ATLAS PROJECT 3
Executive SummaryIn the spring, members of the class of 2012 will open a letter that tells us where we will spend the next stage of our training as physicians. Reputation, geographical preferences, and desired lifestyles will likely influence the way we rank our favorite programs. Most of us, however, will not rank hospitals based on how much they spend or how intensely they treat chronic illness. But maybe we should…
Over the last 20 years, the Dartmouth Atlas of Health Care has used Medicare data to analyze differences in medical care across the nation. This project has uncovered dramatic variations in resource utilization and health care spending. It has also suggested that increased utilization and spending do not improve quality or outcomes. One of the biggest drivers of spending differences is the variation in care provided to patients with chronic illness. As most of us will treat patients with chronic disease, it is worth understanding the variation in the intensity of care pro-vided to this population.
This report utilizes Dartmouth Atlas data to show differences in resource utilization among the 22 academic medical centers most commonly matched into by Dart-mouth medical students pursuing a residency in internal medicine. The variables selected specifically measure resources used in the last six months of life, reflect-ing the way that physicians at different institutions approach end-of-life care. The findings explained in this report are especially relevant to internal medicine resi-dents; however, they may also be applicable to other specialties, as many types of residents contribute to the care of terminally ill patients.
Through this report, we aim to share what we have learned about end-of-life care at different hospitals and demonstrate that this variation in care may affect resi-dency training and eventual behavior as practicing physicians. The way that the physicians at training hospitals deliver care will guide residents’ habits; therefore, we argue that training at hospitals with lower utilization of health care will better prepare residents to coordinate care, be judicious in consults, and listen to patient preferences. We also hope that by seeing how the Dartmouth Atlas can be used to understand practice patterns, medical students and residents may be more likely to draw directly on this resource in the future.
A Report of the Dartmouth Atlas Project
4 WHAT KIND OF PHYSICIAN WILL YOU BE? END-OF-LIFE CARE AND ITS EFFECT ON RESIDENCY TRAINING
About the Dartmouth Atlas dataThe Dartmouth Atlas measures care provided at both the regional and hospital level. This analysis deals with the treatment of patients at individual hospitals. The study population includes Medicare beneficiaries who died between 2003 and 2007 and who were hospitalized for a chronic illness at least once during their last two years of life. This cohort was restricted to those patients with at least one of nine chronic illnesses associated with high mortality rates: malignant cancer/leukemia, chronic pulmonary disease, coronary artery disease, congestive heart failure, peripheral vascular disease, severe chronic liver disease, diabetes with end organ damage, chronic renal failure, or dementia. Patients were assigned to the hospital they used most frequently during their last two years of life. If there was a tie between hospitals, the patient was assigned to the hospital associated with his or her last inpatient admission prior to death.
A REPORT OF THE DARTMOUTH ATLAS PROJECT 5
MethodsWe used the match lists from 1987 to 2011 to generate a list of the 22 internal medicine programs most often joined by Dartmouth medical students. For each program, we used data for the hospital that carries the same name as the residen-cy program. However, it is important to note that residents in many programs rotate at more than one hospital. For example, at NYU Medical Center, residents spend the majority of their time at Bellevue, a public hospital that has lower utilization and spending patterns compared to the private hospital associated with the program. However, in this paper, we only discuss care delivered at the private hospital, NYU Medical Center.i
Among the variables for which the Dartmouth Atlas provides hospital-specific data, we chose those that would have the most relevant implications for a resident’s training. These include:
Hospital days per patient, last six months of life: All days that a patient spent in acute care general hospitals during his last six months of life.
Physician visits per patient, last six months of life: All physician vis-its during the patient’s last six months of life (no matter where the visits occurred, in or out of hospital).
Percent of deaths occurring in hospital: The percent of patients assigned to the hospital that died in a hospital (the denominator is all deaths, no mat-ter where they occurred).
Percent of deaths that included an ICU admission: The percent of patients assigned to the hospital whose deaths included at least one stay in an intermediate- or high-intensity ICU. This variable is one indicator of how aggressively terminal patients were treated (the denominator is all deaths, no matter where they occurred).
Percent enrolled in hospice during the last six months of life: The percent of patients admitted into hospice during the last six months of life. Hospice is end-of-life care provided to patients who are expected to live six months or less. Pain and other symptoms of the patient’s illness are treated to provide increased quality of life. Hospice care can occur at home, at an outpatient hospice center, in a hospital, or at a skilled nursing facility.ii These data include hospice care occurring in any of these settings.
Percent seeing ten or more physicians during the last six months of life: The percent of patients who saw ten or more physicians in their last six months of life. This variable reflects a willingness to refer patients to other physicians and may suggest fragmented care.
All of these variables were adjusted for age, sex, race, and primary chronic diagnosis.
iData for the other hospitals associated with a training program are available on the Dartmouth Atlas web site: http://www.dartmouthatlas.org/data/hospital/iiSee “Hospice Care.” MedlinePlus. http://www.nlm.nih.gov/medlineplus/hospicecare.html
A Report of the Dartmouth Atlas Project
6 WHAT KIND OF PHYSICIAN WILL YOU BE? END-OF-LIFE CARE AND ITS EFFECT ON RESIDENCY TRAINING
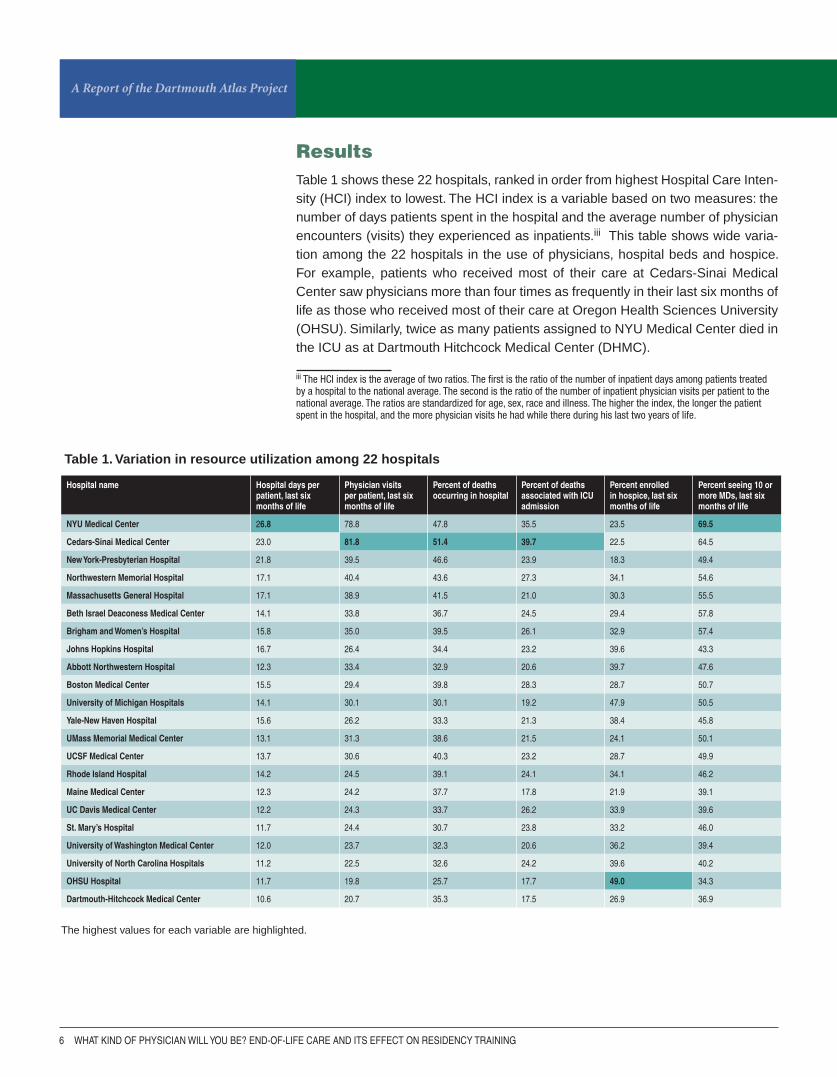
ResultsTable 1 shows these 22 hospitals, ranked in order from highest Hospital Care Inten-sity (HCI) index to lowest. The HCI index is a variable based on two measures: the number of days patients spent in the hospital and the average number of physician encounters (visits) they experienced as inpatients.iii This table shows wide varia-tion among the 22 hospitals in the use of physicians, hospital beds and hospice. For example, patients who received most of their care at Cedars-Sinai Medical Center saw physicians more than four times as frequently in their last six months of life as those who received most of their care at Oregon Health Sciences University (OHSU). Similarly, twice as many patients assigned to NYU Medical Center died in the ICU as at Dartmouth Hitchcock Medical Center (DHMC).
iii The HCI index is the average of two ratios. The first is the ratio of the number of inpatient days among patients treated by a hospital to the national average. The second is the ratio of the number of inpatient physician visits per patient to the national average. The ratios are standardized for age, sex, race and illness. The higher the index, the longer the patient spent in the hospital, and the more physician visits he had while there during his last two years of life.
Hospital name Hospital days per patient, last six months of life
Physician visits per patient, last six months of life
Percent of deaths occurring in hospital
Percent of deaths associated with ICU admission
Percent enrolled in hospice, last six months of life
Percent seeing 10 or more MDs, last six months of life
NYU Medical Center 26.8 78.8 47.8 35.5 23.5 69.5
Cedars-Sinai Medical Center 23.0 81.8 51.4 39.7 22.5 64.5
New York-Presbyterian Hospital 21.8 39.5 46.6 23.9 18.3 49.4
Northwestern Memorial Hospital 17.1 40.4 43.6 27.3 34.1 54.6
Massachusetts General Hospital 17.1 38.9 41.5 21.0 30.3 55.5
Beth Israel Deaconess Medical Center 14.1 33.8 36.7 24.5 29.4 57.8
Brigham and Women’s Hospital 15.8 35.0 39.5 26.1 32.9 57.4
UMass Memorial Medical Center 13.1 31.3 38.6 21.5 24.1 50.1
UCSF Medical Center 13.7 30.6 40.3 23.2 28.7 49.9
Rhode Island Hospital 14.2 24.5 39.1 24.1 34.1 46.2
Maine Medical Center 12.3 24.2 37.7 17.8 21.9 39.1
UC Davis Medical Center 12.2 24.3 33.7 26.2 33.9 39.6
St. Mary’s Hospital 11.7 24.4 30.7 23.8 33.2 46.0
University of Washington Medical Center 12.0 23.7 32.3 20.6 36.2 39.4
University of North Carolina Hospitals 11.2 22.5 32.6 24.2 39.6 40.2
OHSU Hospital 11.7 19.8 25.7 17.7 49.0 34.3
Dartmouth-Hitchcock Medical Center 10.6 20.7 35.3 17.5 26.9 36.9
The highest values for each variable are highlighted.
Table 1. Variation in resource utilization among 22 hospitals
A REPORT OF THE DARTMOUTH ATLAS PROJECT 7
15
25
35
45
55
65
75
85
8
12
16
20
24
28
Figure 1. Average number of physi-cian visits per chronically ill Medicare patient during the last six months of life among patients receiving most of their care at academic medical centers (deaths occurring 2003-07)
Figure 2. Average number of hospital days per chronically ill Medicare patient during the last six months of life among patients receiving most of their care at academic medical centers (deaths occurring 2003-07)
Ho
spit
al d
ays
per
ch
ron
ical
ly il
l pat
ien
t d
uri
ng
th
e la
st s
ix m
on
ths
of
life
Phy
sici
an v
isit
s p
er c
hro
nic
ally
ill p
atie
nt
du
rin
g t
he
last
six
mo
nth
s o
f lif
e
The variations in hospital days and physician visits are shown in Figures 1 and 2. In these charts, the 22 hospitals are displayed as red dots on a background of 94 academic medical centers associated with medical schools throughout the nation. These charts demonstrate that the 22 medical centers reflect the variation in care present nationwide.
A Report of the Dartmouth Atlas Project
8 WHAT KIND OF PHYSICIAN WILL YOU BE? END-OF-LIFE CARE AND ITS EFFECT ON RESIDENCY TRAINING
Hip fractureR2 = 0.06
All medicalconditionsR2 = 0.54
0
50
100
150
200
250
300
350
400
0 1 2 3 4 5 6
Discussion
Why is there variation?
Almost all of these hospitals are academic medical centers affiliated with medical schools, expected to be the source of medical evidence. Therefore, we would expect best practices to dictate when patients should be admitted to the hospital, how long patients should stay there, and how often they should see their physicians. The degree of variation suggests something else: that physicians are trained to treat patients differently at these various institutions. This variation can be explained in part by the concept of “supply-sensitive care.”
Dartmouth Atlas researchers have defined three categories of care: effective care, preference-sensitive care, and supply-sensitive care. Effective care refers to ser-vices that are of proven value and have no significant tradeoffs; that is, the benefits of the services so far outweigh the risks that all patients with specific medical condi-tions should receive them. Preference-sensitive care is elective care for conditions for which there is more than one treatment option, and patients’ preferences should guide decision-making. Examples include elective surgery and cancer screening tests like mammography and prostate-specific antigen (PSA) testing. The final cat-egory is supply-sensitive care, services for which the supply of physicians and resources strongly influences the amount of care delivered. As Figures 3 and 4 show, in areas with more doctors and more hospital beds, patients receive more intense care.
Figure 3 shows the relationship between hospital beds and admissions for the 306 Dartmouth Atlas hospital referral regions (HRRs), with each blue dot representing a different HRR (please refer to Appen-dix A for details on how the regions were created). For medical conditions, as the number of hospital beds increases, the admission rate (represented here as the discharge rate) increases. This graph shows that the available supply of hospital beds influences a physicians’ decision to admit a patient.
The red dots at the bottom of the graph show that the rate of hospitalization for hip fracture is not corre-lated with the supply of hospital beds. This is because admission for hip fracture is effective care; medical evidence shows that it is essential. Therefore, regard-less of the availability of beds, patients with hip fractures are hospitalized.
Figure 3. The relationship between the supply of hospital beds (1996) and hospital discharges per 1,000 Medicare enrollees among hospital referral regions (1995-96)
Dis
char
ges
per
1,0
00 M
edic
are
enro
llees
Acute care beds per 1,000 residents
A REPORT OF THE DARTMOUTH ATLAS PROJECT 9
0.0
0.5
1.0
1.5
2.0
2.5
0 2 4 6 8 10 12 14
R2 = 0.49
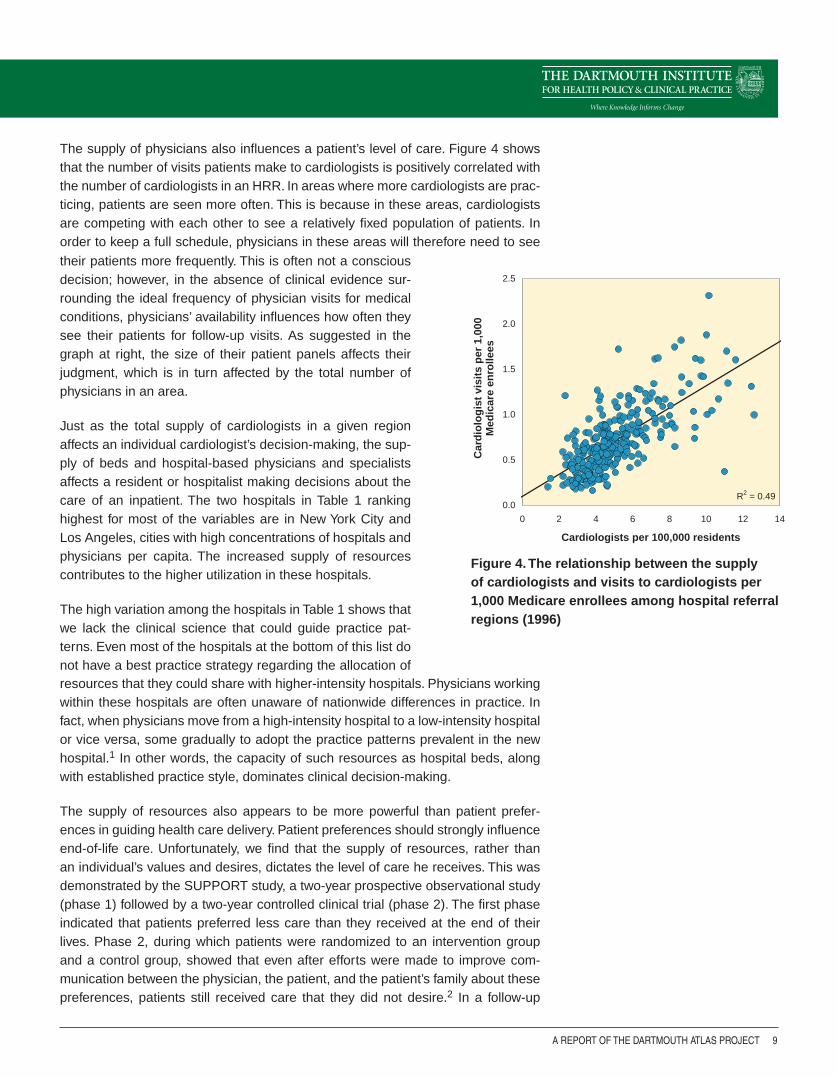
Figure 4. The relationship between the supply of cardiologists and visits to cardiologists per 1,000 Medicare enrollees among hospital referral regions (1996)
Cardiologists per 100,000 residents
Car
dio
log
ist
visi
ts p
er 1
,000
M
edic
are
enro
llees
The supply of physicians also influences a patient’s level of care. Figure 4 shows that the number of visits patients make to cardiologists is positively correlated with the number of cardiologists in an HRR. In areas where more cardiologists are prac-ticing, patients are seen more often. This is because in these areas, cardiologists are competing with each other to see a relatively fixed population of patients. In order to keep a full schedule, physicians in these areas will therefore need to see their patients more frequently. This is often not a conscious decision; however, in the absence of clinical evidence sur-rounding the ideal frequency of physician visits for medical conditions, physicians’ availability influences how often they see their patients for follow-up visits. As suggested in the graph at right, the size of their patient panels affects their judgment, which is in turn affected by the total number of physicians in an area.
Just as the total supply of cardiologists in a given region affects an individual cardiologist’s decision-making, the sup-ply of beds and hospital-based physicians and specialists affects a resident or hospitalist making decisions about the care of an inpatient. The two hospitals in Table 1 ranking highest for most of the variables are in New York City and Los Angeles, cities with high concentrations of hospitals and physicians per capita. The increased supply of resources contributes to the higher utilization in these hospitals.
The high variation among the hospitals in Table 1 shows that we lack the clinical science that could guide practice pat-terns. Even most of the hospitals at the bottom of this list do not have a best practice strategy regarding the allocation of resources that they could share with higher-intensity hospitals. Physicians working within these hospitals are often unaware of nationwide differences in practice. In fact, when physicians move from a high-intensity hospital to a low-intensity hospital or vice versa, some gradually to adopt the practice patterns prevalent in the new hospital.1 In other words, the capacity of such resources as hospital beds, along with established practice style, dominates clinical decision-making.
The supply of resources also appears to be more powerful than patient prefer-ences in guiding health care delivery. Patient preferences should strongly influence end-of-life care. Unfortunately, we find that the supply of resources, rather than an individual’s values and desires, dictates the level of care he receives. This was demonstrated by the SUPPORT study, a two-year prospective observational study (phase 1) followed by a two-year controlled clinical trial (phase 2). The first phase indicated that patients preferred less care than they received at the end of their lives. Phase 2, during which patients were randomized to an intervention group and a control group, showed that even after efforts were made to improve com-munication between the physician, the patient, and the patient’s family about these preferences, patients still received care that they did not desire.2 In a follow-up
A Report of the Dartmouth Atlas Project
10 WHAT KIND OF PHYSICIAN WILL YOU BE? END-OF-LIFE CARE AND ITS EFFECT ON RESIDENCY TRAINING
study, Pritchard et al demonstrated that the supply of beds and resources was more powerful in influencing clinical decision-making than patient preferences.3
Unfortunately, more care does not appear to be better, as outcomes remain unchanged, costs increase, and patients report worse experience. Later in the dis-cussion, we explain the research conducted through the Dartmouth Atlas, which indicates that more care may not be better.
Why is this variation relevant to a medical student or resident?
A resident’s training will certainly be affected by the intensity of care provided by the hospital in which he or she trains. The variables discussed in this report capture the ways that physicians in different institutions approach end-of-life care. The variables highlight differences among institutions in the following ways:
Organization of care and reliance on specialists: Complex patients are often cared for by multiple physicians, each having a specific set of recommendations for one aspect of the patient’s medical care. The question is often raised: who is really in charge of this patient’s overall care? The primary team, a primary care physician in the outpatient setting, or a team of residents in the inpatient setting is most frequently charged with the task of consolidating these recommendations and organizing the patient’s care. However, this can be a challenging responsibility. At NYU Medical Center, almost 70% of patients saw ten or more different physi-cians during their last six months of life. It is probably difficult for both a patient and the primary provider to keep up with the opinions and advice from these ten dif-ferent physicians. Having so many physicians involved can lead to fragmented or disorganized care. A resident at a hospital where patients have multiple physicians will need to make a concerted effort to keep track of the patient’s care so that the patient does not suffer the adverse consequences of multiple competing, and pos-sibly conflicting, recommendations and treatments.
A high percentage of patients seeing ten or more physicians during the last six months of life also creates a greater reliance on specialists. The benefit of increased specialty care is that a resident at NYU Medical Center will likely inter-act more frequently with specialists, and she may have the opportunity to witness more procedures than a resident at OHSU, where only 34% of patients saw ten or more physicians in the last six months of life. However, the disadvantage is that her patient’s care will be heavily dictated by specialist opinions. In contrast, a resident at OHSU may be more likely to develop experience managing complex chronic ill-nesses, as she will be less likely to seek assistance from a specialist.
Utilization of resources at end of life: If asked how they would like to spend their last six months of life, patients are likely to give a wide range of answers. How-ever, the Dartmouth Atlas shows that in many cases, the hospital where a patient receives most of his care determines how he spends these last few months of life.
A REPORT OF THE DARTMOUTH ATLAS PROJECT 11
For example, patients at Cedars-Sinai Medical Center saw physicians 82 times in their last six months of life, compared to patients at OHSU, who saw physicians 20 times during that same time period. Similarly, patients at New York-Presbyterian Hospital spent, on average, 21.8 days in the hospital during their last six months of life, compared to 10.6 days at DHMC. These data suggest that the environments at Cedars-Sinai and New York-Presbyterian are more aggressive, leading to more inpatient and outpatient care. More time in the hospital and more physician visits provide more information, allowing a resident to be more certain about a diagnosis and treatment plan or regarding the stability of a patient prior to discharge. Howev-er, we know that elderly patients admitted to the hospital are at risk for nosocomial infections and other hazards of hospitalization. In addition, the number of hospital days is highly correlated with inpatient spending. Longer and more frequent hos-pital stays can lead to worsening illness and increased financial burden for society and for patients who must pay co-insurance and deductibles. In addition, more frequent physician visits can lead to uncoordinated care.
Use of ICUs and reliance on hospice: Many of us were drawn to medicine because we wanted the chance to “save lives,” to engage in heroic measures to cure a disease or stop the bleed, so that a patient can go back to living a great life. Many of these heroic measures happen in an ICU setting, where massive efforts are made to resuscitate patients and keep them alive. There are times, however, when these measures are more harmful than they are heroic—and they may be unwanted by the patient.
The percent of deaths associated with an ICU admission at NYU Medical Cen-ter was almost twice what it was at Dartmouth during the period from 2003 to 2007. Days spent in an ICU are very expensive and resource-intensive. Patients are examined and tested multiple times a day, and families often have to drive long distances to see the patient, who may or may not be able to communicate with them. For these reasons, it is an unpleasant experience for the patient and his fam-ily. With all patients, but with elderly patients especially, we should ask ourselves if the possible benefits of an ICU stay outweigh these disadvantages. We should be prepared to consider and discuss whether a patient would be better managed at home, perhaps in hospice. In hospitals where there is a high percentage of death in the hospital and in the ICU, there seems to be less of an emphasis on hospice care. Forty-nine percent of patients treated at OHSU were enrolled in hospice in their last six months of life, compared to only 22.5% of patients treated at Cedars-Sinai. A Cedars-Sinai resident may therefore develop a higher threshold for referral of a patient to hospice. He may decide to explore more aggressive treatment approach-es before discussing this “comfort care” option with the patient. An OHSU resident may be better trained in having discussions with the patient about his or her prefer-ences for end-of-life care.
The variables in this report show that residents at high-spending hospitals are trained to provide more care to their patients. If increased care leads to better out-comes and happier patients, it might be worth utilizing these resources. However, this is not the case.
A Report of the Dartmouth Atlas Project
12 WHAT KIND OF PHYSICIAN WILL YOU BE? END-OF-LIFE CARE AND ITS EFFECT ON RESIDENCY TRAINING
Is more care better?
Studies done through the Dartmouth Atlas have shown that increased care improves neither survival nor quality of care. In a cohort study, Dr. Elliott Fisher and his colleagues studied whether patients with similar baseline health status experi-enced better quality, access, outcomes, and satisfaction in areas of high versus low end-of-life spending. The patient population studied consisted of patients hospital-ized between 1993 and 1995 for hip fracture, colorectal cancer or acute myocardial infarction (AMI), along with a sample of the general population from the Medicare Current Beneficiary Survey. The researchers found that patients in higher-spending regions were provided more care in the form of physician visits, hospital days, spe-cialist consultations, and procedures. However, the quality of care, measured by aspirin use for an AMI or rate of influenza immunization, was the same or worse in higher-spending regions compared to lower-spending regions. Similarly, outcomes, measured by the five-year mortality rate, were slightly worse in higher-spending regions in both the colorectal cancer and AMI cohorts. Access and satisfaction with care were found to be the same between high and low-spending regions.iv, 4,5 In addition, Medicare spending has been shown to be inversely related to access to specialist care and to patient satisfaction, measured with a global rating of care.6,7 Finally, quality and satisfaction are positively correlated, meaning that, in those hospitals with low quality measures, patient ratings are also low.8
Why do these measures of outcomes, quality, access, and satisfaction worsen as spending and care intensity increase? A plausible hypothesis is that, as spending increases because of higher utilization of resources and the involvement of multiple physicians, care becomes more disorganized. A patient may receive more services than he needs and be exposed to more medical errors, simply because he is get-ting more care. In addition, without effective coordination of his care, a patient’s preferences may not be heard.
iv One limitation of this study is that it was observational, not randomized; therefore, the small increase in mortality in high-spending regions may have been caused by an unmeasured variable. However, subsequent studies done by the Dart-mouth Atlas have shown similar results, demonstrating that hospitals that spend more on patients in their last two years of life have worse quality scores among patients being treated for pneumonia or an AMI.
A REPORT OF THE DARTMOUTH ATLAS PROJECT 13
ConclusionsMany factors influence the decision of where to complete residency. The Dart-mouth Atlas can help guide this decision, as it provides valuable information about how hospitals manage chronic illnesses and provide end-of-life care, both of which are critical aspects of residency training. In addition, the findings of the Dartmouth Atlas have been used to influence health care reform as the nation struggles to contain increasing health care costs while improving access and quality of care. With increasing pressure to decrease costs, those hospitals that spend more will likely face challenges as they work to limit health care utilization. If we are at institu-tions that are fighting to lower spending, we may be able to play a role in identifying best practices for low-cost, high-quality care. On the other hand, if we are at low-spending hospitals, we will be trained to treat patients the way that all future physicians will need to be trained, by limiting spending while maintaining strong outcomes. As Dartmouth medical students, we have the benefits of education in shared decision-making, exposure to Dr. Ira Byock, an expert in end-of-life care, and training in the lowest-spending hospital among the 22 analyzed in this report. This knowledge, along with an understanding of the power of supply-sensitive care, might help us realize the importance of advocating for our patients’ preferences so that our patients, rather than the capacity of resources, influence their levels of care. The Dartmouth Atlas is a tool for us to use for quality improvement and cost reduction. By educating ourselves about how hospitals compare in spending and intensity of care, we will have the ability to identify areas for improvement.
A Report of the Dartmouth Atlas Project
14 WHAT KIND OF PHYSICIAN WILL YOU BE? END-OF-LIFE CARE AND ITS EFFECT ON RESIDENCY TRAINING
References1. Wennberg, John E. Tracking Medicine: A Researcher’s Quest to Understand Health Care. New York NY. Oxford University Press, 2010.
2. The SUPPORT Principal Investigators. A controlled trial to improve care for seriously ill hospitalized patients. The Study to Understand Prognoses and Preferences for Outcomes and Risks of Treatments (SUPPORT). Journal of the American Medical Association 1995;274:1591-98.
3. Pritchard RS, Fisher ES, Teno JM, Sharp SM, Reding DJ, Knaus WA, Wennberg JE, Lynn DJ, for the SUPPORT Investigators. Influence of patient preferences and local health system characteristics on place of death. Journal of the American Geriatric Society 1998;46:1242-50.
4. Fisher ES, Wennberg DE, Stukel TA, Gottlieb DJ, Lucas FL, Pinder E. The implications of regional variations in Medicare spending: Part 1. Utilization of services and the quality of care. Annals of Internal Medicine 2003;138:273-87.
5. Fisher ES, Wennberg DE, Stukel TA, Gottlieb DJ, Lucas FL, Pinder E. The implications of regional variations in Medicare spending: Part 2. Health outcomes and satisfaction with care. Annals of Internal Medicine 2003;138:288-98.
6. Yasaitis L, Fisher ES, Skinner JS, Chandra A. Hospital quality and intensity of spending: Is there an association? Health Affairs 2009;28(4):w566-72.
7. Fowler FJ Jr., Gallagher PM, Anthony DL, Larsen K, Skinner JS. Relationship between regional per capita medical expen-ditures and patient perceptions of quality of care. Journal of the American Medical Association 2008;299(20):2406-12.
8. Wennberg JE, Bronner KK, Skinner JS, Fisher ES, Goodman DC. Inpatient care intensity and patients’ ratings of their hospital experiences. Health Affairs 2009;28(1):103-12.
9. Gawande, Atul. “The Cost Conundrum.” The New Yorker. June 1, 2009.
10. Gawande, Atul. “The Cost Conundrum (*)” The New Yorker. December 6, 2010.
11. Marder WD, Carls GS, Ehrlich E, Fabius R. “Geographic Variation in Spending and Utilization Among the Commercially Insured.” White Paper. Thomson Reuters, July 27, 2011.
12. Ong MK, Mangione CM, Romano PS, Zhou Q, Auerbach AD, Chun A, Davidson B, Ganiats TG, Greenfield S, Gropper MA, Malik S, Rosenthal JT, Escarce JJ. Looking forward, looking back: Assessing variations in hospital resource use and out-comes for elderly patients with heart failure. Circulation Cardiovascular Quality and Outcomes 2009;2(6):548-57.
13. Wennberg JE, Fisher ES, Goodman DC, Skinner JS. Tracking the Care of Patients with Severe Chronic Illness: The Dart-mouth Atlas of Health Care 2008. Lebanon NH. The Dartmouth Institute for Health Policy and Clinical Practice.
14. Wennberg JE. “Can the Tuck Student-Consultant Help Reduce Unwarranted Variation?” Presentation to Tuck Business School students, October 12, 2011.
15. Wennberg JE. “The Mysteries of Supply-Sensitive Care.” Presentation to TDI students, October 20, 2011.
A REPORT OF THE DARTMOUTH ATLAS PROJECT 15
Appendix A: Dartmouth Atlas regions
The Dartmouth Atlas project has divided the United States into 3,436 geographi-cally distinct hospital service areas (HSAs). Medicare patients living in an HSA get the majority of their health care from hospitals within the area. These areas were defined in three steps. First, all acute care hospitals that provided care to Medicare patients in 1992 and 1993 were assigned to the town or city in which they were located, defining the initial list of HSAs. Second, the ZIP codes of patients hospital-ized in 1992 and 1993 were recorded to determine the proportion of patients in that ZIP code that used each hospital. Then, each ZIP code was assigned to the hospital where the greatest proportion of residents received care. Finally, a map of the ZIP code boundaries allowed for the areas to be geographically defined.
Using the HSAs, hospital referral regions (HRRs), were then defined by determining where patients in each HSA received major cardiovascular surgery and neurosurgery. First, all of the hospitals performing at least ten major cardiovascular procedures in 1992 and 1993 were identified and located within pre-defined HSAs, which became the candidate HRRs. Then, each of the 3,436 HSAs was assigned to the candidate HRRs where the greatest proportion of their patients went for these surgical services. The HSAs using hospitals in the same candidate HRR were grouped to form 306 HRRs. These are shown below in the map of the United States.
Map A. The Dartmouth Atlas hospital referral regions
The Dartmouth Atlas Project is funded by a broad coalition of funders, led by the Robert Wood Johnson Foundation. Other major sources of funding include the National Institute of Aging, California Healthcare Foundation, United Healthcare Foundation, and the WellPoint Foundation.
The Dartmouth AtlasThe Dartmouth Institute for Health Policy and Clinical Practice
Center for Health Policy Research
Contact: Eva Fowler 202-261-2868 voice 202-331-7207 fax
www.dartmouthatlas.org
02062012.dap2.0 Copyright 2012 by the Trustees of Dartmouth College
Cover photograph by a.drian, licensed under Creative Commons
The Dartmouth Atlas Project works to accurately describe how medical resources are distributed and used in the United States. The project offers comprehensive information and analysis about national, regional, and local markets, as well as individual hospitals and their affiliated physicians, in order to provide a basis for improving health and health systems. Through this analysis, the project has demonstrated glaring variations in how health care is delivered across the United States.
A Report of the Dartmouth Atlas Project
The Dartmouth Atlas Working Group
Leadership
Elliott S. Fisher, MD, MPH, Dartmouth Atlas Co-Principal InvestigatorDavid C. Goodman, MD, MS, Dartmouth Atlas Co-Principal InvestigatorJonathan S. Skinner, PhD, Senior ScholarJohn E. Wennberg, MD, MPH, Founder of the Dartmouth AtlasKristen K. Bronner, MA, Managing Editor
Senior Authors and Faculty
John Erik-Bell, MDShannon Brownlee, MSJulie P.W. Bynum, MD, MPHChiang-Hua Chang, PhDAmos R. Esty, MAPhilip P. Goodney, MD, MSNancy E. Morden, MD, MPHThérèse A. Stukel, PhDJames N. Weinstein, DO, MS
Analytic and Administrative Staff
Elisabeth L. Bryan, BSThomas A. Bubolz, PhDDonald Carmichael, MDivScott Chasan-Taber, PhDCaitlin J. Clapp, BAJennifer Dong, MSDaniel J. Gottlieb, MSJia Lan, MSMartha K. Lane, MAStephanie R. Raymond, BASandra M. Sharp, SMJeremy Smith, MPHYunjie Song, PhDDean T. Stanley, RHCEAndrew W.J. Toler, MSStephanie Tomlin, MPAPeter J. Westphaelen, BARebecca Zaha, MPHWeiping Zhou, MS