80
WHAT PEOPLE NEED IN SINGAPORE: A HOUSEHOLD BUDGETS STUDY 1 What people need in Singapore: A household budgets study Ng Kok Hoe Teo You Yenn Neo Yu Wei Ad Maulod Stephanie Chok Wong Yee Lok

what people need in singapore: a household budgets study
1
What people need in Singapore: A household budgets study
Ng Kok HoeTeo You YennNeo Yu WeiAd MaulodStephanie ChokWong Yee Lok

AcknowledgementsWe thank the Association of Women for Action and Research (AWARE), the Community Foundation of Singapore (CFS) and all funders for making this project possible; Abigail Davis and Matt Padley at the Centre for Research in Social Policy (CRSP) at Loughborough University for their advice and encouragement; as well as focus group participants for their generous contributions during the discussions. We are also grateful to Professors Donald Hirsch and Linda Lim for reviewing the report; Janel Lau, Tay Mei Ling, Sasha Syahirah Rouse, Agatha Teng and Alison Kuah for research assistance; Vikki Khung for report design; Jolene Tan for her many contributions to the project; Dr Lee Khai Pin for his expert advice on healthcare; and NutriWerkz Pte Ltd for supporting the develop-ment of the food budgets.
To cite this report: Ng, K. H., Teo, Y. Y., Neo, Y. W., Maulod, A., Chok, S., & Wong, Y. L. (2021). What people need in Singapore: A household budgets study. https://whatsenough.sg/key-findings-mis2021/
Note: All monetary figures in this report are in Singapore dollars.

what people need in singapore: a household budgets study
3
ContentsExecutive summary
Introduction
Methodology
Findings
Household budgetsHow goods and services meet basic needs How the budgets compare to expenditure data How the budgets compare to work incomes How the budgets compare to public schemes How households fare compared to MIS budgetsA living wage that households need
Conclusion and policy implications
References
About the authors
6
12
17
30
30365152596567
71
76
80
what people need in singapore: a household budgets study
4
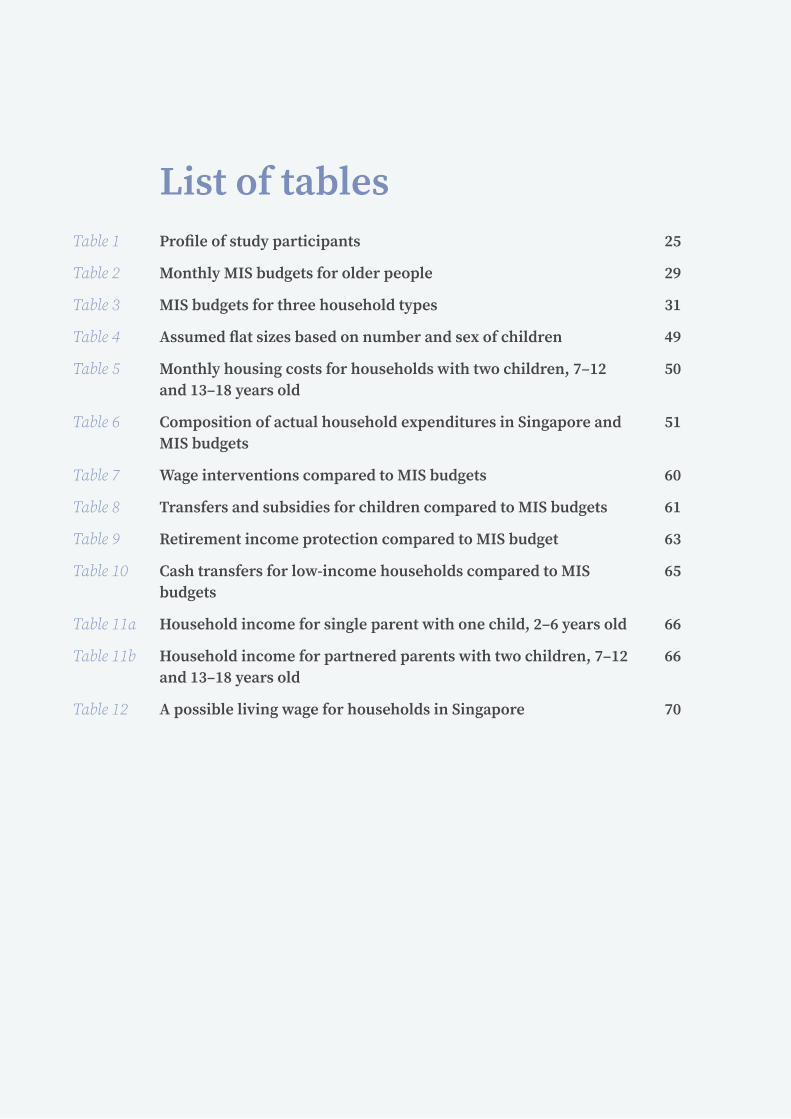
List of tablesProfile of study participants
Monthly MIS budgets for older people
MIS budgets for three household types
Assumed flat sizes based on number and sex of children
Monthly housing costs for households with two children, 7–12 and 13–18 years old
Composition of actual household expenditures in Singapore and MIS budgets
Wage interventions compared to MIS budgets
Transfers and subsidies for children compared to MIS budgets
Retirement income protection compared to MIS budget
Cash transfers for low-income households compared to MIS budgets
Household income for single parent with one child, 2–6 years old
Household income for partnered parents with two children, 7–12 and 13–18 years old
A possible living wage for households in Singapore
25
29
31
49
50
51
60
61
63
65
66
66
70
Table 1
Table 2
Table 3
Table 4
Table 5
Table 6
Table 7
Table 8
Table 9
Table 10
Table 11a
Table 11b
Table 12

what people need in singapore: a household budgets study
5
List of figuresPrices of selected grocery and household items from April to December 2020
Average wait times for delivery by Giant and Sheng Siong from April to December 2020
Budget components for children of different ages
MIS budgets for single and partnered parents with one child at different ages
National average monthly work income per household member by decile groups compared to MIS budgets for single and partnered parents
National median monthly work income of full-time workers by age groups compared to MIS budgets for single and partnered parents
National median monthly work income of full-time workers by educational level, occupation and type of work compared to MIS budgets for single and partnered parents
National average monthly work income per household member by housing type compared to MIS budgets for single and partnered parents
National median monthly work income of full-time workers aged 60 years and above by occupation and educational level compared to MIS budget for a single elderly person
National median monthly work income of full-time workers by gender compared to MIS budgets for single and partnered parents
27
28
34
35
53
54
55
56
57
58
Figure 1
Figure 2
Figure 3
Figure 4
Figure 5
Figure 6
Figure 7
Figure 8
Figure 9
Figure 10

what people need in singapore: a household budgets study
6
Executive summaryThe study of household budgets is situated within an extensive field of research on human needs and social inclusion. Our study ascertains how ordinary Singaporeans think about what constitutes basic needs in Singapore today and determines the household budgets necessary to meet these needs.
Needs vary across the life course and are dependent on household configurations. Our study focuses on households of single and partnered parents and their children across various age groups—below 2 years old; 2–6; 7–12; 13–18; and 19–25. We also updated the budgets generated in an earlier wave of research for elderly persons aged 65 years and older, and single adults aged 55–64 years old.
This study adopted the Minimum Income Standards (MIS) approach to determine the household budgets required for a basic standard of living. The consensus-based focus group discussions in this approach produce results that reflect the lived realities and ordinary habits of people living in contemporary Singapore; capture the diverse and evolving needs for people at various stages of life and in varying household arrangements; embody the values and principles that ordinary Singaporeans identify with; as well as identify concrete items and precise budgets that map onto those values and principles.
6

what people need in singapore: a household budgets study
7
ExECUTiVE SUMMARY
Key findings1. We adopted the same definition of a basic standard of living from the
previous study on elderly household budgets:
A basic standard of living in Singapore is about, but more than just, housing, food, and clothing. it is about having opportunities to education, employment, and work-life balance, as well as access to healthcare. it enables a sense of belonging, respect, security, and independence. it also includes choices to participate in social activities, and the freedom to engage in one’s cultural and religious practices.
2. Starting from the definition, participants discussed and generated lists of items and services related to:
• Housing and utilities; • Things needed for each area in a HDB flat1 (living room, kitchen, etc.); • Personal care items and clothing; • Food; • Transport; • Social participation;• Education and childcare needs; and• Healthcare.
These detailed lists of items and services specify what each item is (e.g. mosquito repellant), how much it costs (e.g. $8.20), where it can be purchased (e.g. Watsons), and how long the item should last (e.g. three months).
3. Participants explained their reasons for including items as basic needs. Their discussions shed light on how things such as birthday presents, enrichment classes and special-occasion clothing matter in meeting needs for social belonging.
4. The total weekly household budgets required to meet a basic standard of living are:
• $741 per week for a single parent with one child 2–6 years old ($3,218 per month);
A basic standard of living in Singapore is about, but more than just, housing, food, and clothing. It is about having opportunities to education, employment, and work-life balance, as well as access to healthcare. It enables a sense of belonging, respect, security, and independence. It also includes choices to participate in social activities, and the freedom to engage in one’s cultural and religious practices.
1 This refers to high-rise public housing built and sold by the Housing and Development Board (HDB).

what people need in singapore: a household budgets study
8
• $1,479 per week for partnered parents with two children 7–12 and 13–18 years old ($6,426 per month); and
• $327 per week for a single elderly person ($1,421 per month).
5. The MIS budgets reflect household sizes and children’s ages. Larger households will see some savings from sharing common household items, but participants highlighted that some things cannot be shared. For example, every household member who is working or schooling needs their own laptop. in fact, this need became especially salient during the COViD-19 pandemic with school closures and more people working from home. Generally, budget components such as social participation, clothing and food cost more for older children as their needs increase with age, while services like healthcare and childcare are more expensive for younger children. As a whole, the budget components associated with children do not vary linearly with age.
6. Housing costs are a major component of the household budgets and are heavily determined by public housing policies. Currently, these policies discriminate between different types of households based on partnership history. Single parents who have never been married face a higher eligibility age for purchasing public housing and restrictions in the types of housing they are allowed to own. These regulations amount to a housing penalty that effectively doubles their housing costs compared to households led by partnered, widowed or divorced parents.
7. The single parent household’s budget is 0.7 times of the national median full-time work income of $4,534 in 2020. The partnered parent household’s budget is 1.4 times and the single elderly person’s budget is 0.3 times. in other words, the single parent household requires around 70% of a ‘middle earner’s’ income to sustain a basic standard of living, while the partnered parent household requires the incomes of just below one and a half middle earners.
8. Taking household size into account, the per person budget is around $1,600 for the single parent with one child aged 2–6, as well as the partnered parents with two children aged 7–12 and 13–18 years old (i.e. based on the total budgets of $3,218 for the single parent household and $6,426 for the partnered parent household). Among employed households in Singapore in 2020, the average work income per household member was $1,609 for the third decile group (i.e. 21st to 30th percentile). in other words, around 30% of all working households earn less than the amount required for these two types of households to meet their basic needs.
ExECUTiVE SUMMARY
The single parent household requires around 70% of a ‘middle earner’s’ income to sustain a basic standard of living, while the partnered parent household requires the incomes of just below one and a half middle earners.

what people need in singapore: a household budgets study
9
9. There are stark inequalities in the adequacy of work incomes across groups on the basis of age, education, occupation, type of work and type of housing. Compared to the budgets for the single and partnered parent households, the actual work incomes of many groups fall short: workers in the youngest (below 25 years old) and oldest (60 years old and above) age groups; workers with non-tertiary education; people doing casual work and low-wage jobs such as cleaning and sales; and households in 1- and 2-room flats.
10. A range of public schemes aim to address households’ income adequacy. Comparing these provisions to the household budgets for meeting basic needs reveals significant gaps:
• Wage interventions, including the Progressive Wage Model (PWM) and Workfare income Supplement (WiS), can help single elderly persons to meet their minimum income needs. However, they fall a long way short for working-age parents, resulting in incomes of just around half of the household budgets for a single parent with one child or partnered parents with two children.
• As children grow older, subsidies for childcare decrease in generosity and are subject to stricter income limits. For partnered parents with two children, infant care subsidies are worth 2–21% of their household budget, but student care subsidies are equivalent to just 1–5%.
• in terms of retirement income protection, the CPF Basic Retirement Sum generates an income which is around 56% of what a single elderly person needs. However, many retirees do not achieve this basic sum of savings. Other assistance programmes include ComCare Long-Term Assistance, which covers less than 1% of the elderly population, and Silver Support Scheme, which provides only 11–21% of the single elderly person’s budget.
• The inadequacy of cash transfers to support low-income households is particularly concerning. The current income limit to qualify for GST Voucher – Cash is equivalent to just 73% of the single and partnered parents’ budgets. Moreover, even for those who are eligible, the amount given is negligible—it provides below 1% of the working-age households’ budgets and less than 2% of the single elderly person’s budget. ComCare Short-to-Medium-Term Assistance is similarly ungenerous. in 2020, the median amount of assistance per household was $500, amounting to 8–16% of the working-age households’ budgets.
ExECUTiVE SUMMARY
Compared to the budgets for the single and partnered parent households, the actual work incomes of many groups fall short: workers in the youngest (below 25 years old) and oldest (60 years old and above) age groups; workers with non-tertiary education; people doing casual work and low-wage jobs such as cleaning and sales; and households in 1- and 2-room flats.

what people need in singapore: a household budgets study
10
11. Taking the major taxes and benefits into account, a single parent with one child aged 2–6 years old will exceed their MiS budget if the parent is receiving the equivalent of the median wage in 2020. Partnered parents with two children aged 7–12 and 13–18 years old will likewise earn more than their MiS budget if both parents are receiving the median wage. But if the parents’ wages are at PWM levels, the single parent household will fall short of their MiS budget by as much as 15%, while the gap for the partnered parent household is as large as 38%, depending on the sector of work.
12. For households to reach the incomes they need for a basic standard of living through wage work, partnered parents with two children will need to earn
$2,906 per month. This figure provides a starting point and a reasonable target for considering a living wage for workers in Singapore. The median work income among all workers in 2020 exceeds this amount by 56%, but current PWM wages fall significantly below.
Policy implications 1. Benchmarks: MiS research asks participants to consider only what things
are needed for a basic standard of living, not the affordability of these things, because needs are different from means. But once household budgets are established, they provide a concrete benchmark and starting point for discussing how people may achieve these budgets.
2. Wages: There is significant wage inequality in Singapore. Adopting the household budgets as benchmarks helps to identify the groups who are at risk of not meeting their basic needs, such as the youngest and oldest workers; workers with less education; and people in low-wage occupations and casual work. in particular, households with children that depend on employment in low-wage sectors as their only source of income are likely to experience significant financial strain. There is also persistent gender inequality in pay which may affect the meeting of immediate needs—especially for single parent households headed by women—as well as
women’s retirement income security in the longer term. Existing wage interventions clearly do not go far enough to ensure adequate incomes across the workforce.
ExECUTiVE SUMMARY
For households to reach the incomes they need for a basic standard of living through wage work, partnered parents with two children will need to earn $2,906 per month. This figure provides a starting point and a reasonable target for considering a living wage for workers in Singapore.
Existing wage interventions clearly do not go far enough to ensure adequate incomes across the workforce.

what people need in singapore: a household budgets study
11
3. Housing: When it came to housing, although participants found consensus on space needs for different household configurations, they were concerned that some families may not be able to afford the type of housing they need. The discrimination in public housing policy against single, “never-married” parents increases the financial strain on households that already have lower earning capacities compared to dual-parent families. This raises serious questions about housing security and the fair distribution of public resources.
4. Education: Although education and care costs are generally lower as children grow up, other costs associated with children in the household budgets increase with age, such as food, clothing and social participation. At the same time, the current regime of support for children’s education and care costs resembles a wedge that tapers off sharply for older children. As a result, financial pressures may become heavier for parents as their children grow older. Parents and youths were both keenly aware of the many financial demands that households face and of people’s unequal capacities to meet these demands. They believed that for some households, there will be a gap between goals and realities.
5. Poverty: On the whole, there is as yet no dependable and adequate income protection system for the most economically insecure households in Singapore. For poorer households with children, public financial assistance presents challenges in terms of both accessibility and adequacy. The current design of financial assistance requires families to sacrifice some basic needs before they may be considered for aid, yet even where a family qualifies, the assistance provided does not enable them to reach a basic standard of
living. Older people who are in work will have just enough to meet basic needs, but those depending on CPF may find themselves short, while those needing public assistance will fall a long way below a basic standard of living.
For a society that values its people above all else, much more can be done to improve the balance between private and public provision, based on a realistic assessment of people’s means, and an accurate understanding of what households need to live with “belonging, respect, security and independence”.
ExECUTiVE SUMMARY
For a society that values its people above all else, much more can be done to improve the balance between private and public provision, based on a realistic assessment of people’s means, and an accurate understanding of what households need to live with “belonging, respect, security and independence”.
On the whole, there is as yet no dependable and adequate income protection system for the most economically insecure households in Singapore.

what people need in singapore: a household budgets study
12
IntroductionThis study addresses the question: How much money do people need to achieve a basic standard of living in Singapore today?
In 2019, we published a study focusing on the basic needs of elderly men and women aged 65 and above. We also studied the needs of slightly younger households of people 55 to 64 years old (Ng et al., 2019, 2020). The present report extends this work to the needs of younger persons. We study the needs of single and partnered parents, and children across these age groups: below 2; 2–6; 7–12; 13–18; and 19–25 years old.
With these two waves of research, we now have a comprehensive view of basic needs across the life course—including shifts in priorities and modes for meeting needs at different times in life.
12
what people need in singapore: a household budgets study
13
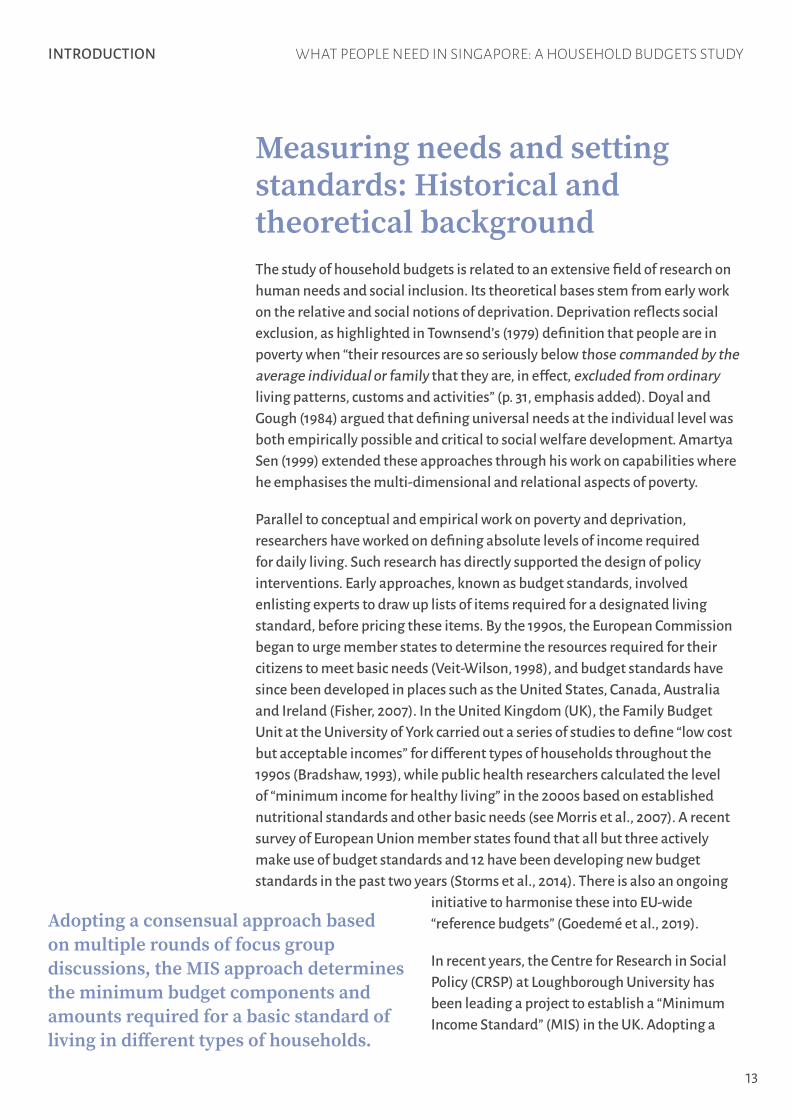
Measuring needs and setting standards: Historical and theoretical backgroundThe study of household budgets is related to an extensive field of research on human needs and social inclusion. its theoretical bases stem from early work on the relative and social notions of deprivation. Deprivation reflects social exclusion, as highlighted in Townsend’s (1979) definition that people are in poverty when “their resources are so seriously below those commanded by the average individual or family that they are, in effect, excluded from ordinary living patterns, customs and activities” (p. 31, emphasis added). Doyal and Gough (1984) argued that defining universal needs at the individual level was both empirically possible and critical to social welfare development. Amartya Sen (1999) extended these approaches through his work on capabilities where he emphasises the multi-dimensional and relational aspects of poverty.
Parallel to conceptual and empirical work on poverty and deprivation, researchers have worked on defining absolute levels of income required for daily living. Such research has directly supported the design of policy interventions. Early approaches, known as budget standards, involved enlisting experts to draw up lists of items required for a designated living standard, before pricing these items. By the 1990s, the European Commission began to urge member states to determine the resources required for their citizens to meet basic needs (Veit-Wilson, 1998), and budget standards have since been developed in places such as the United States, Canada, Australia and ireland (Fisher, 2007). in the United Kingdom (UK), the Family Budget Unit at the University of York carried out a series of studies to define “low cost but acceptable incomes” for different types of households throughout the 1990s (Bradshaw, 1993), while public health researchers calculated the level of “minimum income for healthy living” in the 2000s based on established nutritional standards and other basic needs (see Morris et al., 2007). A recent survey of European Union member states found that all but three actively make use of budget standards and 12 have been developing new budget standards in the past two years (Storms et al., 2014). There is also an ongoing
initiative to harmonise these into EU-wide “reference budgets” (Goedemé et al., 2019).
in recent years, the Centre for Research in Social Policy (CRSP) at Loughborough University has been leading a project to establish a “Minimum income Standard” (MiS) in the UK. Adopting a
iNTRODUCTiON
Adopting a consensual approach based on multiple rounds of focus group discussions, the MIS approach determines the minimum budget components and amounts required for a basic standard of living in different types of households.

what people need in singapore: a household budgets study
14
consensual approach based on multiple rounds of focus group discussions, the MiS approach determines the minimum budget components and amounts required for a basic standard of living in different types of households. They have continued to update these annually since 2008 to take account of price inflation and changes in society (Bradshaw et al., 2008; Davis et al., 2015; Davis et al., 2018, 2021). The MiS approach has also been extended to calculate the income needs of households with specific requirements related to disability, old age and living in remote rural locations (Hill et al., 2016; Hirsch, 2015; Smith et al., 2012). Similar projects using the MIS methodology have since taken off in France, the Republic of ireland, Mexico, Portugal, South Africa, Thailand and Japan (Davis et al., 2021). With our study, Singapore is also part of this network.
Measuring needs and setting standards: Methodological approachesExpert-directed budgetsThere are several approaches for understanding needs and estimating family budgets. The first is expert consultation, which involves subject specialists setting the minimum requirements for things such as nutrition, commuting costs, healthcare, and so on (Veit-Wilson, 1998). These requirements are then priced. in general, this approach stems from the belief that there exists an objective minimum cost of living for researchers to discover. This becomes especially problematic for social aspects of living that entail a strong element of choice, such as visiting friends and exchanging gifts.
Public surveysThe second is public surveys. These may seek attitudinal responses about income requirements or gather information about actual expenditures in society, with the drawback that actual spending may fall below basic needs among the lower income groups.
Participatory deliberation and consensus-building by members of societyThird, in consensual methods (Walker, 1987), including the MiS approach, focus groups are convened to deliberate the meaning of an adequate standard of living, draw up lists of items required to achieve this standard, and review the final list of costs. Whereas expert consultation privileges experts’ capacity to arrive at objective criteria and public surveys draw conclusions through
iNTRODUCTiON

what people need in singapore: a household budgets study
15
aggregation and averages, the consensual approach regards living standards as partially subjective and context-specific. It arrives at needs through discussion, negotiation and consensus-building. in doing so, it draws on ideas of participatory democracy and deliberative approaches in policymaking and research (Burchardt, 2014).
This study opts to follow the UK MiS methodology for several reasons. The approach has been tested in the UK and ireland repeatedly, and in several other countries around the world (Davis et al., 2014). The consistency in results over time and its usage in diverse cultural contexts attest to the robustness and versatility of the methodology (Hirsch, 2013; Hirsch et al., 2021).
The application of MiS methodology in multiple national contexts signals rich potential for this study to draw comparative lessons (see Hirsch et al., 2021). Given that Singapore shares with other wealthy countries similar challenges of inequality and demographic transitions, these comparisons are valuable for reflecting on possible social policy interventions.
The MiS’s consensual strategy recognises the relational and social characteristics of needs as well as the limitations of experts in deciphering people’s lived realities of social inclusion. Adequate budgets are therefore more appropriately derived from deep empirical analyses of people’s actual experiences and perceptions. in particular, the detailed and multiple rounds of discussion among focus group participants offer the possibility of constructing highly specific lists of goods and services. This level of detail and precision is rarely attainable by expert consultants.
iNTRODUCTiON
what people need in singapore: a household budgets study
16
in the Singapore context, a consensual approach contributes to increasing public interest and participation in policy processes that affect collective wellbeing. We witnessed public interest in this research when we released our first report in 2019: from more than 5,300 page views for the
study website within the first month, to multiple media requests and coverage in several languages, and encounters with ordinary people who were familiar with the figure of $1,379 from our research (the household budget we reported for elderly persons living alone), the report sparked conversations about basic needs and the costs of meeting them. in press reports, people commented that social participation was important, that “it doesn’t mean that once i reach 60 years old, i stay at home and eat porridge and face the four walls” (Lim, 2019). in a public poll, 51% of respondents over 45 years old reported that they were not confident they would have $1,379 per month to live on by the time they retire (Tan, 2019). Such conversations matter for building a sense of solidarity and collective commitment to ensuring that no one living in Singapore today falls below minimum standards of living. They point to the potential for research that centres people’s experiences to also draw ordinary citizens into the public sphere to think and talk about matters of public interest.
iNTRODUCTiON
In the Singapore context, a consensual approach contributes to increasing public interest and participation in policy processes that affect collective wellbeing.

what people need in singapore: a household budgets study
17
MethodologyThis study adopts the MIS methodology. Through a series of focus group discussions with members of the public, and using task-specific, consensus-building techniques, the process generates both quantitative and qualitative data. These include:
• How people in a given social context think about what basic needs are;
• Detailed lists of items—household goods as well as services—required to meet the basic needs of people in specific age groups and household arrangements;
• Budgets required to purchase these goods and services to meet these basic needs; and
• Rationales for why these items are necessary for meeting basic needs.
17

what people need in singapore: a household budgets study
18
The MIS approach offers significant advantages compared to other means of understanding budgets and expenditures that rely on surveys or experts:
• Lived realities: Ordinary members of society are well-positioned to discuss and delineate the specifics of people’s everyday lived needs. Compared to surveys or budgets constructed entirely by researchers, focus group discussions allow for the generation of data that more accurately reflect real habits and practices of ordinary members of society.
• Deep understanding of basic needs: Unlike other ways of developing household budgets, the MiS approach allows us to explain why people include or exclude certain items. These rationales provide insight into social norms and practices, as well as common challenges people face as they go about meeting their needs.
• Variations over life course: People’s needs change. in focusing discussions on people in specific familial and living arrangements (single or partnered parents; older people living alone or partnered) and children across five different age ranges, the MIS approach captures with a high degree of specificity the variant and changing needs across the life course.
• Reasonable standards: The focus group discussions are designed to leverage on participants’ lived experiences. At the same time, a case study setup (described below) encourages them to think not just of their own circumstances, but also of people with both higher and lower levels of income than themselves. Groups are tasked with discussing what might constitute basic needs for anyone in Singapore today. Participants are continually reminded that the lists and budgets generated should be what an ordinary person would regard as reasonable needs, rather than extravagant wants or sub-optimal ways of living.
• Rigorous checks: Multiple rounds of focus group discussions as well as price-checking in real shops ensure that individual responses are contextualised against and verified with other forms of data. While the MiS budgets are based on people’s lived realities, they are also checked against perspectives from domain experts such as dieticians and doctors, to ensure that the needs mentioned in the focus groups meet physiological and health requirements. The combination of lay and expert domains of knowledge in the MiS methodology increases robustness of the data.
• Transparency and accountability: The process and data generated are made open and public, so readers have clear empirical bases for judging and interpreting the data.
METHODOLOGY

what people need in singapore: a household budgets study
19
How we collected dataOur research process included four waves of focus group discussions, consultations with experts and pricing. Each wave of discussions included participants from different household types and each focus group was made up of a unique group of participants (i.e. each participant was involved in only one focus group).
Stage 1: Orientation Groups (OGs)During this first wave of focus group discussions, we asked participants to discuss the definition for a basic standard of living that came about through our 2019 research:
Through this stage, we ensured that the definition remained relevant to and resonant with ordinary people. Between our 2019 report and this current one, our research focus shifted from older persons to younger ones, and from elderly persons primarily responsible for themselves to parents responsible for minor children. Discussions during the OGs therefore also allowed us to begin observing how priorities and attentions shift over the life course.
Stage 2: Task Groups (TGs)The study focused on the needs of the following individuals:
• Single parent;• Partnered parent;• Child below 2 years old;• Child 2 to 6 years old;• Child 7 to 12 years old;• Child 13 to 18 years old; and• Youth 19 to 25 years old (living with parents).
These profiles are of interest because adults living together with their children make up 54% of households in Singapore (Department of Statistics, 2020a).
A basic standard of living in Singapore is about, but more than just, housing, food, and clothing. It is about having opportunities to education, employment, and work-life balance, as well as access to healthcare. It enables a sense of belonging, respect, security, and independence. It also includes choices to participate in social activities, and the freedom to engage in one’s cultural and religious practices.
METHODOLOGY

what people need in singapore: a household budgets study
20
The majority of these households consist of couples and their children. Single-parent households, while less prevalent, are a sizeable population too. in 2019, there were 91,100 households made up of single parents and their children. The particular challenges they face are important to study and understand.
The age categories for the children are broadly consistent with those used in care and educational institutions. The usage of these age bands in institutions signals developmental stages and children’s variant needs from one category to the next, and is in line with our goal of understanding children’s needs across the life course.
The TGs’ task was to draw up detailed lists of items considered to meet basic needs for each individual profile. As a device to facilitate discussions in the focus groups, we presented case studies combining these individuals in various household configurations. For example, one of the case studies was:
The assumption of good health meant the participants only discussed healthcare services that even healthy people need: preventive healthcare, occasional visits to the doctor for minor ailments or dental care. Chronic conditions were not considered. To achieve the basic standard of living, people with more health and care needs would require higher budgets. The precise costs of health and care services as well as lifestyle adaptations vary widely for different health conditions and are difficult to capture comprehensively and accurately in a single study. For instance, researchers in the UK studied the income needs due to sight impairment and found that this alone added 41% to the basic budget (Hirsch & Hill, 2016). To understand the implications of health conditions, further research can use the budgets produced in this study as a baseline, and study how they need to be extended under various health and care scenarios.
Mr and Mrs K live with their child, Z (age 9), in a HDB flat. They are all in reasonably good health.
METHODOLOGY

what people need in singapore: a household budgets study
21
Over six hours, we asked participants to construct lists of items in the following areas: household goods, personal care goods, clothing, social participation activities, education and childcare, transport, food and healthcare.
Presenting the case studyFor each TG, we showed participants a case study relevant to them. In total, we presented eight household types as case studies, with variations along these lines: single or partnered parents; number of children (ranging from one to three); children’s age category; and gender.
Alongside the case study, we showed participants the definition of basic standard of living. We then guided them through the various spaces in a flat—such as living room, dining area and kitchen—and asked them to list the items that Mr and/or Ms K and their children would need to meet basic standards of living. Particularly with children’s needs, we also covered things that are not tangibly connected to the home space—educational needs and social activities, for example. By varying the gender of the children in the case studies, we drew attention to and captured certain gender-specific needs, such as sanitary pads for girls. For most items, however, participants did not make major distinctions between the needs of daughters and sons.
The use of case studies in the MIS methodology ensures that participants think about their task as reporting not just what they themselves do or do not have, but what ordinary people can agree on as minimum standards and basic levels of need. Since we were not asking them to share what they themselves do or do not have, this approach also assured participants that they could express their opinions freely and candidly without fear of judgement or embarrassment.
How we facilitated the TGs
Listing the itemsParticipants were asked to provide detailed information so that we could price the items they listed. The details we asked for include: quantity, quality, price range, life-span and where each item could be purchased.
Building consensusParticipants were asked to reach consensus on every item they put on the list. They were encouraged to discuss and debate when consensus could not immediately be reached. This process is important because the MIS approach aims to capture what ordinary people can agree are basic needs, rather than overly high or low expectations, idiosyncratic habits or preferences. Where consensus could not be reached at the TG stage, we noted the items and took it to the next wave of focus groups.
By recording discussions over contentious items, we also better understand rationales for why certain items, which are not immediately obvious as needs, might nevertheless be deemed necessary. Through this, we gained insight on how ordinary people think about needs in contemporary Singapore.
Each item on the final list resulted from the process of checks and consensus through several waves of focus group discussions. In other words, all items included in the final budget are those that people have been able to agree are needs for meeting the definition of basic standard of living.
METHODOLOGY
The use of case studies in the MIS methodology ensures that participants think about their task as reporting not just what they themselves do or do not have, but what ordinary people can agree on as minimum standards and basic levels of need.
what people need in singapore: a household budgets study
22
METHODOLOGY
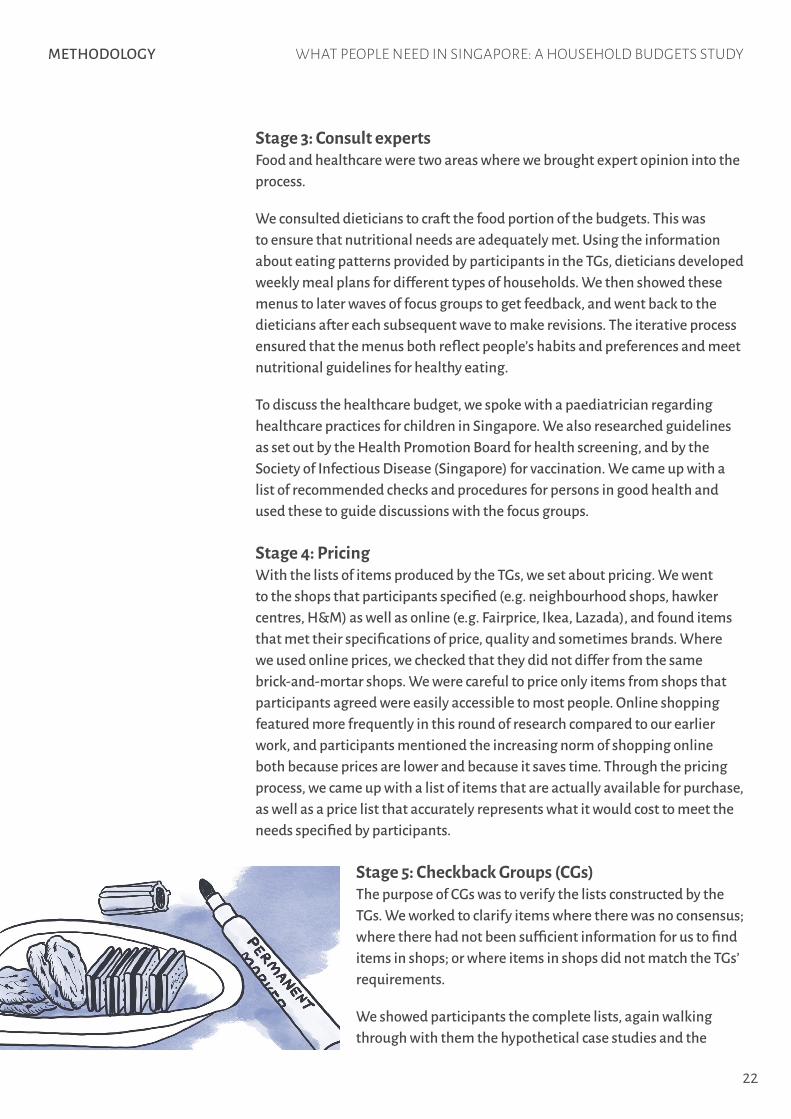
Stage 3: Consult expertsFood and healthcare were two areas where we brought expert opinion into the process.
We consulted dieticians to craft the food portion of the budgets. This was to ensure that nutritional needs are adequately met. Using the information about eating patterns provided by participants in the TGs, dieticians developed weekly meal plans for different types of households. We then showed these menus to later waves of focus groups to get feedback, and went back to the dieticians after each subsequent wave to make revisions. The iterative process ensured that the menus both reflect people’s habits and preferences and meet nutritional guidelines for healthy eating.
To discuss the healthcare budget, we spoke with a paediatrician regarding healthcare practices for children in Singapore. We also researched guidelines as set out by the Health Promotion Board for health screening, and by the Society of infectious Disease (Singapore) for vaccination. We came up with a list of recommended checks and procedures for persons in good health and used these to guide discussions with the focus groups.
Stage 4: PricingWith the lists of items produced by the TGs, we set about pricing. We went to the shops that participants specified (e.g. neighbourhood shops, hawker centres, H&M) as well as online (e.g. Fairprice, ikea, Lazada), and found items that met their specifications of price, quality and sometimes brands. Where we used online prices, we checked that they did not differ from the same brick-and-mortar shops. We were careful to price only items from shops that participants agreed were easily accessible to most people. Online shopping featured more frequently in this round of research compared to our earlier work, and participants mentioned the increasing norm of shopping online both because prices are lower and because it saves time. Through the pricing process, we came up with a list of items that are actually available for purchase, as well as a price list that accurately represents what it would cost to meet the needs specified by participants.
Stage 5: Checkback Groups (CGs)The purpose of CGs was to verify the lists constructed by the TGs. We worked to clarify items where there was no consensus; where there had not been sufficient information for us to find items in shops; or where items in shops did not match the TGs’ requirements.
We showed participants the complete lists, again walking through with them the hypothetical case studies and the
what people need in singapore: a household budgets study
23
Like other items in the budgets, the pricing of cooked food and groceries was done at eateries and supermarkets mentioned by the participants in the focus groups.
For meals eaten outside, the meal plan provides several comparable, including halal, options (e.g. nasi padang or economy rice). Where there are price differences between these options, the higher price is adopted to ensure that people of all cultural backgrounds can meet basic needs.
Home-cooked meals were converted into recipes with specific quantities of ingredients so that these could be priced. Most groceries are sold in quantities that exceed what is required for a week of cooking, especially for smaller households. For ingredients that do not keep longer than a week (e.g. fresh vegetables), any leftover
How we priced food
portions were considered wasted. For ingredients that keep longer than a week (e.g. eggs), we assumed leftover portions would go towards the following week’s meals and therefore be fully consumed. For items that are consumed in very small quantities but keep a long time (e.g. jam), their lifespan for purposes of budget calculations was based on their recommended shelf-life.
Although the meal plans incorporate a variety of options for both home-cooked and bought meals in order to capture cost variations, a one-week meal plan is clearly not exhaustive in its representation of local food options. Nonetheless, during the pricing process, we noted that comparable options often entail minor price differences that should not significantly affect the room for choice within the agreed budget over the long run.
METHODOLOGY
rooms in a flat. Participants at this stage identified things they did not agree with, as well as anything that might be missing from the original list. We highlighted unresolved items for deeper discussions. Where relevant, we told them about the items we found in shops, to give them a better sense of what is actually available for purchase.
Stage 6: Final Groups (FGs) The final groups were shown the budgets category by category, to address any unresolved differences. They were also asked to decide whether certain items might be shared among household members and the rules for sharing, for example, how many children can a share a laptop or toys, whether age and gender matter when it comes to sharing particular items, and so on. The decisions made by these groups were used to revise the budgets for the final time.
Stage 7: Constructing household budgetsSince the item lists drawn up through the focus groups are for individuals rather than households, the last stage of the research process was to create

what people need in singapore: a household budgets study
24
budgets for different household configurations by combining these individual item lists and applying the sharing rules decided by the FGs. This approach allowed us to construct budgets for any configuration of household, with single or partnered parents, and one to three children up to 25 years old.
To allow detailed analysis, the rest of this report focuses on the budgets for two particular household types—single parent with a child aged 2–6 years old, and partnered parents with two children aged 7–12 and 13–18 years old. The full lists of items making up the budgets for these and several other household types are published on the study website (https://whatsenough.sg). The website also provides a calculator that can generate the budgets for other possible household configurations.
How we selected participantsin our 2019 research, participants spoke to the needs of people in their own age groups (55–64; 65 years and older). For practical and ethical reasons, this was not possible in the current research. Single and partnered parents presented responses reflecting the needs of adults similar to them in terms of parenting and partnership status, but the needs of children were reported by parents with children currently in the relevant age groups, rather than by children themselves. For example, to understand the needs of children aged 7 to 12, we had focus group discussions with parents who have at least one child currently within that age range. The exception to this approach was the youth category (19–25 years old), where we had participants between 21 to 25 years old, since they were mature enough to participate in research as well as likely to be taking care of many of their individual needs by this time.
in this study, a total of 196 participants took part in 24 focus groups, with an average of eight persons in each group. We ensured that participants were diverse in terms of gender, ethnicity, and socioeconomic background (using education level and housing type as proxy) (Table 1). Socioeconomic diversity
was important for avoiding final budgets that were either extravagant or inadequate. Variations in ethnicity mattered for capturing needs broadly reflective of our ethnically-diverse society.
METHODOLOGY
In this study, a total of 196 participants took part in 24 focus groups. We ensured that participants were diverse in terms of gender, ethnicity, and socioeconomic background (using education level and housing type as proxy). Socioeconomic diversity was important for avoiding final budgets that were either extravagant or inadequate.

what people need in singapore: a household budgets study
25
Table 1 Profile of study participants
Number of participants %
Sex Male 79 40
Female 117 60
Living arrangement Partnered parent 116 59
Single parent 44 22
Youth living with parent(s) 36 18
Age 21–25 36 18
26–34 36 18
35–44 75 38
45–54 49 25
Number of children 0 36 18
1 51 26
2 60 31
3 or more 49 25
Ethnicity Chinese 106 54
Malay 56 29
Indian 29 15
Others 5 3
Education level Secondary and below 37 19
Post-secondary 159 81
Housing type Rental flat 36 18
Owned HDB flat 130 66
Private property 30 15
Total 196 100
METHODOLOGY

what people need in singapore: a household budgets study
26
Recruitment and ethics
The impact of COVID-19 on the research
Participants were recruited through advertisements placed on Facebook, Telegram and Whatsapp. To protect the participants’ privacy and confidentiality, we did not collect identifying information such as NRIC numbers and addresses. All participants were briefed about their rights to confidentiality and exit. They signed a confidentiality agreement to protect any information shared during the focus group discussions.
Like many other research projects around the world, our work was affected by the COViD-19 pandemic. Data collection was delayed by the suspension of physical gatherings in Singapore in April 2020. We conducted a number of focus group discussions online in June and July 2020 and eventually resumed face-to-face focus groups in October. in these, we observed safe distancing measures and mask-wearing. While these were cumbersome and altered some communication dynamics compared to pre-COViD groups, they did not have significant adverse effects on the data we were able to collect.
During the period when residents in Singapore were in ‘lockdown’ (officially referred to as “circuit breaker”), we conducted two special focus group sessions via Zoom to explore how people’s lives had been affected by the pandemic and what effects the evolving situation had on how they thought about basic needs. These discussions allowed us to see how some needs became more urgent (e.g. computers for children to do home-based learning) and others less so (e.g. travel). importantly, it allowed us to see that, for the most part, people’s needs and how they thought about them had not been immediately or profoundly transformed.
The durability of the budgets produced by this study depends partly on the price stability of the items in the budgets—which in turn reflects item supply and demand. Amidst reports of panic buying in supermarkets in the early stages of the pandemic (Ang, 2020), the research team began to monitor a list of 21 grocery and household items on the online shopping platform of the leading supermarket chain, Fairprice, to ensure that our budgets did not capture prices that were unusually high or low. Every week
METHODOLOGY
Amidst reports of panic buying in supermarkets in the early stages of the pandemic, the research team began to monitor a list of 21 grocery and household items on the online shopping platform of the leading supermarket chain, Fairprice, to ensure that our budgets did not capture prices that were unusually high or low.

what people need in singapore: a household budgets study
27
from mid-April till the end of December 2020, we tracked the availability and prices of pantry staples like rice, pasta, eggs and oil; fresh fruit and vegetables like tomatoes, bananas and shallots; canned food like sardines and tuna; as well as daily essentials like toilet paper and hand wash. in general, we priced the cheapest, often house brand, item except when this was not suitable or available. We also checked the availability and wait times of delivery bookings.
For a few weeks at the start of this monitoring period, several pantry items with long shelf lives, such as macaroni, pasta and tinned tuna, went out-of-stock. By June, most items were readily available again. But there were exceptions. Garlic and shallots, for example, were periodically unavailable through to October. For fresh produce, it was also common to see changes in the brands on sale, as product supply chains were reorganised.
The patterns of price fluctuations varied across items. At the start of the circuit breaker, prices rose for some items because more affordably-priced brands became unavailable (e.g. eggs and tinned tuna). These prices stabilised fairly quickly. For several items, prices swung by as much as $3 in the initial months, but even these fluctuations narrowed towards the end of the year. There were also a few things for which prices remained the same throughout the period being tracked (e.g. wholemeal bread, UHT milk and toilet paper). Figure 1 shows the prices of selected items during this period as examples.
METHODOLOGY
Figure 1 Prices of selected grocery and household items from April to December 2020
$7.00
Toilet paper Pears Banana Tinned tuna Eggs Wholemeal bread UHT milk
$5.00
$6.00
$4.00
$3.00
$2.00
$1.00
$0.00Pre-crisis Aug 20Apr 20 Sep 20May 20 Oct 20Jun 20 Nov 20Jul 20 Dec 20
what people need in singapore: a household budgets study
28
METHODOLOGY
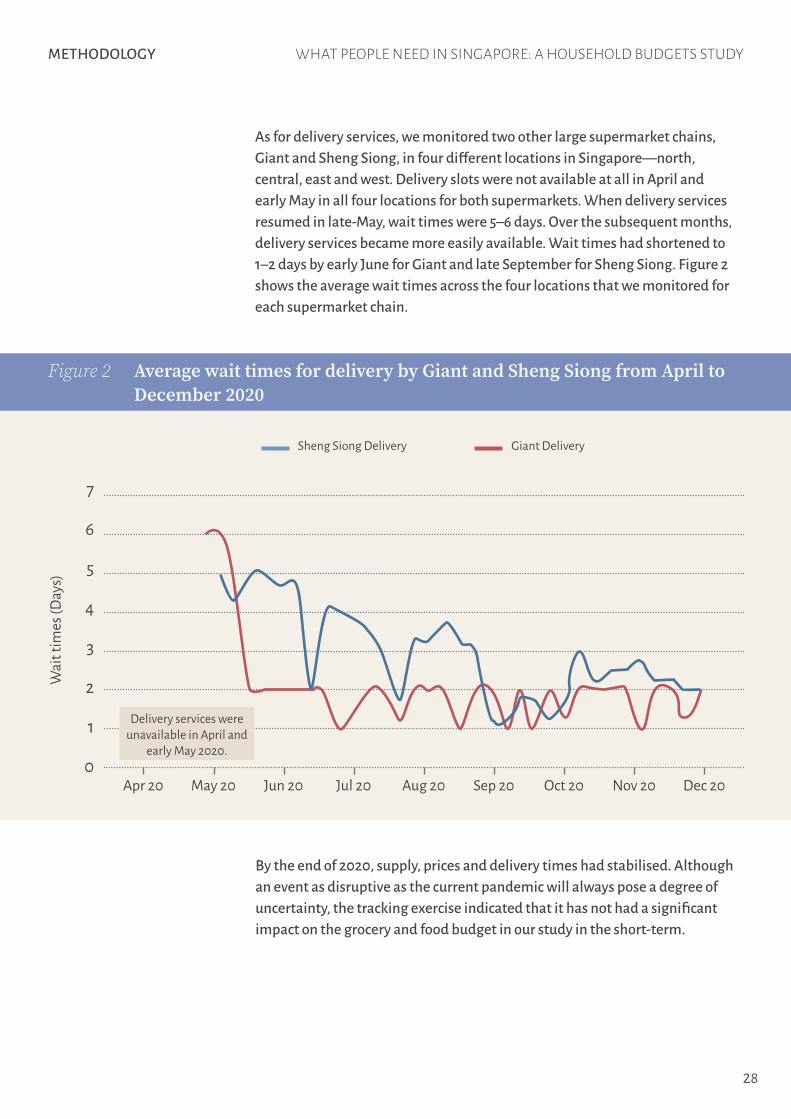
As for delivery services, we monitored two other large supermarket chains, Giant and Sheng Siong, in four different locations in Singapore—north, central, east and west. Delivery slots were not available at all in April and early May in all four locations for both supermarkets. When delivery services resumed in late-May, wait times were 5–6 days. Over the subsequent months, delivery services became more easily available. Wait times had shortened to 1–2 days by early June for Giant and late September for Sheng Siong. Figure 2 shows the average wait times across the four locations that we monitored for each supermarket chain.
By the end of 2020, supply, prices and delivery times had stabilised. Although an event as disruptive as the current pandemic will always pose a degree of uncertainty, the tracking exercise indicated that it has not had a significant impact on the grocery and food budget in our study in the short-term.
Figure 2 Average wait times for delivery by Giant and Sheng Siong from April to December 2020
7
Sheng Siong Delivery
Wai
t tim
es (D
ays)
Giant Delivery
5
6
4
3
2
1
0Aug 20Apr 20 Sep 20May 20 Oct 20Jun 20 Nov 20Jul 20 Dec 20
Delivery services were unavailable in April and
early May 2020.

what people need in singapore: a household budgets study
29
METHODOLOGY
Uprating budgets for older people As price levels and consumption patterns change over time, MiS budgets too must be revised to stay up to date. One way is to conduct fresh focus groups to reconstruct the item lists. However, this requires substantial research resources. in the UK, this is done every four years or so. in between, the budgets may be “uprated” using the Consumer Price Index (CPI) to reflect inflation.
This time, alongside the generation of budgets for working-age households, we also uprated the 2019 MiS household budgets for older people using the latest available CPi—for 2020—to produce a complete set of budgets for people of all ages.
For greater accuracy, instead of applying the CPi for all items to the total household budgets, the individual items in the household budgets were first mapped to the classification of consumer items in the CPI. For the most part, this was straightforward. But there were a few exceptions.
Some items in social participation were expressed in terms of their purpose rather than specific things, and so did not have a clear match in the CPI taxonomy. Examples are hospital visiting and birthday gifts. These were eventually grouped according to the type of goods most likely to be purchased for that purpose. Since participants said they would buy fruit when visiting friends in the hospital and that birthday gifts were meant for grandchildren, these two items in the budget were uprated using the price indices for Fruits, and Games and Toys, respectively.
in general, uprating does not involve checking prices in shops or whether the items in the original budget are still on sale. Following the MiS methodology, item choices may only be changed by fresh focus groups in future. But for specific components of the budget involving public services, where the actual price changes are known (e.g. public transport concession pass, housing, utilities2) or where new services have been introduced (e.g. public health screening), the costs are revised based on the new published rates rather than the CPi.
Compared to 2019, the three household budgets for older people in 2021 had increased by around 3% (Table 2).
Table 2 Monthly MIS budgets for older people
Household Type 2019 2021 Change (%)
Single person, 55–64 years old $1,721 $1,768 +2.7%
Single person, 65 years and older $1,379 $1,421 +3.0%
Couple, 65 years and older $2,351 $2,419 +2.9%
2 See the previous MIS report (Ng et al., 2019) for details on the calculation of housing and utility costs.

what people need in singapore: a household budgets study
30
FindingsIn this section, we first discuss MIS budgets for three selected household types. Then, we highlight how goods and services meet basic needs. Third, we compare MIS budgets to expenditure data, work income, public schemes. Finally, we calculate a living wage.
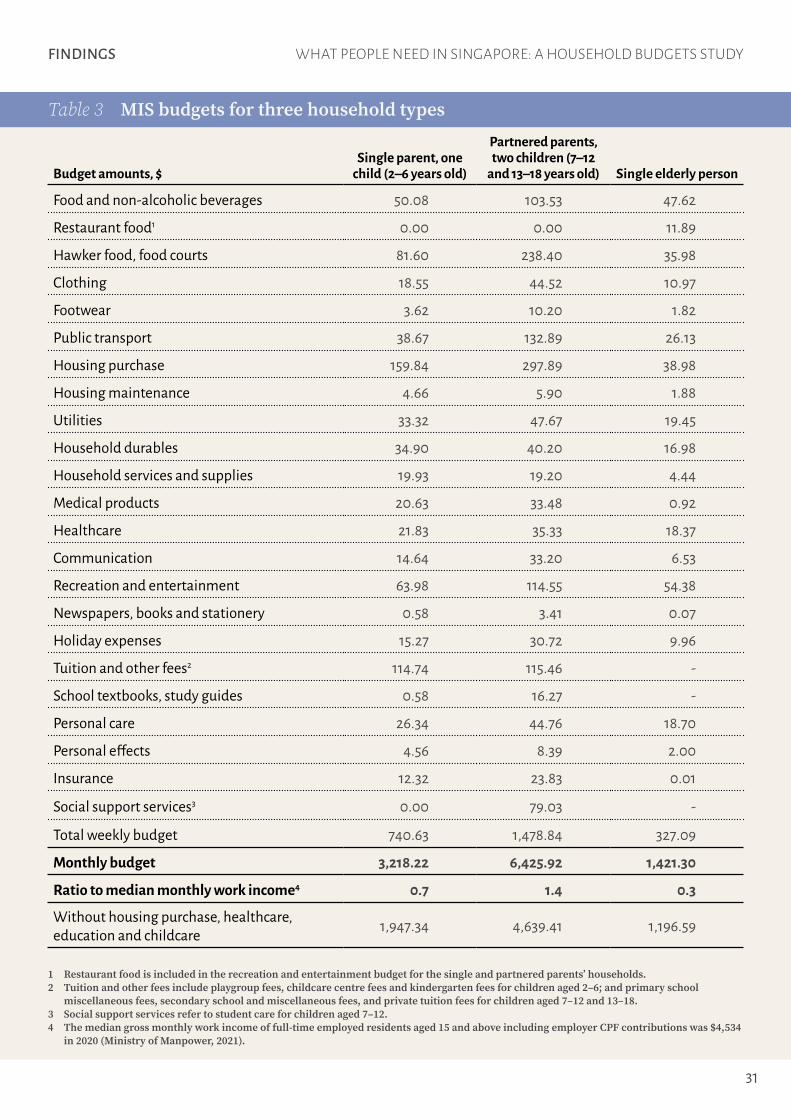
Household budgetsTable 3 shows the detailed weekly budgets for three selected households. The budget for the single parent household is based on the scenario of a single mother, while the budget for the single elderly person is the average of the budgets for a single elderly man and a single elderly woman. The amounts are:
• $741 per week for a single parent with one child 2–6 years old ($3,218 per month);
• $1,479 per week for a couple with two children 7–12 and 13–18 years old ($6,426 per month); and
• $327 per week for a single elderly person ($1,421 per month).
The single parent household’s budget is 0.7 times of the national median full-time work income of $4,534 in 2020. The partnered parent household’s budget is 1.4 times and the single elderly person’s budget is 0.3 times. In other words, the single parent household requires around 70% of a “middle earner’s” income to sustain a basic standard of living, while the partnered parent household requires incomes from about one and a half middle earners.
30
what people need in singapore: a household budgets study
31
FiNDiNGS
Table 3 MIS budgets for three household types
Budget amounts, $Single parent, one
child (2–6 years old)
Partnered parents, two children (7–12
and 13–18 years old) Single elderly person
Food and non-alcoholic beverages 50.08 103.53 47.62
Restaurant food1 0.00 0.00 11.89
Hawker food, food courts 81.60 238.40 35.98
Clothing 18.55 44.52 10.97
Footwear 3.62 10.20 1.82
Public transport 38.67 132.89 26.13
Housing purchase 159.84 297.89 38.98
Housing maintenance 4.66 5.90 1.88
Utilities 33.32 47.67 19.45
Household durables 34.90 40.20 16.98
Household services and supplies 19.93 19.20 4.44
Medical products 20.63 33.48 0.92
Healthcare 21.83 35.33 18.37
Communication 14.64 33.20 6.53
Recreation and entertainment 63.98 114.55 54.38
Newspapers, books and stationery 0.58 3.41 0.07
Holiday expenses 15.27 30.72 9.96
Tuition and other fees2 114.74 115.46 -
School textbooks, study guides 0.58 16.27 -
Personal care 26.34 44.76 18.70
Personal effects 4.56 8.39 2.00
Insurance 12.32 23.83 0.01
Social support services3 0.00 79.03 -
Total weekly budget 740.63 1,478.84 327.09
Monthly budget 3,218.22 6,425.92 1,421.30
Ratio to median monthly work income4 0.7 1.4 0.3
Without housing purchase, healthcare, education and childcare 1,947.34 4,639.41 1,196.59
1 Restaurant food is included in the recreation and entertainment budget for the single and partnered parents’ households. 2 Tuition and other fees include playgroup fees, childcare centre fees and kindergarten fees for children aged 2–6; and primary school
miscellaneous fees, secondary school and miscellaneous fees, and private tuition fees for children aged 7–12 and 13–18.3 Social support services refer to student care for children aged 7–12.4 The median gross monthly work income of full-time employed residents aged 15 and above including employer CPF contributions was $4,534
in 2020 (Ministry of Manpower, 2021).

what people need in singapore: a household budgets study
32
it is particularly important to note the costs of public services such as housing (rent and purchase), healthcare, education and childcare within the budgets. As these are costly services needed by all households with children, how they are funded has huge impact on household finances. The greater the extent of state funding, such as through direct service delivery or universal subsidies, the lighter the financial burden on individual households. As they are currently organised in Singapore, these services account for significant proportions of the household budgets. Omitting these costs would lower the budgets by 28% for the partnered parent household and 39%
for the single parent household.
For the single elderly person, (i) food, (ii) housing-related costs, and (iii) recreation and cultural activities account for the largest shares of the budget. But for the working-age households, instead of recreation, the three largest components include education and childcare. There are also differences between the single and partnered parent households. Housing is by far the most expensive budget component for the single parent household, whereas housing costs for partnered parent households are comparable to their food costs. This reflects a substantial housing penalty for single parents that is discussed below.
FiNDiNGS
How housing, healthcare, education and childcare are funded has huge impact on household finances. The greater the extent of state funding, such as through direct service delivery or universal subsidies, the lighter the financial burden on individual households. Currently in Singapore, these services account for significant proportions of the household budgets. Omitting them would lower the budgets by 28% for the partnered parent household and 39% for the single parent household.

what people need in singapore: a household budgets study
33
Age-related costsSome items in the budget—such as furniture, appliances and tableware—are used by all household members. Other items are personal in nature. For children’s personal items, costs often vary according to age (Figure 3). In general, the costs of social participation, clothing and food are higher for older children.
• Older children incur larger social participation expenses as they have more social activities. The rise is sharpest for the 19–25 age group, who need a budget for work-related occasions and travel with friends.
• Clothing costs display the same upward trend, but fall for the 19–25 age group who no longer need school attire, do not outgrow clothing sizes so quickly, and are able to find better deals by shopping online.
• Food costs are highest for the youngest and oldest children, due to infant formula for the below-twos and a higher frequency of eating out for the oldest group.
Other parts of the budget are smaller for older children or do not vary consistently by age:
• Personal care budgets show a ‘U-shape’ across age groups. As children grow up, the costs of items such as diapers and wet wipes taper off. When they reach their teens, items such as sanitary pads, spectacles and personal grooming products push up the budget again.
• Among younger children, education and childcare costs are highest for the below-twos, as infant care is expensive. Children aged 13–18 have the lowest budget even after accounting for tuition, as they no longer need student care. However, costs then spike for the 19–25 age group due to university fees.
• Healthcare generally costs less as children grow up because of fewer GP visits, until they reach 19–25 years old when subsidised school health programmes cease and they have to pay adult prices.
• Transport costs reflect the unique situation of each age group. Children below 2 need an additional taxi budget in case of bad weather and emergencies, because parents said children at this age may be difficult to manage on public buses and trains. The 2–6 year-olds have the smallest budget as they can travel for free on public transport, while the 7–12 year-olds have the highest transport budget due to school bus fees. Costs rise again at 19 years old because tertiary concession passes and adult travel fares are more expensive.
FiNDiNGS

what people need in singapore: a household budgets study
34
Figure 3 Budget components for children of different ages
$500
Healthcare
Belo
w 2
Belo
w 2
Belo
w 2
Belo
w 2
Belo
w 2
Belo
w 2
Belo
w 2
2–6
2–6
2–6
2–6
2–6
2–6
2–6
7–12
7–12
7–12
7–12
7–12
7–12
7–12
13–1
8
13–1
8
13–1
8
13–1
8
13–1
8
13–1
8
13–1
8
19–2
5
19–2
5
19–2
5
19–2
5
19–2
5
19–2
5
19–2
5
Clothing Personal CareSocial
participation
Age group (Years)
Transport Food Educare
$150
$100
$50
$0
Combining the costs across all budget areas, Figure 4 shows the household budgets for single and partnered parent households with one child at different ages. The budgets do vary depending on the child’s age, but not linearly. The child aged 19–25 years old adds the most to the household budget due to the higher costs of education (i.e. university fees) and social participation compared to younger children. Below 19 years old, the budget differences are smaller. Children aged 7–12 years old have a slightly higher budget due to the
costs of student care, tuition and transport, while children below 2 incur higher costs for food and infant care. On the whole, budget variations reflect the costs of education and care, which dominate the expenses for children.
FiNDiNGS
\\
On the whole, budget variations for children of different ages reflect the costs of education and care, which dominate the expenses for children.

what people need in singapore: a household budgets study
35
Figure 4 MIS budgets for single and partnered parents with one child at different ages
$6,000
$7,000
Below 2 Below 22-6 2-67-12 7-1213-18
Single parent with one child Partnered parents with one child
13-1819-25 19-25
$4,000
$5,000
$3,000
$2,000
$1,000
$0
FiNDiNGS
Household sizesCompared to smaller households, larger ones have lower expenditures per household member due to the economies of scale associated with intra-household sharing of common items such as housing, utilities and household durables. There are also savings associated with having more than one child. For example, participants said that children below 7 years old will share babysitting services and items such as corner bumpers, playmats, playpens, digital thermometers and baby bathtubs. A household only needs one set of each item regardless of the number of children. Children can share rooms during family trips. Toys and books can be passed down to younger siblings. Larger households are also better able to avoid overbuying ingredients and food waste.
For other areas of the budget, participants expressed that each child needs their own items, due to learning needs and the impracticality of sharing:
Basically their timing when they need to use the notebook. If say for example, Sarah [representing child aged 13 to 18] and Z [representing child aged 19 to 25] need to use it at the same time, they have to stop, do sharing. [R5, FG2]
Age group (Years)

what people need in singapore: a household budgets study
36
So the participants decided that each child above 7 requires their own laptop or tablet, because more than one child may need to use a device at the same time. This need was especially salient after the pandemic hit, when working and schooling from home became common practices. Parents and young adults aged 19–25 agreed they needed a laptop each, for work or school, because parents’ work should be treated with confidentiality, so that sharing laptops with either partners or children would be inappropriate.
I think they should have a separate device from their parents because for me, I don’t like when they touch my office laptop, and they would accidentally lock it and I couldn’t work anymore. And moreover, they need to do their own SLS [Student Learning Space] or whatever yeah, so they will need a separate device from me, yeah. [R4, CG5]
FiNDiNGS
How goods and services meet basic needsA major advantage of the MiS approach is that it provides insight on how ordinary lives are lived. in particular, focus group discussions reveal how goods and services are connected to the meeting of a wide range of needs.
Before we detail these connections, it is worth mentioning a few broad themes in how people relate to basic needs. First, as people move through the life course, priorities change and attentions shift. Participants of both our 2019 study and the current one found the definition for basic standard of living compelling. When they discussed goods and services, however, they focused attention on different aspects. Older participants spoke more about health needs—invoking the importance of health when talking about food, leisure and even household goods such as non-slip flooring. They worried about healthcare costs and about “burdening” younger members of their families. in contrast, as will become clear in this section, participants who are currently parents to dependent children brought greater attention to children’s education and their own work-life balance needs.
Second, in speaking of basic needs, participants who are parents regularly prioritised the needs of children. in discussions of household goods, parents insisted on higher quality or specialised items in order to ensure the safety of children. For items which were typically contentious and hard to form

what people need in singapore: a household budgets study
37
consensus on, such as air-conditioning, the orientation toward wanting children to be comfortable meant that the conversations lingered for a longer time compared to when older persons discussed these as needs for themselves. When talking about social activities for children, parents spoke of developmental and social needs as well as wanting children to be able to fit in and get along with peers. in general, they put higher emphasis on children’s social participation needs than their own. Conversations were especially animated when we got to the topic of education needs. Parents were quick to presume that everyone in Singapore cares deeply about children’s education. They spoke of the need for tuition to help children keep up in school. Notably, the needs around education are seen as not simply immediate and short-term, but for children’s long-term good. Both parents as well as youths spoke explicitly and firmly about the importance of tertiary educational credentials for securing jobs. Education needs form a significant part of household budgets and are seen as a major priority.
Third, gender and marital status matter when it comes to people’s views and experiences of needs. in general, women more than men centred household needs on children’s needs. They were somewhat more knowledgeable about and attentive to children’s changing needs when growing up and the specific items necessary for meeting them. Both men and women made presumptions about women playing larger roles as caregivers and in housework (including cooking), and men as full-time workers. This came through in the ways they discussed kitchen items and food, childcare and education, as well as clothing. Single parents, compared to partnered parents, expressed both a more pronounced prioritisation of their children and more anxiety around meeting children’s needs. Single mothers, in particular, expressed many anxieties. They talked about the difficulty of ensuring adequate income as single earners and of maintaining employment given the challenges of securing good care alternatives. They also worried that if something happened to them, their children would have no one else to depend on. Single mothers among our participants were especially articulate in revealing their strategies for stretching limited budgets to meet their children’s needs. This included cutting things out of their expenditure even though they recognise that they are forgoing their own needs.
These broad themes observed in focus groups are an important reminder that needs are complex and diverse. Therefore, budgets for basic standards of living must reflect and be inclusive of different parts of society. In the following, we detail some items to further illustrate how participants crafted consensus amidst diversity, and how goods and services are linked to fulfilling basic needs.
FiNDiNGS

what people need in singapore: a household budgets study
38
Household itemsThe living room is a space where parents and children gather for activities as a family. Throughout the groups, as parents deliberated the quality of household items, their main considerations were that things should be child-safe and easy to use, and endure children’s usage over time. Anti-slip floor tiles are budgeted for the whole flat and night lights are included to aid family members returning home late or who need the bathroom at night. Parents of young children discussed how a ceiling fan takes up less space, but a wall fan is safer for children 6 years old and below because they may throw objects at a ceiling fan. Similarly, parents with young children agreed on having window grilles, corner bumpers, pinch guards and child-safe locks. A playpen and play mat are also included for families with children below 2 years old.
Digital accessDigital access and devices are essential to both parents and children, who require these for work and school. The need became especially salient during the COViD-19 pandemic. Every household needs a basic wireless broadband plan to access the internet. Parents excluded landline telephones from the budget, highlighting the decline in their usage due to the ubiquity of mobile phones. Apart from mobile phones for adults, they included a mobile phone for each child from 13 years old onwards. Children between 9 and 12 years old can use their parents’ old mobile phones with the cheapest SiM-only plan, so that family members can contact one another during emergencies and when children have after-school activities. While primary school children do not need a laptop, parents included a tablet in the budget, in anticipation of more home-based learning requirements. Other than digital learning devices, parents agreed on an annual budget for age-appropriate books and toys for children, because these are necessary for healthy child development.
FiNDiNGS

what people need in singapore: a household budgets study
39
BedroomsBedrooms are spaces in the house that provide privacy and personal time for both parents and children. Parents agreed that their bedrooms should be separate from their children’s, except for children younger than 2 years old who can sleep in parents’ rooms as this is more convenient when they wake up at night. Parents insisted that children of different genders should have separate bedrooms after they reach adolescence. Children of the same gender sharing a bedroom would have a trundle bed to save space, while a child with their own room would have a twin bed. Parents explained that a standard twin bed is more durable than a smaller child bed.
Besides being spaces for rest and personal time, bedrooms are also spaces for children to study and do their homework. Each bedroom for children needs a study desk, which may be shared among siblings. However, parents said that
every child should have their own study chair as they may need to work at the desk at the same time.
Kitchen and diningItems in the kitchen and dining budgets reflect the needs of households but also those of children at different ages. Every kitchen needs cabinets, a stove, hood, refrigerator, sink and tap. The budget also includes an array of basic cooking equipment, such as pots, pans, wok, kettle, rice cooker, oven, microwave, knives, chopping boards, scissors, containers and cleaning products. Some items, such as a blender, have multiple purposes—parents use blenders to puree food for young children or make sauces for curries and pasta dishes. items in the dining room include a dining table, chairs, plates, bowls, cups and cutlery. Safety emerged as a priority: for children below 2 years old, parents included items such as a safety-gate, child-safe dinnerware and a high-chair. A booster seat is budgeted for children aged 2–6. The budget reflects the needs of babies too, with items such as a milk powder dispenser, an insulated bag, bibs, a steriliser, milk bottles and a breast pump.
Laundry, bathrooms and storeroomBasic laundry and cleaning items are included in the budget. Each flat has a washing machine, vacuum cleaner, mops, brooms, hangers, detergent and other cleaning products. Participants said that they need to do laundry at least thrice a week, because of children’s daily wear of childcare and school uniforms. Parents included an additional portable drying rack in the budget, because the space for drying laundry in a flat is limited. Households with babies also need to wash baby clothing separately using baby-safe laundry detergent.
FiNDiNGS

what people need in singapore: a household budgets study
40
Every bathroom needs a water heater, shower head, bidet, mirror cabinet, shower caddy, shower curtain, hooks and a rail. For babies under 2 years old, an additional bathtub is included in the budget, and a potty is included for children below 3 years old.
Steel shelves are included for the storeroom, because parents said they needed durable shelves that would not collapse easily and pose a danger to children. Reflecting the reality of limited space, there are plastic boxes to keep books, toys and other items in the storeroom.
UtilitiesThe budget includes utilities, service and conservancy charges, and fire insurance. The prices of utilities are based on national average consumption patterns for the respective flat types, while the highest published conservancy fee is adopted. Fire insurance plans are based on 5-year basic coverage for public housing.
Food Food items in the budget are based on inputs from the focus group discussions as well as from a dietician, to ensure that the meal plans meet health and nutrition standards for the various age groups. Most of the recommended meals by the dietician include brown rice; whole-meal bread or pasta; low-fat, low-sugar options; more vegetables; and at least two servings of fruit daily. Not all meals are prepared at home as the menus reflect the work and school routines among parents, school-going children and young adults. Participants said that lunches and day-time snacks are usually consumed at or near workplaces for parents, while children have meals in schools or at childcare centres. Weekday breakfasts and dinners are mostly prepared at home and these menus reflect the developmental stages of the children. For
FiNDiNGS

what people need in singapore: a household budgets study
41
infants below 1 year old, parents said a combination of breast and formula milk is required. Once the children are old enough to attend infant care centres, parents introduce foods like cereal, bread or biscuits, vegetables, fruit and fish into their prepared meals at home, gradually weaning them off milk. By the age of 4, children no longer need the milk bottle and can have similar meals at home as their parents.
Food fulfils human needs for sustenance, pleasure and social connection. Parents talked about the importance of eating out together to build family bonds. Besides the importance of eating nutritious meals, parents and young adults expressed the need for an occasional “cheat meal” where they could eat something that feels indulgent. For example, once a week, parents and children would have a scoop of ice-cream or a small packet of potato chips, and a meal at a fast-food restaurant. Young adults included a bubble tea, once a week, as their “cheat” snack; they stressed that the ritual of buying bubble tea with friends or co-workers is itself a social activity.
Personal carePersonal care items are important for hygiene, for a sense of care toward oneself and to make a good impression on others. Mothers and fathers need items such as: towels, shampoo, shower cream, toothbrush, toothpaste, shaver and blades, facial wash, nail clipper, thermometer, face masks, hand sanitiser, comb or hair brush, haircuts, prescriptive glasses, first-aid kit and some over-the-counter (OTC) medications for common ailments. Mothers and younger women (19–25 years old) require specific items such as hair dryer, sunscreen, sanitary pads, facial cleanser and make-up.
Personal care items specific to children under 2 years old include things like: a nail clipper for babies, nasal spray, mosquito patches, baby bath and shampoo, diapers and diaper cream. Young adults need contact lenses and make-up to boost confidence and self-image. Perfume or cologne also appears in the young adults’ budget, as self-presentation becomes more important at their age.
Clothing, footwear and accessoriesThe clothing items reflect needs for comfort, self-determination and expression, respect and belonging.
Different types of clothing are needed for going out (casual wear); work or social occasions like birthday parties and weddings (formal wear); special occasions like cultural festivals and ceremonies; exercising; and lounging and sleeping at home. There are also different types of footwear for different contexts. More specialised needs include bibs and mittens for infants, uniforms for school-going children, nursing bras and pads for breastfeeding
FiNDiNGS

what people need in singapore: a household budgets study
42
mothers, and prayer garments for Muslim women and girls 7 years old and above.
Compared to fathers, mothers need more variety and quantity of formal wear, because women “need to look presentable at work” and a woman will “never get promoted if she wears clothes that look worn out”. Mothers need accessories (e.g. jewelry, shawl) to complement their attire whereas fathers need accessories (e.g. tie) to convey respectability on some occasions.
For children, the type, quantity, quality and lifespan of clothing reflect needs and concerns specific to their ages in terms of hygiene; how quickly they outgrow clothes; frequency of use; cultural practices of modesty; and social norms of respectability. For example, children below 2 years old have the cheapest and lowest quantity of clothing because babies outgrow their clothes more quickly than older children. For other age groups, clothes typically last one to two years and are purchased at fashion outlets such as H&M and Uniqlo because of convenience, range and price.
As children grow up, other needs become more apparent: self-expression, comfort, respect and belonging. The cheapest items are adequate for home wear and undergarments, but not for casual and formal wear because children need to look presentable in public, indicating that children’s clothes are also linked to parents’ needs for respect and social approval. Parents mentioned how “sad” it would be for children to be seen with the same clothing at every wedding or birthday party, and how this would reflect poorly on parents. While it is reasonable for a child 2–6 years old to have only one set of formal wear (i.e. dress or shirt and trousers), from the age of 7 onwards, children attend more social events and therefore need more items. Girls aged 7–12 have blouses, skirts, trousers and dresses, and boys have several pieces of shirts and trousers, to allow different looks in their formal repertoire. There were more formal items in the budgets for young adults aged 19–25, to cater to youths who are working.
The budgets for children’s accessories increase with age as older children are more conscious about their image. This is also gendered—girls need accessories starting from below 2 years old, while boys’ needs for accessories only emerge at the 13–18 age group.
Clothing budgets reflect diverse cultural practices as children, particularly girls, transition to adolescence and adulthood. New items such as track pants for physical education lessons were added to clothing budgets for girls 13–18 years old, while prayer garments were added to children’s budgets starting from the 7–12 age group.
FiNDiNGS

what people need in singapore: a household budgets study
43
Leisure activities, holidaysAll groups agreed that leisure activities, self-improvement classes and holidays are basic needs for adults and children. For each of these items, participants were asked to decide on an appropriate budget rather than specific things to spend on, to cater to diverse interests and preferences, and provide wider options for social participation.
For children, self-improvement classes were discussed in terms of education needs. For mothers and fathers, however, self-improvement classes contribute to their personal and social development. Parents spoke about courses as
being good for emotional and mental health, and helpful to their careers. Workshops can equip them with tools and resources to teach their children and navigate the education system.
Mothers, fathers and young adults require a monthly leisure budget of $100 that covers activities such as sports, hobbies, movies and eating out with friends and family. Leisure budgets are much lower for younger children who have greater choice of free activities. For teenagers, their leisure budget for things like sports activities and eating out with friends reflects their desire for independence.
Budgets for holidays, which fulfil needs to relieve stress and bond as a family, cover package trips within Southeast Asia. Children aged 7–12 and 13–18 have a budget of $10 or $20 respectively for their own expenses (e.g. to buy souvenirs), so they can learn how to manage money. Young adults’ travel budgets of $500 per year cover a trip either with friends or with family.
Celebrations, social events and cultural festivities There was strong consensus that celebrating birthdays and milestones and taking part in social events and cultural festivities are basic needs.
For birthdays, single parents need to get something special for themselves because they “have been giving to others, and deserve to treat themselves on their birthday”. Partnered parents, on the other hand, need budgets to purchase gifts for their spouse. Parents agreed that a budget for children’s birthdays is necessary. Birthday parties fulfil children’s need to feel loved and included. Teenagers no longer need birthday parties, but need a budget of $50 for a special gift. Birthday budgets also cover gifts for children to bring when they attend their friends’ birthday parties, as it is not polite to go empty-handed, and children need to learn the importance of sharing and generosity.
FiNDiNGS

what people need in singapore: a household budgets study
44
Parents and young adult children need a budget for work-related social events such as Christmas parties and team outings, which are typically not sponsored by employers, but are crucial for team bonding and also building social networks for career progression.
All groups agreed that visiting parents or in-laws is necessary. A monthly budget of $20 for fortnightly visits covers gifts brought on such visits, usually snacks.
Monetary gifts during special occasions such as weddings, funerals and festive seasons is customary and a basic need. Single parents need a higher budget for this than partnered parents, highlighting their ‘dual role’ in the household. For example, single parents need $500 a year for red packets, snacks and decorations to celebrate festive seasons (e.g. Chinese New Year or Hari Raya) while the same amount is shared between partnered parents. Reflecting the difference in age, working-age parents’ budgets to attend funeral wakes are significantly lower than that for older people.
Donations and contributionsParticipants agreed that donating or giving alms to religious institutions has to be cultivated early in life as a way to contribute to one’s community. Donations to places of worship are therefore also included in children’s budgets.
TransportThe transport budgets include concession passes as well as taxi or private hire car expenses for rainy weather, family outings, running errands, ferrying children, longer distance commutes and in case of emergencies. Partnered parents need two taxi trips a month for family outings or errands. Single parents also need two taxi trips per month as they are “always rushing and do not have partners to help out”. Children below 2 years old require additional taxi trips because they may be difficult to manage on public transport. Older children 7–18 years old need taxi rides in case they are late for school activities
or tuition and in emergencies. Youths aged 19–25 need taxi trips for emergencies, errands and getting home from late-night gatherings with friends.
Insurance and healthcareParents underscored the need to stay healthy not just for themselves, but for their children. They expressed worries and anxieties about children’s well-being if they should fall into ill health. Single parents, in particular, said that a basic life
FiNDiNGS
Parents underscored the need to stay healthy not just for themselves, but for their children. Single parents, in particular, said that a basic life insurance plan for themselves offers financial protection for their children in the unfortunate event that they should be incapacitated or pass away while their children are still dependent on them.

what people need in singapore: a household budgets study
45
insurance plan for themselves offers financial protection for their children in the unfortunate event that they should be incapacitated or if they should pass away while their children are still dependent on them. Similarly, groups said basic travel insurance plans are needed for overseas family trips, to mitigate unforeseen expenses due to illnesses, itinerary changes or travel mishaps.
Participants agreed that the recommended vaccinations in the National Adult immunisation Schedule represent basic health needs, because they provide protection against diseases. Similarly, parents agreed that all the vaccinations for children as recommended in the National Childhood immunisation Schedule, provided free-of-charge, are necessary. Health screenings for school-going children are provided free under the School Health Service, but budgets are required for parents’ health screenings for obesity, high blood pressure, diabetes and cancer. These are based on the rates charged at CHAS GP clinics, for eligible Singaporeans and green CHAS cardholders.
Other than budgeting for preventive health services, parents talked about the importance of a budget for Accident and Emergency (A&E) consultations, especially
for infants below 2 years old because GPs are unable to provide treatment for them. For most illnesses, participants said they would visit polyclinics. But they included a budget for after-hours medical visits to private GP clinics when polyclinics are closed. They said that first-time mothers often face difficulties in breastfeeding and agreed that help from a lactation consultation for their first-born is necessary and beneficial. Parents also said that it is fairly common for newborns to require jaundice treatment and this cost should be included in the budget.
School-going children receive free dental care but a budget for general dental checks, descaling and polishing are included for all parents and young adults. Parents and young adults further included a budget for dental emergencies and wisdom tooth extractions.
Education and careGroups were especially animated when it came to discussing children’s care and educational needs.
The arrival of a child in a family changes parents’ lifestyles and schedules significantly. Professional infant care services are needed when mothers return to work after maternity leave. Parents agreed that early childhood is a critical phase in children’s lives and there is a need for childcare centres where
FiNDiNGS

what people need in singapore: a household budgets study
46
children can learn and play. The costs of infant care and childcare services are based on rates charged by anchor operators, assuming the availability of subsidies for working mothers.3 Parents also included additional costs for outings, additional lessons and graduation. Although it is not compulsory for parents to enroll their children in these activities offered by childcare centres, parents agreed it is a basic need for children to join in some activities because their peers do.
As children enter primary schools, the budget for after-school services and educational support becomes more critical. Parents need budgets for in-school student care services for primary school children, during school days as well as during school holidays.
For both primary and secondary school children, a significant budget is needed for small-group tuition (i.e. fewer than 10 students per class) and enrichment classes. Primary school children, for example, need weekly lessons for two subjects, in small groups of fewer than 10 students per class. Parents also included a budget for assessment books. There was little contention among parents that these were necessary. They talked about these practices as norms and expressed anxieties about children not performing well in a competitive academic environment. Without tuition classes, parents said that children’s academic results would suffer. They mentioned that children themselves often ask for additional learning support.
Parents said non-academic activities have become increasingly important too. They talked about the competitive nature of Co-curricular Activities (CCAs) in schools and the increasing prevalence of auditions or trials in order to join these. Additional budgets are frequently required for sports equipment, uniforms, costumes, excursions, camps, musical instruments or overseas trips.Although some of these expenses are optional, parents shared stories of how their children worried about affecting their CCA teams’ performance if they did not have the required equipment or opportunity to practice on their own outside of CCA hours.
Both parents and young adults themselves emphasised the importance of educational qualifications in Singapore. They said that obtaining at least a university degree in a general discipline has now become a need rather than an aspiration because this is the minimum requirement for many
FiNDiNGS
3 The Anchor Operator Scheme (AOP) is a government funding scheme for selected preschool operators to increase access to affordable early childhood care and education, especially for children from lower-income backgrounds. The scheme started in 2009 and there are five preschools under the AOP at the time of this report (Early Childhood Development Agency, 2021a). Participants agreed that MIS budgets must allow parents the choice to work. This is reflected in budget sections such as clothing (i.e. formal wear), transport (i.e. daily commutes) and food (i.e. eating out). Higher infant care and childcare subsidies are available for working mothers compared to mothers who are not working. The MIS budgets are calculated based on the higher tier of subsidies.

what people need in singapore: a household budgets study
47
jobs in Singapore. A university degree provides more varied job choices and stable career opportunities. Even with a degree, young adults stressed the expectation that they will need to continue pursuing professional qualifications and certifications during their working life to gain new skills and keep up with changes in work demands.
To place MiS budgets in context, we next compare them to expenditure data, work incomes, and public schemes.
FiNDiNGS
The costs of housing in the budgets are derived by combining four elements: (i) broad assumptions about housing choices reflecting the most common housing arrangements in Singapore; (ii) three distinct housing trajectories for single and partnered parents that align with housing policies for different household types; (iii) space standards decided by participants; and (iv) actual housing prices in recent years.
Housing ownershipWe assume that people purchase public housing—also known as HDB flats—as long as they are eligible. This is common practice in Singapore, where more than 80% of residents live in public housing, among whom more than 90% are owner occupiers (HDB, 2020). Furthermore, housing policies strongly encourage homeownership (Ng, 2020). For people with less financial means, the primary alternative is a limited stock of subsidised public rental flats (i.e. social housing) that offers only studio or 1-bedroom flats under stringent eligibility criteria. Owing to problems with availability, accessibility and quality, public renting is not considered acceptable as a basic housing option. It was not mentioned at all by participants.
Housing trajectoriesPublic housing policies discriminate between different types of households based on partnership history. In
Calculating housing costs
the eyes of the Singapore state and for purposes of eligibility for public goods such as housing, non-married persons are categorised as divorced, widowed or “never-married”. So a household made up of (i) a married couple or (ii) a widowed or divorced parent living with their children is regarded as a “family nucleus”, and adults from such households are allowed to purchase a HDB flat from 21 years old. But a single parent who has never been married is only eligible to buy a flat from 35 years old; as far as eligibility rules are concerned, these single parents are treated like other single adults with no children. They and their children are not recognised as a family unit.
There is a further distinction between new and resale flats. When construction is completed, the first transaction of a new flat is always from the state to a household. These new flats—also known as Build-To-Order (BTO) flats—are sold at a subsidised rate. After a minimum occupancy period, they may then be resold on the open housing market according to market rates. From the second transaction onwards, these are known as resale flats and are usually more expensive than new
Public housing policies discriminate between different types of households based on partnership history.
what people need in singapore: a household budgets study
48
FiNDiNGS
flats. Whereas (i) married couples and (ii) widowed or divorced parents with children are eligible to buy new and resale flats with no restrictions, single adults including single parents who have never been married are only allowed to purchase new 1-bedroom flats in non-mature estates (i.e. in more remote locations), or resale flats if they need more space or would like a more accessible location. In practical terms, this discrimination by partnership history imposes a financial penalty on single parents who are “never-married”.4
The three housing trajectories adopted in the budget calculations are:
• Partnered parents purchase a new flat at 26 years old;
• Single parents who are widowed or divorced purchase a new flat at 26 years old; and
• Single parents who are “never-married” rent a flat from the open market (i.e. not subsidised public rental housing) from 26 to 34 years old, then purchase a resale flat at 35 years old.
All three pathways start at 26 years old because the oldest age category for children in our study is 19–25 years old. We assume that all households will sell their flats at 55 years old and move into a 2-room Flexi flat, so as to be consistent with the calculation of housing costs for older people (see Ng et al., 2019, pp. 52-54, for details).
Housing sizeWe conducted a special focus group to gather views on space needs. Participants were highly aware of space constraints in contemporary Singapore and the limitations posed by high property prices. They
nonetheless spoke of children’s needs for their own space to study, to rest and play, and for privacy. In the end, they decided on a set of principles regarding the number of bedrooms required for different households
depending on the number and sex of the children. While no references to international examples were introduced during the focus groups, these principles turned out to be similar to space standards in housing policies elsewhere (Canada Mortgage and Housing Corporation, 2019; Department for Communities and Local Government, United Kingdom, 2015):
• Parents need their own bedroom.
• No more than two children may share a bedroom because rooms in public housing are too small to accommodate three persons.
• Two children may share a bedroom if they are the same sex, regardless of age.
• A boy and a girl may only share a bedroom when they are younger, and not after they reach puberty.
• Families are unlikely to wait till the children are grown up to move to a bigger flat with an additional bedroom. When they first buy a flat, they will choose one with the number of bedrooms the children will need when older.
Based on these principles, the flat sizes assumed for households with up to three children are as indicated in Table 4.
In practical terms, this discrimination by partnership history imposes a financial penalty on single parents who are “never-married”.
4 Housing costs is the only component of the single parent household’s budget that is affected by partnership history. The single parent’s basic needs do not vary because of past marital experience, but the costs of meeting these needs do in this case because of housing policies.

what people need in singapore: a household budgets study
49
Housing costs for partnered parents and single parents who are widowed or divorcedIn the first two housing trajectories, housing costs take into account the following:
a) The basic cost is the price of the flat and additional fees (i.e. lease stamp fee, stamp duty for mortgage deed, conveyancing fee, survey fee, lease registration fee and mortgage registration fee). Prices for new flats are based on the average of the upper limits of price ranges across all batches of new flats launched in non-mature towns from 2018 to 2020.5 Although non-mature towns are further from the city, housing in these areas is cheaper and considered adequate for basic needs. Taking the upper limit of price ranges allows some choice of location within these areas.
b) 25-year mortgages for the maximum allowed amounts, about 90% of the flat price, at 2.6% interest are assumed. Mortgage payments are derived from the HDB’s online calculator (HDB, 2021a).
c) A housing grant is available when purchasing a new flat. The amount is graduated according to the flat buyer’s income. The calculations here are based on the assumption that the parent(s) are working and receiving the median work income in 2020.
d) A cash top-up is required to pay the remaining sum at the point of purchase after deducting (b) the mortgage and (c) the housing grant from (a) the flat price and fees.
Monthly housing costs in the budget are the sum of the (b) mortgage payments and (d) cash top-up, recalculated so they are evenly spread over 29 years—from 26 to 54 years old. The assumption that the flat is sold by 55-year-olds recognises that it retains financial value, unlike many other items in the budget. However, this value is a form of wealth and possible source of income, and so is not reflected in the MIS budget which captures costs and expenditures.
FiNDiNGS
Number of children Total number of bedrooms HDB flat type1
One child: boy or girl Two bedrooms: one for the parent(s), one for the child 3-room
Two children: both boys or both girls Two bedrooms: one for the parent(s), one for the children 3-room
Two children: one boy and one girl Three bedrooms: one for the parent(s), one for the son, one for the daughter
4-room
Three children: one boy and two girls; or two boys and one girl
Three bedrooms: one for the parent(s), one for the son(s), one for the daughter(s)
4-room
Three children: three boys or three girls Three bedrooms: one for the parent(s), one for the first two children, one for the third child
4-room
1 In HDB’s terminology, flats with two bedrooms are known as “3-room flats” while flats with three bedrooms are known as “4-room flats”.
Table 4 Assumed flat sizes based on number and sex of children
5 Prices are obtained from HDB’s statements accompanying each launch (HDB, 2018a, 2018b, 2018c, 2018d, 2019a, 2019b, 2019c, 2019d, 2020b, 2020c, 2020d).
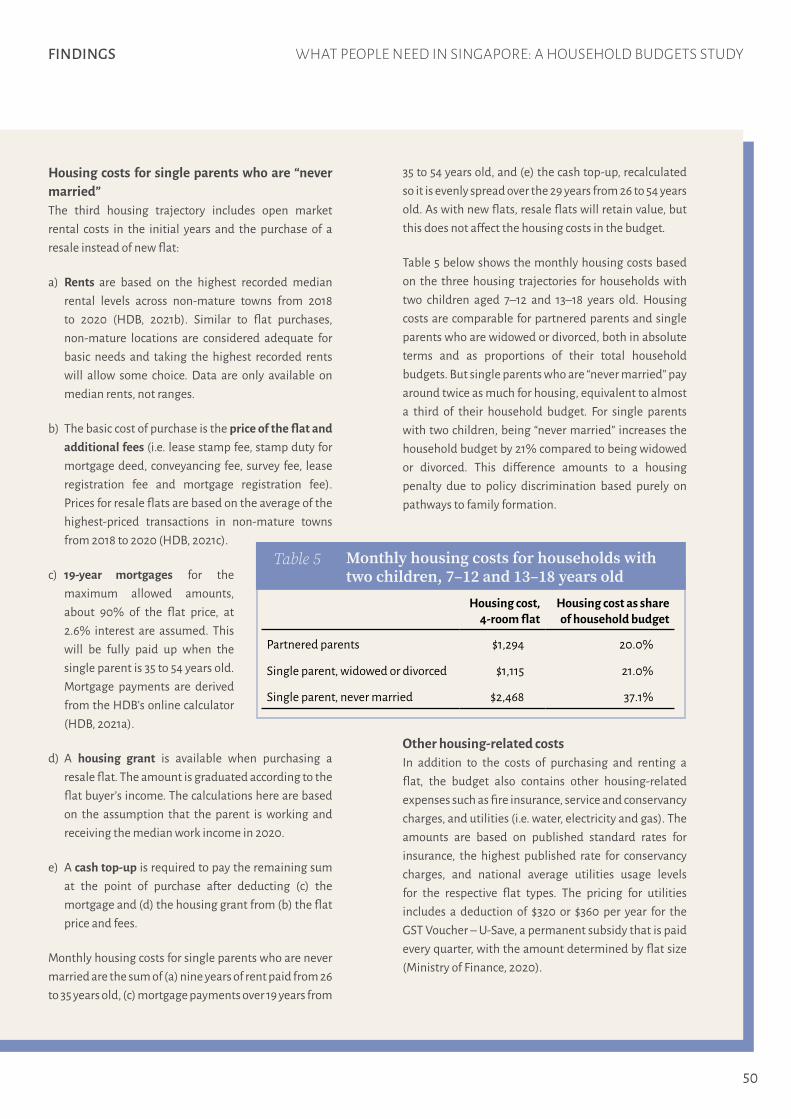
what people need in singapore: a household budgets study
50
FiNDiNGS
Housing costs for single parents who are “never married”The third housing trajectory includes open market rental costs in the initial years and the purchase of a resale instead of new flat:
a) Rents are based on the highest recorded median rental levels across non-mature towns from 2018 to 2020 (HDB, 2021b). Similar to flat purchases, non-mature locations are considered adequate for basic needs and taking the highest recorded rents will allow some choice. Data are only available on median rents, not ranges.
b) The basic cost of purchase is the price of the flat and additional fees (i.e. lease stamp fee, stamp duty for mortgage deed, conveyancing fee, survey fee, lease registration fee and mortgage registration fee). Prices for resale flats are based on the average of the highest-priced transactions in non-mature towns from 2018 to 2020 (HDB, 2021c).
c) 19-year mortgages for the maximum allowed amounts, about 90% of the flat price, at 2.6% interest are assumed. This will be fully paid up when the single parent is 35 to 54 years old. Mortgage payments are derived from the HDB’s online calculator (HDB, 2021a).
d) A housing grant is available when purchasing a resale flat. The amount is graduated according to the flat buyer’s income. The calculations here are based on the assumption that the parent is working and receiving the median work income in 2020.
e) A cash top-up is required to pay the remaining sum at the point of purchase after deducting (c) the mortgage and (d) the housing grant from (b) the flat price and fees.
Monthly housing costs for single parents who are never married are the sum of (a) nine years of rent paid from 26 to 35 years old, (c) mortgage payments over 19 years from
35 to 54 years old, and (e) the cash top-up, recalculated so it is evenly spread over the 29 years from 26 to 54 years old. As with new flats, resale flats will retain value, but this does not affect the housing costs in the budget.
Table 5 below shows the monthly housing costs based on the three housing trajectories for households with two children aged 7–12 and 13–18 years old. Housing costs are comparable for partnered parents and single parents who are widowed or divorced, both in absolute terms and as proportions of their total household budgets. But single parents who are “never married” pay around twice as much for housing, equivalent to almost a third of their household budget. For single parents with two children, being “never married” increases the household budget by 21% compared to being widowed or divorced. This difference amounts to a housing penalty due to policy discrimination based purely on pathways to family formation.
Other housing-related costsIn addition to the costs of purchasing and renting a flat, the budget also contains other housing-related expenses such as fire insurance, service and conservancy charges, and utilities (i.e. water, electricity and gas). The amounts are based on published standard rates for insurance, the highest published rate for conservancy charges, and national average utilities usage levels for the respective flat types. The pricing for utilities includes a deduction of $320 or $360 per year for the GST Voucher – U-Save, a permanent subsidy that is paid every quarter, with the amount determined by flat size (Ministry of Finance, 2020).
Housing cost, 4-room flat
Housing cost as share of household budget
Partnered parents $1,294 20.0%
Single parent, widowed or divorced $1,115 21.0%
Single parent, never married $2,468 37.1%
Table 5 Monthly housing costs for households with two children, 7–12 and 13–18 years old

what people need in singapore: a household budgets study
51
FiNDiNGS
How the budgets compare to expenditure dataPublished data from Singapore’s Household Expenditure Survey in 2017/18 allow comparisons between household budgets constructed through our research and actual expenditure patterns (Table 6; Department of Statistics Singapore, 2019). in the general population, the largest household expenditures are for housing and utilities (24.1%); food (20.3%); transport (13.2%); and miscellaneous goods and services (11.5%) which consist of personal care, insurance and social support services such as childcare. There are distinct patterns across income groups. For households with lower incomes, larger proportions of spending go towards essential items such as food, health and communication. The higher income groups have larger shares of spending on items with higher income elasticities, such as transport (i.e. personal vehicles), recreation and personal care.
Table 6 Composition of actual household expenditures in Singapore and MIS budgets
Household expenditure by income quintile group, %1 MIS budgets, %
1st 3rd 5th All Single2 Partnered3 Elderly4
Food and non-alcoholic beverages 9.5 7.5 4.5 6.6 6.8 7.0 14.6
Food serving services 12.5 14.6 12.5 13.7 11.0 16.1 14.6
Clothing and footwear 1.4 2.1 2.2 2.1 3.0 3.7 3.9
Transport 8.3 13.0 15.6 13.2 5.2 9.0 8.0
Housing and utilities 29.7 22.1 24.6 24.1 26.7 23.8 18.4
Furnishings, equipment, maintenance
5.0 4.6 5.0 4.8 7.4 4.0 6.5
Health 7.8 5.7 4.8 5.5 5.7 4.7 5.9
Communication 5.0 4.6 2.9 4.1 2.0 2.2 2.0
Educational services 5.4 5.9 5.6 5.7 15.6 8.9 0.0
Recreation and culture 4.1 6.3 7.5 6.4 10.8 10.1 19.7
Miscellaneous goods and services 9.1 11.4 12.5 11.5 5.8 10.6 6.3
Others 2.3 2.4 2.4 2.3 0.0 0.0 0.0
Total 100 100 100 100 100 100 100
1 Expenditure figures from Department of Statistics (2019)2 Single parent with one child, 2–6 years old3 Partnered parents with two children, 7–12 and 13–18 years old4 Single elderly person

what people need in singapore: a household budgets study
52
FiNDiNGS
The overall compositions of the single and partnered parents’ MiS budgets are very similar to Singapore households’ actual expenditures. As proportions of the totals, the budgets mostly do not vary from actual expenditures by more than three percentage points across item categories.
There are, however, a few exceptions:
• The transport budgets are much lower than actual expenditures, especially the transport expenditures of the highest income quintile, as vehicle ownership and related costs are not part of MiS budgets.
• For educational services, the budget shares are higher than expenditures—8.9% for partnered parent households and 15.6% for single parent households compared to 5.7% of actual total expenditures. This is expected, as the expenditure figures are for the general population, including households that do not have children and therefore incur little or no educational expenses.
• Recreation and culture also account for larger proportions of MiS budgets compared to expenditures. This reflects how MIS budgets—which capture people’s views about basic needs—are different from what people actually spend depending on their means. The gap between the budgets and the expenditures are likely a measure of the extent to which needs for recreation are not met, especially among households in the lowest income quintile group for whom recreation occupies a smaller proportion of expenditure compared to households with higher incomes.
How the budgets compare to work incomes The MiS budgets for a single parent with one child (2–6 years old), partnered parents with two children (7–12 and 13–18 years old), and a single elderly person can be compared with national work income data to illustrate how workers are faring relative to the needs of these indicative household types. For these comparisons, we assume that the single parent is the sole earner and that both parents in the partnered parent household are working.
As the budget for the partnered parent household (with two earners) is almost exactly twice that of the single parent household (with one earner), the budget amount allocated to each adult earner (i.e. the amount that each adult is ‘responsible for’) in these two households is about the same, at around $3,200.

what people need in singapore: a household budgets study
53
FiNDiNGS
Among full-time employed residents in Singapore aged 15 years and above in 2020 (Ministry of Manpower, 2021), the median earner’s work income of $4,534 (including employer CPF contributions) is around 40% more than what is required for a basic standard of living for the single parent with one child, or the partnered parents with two children.
Taking household size into account, the budgets required for the single and partnered parent households are both around $1,600 per household member (i.e. $3,218 for two persons and $6,426 for four persons). Among employed households
in Singapore in 2020, the average work income (including employer CPF contributions) per household member was $1,609 for the third decile group (i.e. 21st to 30th percentile; Department of Statistics, 2021a). in other words, around 30% of all working households earn less than the amount required for these two types of households to meet their basic needs. Figure 5 shows this comparison.
Around 30% of all working households earn less than the amount required for these two types of households to meet their basic needs.
Figure 5 National average monthly work income per household member by decile groups compared to MIS budgets for single and partnered parents
$12,000
$14,000
D1 D6D2 D7D3 D8D4 D9D5 D10
$8,000
$10,000
$6,000
$4,000
$2,000
$0
Note: This graph compares actual monthly work incomes (including employer CPF contributions) per household member in Singapore (Department of Statistics, 2021a), with the MIS budget allocated to each member of the two households under analysis. The MIS budget for the single parent with one child ($3,218) is divided between two persons ($1,609 each), while the MIS budget for the partnered parents with two children ($6,426) is divided by four ($1,606 each). A single line indicates the two MIS budgets as they are too close to differentiate visually at this scale.
MIS budgets
Income decile group

what people need in singapore: a household budgets study
54
FiNDiNGS
There are stark inequalities in the adequacy of work incomes across groups on the basis of age, education, occupation, type of work and type of housing (Department of Statistics, 2021a; Ministry of Manpower, 2021a).
The median work incomes for full-time workers aged 25 to 54 years old are well above the budgets for the single and partnered parent households (Figure 6). For workers aged 55–59 years old, median work income is just enough, exceeding the two MiS budgets by 9%. Outside of these age bands, work incomes for the youngest (below 25 years old) and oldest (60 years old and above) workers fall short of the budgets.
There are stark inequalities in the adequacy of work incomes across groups on the basis of age, education, occupation, type of work and type of housing.
Figure 6 National median monthly work income of full-time workers by age groups compared to MIS budgets for single and partnered parents
$6,000
$7,000
15–19 40–4420–24 45–4925–29 50–5430–34 55–5935–39 60 and over
$4,000
$5,000
$3,000
$2,000
$1,000
$0
Note: This graph compares actual median monthly work incomes (including employer CPF contributions) of full-time workers in Singapore (Ministry of Manpower, 2021a), with the MIS budget allocated to each working adult in the two households under analysis. Assuming all adults are working full-time, the MIS budget for the single parent household ($3,218) is allocated to one person, while the MIS budget for the partnered parent household ($6,426) is allocated to two persons ($3,213 each). A single line indicates the two MIS budgets as they are too close to differentiate visually at this scale.
MIS budgets
Age group (Years)
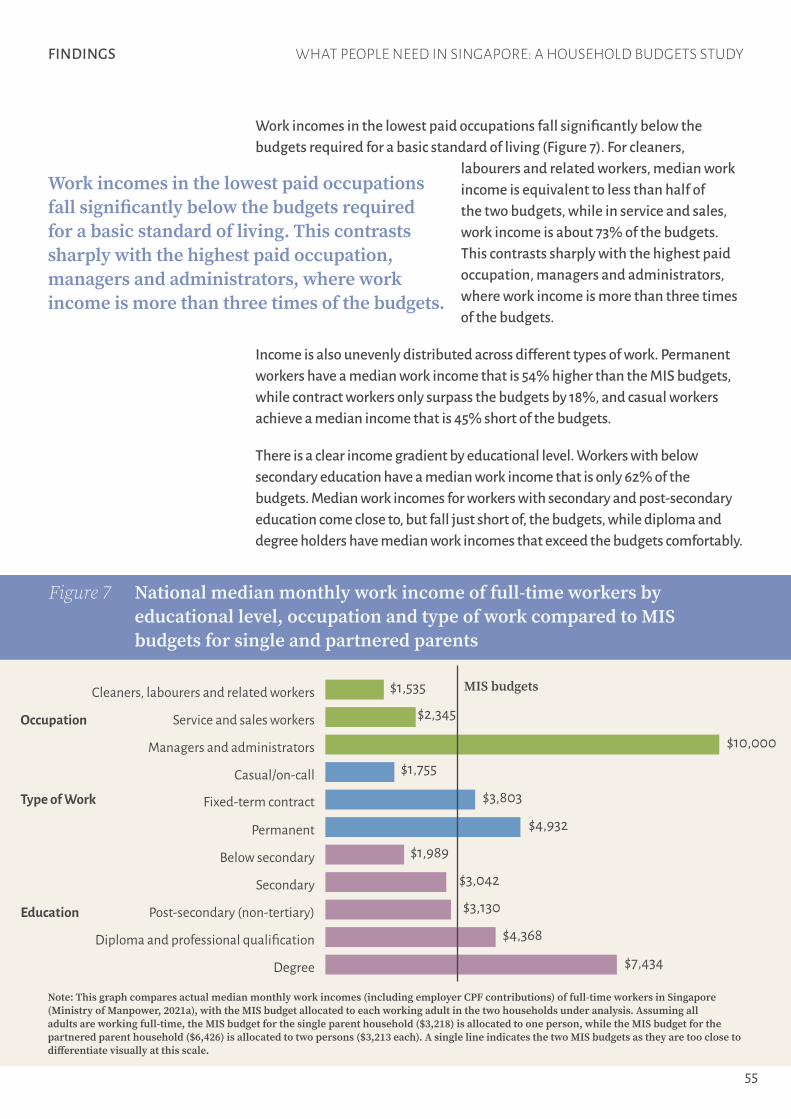
what people need in singapore: a household budgets study
55
Work incomes in the lowest paid occupations fall significantly below the budgets required for a basic standard of living (Figure 7). For cleaners,
labourers and related workers, median work income is equivalent to less than half of the two budgets, while in service and sales, work income is about 73% of the budgets. This contrasts sharply with the highest paid occupation, managers and administrators, where work income is more than three times of the budgets.
Income is also unevenly distributed across different types of work. Permanent workers have a median work income that is 54% higher than the MiS budgets, while contract workers only surpass the budgets by 18%, and casual workers achieve a median income that is 45% short of the budgets.
There is a clear income gradient by educational level. Workers with below secondary education have a median work income that is only 62% of the budgets. Median work incomes for workers with secondary and post-secondary education come close to, but fall just short of, the budgets, while diploma and degree holders have median work incomes that exceed the budgets comfortably.
FiNDiNGS
Work incomes in the lowest paid occupations fall significantly below the budgets required for a basic standard of living. This contrasts sharply with the highest paid occupation, managers and administrators, where work income is more than three times of the budgets.
Figure 7 National median monthly work income of full-time workers by educational level, occupation and type of work compared to MIS budgets for single and partnered parents
Cleaners, labourers and related workers
Occupation
Type of Work
Education
$1,535
Service and sales workers $2,345
$10,000Managers and administrators
Casual/on-call $1,755
Below secondary $1,989
Fixed-term contract $3,803
Diploma and professional qualification $4,368Post-secondary (non-tertiary) $3,130
Secondary $3,042
Permanent $4,932
Degree $7,434
Note: This graph compares actual median monthly work incomes (including employer CPF contributions) of full-time workers in Singapore (Ministry of Manpower, 2021a), with the MIS budget allocated to each working adult in the two households under analysis. Assuming all adults are working full-time, the MIS budget for the single parent household ($3,218) is allocated to one person, while the MIS budget for the partnered parent household ($6,426) is allocated to two persons ($3,213 each). A single line indicates the two MIS budgets as they are too close to differentiate visually at this scale.
MIS budgets

what people need in singapore: a household budgets study
56
FiNDiNGS
Among working households living in public housing, average work income per household member falls short of the budgets only for households living in 1- and 2-room HDB flats (Figure 8). For working households in larger flat types, average work incomes are higher than the budgets by 75% to 132%. For households living in private housing, work incomes exceed four times of the budgets.
Figure 8 National average monthly work income per household member by housing type compared to MIS budgets for single and partnered parents
$7,000
$8,000
HDB, 1- & 2- room flats
Landed properties
HDB, 3- room flats
HDB, 4- room flats
HDB, 5-room and executive
flats
Condominiums & other
apartments
$5,000
$6,000
$4,000
$3,000
$2,000
$1,000
$0
Note: This graph compares actual monthly work incomes (including employer CPF contributions) per household member in Singapore (Department of Statistics, 2021a), with the MIS budget allocated to each member of the two households under analysis. The MIS budget for the single parent with one child ($3,218) is divided between two persons ($1,609 each), while the MIS budget for the partnered parents with two children ($6,426) is divided by four ($1,606 each). A single line indicates the two MIS budgets as they are too close to differentiate visually at this scale.
MIS budgets
As older people earn much less than younger workers, it is more meaningful to compare the work incomes of people aged 60 and above with the single elderly person’s household budget (Figure 9).6 For this age group, the median work income of $2,330 in 2020 was 1.6 times of the MiS budget of $1,421 (Ministry of Manpower, 2021a).
However, there are still segments of vulnerability and obvious inequalities. in cleaning jobs, where many older workers are employed, the median
6 The Ministry of Manpower’s annual report on the labour force in Singapore does not report work incomes for persons aged 65 and above as a category.

what people need in singapore: a household budgets study
57
FiNDiNGS
work income falls just below the budget (99.7%), whereas managers and administrators earn 5.5 times of the budget. Older workers with the least education also fare poorly compared to their peers with university education, earning just 1.2 times of the budget compared to degree-holders’ income of 5.9 times of the budget.
Figure 9 National median monthly work income of full-time workers aged 60 years and above by occupation and educational level compared to MIS budget for a single elderly person
$2,330All 60 and over
Cleaners, labourers and related workers $1,417
Below secondary $1,654
Service and sales workers $1,861
Diploma and professional qualification $4,891Post-secondary (non-tertiary) $2,708
Secondary $2,688
Managers and administrators $7,860
Degree $8,439
Note: Work incomes include employer CPF contributions (Ministry of Manpower, 2021a).
MIS budget
Occupation
Education
There is a clear gender gap in work income across all categories: by occupation, education or nature of work (Figure 10; Ministry of Manpower, 2021a). Among full-time employed residents aged 15 and above in 2020, women’s median monthly work income was 7% lower than men’s. At these income levels, the male median earner receives 47% more than the MiS budgets required for the single parent and partnered parent households, while women achieve 36% more than the budgets.
in terms of occupational and educational categories, women earn less across all levels, with significant variation in the size of the income gap. For instance, women managers and administrators earn 3% less than men, while women working in service and sales earn 17% less. Across educational categories, women also consistently earn less, with the income gap ranging from 2%

what people need in singapore: a household budgets study
58
FiNDiNGS
among workers with secondary school qualifications to 25% among degree-holders. But relative to the household budgets, it is the type of occupation and level of education rather than gender that appear to more heavily determine whether work incomes are sufficient, due to very large income inequalities on these dimensions. For example, among workers with secondary and post-secondary education—the groups whose incomes fall closest to the budgets—both men and
women earn less than what is needed for a basic standard of living, although the gaps are larger for women.
Across educational categories, women consistently earn less. But relative to the household budgets, it is the type of occupation and level of education rather than gender that appear to more heavily determine whether work incomes are sufficient.
Figure 10 National median monthly work income of full-time workers by gender compared to MIS budgets for single and partnered parents
$12,000
All Below secondary
Cleaners, labourers,
related
SecondaryService, sales Post-secondary
(non-tertiary)
Plant, machine
operators, assemblers
Occupation Education
Diploma, professional
Managers, administrators
Degree
$8,000
$10,000
$6,000
$4,000
$2,000
$0
Note: This graph compares actual median monthly work incomes (including employer CPF) of full-time workers in Singapore (Ministry of Manpower, 2021a), with the MIS budget allocated to each working adult in the two households under analysis. Assuming all adults are working full-time, the MIS budget for the single parent household ($3,218) is allocated to one person, while the MIS budget for the partnered parent household ($6,426) is allocated to two persons ($3,213 each). A single line indicates the two MIS budgets as they are too close to differentiate visually at this scale.
WomenMen
MIS budgets

what people need in singapore: a household budgets study
59
How the budgets compare to public schemes As income benchmarks, the budgets can be compared to four broad categories of policies that address income security: (i) wage interventions; (ii) transfers and subsidies for children; (iii) retirement income protection; and (iv) cash transfers for low-income households.
The following discussion is not meant to provide an exhaustive directory of all possible public sources of income and support. Rather, its aim is to take stock of the adequacy of the key provisions in various policy domains, including the universal schemes and the most important means-tested programmes. Where subsidies for public services are applied universally and automatically, these are already deducted from the prices in the budgets. Schemes catering for people in specific situations, such as disability programmes and merit-based study awards, are less relevant to this analysis and have been left out. Again, the comparisons are with the budgets for a single parent with one child (2–6 years old), partnered parents with two children (7–12 and 13–18 years old), and a single elderly person.
Wage interventionsFor low-wage jobs, the two main policy interventions are the Progressive Wage Model (PWM) and the Workfare income Supplement (WiS). Under the PWM, employers are required to pay minimum wages that increase as workers acquire training and get promoted (Ministry of Manpower, 2021b). The PWM currently covers only three job sectors—cleaning, landscape and security—but will be progressively extended to more sectors and occupations in the coming years (Lee, 2021; Tripartite Workgroup on Lower-Wage Workers, 2021). in addition, the WiS provides cash payments to people 35 years old and above whose monthly work incomes are not more than $2,300 (Ministry of Manpower, 2020).
Table 7 shows the wage levels achievable through the PWM and WiS, in absolute terms and relative to the household budgets. WiS is issued as a mix of cash and CPF payments in the ratio of 40-60. Since CPF savings are an important way to finance housing, and MIS budgets include housing costs, the analysis here reflects the full amounts provided by WIS, including the 60% deposited directly into CPF accounts.
The three low-wage sectors covered by the PWM employ large numbers of older workers. The minimum wages under PWM in these sectors, combined with employer CPF contributions, are about equal to the MiS budget for a
FiNDiNGS

what people need in singapore: a household budgets study
60
FiNDiNGS
Table 7 Wage interventions compared to MIS budgets
Monthly amount, $Ratio to MIS budget
for single parent1
Ratio to MIS budget for partnered
parents2
Ratio to MIS budget for single elderly
person
Progressive Wage Model (PWM)3
Cleaning 1,370 – 1,739 0.5 0.5 1.0– 1.1
Security 1,505 – 1,638 0.5 0.5 1.1
Landscape 1,666 – 1,814 0.6 0.6 1.2
With Workfare income Supplement (WiS)4
Cleaning 1,699 – 1,947 0.5 – 0.6 0.5 – 0.6 1.2 – 1.4
Security 1,838 – 1,846 0.6 0.6 1.3
Landscape 1,979 – 2,009 0.6 0.6 1.4
1 Single parent with one child, 2–6 years old.2 Partnered parents with two children, 7–12 and 13–18 years old. For purposes of comparison with PWM wages, the household budget is
divided by two (i.e. between the two working adults).3 Includes employer CPF contributions on top of PWM wage levels (17% for workers below 55 years old, 7.5% for workers above 65 years old).
Based on Ministry of Manpower (2021b).4 Includes both cash and CPF components. The single and partnered parents are assumed to be aged 45–54 years old. The single elderly person
is aged 65 and above. Based on Ministry of Manpower (2020).
single elderly person. Adding the monthly WiS payout of $313–$333 will push the total amounts past the MiS budget by 20% to 39%.
Younger workers fare much more poorly. The PWM wage levels are 46–56% of the single and partnered parents’ budgets. The WiS payment of $195-$208 for this age range adds another 6% towards the budgets, for a total of around 60% of what the single and partnered parent households need for a basic standard of living. Current wage interventions are clearly inadequate for working-age households with children.
Current wage interventions are clearly inadequate for working-age households with children.
Transfers and subsidies for childrenHouseholds with children receive the Baby Bonus, a one-off transfer made up of a Cash Gift of $8,0007 and a First Step Grant of $3,000 deposited into a Child Development Account that can be used to pay for childcare, kindergarten and other approved fees and expenses (Ministry of Social and Family Development, 2021a). Since the stated policy intention of the Baby Bonus is to “defray the costs of raising a child”, we have divided the monetary value of the Cash Gift over 12 years—until the child completes primary school—for the purposes of comparison against the household budgets. The same is done for the First Step Grant, since the Child Development Account closes when the child turns 12.
7 The Baby Bonus Cash Gift is $8,000 for the first and second child, and $10,000 for the third and subsequent child.

what people need in singapore: a household budgets study
61
FiNDiNGS
As a lump sum payment, the Baby Bonus may be significant (Table 8). But spread over 12 years, even the Cash Gift—which is more than twice the First Step Grant—is equivalent to less than 2% of the monthly household budgets for the single and partnered parents.
Table 8 Transfers and subsidies for children compared to MIS budgets
Monthly amount, $Ratio to MIS budget
for single parent1
Ratio to MIS budget for partnered
parents2
Baby Bonus3
Baby Bonus Cash Gift 56 – 111 0.015 0.018
Baby Bonus Child Development Account (CDA) First Step Grant
21 – 42 0.006 0.007
infant care subsidy4
Subsidy amount 150 – 1,310 0.04 – 0.36 0.02 – 0.21
Income limit 12,000 3.3 1.9
Childcare subsidy4
Subsidy amount 150 – 767 0.05 – 0.24 0.02 – 0.12
Income limit 12,000 3.7 1.9
Student care subsidy5
Subsidy amount 59 – 290 0.02 – 0.08 0.01 – 0.05
Income limit 4,500 1.2 0.7
MOE Financial Assistance Scheme6
Subsidy amount 214 – 385 0.06 0.06
Income limit 2,750 – 2,760 0.74 0.43
Higher Education Community Bursary or Higher Education Bursary7
Subsidy amount 113 – 517 0.02 – 0.10 0.01 – 0.07
Income limit 9,000 1.8 1.2
1 For the ratios to be meaningful, the subsidy amounts and income limits for the various schemes are compared to MIS budgets for households with children in the relevant age categories. So Baby Bonus and infant care subsidy are compared to the budget for a single parent with one child aged below 2 ($3,627); childcare subsidy is compared to the budget for a single parent with one child aged 2–6 ($3,218); student care subsidy and the MOE Financial Assistance Scheme are compared to the budget for a single parent with one child aged 7–12 ($3,708); and Higher Education Community Bursary and Higher Education Bursary are compared to the budget for a single parent with one child aged 19–25 ($5,147).
2 The subsidy amounts and income limits for the Baby Bonus, infant care subsidy and childcare subsidy are compared to the MIS budget for partnered parents with two children aged below 2 and 2–6 ($6,167); student care subsidy and the MOE Financial Assistance Scheme are compared to the budget for partnered parents with two children aged 7–12 and 13–18 ($6,426); and Higher Education Community Bursary and Higher Education Bursary are compared to the budget for a single parent with two children aged 13–18 and 19–25 ($7,750).
3 The calculations here divide the lump sum transfers over 12 years. Based on Ministry of Social and Family Development (2021a).4 These subsidies include universal and means-tested tiers. Working mothers receive a higher amount of universal subsidy than non-working
mothers and are eligible for additional subsidies if they fall below the income limit. Based on Early Childhood Development Agency (2021b).5 Based on Ministry of Social and Family Development (2021b).6 Based on Ministry of Education (2021a).7 Based on Ministry of Education (2021b).

what people need in singapore: a household budgets study
62
FiNDiNGS
When calculating the costs of childcare in the household budgets, we assumed that the mother is working. For working mothers, higher care subsidies are available, including a means-tested component (Early Childhood Development Agency, 2021b). Both the income limits for means testing and amounts of support decrease for older children.
The current household income limit to qualify for higher infant care and childcare subsidies is fairly generous, at $12,000 per month, or 1.9 to 3.7 times of the partnered and single parents’ budgets. Below this ceiling, household incomes also determine the amount of subsidy, with those on lower incomes receiving more. Monthly subsidies for infant care are equivalent to 4–36% of the single parent’s budget and 2–21% of the partnered parents’ budget. Subsidies for childcare are slightly lower, equivalent to 5–24% of the single parent’s budget and 2–12% of the partnered parents’ budget.
Once the child reaches primary school age, the income limit tightens abruptly. To qualify for student care subsidies, monthly household incomes may not exceed $4,500 (Ministry of Social and Family Development, 2021b), equivalent to 1.2 times of the single parent’s budget but less than what the partnered parents need for a basic standard of living. Depending on their incomes, households may receive subsidies equivalent to 1–8% of the single and partnered parents’ budgets.
For children in primary and secondary school, the MOE Financial Assistance Scheme offers a fee waiver,
free textbooks and school uniforms, and subsidies for transport and meals if they pass a means test (Ministry of Education, 2021a). The household income limit is 43% of the partnered parents’ budget and the total value of assistance for two children (one each attending primary and secondary school) is $385 per month, or just 6% of the household budget.
Bursaries are available for university students from households with incomes up to $9,000 (or $2,250 per capita; Ministry of Education, 2021b), which exceeds the budgets for both the single and partnered parents’ households. Households with lower incomes receive larger bursaries. The range of bursary amounts is 1% to 10% of the budgets, comparable to the generosity of student care subsidies, but lower than the subsidies for younger children.
Once the child reaches primary school age, the income limit tightens abruptly. To qualify for student care subsidies, monthly household incomes may not exceed $4,500, equivalent to 1.2 times of the single parent’s budget but less than what the partnered parents need for a basic standard of living. Depending on their incomes, households may receive subsidies equivalent to 1–8% of the single and partnered parents’ budgets.
As a lump sum payment, the Baby Bonus may be significant. But spread over 12 years, even the Cash Gift—which is more than twice the First Step Grant—is equivalent to less than 2% of the monthly household budgets for the single and partnered parents.

what people need in singapore: a household budgets study
63
Under CPF rules, people who own housing must set aside a minimum amount of savings, known as the Basic Retirement Sum, at 55 years old, that will be converted to an annuity upon retirement at 65 (Central Provident Fund Board, 2021a). This is supposed to provide a basic level of income for retirees. Those who wish to receive higher payments in their retirement may set aside twice
as much savings at 55 years old, known as the Full Retirement Sum. Theoretically, the Basic Retirement Sum will be converted to a monthly income stream of around $800 in retirement, or 56% of the household budget for a single elderly person. With the Full Retirement Sum, this CPF income almost doubles, to around the same as the household budget.
However, in 2020, among the 40,000 persons turning 55 years old who were active CPF members (i.e. who
FiNDiNGS
Table 9 Retirement income protection compared to MIS budget
Monthly amount, $Ratio to MIS budget for
single elderly household
If retired, with CPF income1
CPF, Basic Retirement Sum 770 – 830 0.5 – 0.6
CPF, Full Retirement Sum 1,430 – 1,530 1.0 – 1.1
If retired, low-income
Comcare Long-Term Assistance2
Payment 600 0.4
Income limit Unable to work -
Silver Support Scheme3
Payment 150 – 300 0.1 - 0.2
Income limit 1,800 1.3
In 2020, among the 40,000 persons turning 55 years old who were active CPF members, only 64% had enough savings to fulfil the Basic Retirement Sum. About one third of active CPF members and others who were not active members would not receive even the basic payment of around $800 per month.
1 Based on Central Provident Fund Board (2021a).2 Based on Ministry of Social and Family Development (2021c).3 Based on Ministry of Manpower (2021c).
Retirement income protectionA range of government income measures cater for older people who are retired with Central Provident Fund (CPF) incomes or with low incomes (Table 9). While these schemes are available, they do not cover all older people. Coverage depends on many factors such as an individual’s work history and qualification through means tests.

what people need in singapore: a household budgets study
64
FiNDiNGS
Cash transfers for low-income householdsFor low-income households in general, the two main cash transfer schemes are GST Voucher – Cash and ComCare Short-to-Medium-Term Assistance (SMTA; Table 10; Ministry of Finance, 2021; Ministry of Social and Family Development, 2021d). Both are means-tested and offer limited assistance. To qualify for GST Voucher – Cash, among other criteria, individual annual income must not exceed $28,000, equivalent to 1.6 times of the single elderly person’s household budget but just 73% of the single and partnered parents’ budgets. Persons who qualify receive $25 per month, less than 2% of the single elderly person’s household budget and below 1% for the working-age parents.
had received employer CPF contributions in the past three months), only 64% had enough savings to fulfil the Basic Retirement Sum (Central Provident Fund Board, 2021b). in other words, about one third of active CPF members as well as others in that cohort who were not active CPF members, will not receive even the basic payment of around $800 per month. in fact, in 2018, the CPF paid an average of $450 per month to persons aged 65 to 69 years old, $290 to those aged 70 to 79 years old, and just $220 to those aged 80 to 87 years old (Ministry of Manpower, 2019a). There are also inequalities among older people. Women and older people living in smaller flat types are less likely to meet the Basic Retirement Sum (Ministry of Manpower, 2019b).
For persons who have retired and are low-income, ComCare Long-Term Assistance and the Silver Support Scheme are the main channels of financial assistance (Ministry of Manpower, 2021c; Ministry of Social and Family Development, 2021c). Both are means-tested. ComCare requires older people to submit applications. it pays $600, equivalent to 42% of what single elderly persons need for a basic standard of living. it is also a stringent scheme that applies means testing not just to elderly applicants but also their children. The published eligibility criteria include income limits for applicants’ adult children, regardless of actual living and income-sharing arrangements. As a result, coverage is negligible. Between 2017 and 2019, the percentage of the population aged 65 and above who received assistance from ComCare fell from just 0.90% to 0.75% (Department of Statistics, 2020b; Ministry of Social and Family Development, 2020).
The Silver Support Scheme has wider coverage but offers less generous assistance. it is automatically means-tested using administrative data and aims to cover up to half of retiree households (Shanmugaratnam, 2012). The current income limit is $1,800, around 27% more than the single elderly person’s household budget. However, depending on income, an elderly person living in a 2-room HDB flat (as assumed in the household budget) may receive just 11–21% of the household budget.

what people need in singapore: a household budgets study
65
FiNDiNGS
Table 10 Cash transfers for low-income households compared to MIS budgets
Monthly amount, $
Ratio to budget for single parent1
Ratio to budget for partnered
parents2
Ratio to MIS budget for single
elderly person
GST Voucher – Cash3
Payment 25 0.008 0.008a 0.018
Income limit 2,333 0.7 0.7 1.6
ComCare Short-to-Medium-Term Assistance4
Payment 500 0.16 0.08 -b
Income limit 1,900 – 2,600 0.59 0.40 -
1 Single parent with one child, 2–6 years old.2 Partnered parents with two children, 7–12 and 13–18 years old.3 Based on Ministry of Finance (2021). 4 Based on Ministry of Social and Family Development (2021d).a GST Voucher – Cash is issued to individuals instead of households. The partnered parents’ household budget is therefore divided by two (i.e.
between the two adults) for comparison with the payment amount.b ComCare Short-to-Medium-Term Assistance is generally targeted at working-age people who are temporarily unable to work, while ComCare
Long-Term Assistance (discussed earlier) caters for elderly people.
How households fare compared to MIS budgetsAn indicative picture of the adequacy of total household incomes currently attainable under the major public policies may be derived by starting with certain assumed levels of wages, deducting income and property taxes, and adding benefits from the public schemes outlined above. Here, calculations are done for the actual median wage among all workers in 2020, as well as low-
ComCare Short-to-Medium-Term Assistance is similarly ungenerous. The monthly income limit to qualify for help is $1,900 per household or $650 per capita, equivalent to 59% and 40% of the single and partnered parents’ household budgets. The rates of assistance are not formally disclosed. But in 2021,
in response to a parliamentary question, it was disclosed that the median amount of assistance per household was $500, just 8–16% of the household budgets (Ministry of Social and Family Development, 2021e).
in the context of what households need for a basic standard of living, the impact of both schemes appears to be limited.
In the context of what households need for a basic standard of living, the impact of GST Voucher – Cash and ComCare Short-to-Medium-Term Assistance appears to be limited.

what people need in singapore: a household budgets study
66
wage scenarios under the PWM. The focus is again on two household types: a single parent with one child aged 2–6 years old, and partnered parents with two children aged 7–12 and 13–18 years old.
Tables 11a and 11b show the findings. At these wage levels, no income taxes are payable. Only property taxes according to the assumed flat types—3-room HDB flat for the single parent household and 4-room HDB flat for the partnered parent household—are due. The transfers include the Workfare income Supplement, Baby Bonus, childcare and student care subsidies, MOE Financial Assistance, GST Voucher – Cash and ComCare SMTA, wherever the households qualify based on published eligibility rules.
FiNDiNGS
Table 11a Household income for single parent with one child, 2–6 years old
Monthly amounts, $Median in
2020
PWM cleaning
(min)
PWM cleaning
(max)PWM
securityPWM
landscape
Work income (single earner)1 4,534 1,491 1,739 1,638 1,814
Taxes 32 32 32 32 32
Transfers 516 1,276 1,276 1,276 1,263
Income after taxes and transfers 5,018 2,735 2,983 2,882 3,045
MIS budget 3,218 3,218 3,218 3,218 3,218
Difference between income and MIS budget
56% -15% -7% -10% -5%
1 Includes employer CPF contributions (17% for workers aged 55 and below). PWM wage levels are based on Ministry of Manpower (2021b). See text for details.
Table 11b Household income for partnered parents with two children, 7–12 and 13–18 years old
Monthly amounts, $Median in
2020
PWM cleaning
(min)
PWM cleaning
(max)PWM
securityPWM
landscape
Work income (two earners)1 9,068 2,981 3,477 3,276 3,627
Taxes 50 50 50 50 50
Transfers 76 1,663 719 749 664
Income after taxes and transfers 9,094 4,594 4,416 3,975 4,241
MIS budget 6,426 6,426 6,426 6,426 6,426
Difference between income and MIS budget
42% -29% -35% -38% -34%
1 Includes employer CPF contributions (17% for workers aged 55 and below). PWM wage levels are based on Ministry of Manpower (2021b). See text for details.

what people need in singapore: a household budgets study
67
FiNDiNGS
A living wage that households needThe notion that work should pay a living wage has a long history and broad social appeal (Anker, 2011). It is a level of wage that affords workers a decent standard of living, relative to contemporary norms in their society. A living wage focuses solely on the costs of meeting basic needs, making it different from a minimum wage, which normally aims to boost the incomes of the lowest-paid workers without adversely affecting employment levels. In places where both standards exist, the living wage is usually voluntary, whereas the minimum wage is statutory.
in Singapore, despite the persistence of low-paid work, proposals for a minimum wage have encountered policy resistance in the past (Yuen, 2020). However, as mentioned, a mandatory minimum pay for workers in selected sectors has in fact existed since 2012, even if the policy is named the Progressive (rather than minimum) Wage Model. This year, policymakers announced that the PWM will be extended to more sectors and occupations in the next few years (Lee, 2021), with a goal to incrementally bring low-wage workers closer to the median wage (Ministry of Manpower, 2021d; Tripartite Workgroup on Lower-Wage Workers, 2021). They have even hinted at the
if the parents are all working and receiving the median wage, the single parent household will exceed their MiS budget by 56% while the partnered parent household will receive 42% more than their MiS budget.
However, the situation is far less favourable for households that depend on wages at PWM levels. The total transfers that single parents receive are substantial relative to their wages. But even so, single parent households with one child aged 2–6 years old fall below the MiS budget by 5% to 15%.
For partnered parent households with two children aged 7–12 and 13–18 years old, the gap is even larger—their household income will be 29% to 38% short of the MiS budget, depending on the sector of work. Considering this shortfall, it is striking that if the two parents are both working in the landscape, security and cleaning
(conservancy) sectors, partnered parent households will not pass the means test for ComCare SMTA. The combined wage protection and benefits regime does not currently meet the basic needs of working-age households with children that are dependent on low-wage work.
The combined wage protection and benefits regime does not currently meet the basic needs of working-age households with children that are dependent on low-wage work.

what people need in singapore: a household budgets study
68
FiNDiNGS
possibility of introducing a minimum wage (Tan, 2021). This is an apt moment to consider what a decent and adequate wage for workers might look like.
Although there are many variations in the way living wages are calculated internationally, the core method has three steps (Anker, 2011; D’Arcy & Finch, 2016):
• The first step is to define what standard of living the living wage should enable and what this will cost. Different approaches may vary in terms of how far they draw on experts or public consensus to establish the definition and costs.
• The second step is to decide what types of households to take into account and the assumptions about their working patterns. in some instances, living wages are based on the needs of a few stylised, or the most common, household types. in other cases, calculations consider a wider range of household types and their distribution among the population. The assumed number of working persons in the household and their total work hours affect the amount of wages that each hour of work must generate in order to cover household costs. The lower the assumed amount of work, the higher the hourly wage rate needs to be.
• Finally, decisions must be made about what policies (i.e. taxes and benefits) to incorporate, how and how often to update these rates, and whether to allow variations across geographical regions that have different costs of living.
For example, in the UK, the standard and costs of living associated with the living wage are based on the UK MiS study (Hirsch, 2017). A weighted average of the MiS budgets for selected types of households is adopted, with the weights reflecting the actual representation of such households in the general population. The data needed for these calculations are collected through the Annual Population Survey and are publicly and freely accessible. it is further assumed that all working-age adults are in full-time work. Since 2016, the Living Wage
Commission has taken this approach to set an economy-wide living wage that the public consider adequate for a basic standard of living. More than 7,000 businesses have voluntarily signed up to the living wage campaign, covering more than 250,000 employees (Living Wage Foundation, 2020).
For Singapore, the MIS definition and budgets similarly provide a suitable basis for establishing a living wage. As mentioned earlier, they have the
Since 2016, the Living Wage Commission in the UK has taken this approach to set an economy-wide living wage that the public consider adequate for a basic standard of living. More than 7,000 businesses have voluntarily signed up to the living wage campaign, covering more than 250,000 employees.
This is an apt moment to consider what a decent and adequate wage for workers might look like.

what people need in singapore: a household budgets study
69
FiNDiNGS
advantage of reflecting the lived realities and contemporary values of ordinary people, and are based in a transparent and rigorous consensual process. Microdata on the distribution of household types, specifically the number and ages of children among all households, are regularly collected through surveys such as the population census and General Household Survey, but are unfortunately not publicly accessible. This makes it impossible to calculate a weighted average of MiS budgets in the way it is done in the UK.
Therefore, the following calculations focus on a household with two adults and two children (Table 12). This is a typical household type. in 2020, the average number of children born to Resident (i.e. citizen and permanent resident) “ever-married” women was 2.04 (Department of Statistics, 2021b). it is also an important household type because it comes close to the replacement-level fertility rate of 2.1 that is a major concern of national population policy. Within this household configuration, costs vary depending on children’s ages. Assuming two children in contiguous age categories, the MiS budgets range from $5,224 (if the children are aged below 2 and 2–6 years old) to $7,688 (if they are aged 13–18 and 19–25 years old) per month. As the latter may be considered an outlier due to expensive university fees, only the other three possible household configurations with two children below 19 years old are considered.
If both parents are working full-time, and after adjusting for the same range of taxes (i.e. on income and property, according to the housing assumptions in
this study) and benefits (i.e. all universal and the major means-tested schemes) as before, the average wage per working parent that is required for these households to reach their MiS budgets is $2,906 per month. Since MiS budgets include housing costs, which are often largely financed by CPF savings, employer CPF contributions should also count towards this amount, which implies a gross monthly wage of $2,484 (based on 17% employer contributions for workers aged 55 and below). The actual median work income among all workers in 2020 exceeds $2,906 by 56%. Current PWM wages, on the other hand, are 38% to 49% short, after including employer CPF contributions. if work participation continues to be a core component of Singapore’s social contract, institutionalised through policies like the CPF, as well as a condition for receiving benefits such as ComCare SMTA and more generous childcare subsidies, then wage intervention must go much further than PWM currently does, to make sure workers are paid adequately.
The average wage per working parent that is required for these households to reach their MIS budgets is $2,906 per month. The actual median work income in 2020 exceeds this amount by 56%. But current PWM wages are 38% to 49% short.
If work participation continues to be a core component of Singapore’s social contract, institutionalised through policies like the CPF, as well as a condition for receiving benefits such as ComCare SMTA and more generous childcare subsidies, then wage intervention must go much further than PWM currently does, to make sure workers are paid adequately.

what people need in singapore: a household budgets study
70
FiNDiNGS
Table 12 A possible living wage for households in Singapore
Monthly amounts, $
Two children (below 2, 2–6
years old)
Two children (2–6, 7–12 years old)
Two children (7–12, 13–18
years old)
Two children (13–18, 19–25
years old)
MIS budget 6,167 6,252 6,426 7,750
Household work income needed to reach MIS budget after taxes and transfers
5,224 5,810 6,400 7,688
Work income needed per working parent 2,612 2,905 3,200 3,844
Living wage (average)1 2,906 -
This amount—$2,906 per month—provides a starting point and a reasonable target for considering a living wage for Singapore. Any living wage, since it
is a single wage level that applies to all workers regardless of what households they live in, will produce household incomes that are more than what some households need (e.g. smaller households), and less than what others require (e.g. larger households or those with special needs). The exact assumptions and compromises that are acceptable when determining a living wage is a matter for public deliberation. For Singapore, such deliberations may eventually result in a different figure from the one presented here, especially if more data on the distribution of household types become available. Nonetheless, this study demonstrates how the MiS can help in establishing a meaningful wage floor by making concrete the link between what the public agree are basic and necessary, and the wages that are required to enable a decent life.
1 Assuming employer CPF contributions of 17% (for workers aged 55 and below), the gross monthly wage should be $2,484. See text for details.
This amount—$2,906 per month—provides a starting point and a reasonable target for considering a living wage for Singapore.
This study demonstrates how the MIS can help in establishing a meaningful wage floor by making concrete the link between what the public agree are basic and necessary, and the wages that are required to enable a decent life.

what people need in singapore: a household budgets study
71
Conclusion and policy implications
The household budgetsThis is the first study to determine the amount of money that households with children need for a basic standard of living in Singapore. It covers households with single or partnered parents, who have one to three children of any age up to 25 years old.
The study focused on two particular household types, and found that (i) a single parent with one child aged 2–6 years old need $3,218 per month, while (ii) partnered parents with two children aged 7–12 and 13–18 years old need $6,426. These budgets are respectively 0.7 and 1.4 times of the median work income among the general population, which means one ‘middle earner’ will be able to meet the basic needs of the single parent household, while incomes from just below one and a half middle earners are needed for the partnered parent household.
Taking household size into account, both households need around $1,600 per household member each month to meet their basic needs (i.e. $3,218 divided by two and $6,426 divided by four). Compared to the income distribution in the general population, $1,600 falls close to the average monthly work income per household member for the third decile group. In other words, around 30% of working
71

what people need in singapore: a household budgets study
72
CONCLUSiON AND POLiCY iMPLiCATiONS
Work income and wage interventionsThat there is significant wage inequality in Singapore’s economy is already known (Ministry of Manpower, 2021a; Ng, 2018). Adopting the household budgets as benchmarks helps to identify the groups most at risk of not meeting their basic needs and indicates the size of the gaps between what people need and what they earn. Based on the latest wage distribution data for all workers in Singapore, the youngest (below 25 years old) and oldest (60 years old and above) workers; workers with less than secondary education; and people engaged in low-wage occupations and casual work all have median
monthly work incomes that fall below what the single and partnered parent households need as a minimum. This is a clear indication that existing wage interventions are not sufficient to ensure adequate incomes across the workforce.
in low-wage sectors, the theoretical wages promised by the Progressive Wage Model and Workfare income Supplement exceed the single elderly person’s household budget by 20% to 39%, but are only around 60% of what the single and partnered parent households need. importantly, these sectors do not only hire older workers. in fact, in 2020, 44,400 workers aged 25–54 were cleaners, labourers and related workers, which include workers in the cleaning and
landscape sectors; and 137,400 in this age group were service and sales workers, including workers in the security sector (Ministry of Manpower, 2021, T71). Therefore, if a household with children depends on employment in these sectors as its only source of income, it is likely to experience significant financial strain.
There is a clear and consistent gender pay gap. in concrete terms, the median work income for all male workers in Singapore is about 47% more than the budgets for the single and partnered parent households, but the median work income for women is only 36% more than the budgets—a 11 percentage point difference. Women earn less across all categories of workers, whether by occupation, nature of work or educational level. This inequality has implications in terms of meeting
Existing wage interventions are not sufficient to ensure adequate incomes across the workforce.
If a household with children depends on employment in these low-wage sectors as its only source of income, it is likely to experience significant financial strain.
This gender pay inequality has implications in terms of meeting immediate needs—especially for single parent households headed by women—and women’s retirement income security in the longer term.
households in Singapore earn less than what they require for a basic standard of living—if they are a single parent with one child aged 2–6 years old, or a couple with two children aged 7–12 and 13–18 years old. This is a substantial and concerning proportion.

what people need in singapore: a household budgets study
73
immediate needs—especially for single parent households headed by women—and women’s retirement income security in the longer term.
The income benchmarks from this study provide a starting point for considering a living wage that will allow workers in Singapore to reach a decent standard of living. For partnered parent households with two children below 19 years old, each parent must earn $2,906 per month in order to reach their MIS budget, after adjusting for the major taxes and benefits. This is a reasonable target, which the median work income among all workers in 2020 surpasses by 56%. But current PWM wages fall significantly short. If work participation continues
to be a core component of Singapore’s social contract that is institutionalised through policies like the CPF, as well as a condition for receiving benefits such as ComCare SMTA and more generous childcare subsidies, then wage intervention must go much further than PWM currently does.
CONCLUSiON AND POLiCY iMPLiCATiONS
If work participation continues to be a core component of Singapore’s social contract that is institutionalised through policies like the CPF, as well as a condition for receiving benefits such as ComCare SMTA and more generous childcare subsidies, then wage intervention must go much further than PWM currently does.
This housing penalty increases the financial strain on households led by single, “never-married” parents, which already have lower earning capacity compared to dual-parent families. In practical terms, this means that their housing needs may not be met, or may only be met at the expense of other basic needs.
HousingHousing costs are a major component of the household budgets. in order to determine housing costs, the participants had to agree on a set of space standards for different household configurations and explain why these were important. What they decided turned out to be comparable to space standards established in places like Canada and the United Kingdom, forming a useful starting point for further research on the adequacy of living space in Singapore, an understudied area. At the same time, participants were concerned that some families may not be able to afford the type of housing they need.
The discrimination in public housing policy against single, “never-married” parents raises serious questions about housing security and the fair
distribution of public resources. For this group, their partnership history alone triggers barriers to public housing that effectively double their housing costs compared to partnered, widowed or divorced parents. This housing penalty increases the financial strain on households led by single, “never-married” parents, which already have lower earning capacity compared to dual-parent families. in practical terms, this means that their housing needs may not be met (Association of Women for Action and Research, 2016), or may only be met at the expense of other basic

what people need in singapore: a household budgets study
74
CONCLUSiON AND POLiCY iMPLiCATiONS
Children’s needsThe current regime of support for children’s education and care costs resembles a wedge: more generous for younger children, but tapering off sharply for older children. As these costs, before subsidy, are also generally lower as children grow up, the impact of the various schemes is to flatten the costs of education and care between birth and the age of 18. However, not
all the costs associated with children in the household budgets decrease with age. Food, clothing and social participation are all more expensive for older children. These are areas which support schemes do not explicitly address. Because of this, financial pressures may become heavier for parents as their children grow older. This is most apparent for children aged 19–25, who have higher budgets in almost all item categories compared to younger children.
Participants were keenly aware of the many financial demands that parents face and of people’s unequal capacities to meet these demands. They observed that for some households, there is a gap between goals and realities. Youth participants, for example, spoke about a university degree being a basic need in an increasingly competitive and uncertain job market, while cognisant that economic barriers may prevent some young people from reaching university.
The current regime of support for children’s education and care costs resembles a wedge: more generous for younger children, but tapering off sharply for older children. Financial pressures may become heavier for parents as their children grow older.
Based on the current design of financial assistance, families would have to sacrifice some basic needs before they may be considered for aid, and even if they received assistance, would still not be able to reach a basic standard of living.
Income supportFor poorer households with children, public financial assistance presents challenges in terms of both accessibility and adequacy. The primary cash transfer scheme, ComCare Short-to-Medium-Term-Assistance, sets an income limit that is 40–59% of the budgets for the single and partnered parent
households. This contrasts with the eligibility income limits for childcare subsidies, which range from 190% to 370% of the budgets. if they qualify, households typically receive cash assistance of just 8–16% of the budgets, on average. Based on the current design of financial assistance, families would have to sacrifice some basic needs before they may be considered for aid, and even if they received assistance, would still not be able to reach a basic standard of living.
needs. in focus groups with single parents, this was mentioned alongside other anxieties about economic security and meeting children’s needs that were not as pronounced among partnered parents.

what people need in singapore: a household budgets study
75
For older people, the findings of the previous study bear reiteration. Work income data suggest that older people who are in work would have just enough to meet basic needs. But those depending on the CPF may find themselves short, while those needing public assistance would fall a long way below a basic standard of living. Gaps in the retirement income protection system expose financially vulnerable older people to the risk of dependence on jobs that pay just enough, and never being able to afford retirement.
On the whole, there is as yet no dependable and adequate income protection system for the most economically insecure households in Singapore, whether they are made up of working-age adults and children, or older people. This provides the context for some of the focus group discussions where participants expressed anxiety about job stability and prospects, needing to “upgrade” their skills to keep up, and needing insurance in case anything happened.
A significant portion of the household budgets is taken up by the costs of public services such as housing, childcare and tertiary education. All households have needs for these services, but where the costs land depends on public policy. The less the state provides universally and collectively, the more individual households have to bear, and the likelier that access and outcomes are unequal for different households. In Singapore, this is complicated by highly unequal earnings and inadequate assistance for households at the bottom of the income distribution.
For a society that values its people above all else, much more can be done to improve the balance between private and public provision, based on a realistic assessment of people’s means, and an accurate understanding of what households need to live with “belonging, respect, security and independence”.
For more information about this research: https://whatsenough.sg
CONCLUSiON AND POLiCY iMPLiCATiONS
what people need in singapore: a household budgets study
76
ReferencesAng, H. M. (2020, March 17). Purchase limits imposed at FairPrice supermarkets on vegetables, rice, toilet paper and other products.
Channel NewsAsia. https://www.channelnewsasia.com/news/singapore/ntuc-fairprice-purchase-limits-toilet-paper-rice-eggs-12545610
Anker, R. (2011). Estimating A Living Wage: A Methodological Review. international Labour Organization.
Association of Women for Action and Research (AWARE). (2016). Single Parents’ Access to Public Housing: Findings from AWARE’s Research Project. https://www.aware.org.sg/wp-content/uploads/Single-Parents-Access-to-Public-Housing.-Final-version..pdf
Bradshaw, J. (ed.) (1993). Budget standards for the United Kingdom. Avebury.
Bradshaw, J., Middleton, S., Davis, A., Oldfield, N., Smith, N., Cusworth, L., & Williams, J. (2008). A minimum income standard for Britain: What people think. Joseph Rowntree Foundation.
Burchardt, T. (2014). Deliberative research as a tool to make value judgements. Qualitative Research, 14(3), 353–70.
Canada Mortgage and Housing Corporation. (2019, August 14). identifying core housing need: Recognizing households that are unaffordable and fall below housing standards. https://www.cmhc-schl.gc.ca/en/professionals/housing-markets-data-and- research/housing-research/core-housing-need/identifying-core-housing-need
Central Provident Fund Board. (2021a, July 16). CPF LiFE. https://www.cpf.gov.sg/Members/Schemes/schemes/retirement/cpf-life
Central Provident Fund Board. (2021b). Central Provident Fund Board Annual Report 2020. https://www.cpf.gov.sg/Assets/common/Documents/CPF_AnnualReport2020_Part1.pdf
Chok, S. (2021). Mind the chasm: COViD-19 and deepening inequalities in Singapore. Beyond Social Services.
D’Arcy, C., & Finch, D. (2016). Making the Living Wage: The Resolution Foundation review of the Living Wage. Resolution Foundation.
Davis, A., Hirsch, D., iwanaga, R., iwata, M., Shigekawa, J., Uzuki, Y., & Yamada, A. (2014). Comparing the minimum income standard in the UK and Japan: Methodology and outcome. Social Policy and Society, 13(1),89–101.
Davis, A., Hirsch, D., Padley, M., & Marshall, L. (2015). How much is enough? Reaching social consensus on minimum household needs. Centre for Research in Social Policy, Loughborough University.
Davis, A., Hirsch, D., Padley, M., & Shepherd, C. (2018). A Minimum income Standard for the UK 2008-2018: Continuity and change. Joseph Rowntree Foundation.
Davis, A., Hirsch, D., Padley, M., & Shepherd, C. (2021). A Minimum income Standard for the United Kingdom in 2021. Joseph Rowntree Foundation.
Department of Communities and Local Government, United Kingdom. (2015, March). Technical housing standards – nationally described space standard. https://assets.publishing.service.gov.uk/government/uploads/system/uploads/attachment_data/file/524531/160519_Nationally_Described_Space_Standard____Final_Web_version.pdf
Department of Statistics. (2019). Report on the Household Expenditure Survey 2017/2018. https://www.singstat.gov.sg/-/media/files/publications/households/hes201718.pdf
Department of Statistics. (2020a). Resident Households By Household Living Arrangement And Age Group Of Youngest Child, Annual (M810661) [Data file]. https://www.tablebuilder.singstat.gov.sg/publicfacing/createDataTable.action?refId=14917
Department of Statistics. (2020b). Population trends 2020. https://www.singstat.gov.sg/-/media/files/publications/population/ population2020.pdf
Department of Statistics. (2021a). Key household income trends 2020. https://www.singstat.gov.sg/-/media/files/publications/ households/pp-s27.pdf
Department of Statistics. (2021b). Average Number Of Children Born By Age Group Of Resident Ever-Married Females (M810411) [Data file]. https://tablebuilder.singstat.gov.sg/table/TS/M810411
Doyal, L., & Gough, i. (1984). A theory of human needs. Critical Social Policy, 4(10), 6–38.
Early Childhood Development Agency. (2021a). ECDA Anchor Operator Scheme (AOP). https://www.ecda.gov.sg/Parents/Pages/AOP.aspx
Early Childhood Development Agency. (2021b). Subsidies and Financial Assistance. https://www.ecda.gov.sg/Pages/Subsidies-and- Financial-Assistance.aspx
REFERENCES

what people need in singapore: a household budgets study
77
Fisher, G. M. (2007). An overview of recent work on standard budgets in the United States and other Anglophone countries. Office of the Assistant Secretary for Planning and Evaluation, the United States government. https://aspe.hhs.gov/sites/default/files/ migrated_legacy_files//139091/report.pdf
Goedemé, T., Penne, T., Hufkens, T., Karakitsios, A., Bernát, A., Franziskus, A., Simonovits, B., Álvarez, E. C., Kanavitsa, E., Parcerisas, I. C., Romaní, J. R., Mäkinen, L., Matsaganis, M., Arlotti, M., Kopasz, M., Szivós, P., Ritakallio, V., Kazepov, Y., Bosch, K. V., & Storms, B. (2019). What does it mean to live on the poverty threshold? Lessons from reference budgets. in: Cantillon, B., Goedemé, T., & Hills, J. (Eds.), Decent incomes for all? improving Policies in Europe (pp. 13–33). Oxford University Press.
Hill, K., Marshall, L., Hirsch, D., & Padley, M. (2016). Sight loss and minimum living standards: The additional costs of living for people of working age who are severely sight impaired and for people of pension age with acquired sight impairment. Centre for Research in Social Policy, Loughborough University.
Hirsch, D. (2013). Paying for children: The state’s changing role and income adequacy. Journal of Social Policy, 42(3), 495–512.
Hirsch, D. (2015). Children in London: The extra cost. Child Poverty Action Group.
Hirsch, D. (2017). Contemporary UK wage floors and the calculation of a living wage. Employee Relations, 39(6), 815–824. https://doi.org/10.1108/ER-03-2017-0048
Hirsch, D., & Hill, K. (2016). The additional cost of disability: A new measure and its application to sensory impairment. Disability & Society, 31(7), 897–913. https://doi.org/10.1080/09687599.2016.1221334
Housing & Development Board. (2018a, February 6). HDB Launches 4,381 Flats in February 2018 BTO and ROF Exercise. https://www.hdb.gov.sg/cs/infoweb/about-us/news-and-publications/press-releases/hdb-launches-4381-flats-in-february-2018-bto-and-rof-exercise
Housing & Development Board. (2018b, May 22). HDB Launches 6,992 Flats in May 2018 BTO and SBF Exercise. https://www.hdb.gov.sg/cs/infoweb/about-us/news-and-publications/press-releases/hdb-launches-6992-flats-in-may-2018-bto-and-sbf-exercise
Housing & Development Board. (2018c, August 28). HDB Launches 5,101 Flats in August 2018 BTO and ROF Exercise. https://www.hdb.gov.sg/cs/infoweb/about-us/news-and-publications/press-releases/28082018-bto-launch-aug
Housing & Development Board. (2018d, November 13). HDB Launches 7,214 Flats in Nov 2018 BTO and SBF Exercise. https://www.hdb.gov.sg/cs/infoweb/about-us/news-and-publications/press-releases/13112018-bto-launch-nov
Housing & Development Board. (2019a, February 12). HDB Launches 3,739 Flats in February 2019 BTO and ROF Exercise. https://www.hdb.gov.sg/cs/infoweb/about-us/news-and-publications/press-releases/bto-launch-feb-2019
Housing & Development Board. (2019b, May 22). HDB Launches 6,753 Flats in May 2019 BTO and SBF Exercise. https://www.hdb.gov.sg/cs/infoweb/about-us/news-and-publications/press-releases/hdb-launches-6753-flats-in-may-2019-bto-and-sbf-exercise
Housing & Development Board. (2019c, September 11). HDB Launches 4,089 Flats in September 2019 BTO and ROF Exercises. https://www.hdb.gov.sg/cs/infoweb/about-us/news-and-publications/press-releases/bto-sales-launch
Housing & Development Board. (2019d, November 12). HDB Launches 8,170 Flats in November 2019 BTO and SBF Exercises. https://www.hdb.gov.sg/cs/infoweb/about-us/news-and-publications/press-releases/hdb-launches-8170-flats-in-november-2019-bto-and-sbf-exercises
Housing & Development Board. (2020a). HDB Annual Report 2019/2020. https://services2.hdb.gov.sg/ebook/AR2020-keystats/html5/index.html?&locale=ENG
Housing & Development Board. (2020b, February 11). HDB Launches 3,095 Flats in February 2020 BTO Exercise. https://www.hdb.gov.sg/cs/infoweb/about-us/news-and-publications/press-releases/11022020-hdb-launches-3095-flats-in-february-2020-bto- exercise
Housing & Development Board. (2020c, August 12). HDB Launches 7,862 Flats in August 2020 BTO Exercise. https://www.hdb.gov.sg/cs/infoweb/about-us/news-and-publications/press-releases/Press-Releases-12082020
Housing & Development Board. (2020d, November 17). HDB Launches 11,015 Flats in November 2020 BTO and SBF Exercises. https://www.hdb.gov.sg/cs/infoweb/about-us/news-and-publications/press-releases/17112020-HDB-Launches-11015-Flats-in-November-2020-BTO-and-SBF-Exercises
Housing & Development Board. (2021a, March 2). Payment Plan Calculator. https://homes.hdb.gov.sg/home/calculator/payment-plan
Housing & Development Board. (2021b, March 18). Rental statistics: median rents by town and flat type. https://www.hdb.gov.sg/ residential/renting-a-flat/renting-from-the-open-market/rental-statistics
REFERENCES

what people need in singapore: a household budgets study
78
Housing & Development Board. (2021c). Resale flat prices (based on registration date), from Jan 2017 onwards [Data set]. Government of Singapore. https://data.gov.sg/dataset/resale-flat-prices
Lee, H. L. (2021, August 29). National Day Rally 2021. Prime Minister’s Office Singapore. https://www.pmo.gov.sg/Newsroom/ National-Day-Rally-2021-English
Lim, J. (2019, May 26). How much is enough? Social workers and financial experts weigh in on meeting seniors’ basic needs. Today. https://www.todayonline.com/singapore/social-workers-financial-experts-on-meeting-seniors-basic-needs
Living Wage Foundation. (2020). For the real cost of living. https://www.livingwage.org.uk/
Ministry of Education. (2021a). Financial Assistance. https://www.moe.gov.sg/financial-matters/financial-assistance
Ministry of Education. (2021b). Financial assistance information for Post-Secondary Education institutions (PSEis). https://www.moe.gov.sg/financial-matters/financial-assistance/financial-assistance-information-for-pseis
Ministry of Finance. (2020). GST Voucher – U-Save. https://www.gstvoucher.gov.sg/Pages/U-Save.aspx
Ministry of Finance. (2021, June 1). GST Voucher – Cash. https://www.gstvoucher.gov.sg/Pages/Cash.aspx
Ministry of Manpower. (2019a, February 18). Written answer by Mrs Josephine Teo, Minister for Manpower, to Parliamentary Question on CPF payouts. https://www.mom.gov.sg/newsroom/parliament-questions-and-replies/2019/0218-written-answer-by-mrs- josephine-teo-minister-for-manpower-to-parliamentary-question-on-cpf-payouts
Ministry of Manpower. (2019b, April 1). Written Answer by Mrs Josephine Teo, Minister for Manpower, to Parliamentary Question on CPF Basic Retirement Sum. https://www.mom.gov.sg/newsroom/parliament-questions-and-replies/2019/0401-written- answer-by-mrs-josephine-teo-minister-for-manpower-to-parliamentary-question-on-cpf-basic-retirement-sum
Ministry of Manpower. (2020, April 6). Workfare income Supplement. https://www.workfare.gov.sg/Pages/WiSEmployee.aspx
Ministry of Manpower. (2021a). Labour force in Singapore 2020. https://stats.mom.gov.sg/iMAS_PdfLibrary/mrsd_2020LabourfForce.pdf
Ministry of Manpower. (2021b, July 2). Progressive Wage Model. http://www.mom.gov.sg/employment-practices/progres-sive-wage-model
Ministry of Manpower. (2021c, June 8). Silver Support Scheme. http://www.mom.gov.sg/employment-practices/silver-support-scheme
Ministry of Manpower. (2021d, August 30). Governments Accepts Recommendations by Tripartite Workgroup to Uplift Wages and Well-Being of Lower-Wage Workers. https://www.mom.gov.sg/newsroom/press-releases/2021/0830-government- accepts-twg-lww-recommendations
Ministry of Social and Family Development. (2020). Community Care Endowment Fund. Annual report for Financial Year 2019. https://www.msf.gov.sg/publications/Documents/FY19%20ComCare%20Annual%20Report.pdf
Ministry of Social and Family Development. (2021a, July 5). Baby Bonus Scheme. https://www.msf.gov.sg/assistance/Pages/Baby- Bonus-Scheme.aspx
Ministry of Social and Family Development. (2021b, July 5). Student Care Fee Assistance (SCFA). https://www.msf.gov.sg/Comcare/ Pages/ComCare-Student-Care-Subsidies.aspx
Ministry of Social and Family Development. (2021c, July 6). ComCare Long-term Assistance. https://www.msf.gov.sg/Comcare/Pages/Public-Assistance.aspx
Ministry of Social and Family Development. (2021d, July 6). ComCare Short-To-Medium-Term Assistance. https://www.msf.gov.sg/ Comcare/Pages/Short-to-Medium-Term-Assistance.aspx
Ministry of Social and Family Development. (2021e, July 6). Success Rate Of ComCare Applications. https://www.msf.gov.sg/ media-room/Pages/Success-Rate-of-ComCare-Applications.aspx
Morris, J. N., Wilkinson, P., Dangour, A. D., Deeming, C., & Fletcher, A. (2007). Defining a minimum income for healthy living (MIHL): older age, England. international journal of epidemiology, 36(6), 1300–1307. https://doi.org/10.1093/ije/dym129
Ng, i. Y. H., Ng, Y. Y., & Lee, P. C. (2018). Singapore’s restructuring of low-wage work: Have cleaning job conditions improved? Economic and Labour Relations Review, 29(3), 308–327.
Ng, K. H. (2020). Social housing. in UN Habitat Housing Practice Series – Singapore (pp. 10–27). United Nations Human Settlements Programme. https://unhabitat.org/sites/default/files/2020/08/singapore_-_housing_practise_series.pdf
REFERENCES

what people need in singapore: a household budgets study
79
Ng, K. H., Teo, Y. Y., Neo, Y. W., Maulod, A., & Ting, Y. T. (2019). What older people need in Singapore: A household budgets study. https://whatsenoughsg.files.wordpress.com/2019/05/what-older-people-need-in-singapore-a-household-budgets-study-full-report.pdf
Ng, K. H., Teo, Y. Y., Neo, Y. W., Maulod, A., & Ting, Y. T. (2020). Measuring needs and setting standards in Singapore. in C. Deeming (Ed.), Minimum income standards and reference budgets: international and comparative policy perspectives (pp. 83–96). Policy Press.
Sen, A. (1999). Development as freedom. Oxford University Press.
Shanmugaratnam, T. (2012, February 17). Budget speech 2012: An inclusive society, a stronger Singapore [Speech]. Parliament, Singapore.
Smith, N., Hirsch, D., & Davis, A. (2012). Accessibility and capability: The minimum transport needs and costs of rural households. Journal of Transport Geography, 21, 93–101.
Storms, B., Goedemé, T., Van den Bosch, K., Penne, T., Schuerman, N., & Stockman, S. (2014). Pilot project for the development of a common methodology on reference budgets in Europe. Review of current state of play on reference budget practices at national, regional and local level. European Commission.
Tan, E. L. (2019, June 2). Worries over retirement income. The Straits Times. https://www.straitstimes.com/singapore/health/ worries-over-retirement-income
Tan, S. A. (2021, July 24). Tripartite work group looking at all options in improving support for lower-wage workers. The Straits Times. https://www.straitstimes.com/singapore/jobs/tripartite-work-group-looking-at-all-options-in-improving-support-for-lower-wage
Teo, Y. Y. (2018). This is what inequality looks like. Ethos Books.
Townsend, P. (1979). Poverty in the United Kingdom: A survey of household resources and standards of living. Penguin.
Tripartite Workgroup on Lower-Wage Workers. (2021). Tripartite Workgroup on Lower-Wage Workers Report: Progress through Solidarity and Dynamism. https://www.mom.gov.sg/-/media/mom/documents/employment-practices/lww/tripartite-work-group-on-lower-wage-workers-report.pdf
Veit-Wilson, J. (1998). Setting adequacy standards: How governments define minimum incomes. Policy Press.
Walker, R. (1987). Consensual approaches to the definition of poverty: Towards an alternative methodology. Journal of Social Policy, 16(2), 213–26.
Yuen, S. (2020, October 19). Jamus Lim’s remarks on wages draw response from union leaders. The Straits Times. https://www.straitstimes.com/singapore/politics/jamus-lims-remarks-on-wages-draw-response-from-union-leaders
REFERENCES
what people need in singapore: a household budgets study
80
About the authors
NG Kok Hoe is Senior Research Fellow and Head of the Case Study Unit at the Lee Kuan Yew School of Public Policy, where he also leads the Social inclusion Project, a research programme dedicated to analysing how public policies shape opportunities for participation. His research is concerned with income security, minimum income standards, housing policy and homelessness. He led the first nationwide street count of homelessness in Singapore in 2019 and is co-editor of the book They told us to move: Dakota—Cassia (Ethos Books, 2019).
TEO You Yenn is Associate Professor, Provost’s Chair, and Head of Sociology at the Nanyang Technological University. Her research focuses on poverty and inequality, governance and state-society dynamics, gender, and class. She is the author of Neoliberal morality in Singapore: How family policies make state and society (Routledge, 2011) and This is what inequality looks like (Ethos Books, 2018).
NEO Yu Wei is Senior Research Fellow and Deputy Director at the Social Service Research Centre at the National University of Singapore. Her research focuses on issues related to poverty and the social exclusion of marginalised groups. She has collaborated with academics from different disciplines, social service professionals, and government agencies on various research projects related to improving access to services for low-income families in Singapore.
Ad MAULOD is a cultural anthropologist and Senior Research Fellow at the Centre for Ageing Research and Education (CARE), Duke-NUS Medical School, Singapore. His research focuses on translating cultural concepts of health and ageing into effective programme and policy interventions. He has led several evaluation studies focusing on user experience of health services and factors that impact the quality of care integration. He believes in the empowerment of our elders by amplifying their narratives and advocating for an inclusive, compassionate and just society for all ages.
Stephanie CHOK is an independent researcher who has worked and volunteered with NGOs in Singapore for more than a decade. She obtained her postgraduate degrees in development studies and her PhD examined Singapore’s labour migration regime for temporary low-paid migrant workers. Stephanie continues to work on projects related to inequality, social protection and labour justice.
WONG Yee Lok is Research Associate at the Social inclusion Project, Lee Kuan Yew School of Public Policy. She received her Master in Public Policy from LKYSPP and won the WyWy Gold Medal for Best Student in Public Policy with Best Policy Analysis Exercise. She is interested in the study of social and economic policies to protect people from economic risks and insecurities of life.


