P a g e | 1
Extended Project Qualification
What permanent effect does heat treatment have on the
structure, colour, and iridescence of the Chrysochroa
wallacei beetle?
By Ilya Carey
2017
Tutor: Dr S. Phythian
Abstract:
As part of the Langton’s Beetles Project, I investigated the effect of heat on the
structure, colour, and iridescence of the Chrysochroa wallacei beetle by heating its
elytra (wing cases) in a glass kiln at varying temperatures between 100-500°C, with
the colour and iridescence of the elytra recorded using a spectrometer and goniometer
before and after the heating. SEM imaging was used to look at control and heated
elytra, which were freeze fractured and gold coated. The main implications of the
results are that there is a permanent exponential blue-shift in colour as elytra are
heated at higher temperatures, though there is a simultaneous red-shift due to a relative
increase in intensity of colours with greater wavelengths. These effects are thought to
be as a result of pressure being put on the multilayer reflector due to the denaturation
of structural proteins within the elytra. There is a general decrease in spectral richness
(iridescence) after heat treatment. Microscopic hook structures were discovered on the
underside of an elytron, which appear to be previously undocumented.
Key words: beetles, multilayer reflectors, iridescence, SEM
Contents 1 Introduction .................................................................................................................................................... 3
2 Review .............................................................................................................................................................. 3
a) Foreword ............................................................................................................................................ 3
P a g e | 2
b) Light .................................................................................................................................................... 3
c) Colour ................................................................................................................................................. 3
d) Structural Colour and Iridescence ................................................................................................... 4
e) Light Intensity .................................................................................................................................... 4
f) Graphs ................................................................................................................................................ 4
g) Wavelengthmax versus Angle of Incidence ....................................................................................... 5
h) Spectral Richness ............................................................................................................................... 6
i) Relative Light Intensity Peak versus Angle of Incidence .............................................................. 6
j) Beetle Anatomy .................................................................................................................................. 6
k) Chrysochroa wallacei ......................................................................................................................... 7
l) Types of Iridescence in Beetles ......................................................................................................... 7
m) Refraction ....................................................................................................................................... 8
n) Reflection ............................................................................................................................................ 9
o) Interference ........................................................................................................................................ 9
p) Multilayer Reflectors ......................................................................................................................... 9
q) Effect of Environmental Factors .................................................................................................... 11
r) Possible Functions of Iridescence in Animals ............................................................................... 11
3 Experiment Preparation .............................................................................................................................. 13
a) Preamble and Hypotheses ................................................................................................................... 13
b) Summary of Plan ................................................................................................................................. 13
c) Creating a Spectral Data Protocol ..................................................................................................... 13
d) Method for Collecting Spectral Data ................................................................................................. 15
e) Provisional Heat Treatment Method ................................................................................................. 18
f) Control Tests ........................................................................................................................................ 18
g) Final Heat Treatment Method............................................................................................................ 21
h) SEM Imaging Method ......................................................................................................................... 21
4 Final Experiment .......................................................................................................................................... 25
a) Control and Heat Treatment Data ..................................................................................................... 25
b) SEM Images ......................................................................................................................................... 32
c) Analysis of Data ................................................................................................................................... 34
d) Analysis of SEM Images ..................................................................................................................... 35
5 Conclusions ................................................................................................................................................... 36
6 Evaluation and Acknowledgements ............................................................................................................ 38
Appendix A ...................................................................................................................................................... 39
Appendix B ....................................................................................................................................................... 40
Bibliography (Nota bene: n.d. means no date) ................................................................................................. 41
P a g e | 3
1 Introduction
The Beetles Project is a student-led research project at the Langton that investigates structural colour, such as
iridescence,1 in elytra.2 As iridescence is caused by the structure of the elytra, heat will affect the colour of the
elytra as it affects the structure.
As part of the project, I investigated the permanent effect that heat has on the iridescent elytra of the
Chrysochroa wallacei3 (C. wallacei) beetle by collecting spectral data of elytra before and after heating them
in a glass kiln, and the heat treatment was done at various temperatures up to 500°C. To collect spectral data, I
used a spectrometer,4 a goniometer,5 and specialist software called SpectraSuite (Ocean Optics, 2009), and all
together this allowed spectra of light reflected from elytra to be recorded at specific angles.
In addition, I took SEM6 images of elytra, some heat treated and some not, in order to identify any changes in
structure as a result of heat treatment.
2 Review
a) Foreword
Structural colour, such as iridescence, is a natural phenomenon present in a wide variety of organisms, ranging
from fish, to birds, and of course insects. In animals, structural colour has been present for millions of years
(Parker, 2000), and thus it must have some sort of evolutionary benefit. Before explaining how and why we
think beetles are iridescent, I would like to present some definitions and clarifications.
b) Light
Light is a type of electromagnetic radiation with the properties of both waves and particles, though I will be
treating light as wave in this investigation. The electromagnetic spectrum consists of numerous types of
waves, and these can be classed based on their wavelength.7 Electromagnetic waves with wavelengths of
about 375nm to 780nm are the only part of the electromagnetic spectrum that is visible to us, which is why
this part is called the visible spectrum of light, and each colour of light that we perceive is a specific
wavelength of light within this range. White light is not one colour, and therefore not a wavelength of light,
but it is the presence of all visible wavelengths of light at the same intensity (Wikipedia, Light, 2017).
c) Colour
When a surface or a light source appears to have a colour, certain wavelengths of the visible spectrum of light
are present with a greater intensity relative to the other wavelengths in the spectrum. Usually, colour is as a
result of pigments; materials that, due to specific chemical bonds, absorb certain wavelengths of light, and
reflect and transmit all others. Therefore, if a material looks blue for example, it is because pigments in the
material absorb all wavelengths of visible light except for the blue wavelengths, so blue is the reflected colour
that we observe. However, the colour perceived by our eyes can be affected by many factors, such as
background colour, colour of the light source, and, in the case of structural colour, the angle (Wikipedia,
Pigment, 2017).
1 Iridescence (or goniochromism): the property of surfaces that appear to change colour as the angle of view changes.
2 Elytron (pl; elytra): the hardened and protective cover of a beetle wing. Each beetle has two elytra.
3 Chrysochroa wallacei: Iridescent green beetle originating from Malaysia (Coleoptera Atlas).
4 Spectrometer: apparatus that measures the relative intensity of different wavelengths of light within a spectrum.
5 Goniometer: a mechanical device that measures angles accurately, typically consisting of two arms and a dial.
6 Scanning Electron Microscope: powerful microscope that produces black and white images using an electron beam
instead of light.
7 Wavelength (or λ): distance over which a wave repeats itself, i.e. the distance from peak to peak or trough to trough.
P a g e | 4
d) Structural Colour and Iridescence
Structural colour simply means colour that is caused by the structure as opposed to pigments, and beetle
iridescence is an example of that. Iridescence is the property of surfaces that appear to change colour as the
angle of view changes, but whilst the angle of illumination is not altered. As the colour of light is determined
by the wavelength of light, the light reflected off iridescent surfaces exhibits a change in wavelength as the
angle changes. By colour change, I mean that certain wavelengths of light change in intensity relative to the
other wavelengths of light in the same spectrum. However, the fact that surfaces become darker when looked
upon at greater angles, relative to the light source, is not iridescence; this is just because less light is reflected
at greater angles, meaning that surfaces will have the same colour but just at a lower intensity.
e) Light Intensity
That leads on to my next point; for the colour of a spectrum of light, the absolute values of the light intensities
of each wavelength do not matter; only the light intensities of different wavelengths relative to each other
matter. The wavelengths present in the light reflected off a surface determine what colour the surface will
appear, and an equal change in intensity for each wavelength in the spectrum will not result in a change in
colour, but a change brightness. Only an unequal change in intensity of wavelengths in a spectrum will result
in a change in colour. The same concept applies to measuring spectra, as the light intensities of samples can be
adjusted by changing the “shutter speed” of the spectrometer, whilst the relative intensities of wavelengths of
reflected light in the spectrum cannot be changed by any electronic spectrometer settings. Only the colour of
the sample can change this, or a coloured filter in front of the light source of spectrometer, or a change in
angle if the sample is iridescent.
f) Graphs
In this investigation, there will be a plethora of graphs, and it is important to understand how they were
produced and what they represent. First of all, the spectrometer that I used collects a spectrum by going
through 651 wavelengths of light (350-1000nm), and recording the relative light intensity of each one.
Therefore, for each spectrum of light that I collected, I had the following raw data: wavelength of light versus
relative intensity for 651 different wavelengths. Figure 1 is a spectrum of light collected from a normal green
C. wallacei elytron, and graphed by Excel using the raw data collected with the spectrometer, light source, and
the Spectrasuite software. This software caps the relative intensity at 4000, but as I explained earlier these
numbers by themselves do not matter. This graph shows that there is a peak in relative light intensity between
500nm and 600nm, which explains why the colour of the beetle elytron is mostly green. However, there are
other colours present too, though their intensities relative to the peak are tiny, which is why the elytron does
not appear very multi-coloured.
0
500
1000
1500
2000
2500
3000
3500
4000
350 450 550 650 750 850 950
Rel
ativ
e lig
ht
inte
nsi
ty
Wavelength of light (nm)
Spectrum of normal C. wallacei elytron
Figure 1
P a g e | 5
As I am investigating at iridescence, I will be examining spectra of light at various angles. Therefore, most of
my graphs will be overlays of spectra collected at different angles, as seen in Figure 2. To help visualise what
this graph represents, I put the spectrum of visible light which the graph translates to in the background.
What this graph shows is that there is a decrease in relative light intensity as the angle of incidence increases,
and you can barely see a spectrum at the greatest angles. Notice that each spectrum has a peak, and the
wavelength at the intensity peak will represent the most abundant colour in the spectrum. Also, as the angle of
incidence increases, the wavelength at which there is a peak in relative light intensity for each spectrum
decreases; there is a blue shift8 as the angle of incidence increases. In other words, as you look at the beetle
elytron from a greater angle, the green elytron becomes bluer. Therefore, this elytron is iridescent.
g) Wavelengthmax versus Angle of Incidence
In Figure 2, it is quite hard to tell by eye that there is a
change in the wavelength at which there is a relative
intensity peak, so this is not an accurate method for
determining the colour of an elytron or whether it is
iridescent. However, the raw data of these spectra can be
analysed with Excel to produce other graphs. One very
useful graph is angle of incidence versus the wavelength
at which there is a light intensity peak, or wavelengthmax
(λmax). In Figure 2 for example, λmax is 557nm for the
spectrum with the greatest intensity (at 10°). This
wavelength is an accurate measure of colour for spectra
with a single, narrow peak. With some Excel coding,
λmax for each spectrum can be obtained, and plotted
against the angle of incidence, as shown in Figure 3. The
graph clearly shows a change in colour as the angle of
incidence increases, confirming that the C. wallacei elytron is iridescent.
8 Blue shift: a decrease in wavelength.
546
548
550
552
554
556
558
9 11 13 15 17 19 21
λ max
(nm
)
Angle of incidence (°)
Normal C. wallacei elytron: λmax vs angle
Figure 3: Wavelength of light at relative intensity peak of
spectra of light of normal C. wallacei elytron.
Figure 2: As a general rule of thumb for these overlay graphs, the spectrum with the greatest intensity is collected at the smallest
angle, and vice versa.
P a g e | 6
h) Spectral Richness
In Deparis et al (2008), there is the introduction of “spectral richness”. This refers to the change in the
“dominant” colour in nanometres as the angle of incidence increases in degrees, and is equal to the gradient of
a λmax versus angle of incidence graph (which is represented by θ here). Therefore:
𝑠𝑝𝑒𝑐𝑡𝑟𝑎𝑙 𝑟𝑖𝑐ℎ𝑛𝑒𝑠𝑠 =𝑑λ𝑚𝑎𝑥
𝑑𝜃
Following from this, the units of spectral richness are nm/°. If a surface has a spectral richness of 0, it is not
iridescent, but any other value would indicate iridescence. As multilayer reflectors result in a blue-shift in
colour as the angle of incidence increases, spectral richness will be negative. As tests show that the λmax versus
angle of incidence correlation is linear, to calculate the gradient linear regression can be used, though this will
just be an estimate as not all the data points are on a straight line (Pearson, 2008):
𝑠𝑝𝑒𝑐𝑡𝑟𝑎𝑙 𝑟𝑖𝑐ℎ𝑛𝑒𝑠𝑠 =𝑑λ𝑚𝑎𝑥
𝑑𝜃≈
𝑛(Σθλ𝑚𝑎𝑥) − (Σθ)(Σλ𝑚𝑎𝑥)
𝑛(Σ𝜃2) − 𝑛(Σ𝜃)2
Where λmax is the wavelength at the intensity peak of a spectrum, θ is the angle of incidence, and n is the
number of data points, which for each spectrum that I collect is 651.
i) Relative Light Intensity Peak versus Angle of Incidence
Another graph obtained through Excel coding is that of the angle of incidence versus the relative light
intensity peak (Figure 4). This just shows that there is an exponential decrease in the maximum relative light
intensity of each spectrum as the angle of incidence increases, meaning that the colours of the elytron decrease
in intensity as the angle of incidence increases.
j) Beetle Anatomy
To understand how beetle elytra are iridescent, it is
important to look at their anatomy first. The basic
structure of most insects is a head, thorax, and
abdomen, accompanied with six legs and four wings.
In beetles, only two of the four wings are for flying,
and the other pair, the elytra, are protective covers for
the beetles’ more delicate flying wings and the
abdomen (Figure 5). Unlike humans, who have a soft
outer bodies held together by hard endoskeletons,
insects have internal soft organs and a hard
exoskeleton on the outside.
0
500
1000
1500
2000
2500
3000
3500
9 11 13 15 17 19 21
Rel
ativ
e Li
ght
Inte
nsi
ty P
eak
Angle of incidence in degrees
Brightness of elytron
Figure 4: Relative light intensity peak of spectra of normal C. wallacei elytron at different angles.
Figure 5: Basic anatomy of a beetle (Parks Canada, 2017).
P a g e | 7
This exoskeleton, of which the elytra are an extension, consists
mostly of the translucent polysaccharide9 chitin, and some
sclerotized10 proteins for added strength and flexibility. Chitin is a
polymer of N-acetylglucosamine, which is similar to a glucose
molecule except the hydroxyl group on the second carbon atom has
been replaced by an acetyl amine group (NHCOCH3). As cellulose is
a polysaccharide with glucose monomers, chitin is just cellulose with
a change in one of the groups on each monomer, and their roles are
similar too; both have an important structural role, though cellulose is
commoner in plants and chitin is more frequent in insects and fungi.
The glycosidic11 bonds between the chitin monomers are between the
first carbon and the fourth carbon, where every other monomer has been inverted in order to form a straight
chain (β-(1→4) linkages). These straight chains have hydrogen bonding12 between them, meaning that strands
of chitin, called microfibrils, can be formed. The acetyl amine group allows for more intermolecular bonds to
be formed between chitin molecules, hereby making chitin
stronger than cellulose (Wikipedia, Chitin, 2017).
k) Chrysochroa wallacei
The beetle that I investigated was the Chrysochroa wallacei
(C. wallacei) (Figure 7), and this is an iridescent green-blue
wood boring beetle from the Cameron Highlands in Malaysia
(Coleoptera Atlas, n.d.). This harmless beetle belongs to the
taxonomic family Buprestidae, and all the species in this
family have multilayer reflectors as the cause of their
iridescence (Hunt, et al., 2007). The reason that I looked at this
species is that the Beetles Project had a large number of
specimens that I could use, hereby eliminating the need to
purchase more beetles, and the C. wallacei are a fine example
of iridescence. For the samples we have, factors such as age
and gender are not provided, we only know the species.
l) Types of Iridescence in Beetles
Although chitin by itself does not cause iridescence, its
role is paramount for the commonest type of iridescence in beetles; multilayer reflectors. A thorough review
of structural colour mechanisms in beetles (Seago, et al., 2009) designated three main classes of iridescence
mechanisms in beetles (multilayer reflectors, three-dimensional photonic crystals, and diffraction gratings),
and has proposed that these terms should be used in future work, which is why I shall do so accordingly. As
the class of iridescence mechanism present in the C. wallacei beetles is multilayer reflectors, I shall focus on
this.
The multilayer reflectors in iridescent beetles cover nearly all of the exoskeleton, but the largest uninterrupted
area of this structure is on the elytra. This, in addition to the fact that the elytra are easy to remove, means that
the study of beetle iridescence focuses on the elytra, even though the multilayer reflectors are not exclusive to
this section of a beetle.
The mechanism by which multilayer reflectors cause iridescence relies on several optical phenomena, the
most important of which being reflection, refraction and interference.
9 Polysaccharide: a long chain of monosaccharides, or simple sugars, held together by covalent bonds. 10 Sclerotisation: the process of hardening proteins by cross linking, to form sclerotin. 11 Glycosidic bond: strong covalent bond between sugar molecules. 12 Hydrogen bonding: weak type of electrostatic attraction between polar atoms or molecules.
Figure 6: Two N-acetylglucosamine
monomers, which repeat to form chitin
(Wikipedia, Chitin, 2017)
Figure 7: The beetle in investigated: Chrysochroa wallacei
P a g e | 8
m) Refraction
Refraction occurs when a wave, such as light, travels from one medium into another. The result is that, at the
boundary of the media, there is a change in speed of the wave, a change in direction of travel if the wave is not
perpendicular to the new medium, and a change in wavelength (Boston University, 1998). The refractive
index of a material determines the amount by which light is refracted, and this refractive index is given by the
formula:
𝑛 =𝑐
𝑣
Where 𝑛 is the refractive index, 𝑐 is the speed of light in a vacuum, and 𝑣 is the
speed of light in the material. Therefore, the refractive index of a vacuum is 1, and
as the speed of light in air so close to the speed in a vacuum, the refractive index
of air is considered to be 1 as well (Wikipedia, Refraction, 2017).
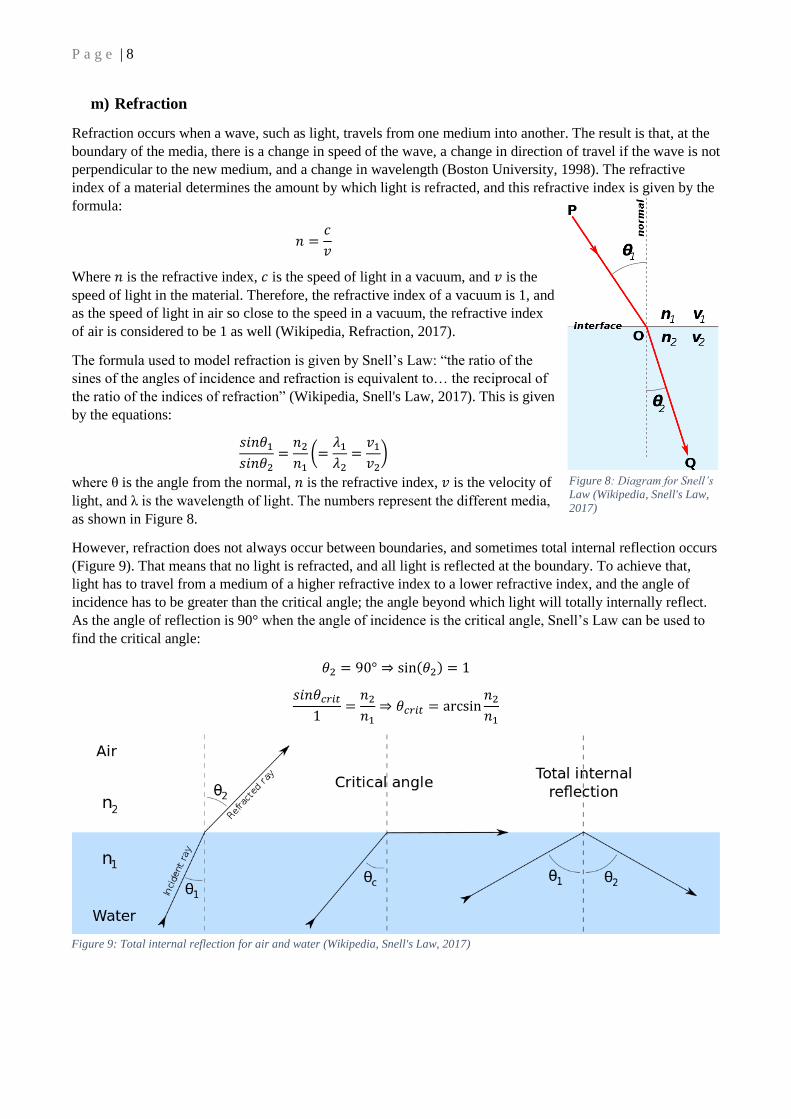
The formula used to model refraction is given by Snell’s Law: “the ratio of the
sines of the angles of incidence and refraction is equivalent to… the reciprocal of
the ratio of the indices of refraction” (Wikipedia, Snell's Law, 2017). This is given
by the equations:
𝑠𝑖𝑛𝜃1
𝑠𝑖𝑛𝜃2=
𝑛2
𝑛1(=
𝜆1
𝜆2=
𝑣1
𝑣2)
where θ is the angle from the normal, 𝑛 is the refractive index, 𝑣 is the velocity of
light, and λ is the wavelength of light. The numbers represent the different media,
as shown in Figure 8.
However, refraction does not always occur between boundaries, and sometimes total internal reflection occurs
(Figure 9). That means that no light is refracted, and all light is reflected at the boundary. To achieve that,
light has to travel from a medium of a higher refractive index to a lower refractive index, and the angle of
incidence has to be greater than the critical angle; the angle beyond which light will totally internally reflect.
As the angle of reflection is 90° when the angle of incidence is the critical angle, Snell’s Law can be used to
find the critical angle:
𝜃2 = 90° ⇒ sin(𝜃2) = 1
𝑠𝑖𝑛𝜃𝑐𝑟𝑖𝑡
1=
𝑛2
𝑛1⇒ 𝜃𝑐𝑟𝑖𝑡 = arcsin
𝑛2
𝑛1
Figure 8: Diagram for Snell’s
Law (Wikipedia, Snell's Law,
2017)
Figure 9: Total internal reflection for air and water (Wikipedia, Snell's Law, 2017)
P a g e | 9
n) Reflection
Reflection is the change of direction of wave at a boundary, where, relative to a normal that is perpendicular
to the boundary, the angle of incidence is equal to the angle of reflection. This is similar to total internal
reflection, as shown in the third section of Figure 9.
o) Interference
There are two types of wave interferences:
constructive and destructive (Figure 10), and those
occur depending on the “phase”13 of waves.
Constructive interference occurs when two waves
are travelling in the same direction and their peaks
are lined up with each other (i.e. in phase), so the
result is one wave with a greater amplitude14 than
the two initial waves. If the two initial waves have
their peaks exactly lined up, the resultant wave will
have the sum of the amplitudes of the initial waves.
Destructive interference occurs when two waves are
travelling in opposite directions, or two waves are
travelling in the same direction but with the peaks of
one wave lined up with the troughs of the other (i.e.
out of phase). The resultant wave will have a decrease
in amplitude, and complete destructive interference occurs when two waves have their peaks and troughs lined
up. Usually, when wave interference occurs, the waves are not fully in or out of phase to produce complete
constructive or destructive interference, but there is either an increase or decrease in amplitude. Also, it is
important to note that for interference to occur, the waves need to be the same type, so have the same
wavelength if the waves are electromagnetic (GW Optics, n.d.).
p) Multilayer Reflectors
In the exoskeleton, and elytra, of most iridescent beetles,
there are multilayer reflectors, which are also known as
one dimensional photonic crystals (Seago, et al., 2009).
This structure is a stack of about 20 translucent layers
(Deparis, et al., 2008), separated by layers or materials of
a different refractive index (Figure 11). In insects, the
main layers are almost always chitin, and the other layers
are often air, water, or melanin (Parker, et al., 1998).
These chitin layers are secreted during the formation of
the exoskeleton, and for some species these layers have
irregularities on them, which creates air spaces between
the layers of chitin. As light travels through the layers,
some of it is reflected and some is refracted at each
boundary. As different wavelengths of light are refracted
at different angles, different colours will be present at
different angles, and they will interfere with each other.
Some waves of light will reach a boundary at an angle greater than the critical angles, and in these cases total
internal reflection shall occur, meaning that the wave of light is reflected out of the multilayer structure. The
structure will cause certain wavelengths of light to interfere constructively, but cause other wavelengths of
light to interfere destructively, hereby reflecting specific wavelengths more than others.
13 Phase: Whether the waves are lined up with each other in terms of peak and peak or trough and trough. 14 Amplitude: The distance from a peak to a crest of a wave. For light, amplitude is equal to intensity or brightness.
Figure 10: Complete destructive and destructive interference
(GW Optics, n.d.)
Figure 11: Multilayer reflectors (Seago, et al., 2009)
P a g e | 10
As the angle of incidence increases, the distance travelled by light between the layers changes, and this
changes the interference. Shorter wavelengths of light will constructively interfere more, and the other
wavelengths will destructively interfere more, meaning that there is a blue-shift in colour as the angle of
incidence increases.
The colour reflected by a multilayer reflector depends on two variables: refractive indices, and periodicity of
the layers, where periodicity refers to the thicknesses of the layers. λmax, when the angle of incidence is 0°, is
given by the formula:
𝜆𝑚𝑎𝑥 = 2(𝑛𝑎𝑑𝑎+𝑛𝑏𝑑𝑏)
where a and b are the alternating layers in the reflector, n is the refractive index, and d is the layer thickness
(Land, 1972). The greater the number of layers, the better defined λmax will be (Deparis, et al., 2008). For
multilayers with air and chitin, the amplitude of irregularities in the chitin layers will affect the thickness of
the air layers, and hereby affect the colour of light reflected by the structure (Vigneron, et al., 2006).
If the reflector layers are periodic and have a thickness equal to a quarter of the wavelength of visible light,
they are “ideal”; the maximum reflectance, relative to the number of layers, is achieved (Parker, et al., 1998).
This structure is called a “quarterwave stack”, and four times the layer thickness is the wavelength of the
reflected light.
At the bottom of the multilayer reflectors, there is a chitin layer that reflects all wavelengths in order to
increase the intensity of reflected light (Deparis, et al., 2008).
These multilayer reflectors are not always on the outside of the exoskeleton, but can be at different depths, as
shown in Figure 12 (Mason, 1927).
In the C. wallacei, I believe that the multilayer
reflectors will be epicuticular. That is because two
separate studies (Deparis, et al., 2008) (Adachi,
2007) investigated at two different beetles
(Chrysochroa vittata and Chrysochroa
fulgidissima), and both produced SEM images that
indicate that the multilayer reflector is in the
epicuticle for each species (Figure 13). As both the
C. vittata and C. fulgidissima are members of the
same genus as the C. wallacei, they are all closely
related. Therefore, I think that it is very likely that
the location of the multilayer reflector will be in the
epicuticle of the exoskeleton, and therefore elytra,
of the C. wallacei as well. In addition to this,
beetles that produce “diffuse” colours tend to have the reflectors below the epicuticle, so that above layers can
absorb and reflect some light, but the C. wallacei, C. vittata, and C. fulgidissima have bright metallic colours,
which suggests that the reflectors are close to the surface for all three species.
Figure 12: Multilayer reflectors (black and white) at different depths of the insect exoskeleton, based on Seago et al (2009)
Figure 13: SEM image of abdominal exoskeleton of the Chrysochroa
vittata (Deparis, et al., 2008)
P a g e | 11
q) Effect of Environmental Factors
Some environmental factors have been shown to affect certain beetle iridescence. Porous elytra can change
colour with a change in humidity of the surroundings, such as the normally olive coloured Dynastes hercules
beetle that becomes black when in a humid environment (Rassart, et al., 2008). That is because steam enters
its elytra, condenses as water within the porous structure, and hereby changes the refractive indices of some of
the layers, which changes the colour of the elytra.
Adachi (2007) showed that the C. fulgidissima changes colour given changes to the elytron structure. The
colours of the beetle were red-shifted15 after having been immersed in bromoform (CHBr3) for a month at
room temperature, though it regained its normal colours after about a day of air exposure, as the bromoform
evaporated. Because the size of bromoform molecules are considered to be roughly the same as pores in the
surface of the elytra, the molecules are thought to have entered the multilayer structure through those pores.
The multilayer in the C. fulgidissima is thought to have chitin and air as the high and low refractive index
layers, so the air could have been replaced with the bromoform. As this molecule has a refractive index of
1.59, which is far greater than the refractive index of air, there is an increase in the wavelength of the reflected
colours according to λmax equation. This change in colour due to bromoform suggests the multilayer structure
is porous, and strengthens the idea of air being the low index layer within the multilayer. However, there is no
suggestion as to what exact route the bromoform could have taken to penetrate the multilayer structure.
The other experiment in Adachi (2007) looks at the short term effects of heat treatment: whilst the elytron is
heated, there is a blue-shift in colour. From 30°C to 65°C, λmax of the elytra decreases linearly at a rate of -
0.6nm/°C, and the elytra shrank as the temperature increased. The multilayer shrank as well, which again
suggests a porous structure. Elytra were also heated at 200°C for 2 hours, and this resulted in a blue-shift of
about 70nm, though this was only immediately after the heat treatment, and the colour of the elytra did, over
time, become slightly less blue-shifted relative to the original colour. However, the heated elytra did not
eventually return to their original colour, and the final colour they reached after heat treatment was not
measured. In addition to this, the study did not measure the iridescence of elytra, as spectra were collected at a
constant angle of view and illumination.
Previously in the Beetles Project, there was an investigation into the short term effects of heat, and the effect
of sodium hydroxide (NaOH) treatment, on the colour and structure of elytra (Lawrence, 2016). The tests
were on the following species: C. wallacei, Chrysochroa rajah, C. fulgidissima, and Torynorrhina flammea
flammea. As a control, spectral data of coloured paper was collected, and the lack of colour change at different
angles confirmed that only iridescence colours exhibit a change in λmax as the angle of view changes. The heat
treatment tests with an oven showed that the elytra, at a constant angle of view, exhibited a blue-shift in colour
immediately after heat treatment. This blue-shift increased as the elytra were heated at higher temperatures,
though the elytra’s colours started returning to their original colours as soon as they left the oven. However,
similarly to Adachi (2007), the colours did not return to normal even after extended periods of time, and these
final colours were not measured. Another test showed that an elytron, whilst cooling down, exhibits a blue-
shift in colour as the angle of incidence increases, but this could have been down to the fact that the elytron
was cooling down, and either way the spectral richness was not calculated. The NaOH treatment caused a red-
shift in the spectra of the elytra, which, assuming that the NaOH entered the multilayer reflector, could be
because there is an increase in the refractive index of some parts of the structure.
r) Possible Functions of Iridescence in Animals
Although it is impossible to be certain what the use of iridescence is in animals, there are a number of logical
theories, some supported by evidence as well, and reviewed by Doucet & Meadows (2009).
Iridescence could be a form of communication; different species will have different colouration, so
iridescence can be used to identify members of the same species. Sexual dichromatism means that different
genders of the same species differ in colour, with peacocks being a striking example, meaning that iridescence
15 Red shift: an increase in wavelength.
P a g e | 12
can allow individuals to identify the sex of conspecifics.16 With age, colour, and especially structural colour,
can alter, often due to “wear and tear”, meaning that iridescence can be an indicator of age, and hereby
suggest the suitability of a mate. Similarly, iridescence can help with sexual selection; iridescence must be an
advantageous trait, or otherwise it would not exist in animals, meaning that it can aide any potential offspring
with survival, so mates with greater iridescence will be more attractive (Doucet & Meadows, 2009).
A second theory is that iridescence may also be used for the coordination of a group; as iridescence is easier to
notice than pigmented colour, it can be an efficient way to coordinate the movements of a group of animals,
with iridescent patches on animals acting as points of reference for movement for example. Schools of squids
and flocks of birds are thought to possibly use this (Doucet & Meadows, 2009).
The evasion of predators is another theorised use of iridescence, and mimicry is one possibility; iridescent
species may resemble droplets of water on leaves for example. Although the idea of beetle iridescence being
used for camouflage might sound ludicrous at first, many scientists believe that this true. An example of this is
some tiger beetles, as they use a mixture of varying iridescent colours to form an “inconspicuous” colour,
similar to how mixing colourful paints makes brown (Schultz & Bernard, 1989). Iridescence can also be used
as camouflage when the surrounding environment is very colourful, though this is more often seen in aquatic
organisms rather than terrestrial (Doucet & Meadows, 2009).
The C. wallacei could also use its structural colour as camouflage, as its habitat is full of bright green
vegetation. From above, this beetle has a bright green hue that fits in well with the surrounding leaves, so
avian predators will be less likely to spot the beetle. Terrestrial predators will see the beetle from a different
angle, where the background is darker, but as the beetle obtains a darker colour at greater angles due to its
iridescence, the beetle is camouflaged on the ground too. For both avian and terrestrial predators, the beetle is
camouflaged, so iridescence could be a beneficial trait in this situation. However, given the bright metallic
colours of the C. wallacei, I think that the reason for its iridescence is that the increased likelihood of spotting
mates and hereby reproducing outweighs the risks of being spotted more easily by predators.
Prey that are threatened by a predator could use sudden flashes of colour to confuse or scare the predator,
hereby facilitating an escape, and this can efficiently be achieved by iridescence as colours can become very
intense at certain angles. Glare can also be produced using iridescence, and this can hinder the eyesight of the
predator. Similarly, a sudden change in colour or light intensity due to iridescence could affect the predator’s
ability to locate the prey, and this increases the prey’s chances of escape. However, iridescence is not
exclusive to prey, and a predator could use iridescence as well for its advantage (Doucet & Meadows, 2009).
Instead of using iridescence to hide, it can be used as a warning. The conspicuous colours are perfect to
inform potential predators that a species is highly toxic, and not to be eaten. However, some animals can take
advantage of this with Batesian mimicry: namely when a harmless animal imitates a harmful animal. By doing
so, these animals too will be avoided by predators (Doucet & Meadows, 2009).
Fossil records show that iridescence came before the existence of eyes (Parker, 1998), so it must have non-
communitive functions too. Thermoregulation is thought to be a function, and the previously mentioned
Dynastes hercules beetle that darkens in humid conditions is a possible example (Rassart, et al., 2008).
Although this could just be as a result of its elytra structure, thermoregulation is possibly involved.
Instead of being a direct product of evolution, iridescence could in some cases be a by-product of certain
features, such as microstructures that reduce friction in some “burrowing” organisms, water repellent
microstructures, and microstructures that increase or decrease the intensity of light reaching receptors in the
eyes (Wagner, et al., 1996) (Douglas & Marshall, 1999). In addition to this, iridescence in some cases could as
a result of strengthening of an organism; iridescent structures are often stronger than their non-iridescent
counter-parts, and have even been preserved for millions of years (Parker & McKenzie, 2003).
16 Conspecifics: members of the same species.
P a g e | 13
3 Experiment Preparation
a) Preamble and Hypotheses
Adachi (2007) and Lawrence (2016) show that there is a blue-shift in colour for at least some members of the
Chrysochroa genus immediately after being heated at certain temperatures, though the permanent effect on the
colour and spectral richness has not been investigated yet. Therefore, I have come up with the following two
hypotheses regarding these unknowns:
1. As the temperature at which elytra are heated increases, the permanent blue-shift of the elytra relative
to the original colour will increase, until the elytra inevitably burn.
As heating has been shown to cause a blue-shift in the spectra reflected off the elytra, it makes sense to me
that heating at higher temperatures causes more blue-shift.
2. As elytra are heated, their spectral richness will decrease, and this will continue until the elytra burn.
My reasoning for this is that the multilayer reflectors in these beetles have evolved to have a high spectral
richness as it is an advantageous trait, so the structure is likely to be highly tuned. Therefore, I believe that
any disruptions to the structure, such as by heating, are likely to detrimentally affect
the multilayer reflectors, and hereby decrease the spectral richness
b) Summary of Plan
To test these hypotheses, elytron pieces of the C. wallacei
will have spectral data collected before and after heat
treatment, so that any changes in colour can be recorded.
The heat treatment will be carried out using a glass kiln,
and the temperature at which they are heated will increase
until the elytron pieces burn or if the collection of spectral
data is not possible. An SEM will be used to identify any
changes in structure of the elytron pieces. The risk
assessments are in Appendix A.
c) Creating a Spectral Data Protocol
The general set-up of the equipment for the spectral data is a goniometer with two arms; one for the light
source and one for the spectrometer’s receiver (Figure 14, Figure 15). The light source will shine directly at
the elytron piece, which is at the centre of the goniometer, and the reflected spectra of light will be recorded
by the spectrometer. The goniometer allows the angle between the spectrometer and light source to be altered
and measured accurately, hereby making it possible to measure iridescence.
Before my EPQ, there was not a robust
protocol for the collection of spectral data, so
I devised a detailed and valid method for my
project and also for the future of the Beetles
Project. These are the controlled variables that
this method covers:
1. The set-up and position of the
equipment:
o If the elytron piece is facing
exactly at the normal between
the light source and receiver,
the greatest light intensity is
reached by the spectrometer.
However, this optimum angle
Figure 14: Vertical view of equipment.
Figure 15: Diagonal view of equipment. Diagram based on Lambda
Scientific (Lambda Scientific Systems)
P a g e | 14
changes as the angle between the light source and receiver changes, and it would be
impractical to change the angle of the elytron every time the angle of incidence changes, so I
decided that the best set-up is with the elytron sample being perpendicular to the light source,
as this can be accurately achieved with a ruler.
2. The settings on SpectraSuite with which spectral data is collected (Ocean Optics, 2009, p. 62):
o Dark spectrum:17 the dark spectrum of light should be removed so that only the spectra of the
samples are measured.
o Integration time:18 100 milliseconds is appropriate as it resulted in a reasonable sized intensity
peak for normal C. wallacei elytra.
o Scans to average:19 5 scans per average was a compromise between accuracy and delay.
o Boxcar width:20 a boxcar width of 10 provided smoother spectra with little loss in resolution.
3. The distance between the elytron sample and the light source/receiver:
o If the receiver and light source are too close to the elytron sample, they would get in each
other’s way at smaller angles. If the receiver and light source are too far from the sample,
background noise will affect the data more, and less light is picked up by the receiver, which
would reduce the amount of spectral data. After some testing, having the light source and
receiver being extended 4cm from the goniometer’s arms seemed to be a safe and reliable
distance.
4. The angles at which spectral data is collected:
o The smaller the angle of incidence, the greater the light intensity. Therefore, I decided that the
initial angle of incidence should be 10°, as this is the minimum possible angle given the
extension of the arms.
o For the angle increments, I decided that 0.5° is suitable as this allows a large quantity of
accurate data to be collected.
o As the angle of incidence becomes greater, light intensity decreases exponentially, so I
decided that 20° is a good angle to stop at, as the relative intensity peak at this point is almost
a straight line compared to the peak at 10° for a normal C. wallacei elytron piece.
5. The manner in which spectral data is saved:
o Usually spectral data is saved as a SpectraSuite file, which is inconvenient as it is not a
universal file format and makes data analysis difficult. After some experimenting with the
SpectraSuite software, I found out that the raw data of the spectra can be copied and pasted.
This raw data can be inserted into programs such as Excel, which makes data analysis much
easier.
o To ensure that data is backed up and identifiable, I decided that the best thing to do when
spectral data is collected to:
Insert the data into a text document (.txt) with an appropriate description of the data
Insert the data in an Excel sheet.
17 Dark spectrum: the spectrum of light that is present when ambient lighting has been minimised.
18 Integration time: duration that the spectrometer monitors incoming photons; equivalent to a camera’s shutter speed.
The greater the integration time, the greater the intensity of spectra.
19 Scans to average: number of scans that are taken before an average of them is shown as a spectrum. The greater the
average, the greater the time it takes for spectra to be produced, but the effect of background noise is reduced.
20 Boxcar width: a technique that smoothens a spectrum by looking at the adjacent pixels and taking an average. The
greater the boxcar width, the smoother the spectrum, but if the boxcar width is too great then resolution is lost.
P a g e | 15
d) Method for Collecting Spectral Data Below is a summary of the final method for the collection of spectral data, and a more detailed version is
available online (Carey, 2017).
To collect spectral data of the elytra, the following equipment was used:
360° goniometer with 0.5° divisions
Aluminium clamp
Microscope slides
Ocean Optics USB-650 Red Tide Spectrometer (Ocean Optics, Spectrometer)
SpectraSuite Software (Ocean Optics, 2009)
Laptop with Spectrasuite Software
Ocean Optics HL-2000 Tungsten Halogen Light Source (Ocean Optics, Halogen Light Source)
Scissors
Plain paper
Ruler (15cm length)
Screwdriver
Metal wire (1mm diameter)
Voltcraft infrared thermometer (Conrad Electronics)(measures from -30°C to 260°C with accuracy
±2°C)
Binder clip
Control Variables
In order to ensure that the spectral data was only affected by the colour of the elytron pieces, several control
variables were identified:
The light source was kept constant in terms of intensity and wavelength
Ambient lighting was minimised during spectral data collection
The location of the collection of spectral data was constant.
Collection of spectral data for any piece of elytron was done in one sitting to minimise effect of
possible variations in set up
The conditions during the collection of spectral data measured were normal21.
Heated elytra were left to cool for at least several hours, so that short term effects of temperature on
structure, if there are any, would be minimised.
The settings on SpectraSuite with which spectral data was collected, and with which the dark
spectrum was removed, were constant.
21 Normal conditions: The temperature is 10°C-25°C, and other factors such as pressure and humidity are at standard
room conditions.
P a g e | 16
Calibration
Usually the goniometer-spectrometer setup is
calibrated, meaning that most of the light hits
the sample, and light is reflected to the receiver
of the spectrometer, hereby collecting spectral
data. To calibrate the equipment, the light
should be shone directly into the receiver
(Figure 16), and the angle dial should be set to
180°.
Preparing the sample:
Cut the C. wallacei elytron in half using
a ruler to measure and scissors to cut, as
shown in Figure 17.
Place the piece of elytron between two
microscope slides held together by a
binder clip, as shown in Figure 18.
Secure the slides within the clamp by
screwing the clamp. Be careful not to
tighten the screws too much as this may
damage the elytron or the slides.
Calibrating the sample with the goniometer-
spectrometer setup:
Turn on the halogen light source.
Place the clamp into the centre of the goniometer so that the light is shining directly in the middle of
the exposed section of the elytron piece, and tighten the screw on the goniometer to keep the clamp in
position.
Rotate the clamp so that the elytron piece is perpendicular to the light beam, using a ruler to check
whether they are perpendicular.
Checking the temperature:
Ensure that the temperature of elytron is within room temperature (10°C-25°C) using the infrared
thermometer gun.
Removing the dark spectrum:
Insert the USB cable of the spectrometer into a laptop.
On SpectraSuite, set the integration time to 100 milliseconds, scans to average to 5, and boxcar width
to 10.
Turn all the lights in the room off, pull down any blinds on any windows, reduce the screen brightness
of the laptop screen and have the screen facing away from the spectrometer, and pull down the blind
in front of the goniometer-spectrometer setup.
Turn off the light source.
Click on “Store Dark Spectrum”, then click on “Remove Dark Spectrum”.
Figure 16: Diagram based on Holmarc Opto-Mechatronics image
(Holmarc Opto-Mechatronics PVT. LTD.).
Figure 18. Binder clip diagram based on
Clipartfest image (Clipartfest, n.d.).
Figure 17
P a g e | 17
Preparation for collection of spectral data:
Pull up the blind in front of the
equipment, turn on the light source,
and turn on a light in the room.
Rotate the arm of the goniometer on
which the receiver is so that the angle
between the two arms of the
goniometer is 20°.
The spectrum may have a peak that is
greater than the limit of the
spectrometer (4000), or a very small
peak. To adjust the intensity peaks,
the top of the clamp with the elytron
piece can have its angle adjusted in order to increase or decrease the amount of light reflected, hereby
resulting in a different intensity peak. In addition to this, a wire can be used to prop up the elytron
piece against the clamps. The arrangement of the equipment should now be as shown in Figure 19.
Collecting spectral data:
Minimise the lighting in the room.
On SpectraSuite, click “Convert Active Spectrum to Overlay”.
Increase the angle on the goniometer by 1°, turning on any lights if needed.
Repeat this process of until the angle of 39°.
Set the angle of reflection to 40°, but click on “Copy Spectral Data to Clipboard”, as this will copy all
the spectra on the screen, including the active one.
Insert this data into an Excel sheet and a text file with appropriate metadata (e.g. temperature,
SpectraSuite settings, angle range, etc.)
Creating overlays using Excel:
Creating angle of incidence vs relative light intensity peak graphs in Excel:
Insert the code “ =MAX(first cell, last cell) ” under the data, as it will return the maximum value
between “first cell” and “last cell”, so entering the coordinates of a spectrum will return the maximum
relative light intensity.
Paste the angle of incidences above each maximum value, as this allows a graph to be produced by
Excel.
Creating angle of incidence vs λmax in Excel:
Insert the code “ =MATCH(MAX(first cell, last cell), first cell, last cell,0)+349 ” under the data, as it
will look up the maximum value in the column and return the relative position of the item in the
column. 349 is added to the number that is returned because the wavelength of light is shifted up by
349 relative to the numbering of the cells. The 0 in the code specifies that the number being looked up
in the list should be exactly equal to the number that it is looking for. Essentially, this code will return
the wavelength of the most abundant colour of light in the spectrum.
Paste the angle of incidences above each maximum value, as this allows a graph to be produced by
Excel.
Figure 19
P a g e | 18
e) Provisional Heat Treatment Method I needed to create a method for heat treatment and determine whether this heat treatment would result in
something I could investigate, and I was fortunate enough to use the glass kiln of my school’s design
department, which was the Kilncare Hobbyfuser 3 (Kilncare). Three pieces of C. wallacei elytra were heated
with this kiln, where each piece was numbered with marker pen on the underside and placed on a different
intermediate surface in the glass kiln;
Ceramic paper (Creative Glass)
Kiln paper (Warm Glass)
No intermediate
The reason for the different intermediates is to determine which would be most suitable for the elytron pieces.
After heating the elytron pieces to 500°C, all pieces were reduced to a dusty residue, though none fused with
the surface they were in contact with. However, they all left a stain behind, which I later realised was due to
the marker pen on the underside of the elytra. As the kiln paper had turned to dust, which could affect the
colour of elytra, I decided that ceramic paper was the best option as it would absorb some of the stain left
behind from the elytron pieces.
The heating process was carried out during the day so that any hazards would be discovered, and fortunately
none was.
f) Control Tests Control Test 1
To determine whether my method of heat treatment did not
only burn elytron pieces, I heated the C. wallacei elytron
piece B, as shown in Figure 20, to 250°C, and ceramic paper
was the intermediate in the glass kiln. Heat treatment went
well, and as you can see in Figure 21, it resulted in a clear
change in colour of the elytron, and I concluded that my
method of heat treatment is viable for this investigation.
Control Test 2
I realised that there was a need for a control test: will elytra be affected differently when heated to a certain
temperature once as opposed to being heated to lower temperatures several times before then being heated to
the certain temperature?
If there is no difference in effect, then elytra can be reheated to higher
temperatures, and fewer elytra would be used in this investigation, hereby saving
resources. If there is a difference in effect, then different elytra would need to be
used at different temperatures, which would require the use of more resources. In
addition to this, intraspecific variation could result in spectral data not being as
reliable as it could be if the same elytra were reheated.
To find the answer, I devised a control experiment:
1. Spectral data is collected from two elytron pieces (A and B, as shown in
Figure 20)
2. A is heated to 150°C
3. A and B are heated together to 250°C and their spectral data is collected
Figure 20
Figure 21. Elytron pieces A
(control) and B (heated to 250°C).
Figure 22: Elytron pieces A
(heated to 150°C then 250°C)
and B (heated to 250°C)
P a g e | 19
For the heat treatment, the rate of temperature increase was 1000°C/hour, which is the maximum rate of the
glass kiln, so that the amount of time the glass kiln was in use would be reduced. Also, the heating process
was carried out overnight as the kiln was therefore free for use during the day.
This plan was executed and spectral data was collected from both before and after heat
treatment for each piece of elytron, and a picture was taken (Figure 22). However, after
this test it occurred to me that there may be factors skewing the results:
The direct heat of the heating element in the kiln could have excessively heated
the elytron pieces.
The elytron pieces also left stains in the ceramic paper, and this is when it
occurred to me that the marker pen on the underside was affecting the elytron
pieces.
Because of these factors the spectral data is not reliable, and this is what I decided to do to
prevent a repetition of that:
There should be a plate placed above the elytron pieces to prevent the direct
heat of the heating element in the glass kiln from affecting the elytron pieces.
The elytron pieces should not be numbered with marker pen.
Control Test 2 Repeat
To gain some valid spectral data, I decided to repeat control test 2 but with the changes to the method of heat
treatment. Below is the spectral data, and Figure 23 shows the elytron pieces after heat treatment.
It can be seen in Figure 23 that the colour change for the repeat of the control test is different to the first one,
and this is almost definitely due to the plate in the glass kiln preventing the elytra from being heated
excessively, or the marker pen. For both elytron pieces there is a change in colour (Figure 24) after heat
treatment, though after heat treatment the differences in λmax between the elytron pieces A and B appears to
have been exacerbated.
Although the rather small differences between the two heated elytron pieces could have been caused by
random error or by the two elytron pieces simply being different before heat treatment, this control only looks
at two specific temperatures, and different temperatures could have different effects. Therefore, I decided that
it would be better to use a different piece of elytron for each temperature of heat treatment in order to ensure
that my data is as reliable as possible.
Figure 23: Elytron pieces
A (heated to 150°C then
250°C) and B (heated to
250°C)
500
510
520
530
540
550
560
570
9 11 13 15 17 19 21
λ max
(nm
)
Angle of incidence (°)
Control Test 2 Repeat: Colour of different heating
Elytron A before heat Elytron B before heat Elytron A heated twice Elytron B heated once
Figure 24: λmax versus angle of incidence for control elytron pieces and heated elytron pieces.
P a g e | 20
Control Test 3
All the previous tests used spectral data collected only from one section of an
elytron (beetle A in Figure 25), and this meant that a single beetle could only
provide two elytron pieces to work with, and wasting most of the elytra. I wanted
to see if I could reduce waste by experimenting with several sections of the same
elytron, though this would only work if the optical properties of the different
sections of the elytra are identical, otherwise spectral data could be skewed.
Therefore, I came up with a control experiment:
Cut both elytra of a C. wallacei beetle into halves (left elytron of beetle B
in Figure 25) using scissors and ruler.
Collect spectral data of all elytron pieces
Repeat with each elytron cut into three pieces (right elytron of beetle B in
Figure 25)
To save time, the angle of incidence increments for the spectral data was 2° instead of the standard 0.5°. The
tests were applied to one beetle, which hereby reduces the possible effect of intraspecific variation. The
following is the spectral data that I collected:
As shown, the graph indicates that the lower section of the elytron is not to be worked with, as it has different
spectral properties to the other sections of the elytron. One explanation is that the different sections have
different curvatures, meaning that the spectrometer could be facing them at a different angle, and this could
affect the colour of the elytron sections due to their iridescence. This graph suggest that the further apart the
areas of spectral data collection are on the elytron, the greater the difference in spectral data. This conclusion
is backed up by the lines produced for the left elytron pieces of beetle B as they are nearly identical, which
makes sense as the light beams are much closer to each other. Therefore, I decided that spectral data should be
collected from both the upper and lower section of an elytron, as the differences in spectral data are negligible,
and the efficiency of elytron usage will still be increased relative to the previous method.
Figure 25: Location of spectral
data collection on elytra.
525
530
535
540
545
550
555
560
565
9 11 13 15 17 19 21
λ max
(nm
)
Angle of incidence (°)
Control Test 3: Left and right elytra of beetle B
B: bottom left B: top left C: bottom right C: central right C: top right
Figure 26: The angle of incidence against the wavelength of light at the intensity peak for the elytron pieces from beetles B and C.
P a g e | 21
g) Final Heat Treatment Method After the tests and corrections described above, this became the definitive heat treatment method:
Cut a piece of ceramic paper the size of the elytron sample.
Place the elytron sample in the kiln with the ceramic paper as the intermediate.
Secure a plate above the sample by using blocks to keep the plate overhead.
Close the lid and lock the kiln.
Using the KCR2 controller, select program 8 and set rate of climb to the maximum of 1000°C/hour,
set target temperature to your desired temperature, and set the retention time to 30 minutes.
Fire up the kiln and once the temperature inside the kiln is at room temperature, you may remove the
sample.
h) SEM Imaging Method My school was fortunate enough to be able to use the SEM of the St Paul’s School (Barnes, London). The
device (Hitachi, Tabletop Microscope TM3030) was loaned for several weeks at my school, and I had access
to it with the supervision of an adult, Dr Kirby. I used it to find any structural differences between C. wallacei
elytra which were heated and those that were not heated. Before using the SEM though, the elytra samples had
to be prepared.
Heat Treatment and Numbering of Elytra Samples
The elytra of two C. wallacei specimens were cut, numbered, and heated as shown in Figure 28 and Figure 27,
and each elytron was placed in a separate flask.
Freeze Fracturing
In order to be able to view cross sections of the elytra with the
SEM, the elytra needed to be fractured. Cutting elytra with a blade
distorts the structure, resulting in low quality SEM images.
Therefore, the elytron pieces were freeze fractured using liquid
nitrogen, and this was done with the help of Dr Dave Pickup, a
member of the School of Physical Sciences at the University of
Kent (University of Kent). Together with Dr Kirby, we cleaved the
elytron pieces that were frozen with liquid nitrogen. I was not
allowed to help out with the procedure, and a risk assessment
(Appendix B) was produced for the event.
Figure 27: 4 elytra of two C. wallacei beetles, with one
elytron of each beetle heated to 300°C.
Figure 29: Liquid nitrogen being poured into a
box containeng elytra.
Figure 28: The way in which the four elytron pieces were
heated and numbered.
P a g e | 22
The following procedure was carried out by Dr Kirby and Dr Pickup:
Using scissors, a few millimetres of the elytra were cut into to facilitate the cleaving.
Using forceps, elytron pieces were placed into a polystyrene box (Figure 29) for several minutes each
to freeze (Figure 31).
Using plyers and forceps, the elytron pieces were removed from the box and cleaved into smaller
pieces (Figure 30).
Gold Coating
The next step of the preparation was gold coating; this process, also called
sputter coating or sputter deposition (University of Michigan Lurie
Nanofabrication Facility Wiki, n.d.), involves coating a specimen with a
very thin layer of gold, typically up to 50 nm in thickness (Jeol, n.d.). This
layer is so thin that it does not have much of an effect on the surface
morphology of the specimen at the scale the SEM images are being taken,
and the main advantages of gold coating are that it prevents charge build
up, reduces thermal damage, and increases the resolution of images (Leica
Microsystems, 2013).
When the electron beam of the SEM hits a non-conductive specimen, some
electrons are reflected (backscattered) whilst some are absorbed by the
specimen and stay in place as they cannot be conducted. This build-up of
negative particles in one area results in an electric field which deflects the
beam of electrons from the SEM, hereby distorting the images being
produced. Gold coating allows the transfer of electrons through the
specimen, so no charge can be built up (Leica Microsystems, 2013).
Similarly, after gold coating thermal energy can be transferred instead of
accumulating and causing damage to the specimen. As gold is a metal, its
structure is metal cations surrounded and held together by electrons, and
therefore gold reflects more electrons than a non-metal sample. These
backscattered electrons are what are used to produce an image with an
SEM, so more backscattered electrons produce higher resolution images. In
addition to this, electrons will travel less far into the specimen if it is gold
coated, and this means that the SEM images of gold coated specimens will
be less distorted by electrons reflected from within the specimen (Leica Microsystems, 2013).
The gold coating process was done to two elytron pieces from each flask by Dr James Perkins, from St Paul’s
School in London, using the Emitech K575X sputter coater (Quorum Technologies, n.d.). Of the eight gold
coated elytron pieces, four pieces were stuck flat onto a large metal stub using a conductive carbon adhesive
disc (Figure 32), and the other four pieces were placed vertically onto a small metal stub using a conductive
carbon adhesive disc (Figure 33). The conductive adhesive discs prevent the build-up of charge, and a piece of
wire was stuck onto both stubs in order to enable me to deduce the position of each piece of elytron.
Figure 32: Numbering of gold coated
horizonal elytron pieces.
Figure 31: elytron being removed from liquid nitrogen.
Figure 30: Cleaving of elytron.
Figure 33: Vertical gold coated
elytron pieces mounted onto stub.
P a g e | 23
Final Preparations
For a sample to enter the SEM, the stub has to be
screwed onto a vertical stand, and this stand needs to
be adjusted to a specific height. If the height is too
great, the sample will not fit into the vacuum
compartment of the SEM. However, the greater the
height, the greater the resolution of the images. To
achieve the optimum height of the stand, it is slid into
a device with a bar (Figure 34) that is held at the
maximum height for the stand. This process was done
whilst I was wearing gloves in order to minimise
contamination, and once the correct height was
achieved, the sample and the stand were sprayed with
air from a can to remove any contamination.
Initiating the SEM
The stand needs to be placed inside the draw of the
vacuum chamber (Figure 35) of the SEM, and this
needs to be done whilst wearing gloves. Once the
stand is secured, the specimen needs to be sprayed
with air to reduce contamination, and the stand
needs to be positioned in the centre of the
positioning field using the positioning knobs on the
outside of the draw (Section 2 in Figure 36).
The SEM should be turned on using the switch on its side, and the
vacuum pump should be plugged in, and the draw of the vacuum chamber
should be slid closed (section 1 in Figure 36). The “vacuum” button (section
3 in Figure 36) pressed, and this will initiate the formation of a vacuum in
the chamber. To ensure that the chamber is completely sealed, the draw of
the chamber should be being pushed inwards until the pump changes its
tone, indicating that the chamber has been sealed. If the chamber does not
seal, open the draw and whilst wearing gloves, drag your finger across the
sides of the chamber to remove any possible contamination that could have
prevented the formation of a sealed vacuum, and then try forming a vacuum
again.
Capturing Images
On the computer connected to the SEM, the imaging software should be
started, and an interface as shown in Figure 37 should appear.
Figure 36. Image of the TM3030 SEM (St Paul's School, 2015). 1: The vacuum chamber. 2: The
horizontal and vertical positioning knobs. 3: The on/off button for the vacuum.
Figure 35: The vacuum chamber of the SEM.
Figure 34: Device used to optimise the height of the sample
stand.
P a g e | 24
This is the method for capturing SEM images I produced with the guidance of Dr Perkins:
Position the sample using the knobs outside the chamber (section 2 in Figure 36).
Produce appropriate contrast using the “Auto B/C” button.
Focus using the “Auto Focus” button.
Determine magnification using the plus or minus buttons.
Capture an image using the “Save” button, then give a suitable name and store at a suitable location.
There are several modes of image capture, and the mode which produced the best images in my situation was
“COMPO” mode. The viewing mode which I was using most was “Fast” mode, which resulted in high frame
rates but low image resolution, and whenever I wanted to view something at a high resolution without having
to capture an image I would switch to “Slow” mode. This viewing mode resulted in high definition images at
a very low frame rate. The acceleration voltage22 was set to 15kV, as this resulted in the highest resolution
images. Every time an image was captured, this was recorded on paper and each entry contained the following
information:
From which elytron the sample in the image originated.
The number of the picture relative to the number of pictures the SEM has taken.
Whether the picture is of a flat or vertically positioned elytron piece.
The number of the picture relative to the number of pictures there are of the sample elytron piece in
the same position.
Any comments on the image.
22 Acceleration voltage: The energy of the electrons that are used to produce images (MyScope, 2014).
Figure 37: The interface for the SEM.
P a g e | 25
Shutting Down
To finish working with the SEM, the following had to be done:
Click on the “Stop” button.
Remove the vacuum by pressing the button (section 3 in Figure 36)
Turn the on/off switch on the side of the SEM.
4 Final Experiment
a) Control and Heat Treatment Data Using the heat treatment method described earlier, 9 elytron pieces, from C.
wallacei beetles A, B, and C, were heated to temperatures ranging from
100°C to 400°C, as shown in Figure 38. I did now know the age, gender, or
anything else about these beetles other than their species, though I made sure
that the three beetles I chose were as similar as possible. Spectral data was
collected before and after heat treatment with the new method. The
temperatures for heat treatment shown in Figure 38 were based on the
spectra collected, e.g. if there was a large change in spectral data between
two temperatures, I chose a temperature in between. Time restrictions
prevented me from gathering more data, but I have collected sufficient data
to indicate clear correlation.
Several issues did arise. When one of the elytron pieces was heated to
400°C, it appeared to have shrunk, and it had been warped so that it was
curved. Its colour appeared to be charcoal black, though it was shiny as opposed to mat. However, when I
tried to collect spectral data, the elytron piece broke when placed between microscope slides, so I did not
collect any data of this elytron piece. Even if I did manage not to break the elytron, I think it was likely that I
would not collect much spectral as the elytron was so dark.
Clearly, heat treatment at high temperatures can render elytra brittle, so for some heat treated piece of elytra I
attached them to a microscope slide with adhesive tape to prevent breakages, and this allowed spectral data to
be collected from elytron pieces heated to high temperatures.
Another issue was that the light source overheated when the temperature in the room was too great, resulting
in an unsteady beam of light, hereby skewing spectral data. This prevented me from collecting data
sometimes, and the solution was just to wait or ventilate the room.
Other than these two issues, the heat treatment and spectral data collection went smoothly, and enough data
was collected to indicate trends in the change of spectra. As the spectra for the control elytra are nearly
identical, only summary graphs are shown in order to save space. Figure 39 shows the change in colour of the
elytron pieces due to different temperatures of heat treatment.
Figure 38: C. wallacei beetles A, B,
and C with the temperatures their
elytra were heated to.
Figure 39: All the heat treated elytron pieces (left to right: 100°C, 200°C, 230°C, 260°C, 275°C, 285°C, 300°C, and 325°C).
P a g e | 26
0
0.2
0.4
0.6
0.8
1
350 400 450 500 550 600 650 700 750 800 850 900 950 1000
Rel
ativ
e lig
ht
inte
nsi
ty
Wavelength of light (nm)Angle of incidence
Spectra of elytron piece heated to 100°C
20° 19.5° 19° 18.5° 18° 17.5° 17°
16.5° 16° 15.5° 15° 14.5° 14° 13.5°
13° 12.5° 12° 11.5° 11° 10.5° 10°
530
535
540
545
550
555
560
9 11 13 15 17 19 21
λ max
(nm
)
Angle of incidence (°)Elytron piece
Colour of control elytra
Beetle A top left Beetle A top right Beetle A bottom right
Beetle A bottom left Beetle B top left Beetle B top right
Beetle B bottom right Beetle B bottom left Beetle C bottom left
-2 -1.75 -1.5 -1.25 -1 -0.75 -0.5 -0.25 0
Spectral richness (nm/°)
Elyt
ron
pie
ce
Iridescence of control elytra
Beetle C bottom leftBeetle B bottom leftBeetle B bottom rightBeetle B top rightBeetle B top leftBeetle A bottom leftBeetle A bottom rightBeetle A top rightBeetle A top left
Figure 42: λmax for all control elytron pieces from 10° to 20° angle of incidence, with corresponding colour spectrum on the right.
Figure 40: Spectral richness of all control elytron pieces, calculated by working gradient of λmax versus angle of incidence graph
using linear regression.
Figure 41: Normalised spectra, of bottom left elytron piece of beetle A after heat treatment at 100°C.
P a g e | 27
0
0.2
0.4
0.6
0.8
1
350 400 450 500 550 600 650 700 750 800 850 900 950 1000
Rel
ativ
e lig
ht
inte
nsi
ty
Wavelength of light (nm)Angle of incidence
Spectra of elytron piece heated to 200°C
20° 19.5° 19° 18.5° 18° 17.5° 17°16.5° 16° 15.5° 15° 14.5° 14° 13.5°13° 12.5° 12° 11.5° 11° 10.5° 10°
0
0.2
0.4
0.6
0.8
1
350 400 450 500 550 600 650 700 750 800 850 900 950 1000
Rel
ativ
e lig
ht
inte
nsi
ty
Wavelength of light (nm)Angle of incidence
Spectra of elytron piece heated to 260°C
20° 19.5° 19° 18.5° 18° 17.5° 17°16.5° 16° 15.5° 15° 14.5° 14° 13.5°13° 12.5° 12° 11.5° 11° 10.5° 10°
0
0.2
0.4
0.6
0.8
1
350 400 450 500 550 600 650 700 750 800 850 900 950 1000
Rel
ativ
e lig
ht
inte
nsi
ty
Wavelength of light (nm)Angle of incidence
Spectra of elytron piece heated to 230°C
20° 19.5° 19° 18.5° 18° 17.5° 17°16.5° 16° 15.5° 15° 14.5° 14° 13.5°13° 12.5° 12° 11.5° 11° 10.5° 10°
Figure 44: Normalised spectra of bottom right elytron piece of beetle A after heat treatment at 200°C.
Figure 45: Normalised spectra of bottom left elytron piece of beetle C after heat treatment at 230°C.
Figure 43: Normalised spectra of top left elytron piece of beetle B after heat treatment at 260°C.
P a g e | 28
0
0.2
0.4
0.6
0.8
1
350 400 450 500 550 600 650 700 750 800 850 900 950 1000
Rel
ativ
e lig
ht
inte
nsi
ty
Wavelength of light (nm)Angle of incidence
Spectra of elytron piece heated to 285°C
20° 19.5° 19° 18.5° 18° 17.5° 17°
16.5° 16° 15.5° 15° 14.5° 14° 13.5°
13° 12.5° 12° 11.5° 11° 10.5° 10°
0
0.2
0.4
0.6
0.8
1
350 400 450 500 550 600 650 700 750 800 850 900 950 1000
Rel
ativ
e lig
ht
inte
nsi
ty
Wavelength of light (nm)Angle of incidence
Spectra of elytron piece heated to 300°C
20° 19.5° 19° 18.5° 18° 17.5° 17°16.5° 16° 15.5° 15° 14.5° 14° 13.5°13° 12.5° 12° 11.5° 11° 10.5° 10°
0
0.2
0.4
0.6
0.8
1
350 400 450 500 550 600 650 700 750 800 850 900 950 1000
Rel
ativ
e lig
ht
inte
nsi
ty
Wavelength of light (nm)Angle of incidence
Spectra of elytron piece heated to 275°C
20° 19.5° 19° 18.5° 18° 17.5° 17°16.5° 16° 15.5° 15° 14.5° 14° 13.5°13° 12.5° 12° 11.5° 11° 10.5° 10°
Figure 46: Normalised spectra of top left elytron piece of beetle A after heat treatment at 275°C.
Figure 48: Normalised spectra of top right elytron piece of beetle B after heat treatment at 285°C.
Figure 47: Normalised spectra of bottom left elytron piece of beetle B after heat treatment at 300°C.
P a g e | 29
0
0.2
0.4
0.6
0.8
1
350 400 450 500 550 600 650 700 750 800 850 900 950 1000
Rel
ativ
e lig
ht
inte
nsi
ty
Wavelength of light (nm)Angle of incidence
Spectra of elytron piece heated to 325°C
20° 19.5° 19° 18.5° 18° 17.5° 17°
16.5° 16° 15.5° 15° 14.5° 14° 13.5°
420
440
460
480
500
520
540
560
0 100 200 300 400
λ max
(nm
) o
f p
eak
1
Heat treatment temperature (°C)
Peak 1 wavelength for heated elytra at constant angle
-140
-120
-100
-80
-60
-40
-20
0
0 100 200 300 400
Rel
ativ
e ch
ange
in w
avel
engt
h(n
m)
Heat treatment temperature (°C)
Relative colour change of peak 1 at constant angle
400
420
440
460
480
500
520
540
560
9 11 13 15 17 19 21
λ max
(nm
)
Angle of incidence (°)Elytron piece
Colour of peak 1 of heated elytra
Control After 100°C After 200°C After 230°CAfter 260°C After 275°C After 285°C After 300°C
Figure 52: Normalised spectra of top right elytron piece of beetle A after heat treatment at 325°C
Figure 51: λmax of peak 1 for heated elytra. The control line is an average of the control λmax values, and on the right is the colour to
which the wavelengths correspond.
Figure 49: λmax of peak 1 for heated elytra, at 10° angle of
incidence, with corresponding colour spectrum on right.
Control value is average of pre-heat treated λmax values.
Figure 50: λmax for peak 1 at 10° angle of incidence of heat
treated elytra, minus λmax for peak 1 at 10° angle of incidence
for corresponding control elytron.
P a g e | 30
475
525
575
625
675
9 11 13 15 17 19 21
λ max
(nm
) o
f m
ost
inte
nse
pea
k
Angle of incidence(°)Elytron piece
Most abundant colour of heat treated elytra
After 100°C After 200°C After 230°C After 260°C
After 275°C After 285°C After 300°C After 325°C
-2
-1.5
-1
-0.5
0
0.5
1
1.5
100 150 200 250 300 350
Spec
tral
ric
hn
ess
(nm
/°)
Heat treatment temperature (°C)(only for orange line)
Spectral richness of control and heated intensity peaks
Control elytron piece
Same elytron after heat treatment
Figure 53: Spectral richness before and after heat treatment. Values based on gradient of λmax (of most intense peak) versus angle of
incidence using linear regression, though anomalous values were manually removed from this calculation.
475
525
575
625
675
0 50 100 150 200 250 300 350λ max
(nm
) o
f m
ost
inte
nse
pea
kat
10
°an
gle
of
inci
den
ce
Heat treatment temperature (°C)
Most abundant colour of heat treated elytra at constant angle
Figure 54: λmax for heat treated elytron pieces at different angles, where λmax refers to the most intense peak and not necessarily peak 1,
and with the colour bar on the right representing the inferred colours.
Figure 55: λmax for heat treated elytron pieces at 10° angle of incidence, where λmax refers to the most intense peak and not necessarily
peak 1. The data at 0 °C is the average of the λmax for the control elytron pieces, with matching colour bar on right.
P a g e | 31
933
938
943
948
953
958
963
968
9 11 13 15 17 19 21
λ min
in in
frar
ed r
ange
(n
m)
Angle of incidence (°)Elytron piece
λmin within infrared range for all spectra
Before 100°C Before 200°C Before 230°C Before 260°C Before 275°C
Before 285°C Before 300°C Before 325°C Before 400°C After 100°C
After 200°C After 230°C After 260°C After 275°C After 285°C
After 300°C After 325°C
0
20
40
60
80
100
120
140
930 935 940 945 950 955 960 965 970
Freq
uen
cy in
all
spec
tra
λmin in infrared spectrum (nm)
Distribution of λmin within infrared range for all spectra
Figure 56: Wavelength at minimum light intensity (λmin) within the infrared range of spectra, for spectra of all elytron sections at all
angles of incidence, both before and after heat treatment.
Figure 57: Frequency distribution of λmin within the infrared range of all spectra, for spectra of all elytron sections at all angles of
incidence, both before and after heat treatment.
P a g e | 32
b) SEM Images A large number of SEM images were taken, which can be viewed through the Beetles Project website
(www.beetlesproject.weebly.com). Below are some of the more interesting images:
Figure 63: Unclear cross-section of control elytron. Figure 61: Clear cross-section of heated elytron.
Figure 62: Multilayer reflector of control elytron (centre). Figure 60: Multilayer reflector of heated elytron (far right).
Figure 59: Irregularities in chitin layer of the multilayer reflector
in heated elytron (centre left)
Figure 58: Surface of control elytron, with the hexagonal pit
formation highlighted.
P a g e | 33
Figure 69: Surface of control elytron. Figure 68: Surface of heated elytron.
Figure 65: Surface hair and blocked pore of control elytron. Figure 64: Surface hair and open pore of heated elytron.
Figure 67: A large section of the underside of a control elytron
covered by hook structures.
Figure 66: Close up of hook structures on underside of control
elytron piece.
P a g e | 34
c) Analysis of Data Figure 40 shows how λmax for control elytron pieces falls within a relatively narrow range (15 nm at 10° angle
of incidence), with elytron pieces from the same beetle grouped together, and all lines suggest a linear
correlation and hereby support the use of linear regression to estimate spectral richness. This graph suggests
that the colour of the C. wallacei is quite consistent across the elytra of an individual beetle but also for the
species as whole, though more data would need to be collected to be certain. However, λmax from beetle A has
a greater wavelength than the others.
Spectral richness is relatively constant for elytron pieces that originate from the same beetle, and they all
indicate a clear blue-shift in colour as all the spectral richness values are negative (Figure 41). Again, beetle A
has slightly different values. The mean spectral richness of these elytron pieces is -1.4 nm/°, which means that
on average the most abundant colour for these elytron pieces decreases in wavelength by 1.4 nm as the angle
of incidence increases by 1°.
Figure 42 to Figure 49 show the dramatic effect of heat treatment, and these spectra were normalised, meaning
that the relative light intensity is out of 1. These graphs show that as the elytron pieces are heated at higher
temperatures, what was the main peak (peak 1) is decreasing in intensity relative to the peaks on the right,
which appear to be increasing in intensity. Notice that λmax of peak 1 is consistently decreasing (blue-shifting)
relative to the control as the temperature of heat treatment increases, as shown in Figure 50, and the colour
spectrum on the right visualises the large change in colour. The control is the mean λmax of all elytron pieces
before heat treatment.
λmax of peak 1, at 10° angle, is plotted against the temperature at which the elytron piece is heated (Figure 51),
and this shows an apparent exponential relationship between the colour of peak 1 and temperature of heat
treatment. This exponential relationship is supported by Figure 52, where λmax of peak 1, at 10° angle, for the
heated elytron pieces is subtracted from the equivalent control values, hereby showing colour change, relative
to the original colour, at different temperatures of heat treatment. This relative colour change is consistently
negative, so all heat treatment resulted in a blue-shift in colour regardless of the initial colour.
However, despite this consistent blue-shift of peak 1, the overall colour of the elytra did not blue-shift at
certain temperatures; the increase of intensity of other peaks has resulted in a simultaneous blue-shift and red-
shift as heat treatment increases in temperature. These peaks to the right of peak 1 are present at all
temperatures of heat treatment, and even in the control elytra, though their relative intensities for the control
elytra are negligible compared to peak 1. All the peaks are blue-shifting as the temperature of heat treatment
increases, but due to the changes in relative intensity of the peaks, the peaks to the right of peak 1 become the
dominant colours when heat treatment is applied at high temperatures. This is shown in Figure 53 and Figure
Figure 71: heated elytron piece with no gold coating. Figure 70: Hook structures on the underside of control elytron.
P a g e | 35
54, where you can see a blue-shift of the most intense peak, though there is an apparent red-shift after 285°C,
which indicates that the peaks to the right of peak 1 have become dominant.
Working out spectral richness of peak 1 for elytron pieces heated to higher temperatures was not very reliable,
as the intensity of peak 1 decreased so much. Therefore, I decided to work out the spectral richness of
whatever peak was the most intense after heat treatment, and I think that this makes sense as the most intense
peak represents the most abundant colour.
Although locating λmax of the most intense peaks in terms of Excel coding was hard, I did manage to do so,
and Figure 53 shows λmax of incidence for the most intense peak against angle of incidence. The line for the
elytron piece heated to 285°C shows an apparent increase in wavelength after 16°, and I believe this is
anomalous, as the line for the elytron heated to 300°C shows that there clearly is not an increase in
wavelength as the angle of incidence increases. In addition to this, spectra collected at large angles of
incidence tend to be less reliable as the light intensity is so little, and this further suggests that the line for
285°C is partly anomalous. This idea of greater angles being less reliable is backed up by the line for 260°C,
as after 18.5°, λmax decreases massively to 350nm, and I excluded the following data points from the graph to
save space. Although the line for 325°C shows a red-shift too, this may actually be correct as this red-shift is
present at small angles of incidence too, and as the heat treatment temperature is so high, it could have
radically changed the multilayer reflector. However, I would need to collect more data to confirm that.
Using the lines in Figure 53, I worked out the spectral richness of the elytron pieces after heat treatment, and I
removed any data values I thought were obviously anomalous, though I left the data for heat treatment at
325°C alone. Once I worked these spectral richness out, I plotted them against the spectral richness of each
elytron piece before heat treatment, in order to show the relative change (Figure 55). This graph shows that at
all temperatures, except for 100°C and 325°C, these is a decrease in the magnitude of the spectral richness.
Although the amount by which the spectral richness decreases does not appear to be constant, there definitely
is a general decrease in spectral richness. However, at 100°C, there appears to be an increase in spectral
richness, and although this could be down to anomalous data, it is possible that the heat treatment at this low
temperature caused a minor change in the multilayer reflector that actually tuned the structure to become more
iridescent. To confirm that, more data would need to be collected.
What is noticeable in all spectra of all elytron pieces at all angles, both control and heated, is that there is a
trough within the infrared (700-1000nm (Wikipedia, Infrared, 2017)) section of the spectrum. I decided to
look at this trough (λmin), and Figure 56 shows λmin for all spectra. There appears to be no correlation between
elytron section, original beetle, whether an elytron is heated, temperature of heat treatment, and angle of
incidence. However, an increase in the angle of incidence seems to cause an increase in spread of the spectra,
though this is probably down the aforementioned issues with decreased relative light intensity. To better see
the spread of the data, I produced a frequency distribution graph (Figure 57), and this resembles a normal
distribution curve centred at 950nm.
d) Analysis of SEM Images The SEM imaging allowed me to get a fascinatingly in-depth view of the elytra. Unfortunately, the images of
cross-sections of control elytra did not usually result in a clear cut (Figure 58), as opposed to heated elytra,
which almost always resulted in a clean cut (Figure 59), despite the same method of cleaving for both types of
elytra. This suggests that the heated elytra were more brittle, which is backed up by the fact that heated elytra
were much more brittle when I tried to collect spectral data.
The thin layer on the right of the cross-section in Figure 59 is what I believe is the multilayer reflector, and
this is based on the fact that Adachi (2007) and Deparis (2008) worked with other members of the
Chrysochroa genus, and showed that the multilayer is on the outside.
Figure 60 and Figure 61 show the multilayer reflector of control and heat treated elytron pieces respectively,
and if you look closely you can just make out the layers of chitin. What prevented me from getting higher
P a g e | 36
quality images of the multilayer reflectors is resolution, and the fact that the microscope I used is an SEM as
opposed to a TEM23, which are more suited for this type of situation due to the way in which they produce
images. Despite this, many useful images were produced, and the average thickness of the multilayer reflector
for control elytron pieces was approximately 10µm, with the thickness of the heated treated elytron pieces
appearing to be slightly smaller.
One of the images (Figure 62) appears to show the cross-section of the multilayer reflector, and exposes a
lower layer of chitin. This lower layer has surface irregularities, and I think that it is these irregularities that
create air spaces within the multilayer, which ultimately result in iridescence.
The typical control elytron surface contained some of the following:
Hexagonal formation of pits (highlighted in Figure 63), which tended to be 10-15µm wide.
Micropores (5 visible in Figure 63), which were usually 2-3µm wide.
Blocked larger pores (top left in Figure 63), about 40µm wide, and sometimes with extruding hairs
(Figure 66).
I am not sure of the functions of these features, but some of these were affected by heat treatment. The control
elytron pieces tended to have blocked large pores (Figure 64, Figure 66), though after heat treatment most of
these pores opened up (Figure 65, Figure 67). I do not know the functions of these pores, but I think it is likely
that the blocked pores help prevent substances such as water from entering the elytron. Also, once the pores
are opened up by heat treatment, light shining on the elytra will be exposed to a greater area, and more light is
reflected at greater angles given the curved nature of these pores. This could help explain why heated elytra
become less bright when heated.
However, I think that the main reason for the decrease in brightness of heated elytra is the increasing
curvature of the whole elytron, as this causes more light to be reflected at greater angles, hereby decreasing
the intensity light at a given angle.
Accidentally, I looked at the underside of a control elytron piece and I came across something unexpected. I
found fields of hook like structures, each being a few micrometres long (Figure 68, Figure 69, and Figure 70).
I tried finding these structures on the internet, but I could not find any source describing or picturing these
hooks. Therefore, it may be possible that I discovered these, though I cannot be certain. Anyhow, I believe
that these hooks aide the elytra with latching on to the abdomen of the beetle, and hereby improve the rigidity
of the beetle’s posture.
To confirm that gold coating the elytron pieces was necessary, I looked at elytron pieces that were not gold
coated, and some images were produced (Figure 71). All of these images confirm the need for gold coating as
they show how charge is built up within the sample, and how the resolution is low.
5 Conclusions The following are the conclusions that I have come to regarding my data, and these are exclusive to the C.
wallacei species. More data is required for greater certainty, and my personal thoughts are involved.
The wavelength of the most abundant light reflected from the elytra decreases linearly as the angle of
incidence increases.
This is shown by graphs such as Figure 40, and is down to the multilayer reflector structure, as explained in
the review. The mean spectral richness for the control elytra is -1.4 nm/°.
Different sections of the elytra of one beetle have different spectral properties.
23 Transmission electron microscopy: an electron microscope that produces images using electron absorption.
P a g e | 37
The differences in colour (Figure 26, Figure 40, and Figure 41) could just be down to slight variations in
structure of the multilayer reflector. However, this could also be because different sections have different
curvature, and therefore might be facing the spectrometer at a different angle during the collection of spectral
data, which can affect colour given their iridescent nature. Either way, the variations are small.
Different beetles have different spectral properties.
Again, the variations were small, but still present (Figure 40, Figure 41). These may be down to several
factors such as age, gender, or certain events (e.g. abnormal conditions during transportation of samples).
The absorption of infrared radiation in the beetle elytra is caused by a pigment.
As there is no correlation between angle and absorption, the infrared absorption is not due to structural colour
but pigmented colour (Figure 56). Maximum absorption happens at 950nm, though it appears to be normally
distributed (Figure 57). As the absorption still occurred after heat treatment of up to 325°C, this pigment is not
sensitive to these temperatures.
There is blue-shift for all colour peaks of heat treated elytra, and the blue-shift relative to the original
colour increases exponentially as the temperature of heat treatment increases linearly, until the pieces
burn.
This relationship is summarised by Figure 52, and I have a theory to explain that. As the elytra are heated, the
bonds of structural proteins break as there is sufficient energy to overcome them, meaning that these proteins
are denaturing. 24 This is backed up by the fact that the elytra become more brittle when heated, as denatured
proteins will not be able to provide strength and flexibility (Encyclopædia Britannica, 2017). The lack of
structural proteins results in an increased curvature of the elytra as the temperature of heat treatment increases.
The curvature puts pressure on the multilayer reflector, and as there are spaces between some of the layers
within this multilayer, these spaces will decrease in thickness due to the pressure. Using the equation
λmax=2(nada+nbdb) (Land, 1972), a decrease in layer thickness for one of the layers results in a decrease in
wavelength, which explains the blue-shift (Figure 39). As there is an exponential relationship between blue-
shift and temperature, there probably is a similar relationship between protein denaturation and temperature.
However, elytra will simply burn if heated at too high temperatures (e.g. 500°C).
For the spectra of elytra, the intensity of the main peak decreases relative to the other peaks as the
temperature of heat treatment increases, and the spread of the peaks increases.
This is shown by Figure 42 up to and including Figure 49, and is down to the disruption of the multilayer
reflector due to denaturing of proteins, which is as a result of heat treatment. However, after heat treatment at
325°C, there no longer is a peak 1, and I think this is because the chitin layers of the multilayer reflector fused
together, which is possible given that its melting point is about 300°C (Chemical Book, n.d.).
Spectral richness generally decreases after heat treatment.
Except for heat treatment at 100°C, there is a decrease in the absolute value of spectral richness, relative to the
original spectral richness, after heat treatment. This could be because the multilayer reflectors in the C.
wallacei have evolved to be the optimally tuned, and any changes in structure, which could be caused by heat
treatment, will therefore have a detrimental impact on the spectral properties such as spectral richness. The
anomaly at 100°C could be an indicator of an actual increase in magnitude of spectral richness, though more
data would need to be collected to confirm this.
There are hook like structures on the underside of an elytron.
24 Denaturing: a protein breaking down in terms of structure due to external factors such as heat and pH (Encyclopædia
Britannica, 2017).
P a g e | 38
Although these structures are not documented as far as I am aware, they do exist (Figure 68, Figure 69, and
Figure 70) and I believe that their function is to help the elytron stay attached to the abdomen of the beetle.
Gold coating is required to view elytra with an SEM microscope.
Figure 71 shows that without gold coating, charge will build up in a sample, hereby preventing useful images
from being captured and possible damaging the elytron.
6 Evaluation and Acknowledgements I did achieve the aim I set out with, as I did find out what permanent effect heat has on the colour and
iridescence of the C. wallacei elytra, and my work is the first of its kind within the scientific world as far I am
aware. Although the data I have collected does indicate clear trends with high certainty, I would need to
collect more data to be more certain, especially considering the fact that I only tested one elytron piece per
temperature. There is sufficient data to roughly predict the colour that an elytron will take given a
temperature, but this is exclusive to the C. wallacei beetle and to my methods of heat treatment and data
collection, and more data would need to be collected for different species or for a more accurate model. These
could be for future work, and another possibility is trying to artificially manufacture a multilayer reflector and
then see the effects of heat on this structure. Following on from this, there may be industrial applications of
heat treatment on iridescent structures, as it could be used to determine colour in iridescent materials. The
effect of heat treatment could also be investigated in other types of iridescence in beetles, such as diffraction
gratings and three-dimensional photonic crystals In addition to this, the differences in colour between genders
or age groups of beetles could be investigated, and if there are any significant differences then all future work
pertaining to beetle colour should consider this.
This investigation has given me an insight into the scientific world, and has allowed me to learn a multitude of
both useful and interesting information. I now know and understand a great deal when it comes to beetle
iridescence and other related topics. As I plan on embarking on a scientific, and possibly zoological, career,
this project has been of great value for me, and I am sure this will help me further on in my career. One of the
key skills I learnt is data manipulation with Excel, and this was quite challenging considering the fact that I
had never used Excel before this project, and also because I had to analyse hundreds of thousands of unique
pieces of data. In addition to this, I had to meticulously plan, organise, and store content, both physical and
electronical; storing so many numbers and files, and keeping track of dozens of elytra samples. Another key
skill I learnt was referencing, in which I was not competent before. This project also gave me opportunities
that are quite rare for people in my position, such as SEM imaging, gold coating, and using liquid nitrogen.
This project is something I enjoyed doing and something of which I am proud.
There are certain individuals I would like to thank for their great help with my project;
Dr B. Kirby, for running the Beetles Project and for her outstanding help with my project.
I would like to thank Mr R. McMachan, and the rest of the school’s design department, for allowing
me and helping me vastly with the heat treatment of my samples, and my investigation would not
have been possible at all without their help.
Dr J. Perkins, for helping me with the SEM and gold coating the samples.
Professor P. Vukusic, for helping me and other members of the Beetles Project with the
comprehension of beetle iridescence.
Dr D. Pickup, for helping us prepare the samples for use with the SEM using liquid nitrogen.
Dr S. Phythian, for EPQ support and guidance.
P a g e | 39
Appendix A Collecting Spectral Data
Hazard Possible
Consequences
Controls Action if consequences occur Risk
Level
Scalpel Cuts Cut away from yourself
when using the scalpel,
and it should be stored in a
safe location when not in
use.
Wash mild cuts with clean water, apply an
antiseptic wipe, and cover with a plaster.
Seek medical assistance from the school
nurse for severe injuries.
Medium
Glass Cuts from
broken glass
Do not tighten the screws
on the microscope slide
clamp too much, and store
glass safely when not in
use.
Wash mild cuts with clean water, apply an
antiseptic wipe, and cover with a plaster. If
the injury is severe, if there is glass in the
wound, or if there cut is in a sensitive area
such as your eyes, then seek medical
assistance from the school nurse. If broken
glass lying around, remove immediately by
sweeping the affected area.
Medium
Bright
light
Temporary
blindness
Look away from the light
source.
Wait until your vision returns to normal.
Seek medical assistance from the school
nurse if your bad vision persists.
Low
Darkness Falling over
objects.
Clear your surroundings of
hazards. Keep a light
source close to you.
Seek medical assistance from the school
nurse if you sustain a severe injury.
Low
Heat Treatment
Hazard Possible
Consequences
Controls Action if consequences occur Risk
Level
High
temperatures(I)
Burns from
hot objects or
surfaces.
Open the kiln when the
internal temperature is
at room temperature.
Apply cool water to the burnt area and
cover the burnt area with cling film (NHS,
2015). If the burn is severe, seek medical
assistance from the school nurse.
Medium
High
temperatures
(II)
Formation of
fire and
subsequent
injuries.
Keep a fire
extinguisher nearby.
Check on the kiln from
time to time.
Alert a member of staff and extinguish the
fire using the extinguisher unless
instructed not to do so. If the fire is
substantial call the emergency services. As
no fires developed during control tests of
up to 500°C, the chances of anything
happening are quite low.
Low
SEM imaging
Hazard Possible
Consequences
Controls Action if consequences occur Risk
Level
Liquid
nitrogen
Asphyxia and
cold burns.
Wear goggles, carry out the
work in a large and well
ventilated room, wear
cryogenic gloves if handling
any cold equipment, and use
forceps to hold any frozen
objects. Any non-adults
should be no closer than 1
meter to the liquid nitrogen.
Administer CPR if someone is not
breathing, and put them in the
recovery position if they are
breathing. Call emergency services
either way. Apply lukewarm water to
cold burns, then apply a sterile
dressing (University of Sussex, n.d.).
Seek medical attention if the burn is
severe.
High
Elytra
fracturing
Eye injuries from
shards of elytra.
Wear goggles. Seek medical attention if the shard of
elytron causes an injury to the eye.
Low
P a g e | 41
Bibliography (Nota bene: n.d. means no date)
Adachi, E., 2007. Unexpected Variability of
Millennium Green: Structural. Journal of
Morphology, Volume 268, pp. 826-829.
Boston University, 1998. Refraction, Snell's law,
and total internal reflection. [Online]
Available at:
http://buphy.bu.edu/py106/notes/Refraction.html
[Accessed 2 July 2017].
Carey, I., 2017. Spectral Data Protocol. [Online]
Available at:
http://beetlesproject.weebly.com/spectral-data-
protocol.html
[Accessed 3 May 2017].
Chemical Book, n.d. 1398-61-4(Chitin) Product
Description. [Online]
Available at:
http://www.chemicalbook.com/ChemicalProductPr
operty_US_CB9853096.aspx
[Accessed 9 July 2017].
Clipartfest, n.d. [Online]
Available at:
https://img.clipartfest.com/7cccfa73fea6c3b07a2d
43388dcbfbe7_binder-clips-vector-art-binder-clip-
clipart_426-403.jpeg
[Accessed 3 April 2017].
Coleoptera Atlas, n.d. Chrysochroa wallacei.
[Online]
Available at: http://www.coleoptera-
atlas.com/buprestidae-
buprestoidea/chrysochroinae/chrysochroini/chryso
chroa-chrysochroina/Chrysochroa-wallacei
[Accessed 2017].
Conrad Electronics, n.d. Voltcraft IR 260-8S
Infrared Thermometer. [Online]
Available at: http://www.conrad-
electronic.co.uk/ce/en/product/100980/Voltcraft-
IR-260-8S-Infrared-Thermometer-Optics-81-30-
to-260-C
[Accessed 5 April 2017].
Creative Glass, n.d. Ceramic Fibre Paper.
[Online]
Available at:
http://www.creativeglassshop.co.uk/product/35150
/ceramic-fibre-paper-1mm-roll-10x1m.html
[Accessed 13 April 2017].
Deparis, O. et al., 2008. Structurally tuned
iridescent surfaces inspired by nature. New Journal
of Physics, Volume 10.
Doucet, S. M. & Meadows, M. G., 2009.
Iridescence: a functional perspective. The Royal
Society Interface, 6(2).
Douglas, R. & Marshall, N., 1999. A review of
vertebrate and invertebrate ocular filters. In: S.
Archer, et al. eds. Adaptive Mechanisms in the
Ecology of Vision. New York: Springer
Netherlands, pp. 95-162.
Encyclopædia Britannica, 2017. Denaturation.
[Online]
Available at:
https://www.britannica.com/science/denaturation
[Accessed 8 July 2017].
GW Optics, n.d. Interferometery. [Online]
Available at:
http://www.gwoptics.org/ebook/interferometers.ph
p#
[Accessed 1 July 2017].
Hitachi, Tabletop Microscope TM3030, n.d.
[Online]
Available at: http://www.hitachi-
hightech.com/eu/product_detail/?pn=em-
tm3030&version=
[Accessed 5 April 2017].
Holmarc Opto-Mechatronics PVT. LTD., n.d.
Holmarc Opto-Mechatronics. [Online]
Available at:
http://www.holmarc.com/spectrometer_goniomete
r_2.php
[Accessed 11 January 2017].
Hunt, T., Bergsten, J. & Papadopoulou, A., 2007.
A comprehensive phylogeny of beetles reveals the
evolutionary origins of a superradiation. Science,
318(5858), pp. 1913-1916.
Jeol, n.d. Sample Coating for SEM. [Online]
Available at:
http://www.jeolusa.com/DesktopModules/Bring2
P a g e | 2
mind/DMX/Download.aspx?EntryId=1054&Com
mand=Core_Download&language=en-
US&PortalId=2&TabId=344
[Accessed 6 April 2017].
Kilncare, n.d. Hobbyfuser. [Online]
Available at:
http://www.kilncare.co.uk/kilns_glass_fusingandsl
umping_thehobbyfuser.html
[Accessed 5 April 2017].
Lambda Scientific Systems, n.d. LEOI-98
Intermediate Spectrometer Goniometer. [Online]
Available at:
http://lambdasys.com/products/detail/432
[Accessed 24 June 2017].
Land, M. F., 1972. The physics and biology of
animal reflectors. Progress in Biophysics and
Molecular Biology, Volume 24, pp. 75-106.
Lawrence, E., 2016. Extended Project
Qualification: How do physical changes in the
environment affect the iridescence of a beetle?.
s.l.:s.n.
Leica Microsystems, 2013. Brief Introduction to
Coating Technology for Electron Microscopy.
[Online]
Available at: http://www.leica-
microsystems.com/science-lab/brief-introduction-
to-coating-technology-for-electron-microscopy/
[Accessed 7 April 2017].
Mason, C. W., 1927. Structural Colors in Insects.
III. J. Phys. Chem., Volume 31, pp. 1856-1872.
MyScope, 2014. Acceleration voltage vs. specimen
type. [Online]
Available at:
http://www.ammrf.org.au/myscope/sem/practice/pr
inciples/voltagevstype.php#term
[Accessed 9 July 2017].
NHS, 2015. How do I deal with minor burns?.
[Online]
Available at:
http://www.nhs.uk/chq/Pages/1047.aspx?Category
ID=72
[Accessed 8 April 2017].
Ocean Optics, Halogen Light Source, n.d. HL-
2000 Family. [Online]
Available at: https://oceanoptics.com/product/hl-
2000-family/
[Accessed 5 April 2017].
Ocean Optics, Spectrometer, n.d. USB-650 Red
Tide Spectrometers. [Online]
Available at: https://oceanoptics.com/product/usb-
650-red-tide-spectrometers/
[Accessed 5 April 2017].
Ocean Optics, 2009. SpectaSuite Software.
[Online]
Available at: https://oceanoptics.com/wp-
content/uploads/SpectraSuite.pdf
[Accessed 2017].
Parker, A. R., 1998. Colour in Burgess Shale
animals and the effect of light on evolution in the
Cambrian. The Royal Society, 265(1400).
Parker, A. R., 2000. 515 million years of structural
colour. Journal of Optics A: Pure and Applied
Optics, 2(6).
Parker, A. R. & McKenzie, D. R., 2003. The cause
of 50 million-year-old colour. The Royal Society,
270(2).
Parker, A. R., McKenzie, D. R. & Large, M. C. J.,
1998. MULTILAYER REFLECTORS IN
ANIMALS USING GREEN AND GOLD
BEETLES AS. Journal of Experimental Biology,
Volume 201, pp. 1307-1313.
Parks Canada, 2017. Beetle Anatomy. [Online]
Available at: https://www.pc.gc.ca/en/docs/v-
g/dpp-mpb/sec2/dpp-mpb2c
[Accessed 25 June 2017].
Pearson, 2008. Linear regression. In: Edexcel AS
and A Level Modular Mathematics - Statistics 1.
s.l.:s.n.
Quorum Technologies, n.d. K575X Sputter Coater.
[Online]
Available at:
https://www.quorumtech.com/__assets__/pdf/Man
uals/K575X-Manual-Iss11-NEW-LOGO.pdf
[Accessed 18 April 2017].
Rassart, M., Colomer, J.-F., Tabarrant, T. &
Vigneron, J. P., 2008. Diffractive hygrochromic
effect in the cuticle of the hercules beetle Dynastes
hercules. New Journal of Physics, Volume 10.
P a g e | 3
Schultz, T. D. & Bernard, G. D., 1989. Pointillistic
mixing of interference colours in cryptic tiger
beetles. Nature, Volume 337, pp. 72-73.
Seago, A. E., Brady, P., Vigneron, J.-P. & Schultz,
T. D., 2009. Gold bugs and beyond: a review of
iridescence and structural colour mechanisms in
beetles (Coleoptera). The Royal Society, 6(2).
St Paul's School, 2015. Electron Micoscopy.
[Online]
Available at:
http://intranet.stpaulsschool.org.uk/physics/student
s/electron-microscopy
[Accessed 12 April 2017].
St. Paul's School, n.d. [Online]
Available at: http://www.stpaulsschool.org.uk/
University of Kent, n.d. [Online]
Available at: https://www.kent.ac.uk/
University of Michigan Lurie Nanofabrication
Facility Wiki, n.d. Sputter Deposition. [Online]
Available at: http://lnf-
wiki.eecs.umich.edu/wiki/Sputter_deposition
[Accessed 8 April 2017].
University of Sussex, n.d. Cryogenic Burns.
[Online]
Available at:
http://www.sussex.ac.uk/gdsc/intranet/safety_regs/
cold_burns
[Accessed 8 April 2017].
Vigneron, J. P. et al., 2006. Spectral filtering of
visible light by the cuticle of metallic woodboring
beetles and microfabrication of a matching
bioinspired material. Physical Review E, 73(4).
Vukusic, P., Sambles, J. R., Lawrence, C. R. &
Wootton, R. J., 1999. Quantified interference and
diffraction in single Morpho butterfly scales.
Proceedings. Biological Sciences, Volume 266,
pp. 1403-1411.
Wagner, T., Neinhuis, C. & Barthlott, W., 1996.
Wettability and Contaminability of Insect Wings
as a Function. Acta Zoologica, 77(3), pp. 213-225.
Warm Glass, n.d. Thinfire Paper. [Online]
Available at: https://www.warm-
glass.co.uk/thinfire-paper-p-2532.html
[Accessed 13 April 2017].
Wikipedia, Chitin, 2017. [Online]
Available at: https://en.wikipedia.org/wiki/Chitin
[Accessed 25 June 2017].
Wikipedia, Infrared, 2017. [Online]
Available at: https://en.wikipedia.org/wiki/Infrared
[Accessed 8 July 2017].
Wikipedia, Light, 2017. [Online]
Available at: https://en.wikipedia.org/wiki/Light
[Accessed 25 June 2017].
Wikipedia, Pigment, 2017. [Online]
Available at:
https://en.wikipedia.org/wiki/Pigment
[Accessed 25 June 2017].
Wikipedia, Refraction, 2017. [Online]
Available at:
https://en.wikipedia.org/wiki/Refraction
[Accessed 8 April 2017].
Wikipedia, Snell's Law, 2017. [Online]
Available at:
https://en.wikipedia.org/wiki/Snell%27s_law
[Accessed 2 July 2017].