20
WHAT PRICE A LIVING WAGE? Understanding the impact of a living wage on firm-level wage bills Matthew Pennycook May 2012 © IPPR, Resolution Foundation 2012 IPPR & Resolution Foundation

WHAT PRICE A LIVING WAGE?Understanding the impact of a living wage on firm-level wage bills
Matthew Pennycook
May 2012 © IPPR, Resolution Foundation 2012
IPPR & Resolution Foundation

ABOUT THE AUTHORMatthew Pennycook is a senior research and policy analyst at the Resolution Foundation.
ACKNOWLEDGMENTSThis research is made possible by the generous support of Trust for London and the TUC. Thanks to Kayte Lawton, Tony Dolphin, Alan Manning, Howard Reed, David Wilkinson, Mubin Haq and Paul Sellers for their contributions to this paper.
ABOUT IPPR
IPPR, the Institute for Public Policy Research, is the UK’s leading progressive thinktank. We produce rigorous research and innovative policy ideas for a fair, democratic and sustainable world.
We are open and independent in how we work, and with offices in London and the North of England, IPPR spans a full range of local and national policy debates. Our international partnerships extend IPPR’s influence and reputation across the world.
IPPR 4th Floor, 14 Buckingham Street London WC2N 6DF T: +44 (0)20 7470 6100 E: [email protected] www.ippr.org Registered charity no. 800065
This paper was first published in May 2012. © 2012 The contents and opinions expressed in this paper are those of the author only.
ABOUT THE RESOLUTION FOUNDATIONThe Resolution Foundation is an independent research and policy organisation.
Our goal is to improve the lives of people with low to middle incomes by delivering change in areas where they are currently disadvantaged. We do this by:• undertaking research and economic analysis to understand
the challenges facing people on a low to middle income• developing practical and effective policy proposals• engaging with policymakers and stakeholders to influence
decision-making and bring about change.
Resolution Foundation 23 Savile Row London W1S 2ET T: +44 (0)20 3372 2960 E: [email protected] www.resolutionfoundation.org Registered charity no. 1114839

What price a living wage? Understanding the impact of a living wage on firm-level wage bills1 IPPR and RESOLUTION FOUNDATION
CONTENTS
Executive summary ____________________________________________ 2
Introduction _________________________________________________ 4
Measuring the cost of a living wage on firm-level wage bills ____________ 7Wage ‘spillover’ effects 9Potential benefits to business of paying a living wage 9Bearing the cost of living wage implementation 9
Average firm-level wage bill cost of a living wage ____________________ 11
Conclusion __________________________________________________ 12
References ___________________________________________________ 13
Appendix 1: Methodology ______________________________________ 14
Appendix 2: Accounting for wage spillover effects ___________________ 17
What price a living wage? Understanding the impact of a living wage on firm-level wage bills2 IPPR and RESOLUTION FOUNDATION
EXECUTIVE SUMMARYThe concept of a ‘living wage’ has gained traction across the political spectrum in recent years. Following the success of the first contemporary living wage campaign in the UK, launched in east London in 2001, a series of local and regional initiatives has delivered tangible improvements in pay for thousands of low-paid workers. More widely, the publicity surrounding the concept of a living wage has contributed to an important reframing of perspectives around low pay and in-work poverty, focusing attention on the role that decent pay above the national minimum can play – alongside remedial redistribution through tax credits and in-work benefits – in raising living standards.
Yet despite a number of high-profile successes, relatively few workers have secured a higher wage as a result of a living wage campaign. In London in 2010, an estimated 652,000 workers were earning less than the London living wage,1 yet only around 10,000 workers won a living wage in the six years between 2005 and 2011.2 The number of accredited living wage employers – primarily high-profile financial and legal firms, including prominent names such as KPMG and Barclays, and public sector bodies – remains small. Aside from a handful of notable exceptions (such as the cosmetics retailer Lush) relatively few companies in retail, food service or the travel and tourism sectors, which account for the bulk of low-wage jobs, have become living wage employers.
An obvious barrier to expanding living wage coverage is a concern on the part of many employers that a living wage entails prohibitive costs. Yet the potential wage bill costs associated with a living wage, and how these may vary across sectors, are not well understood. This report provides, for the first time, estimates of the wage bill increases that UK companies listed on the London stock exchange across a range of key sectors might expect if they made the decision to pay their directly employed staff3 a living wage (£8.30 per hour in London and £7.20 per hour elsewhere). In doing so, it aims to enable a more informed discussion about the potential cost of a living wage across different sectors.
The results make clear that the cost of a living wage varies widely across industries. While there will of course be differences between firms within particular sectors, the estimates make clear that for listed firms in construction, software and computing, banking, and food production, average wage bill increases as a result of implementing a living wage are small (around 1.0 per cent or less). For listed firms in these sectors there is, therefore, a strong case for implementing a living wage as a matter of course.
The estimates also make clear that a living wage will be more challenging, but not impossible, for listed firms in the major low-wage sectors – general retail, food and drug retail, and bars and restaurants – where average wage bill increases are significant (between 4.7 and 6.2 per cent). However, average wage bill increases are far smaller in these sectors if an initial hourly pay rate
1 Resolution Foundation analysis of pooled four-quarter Labour Force Survey data, 2010.2 See Wills 2011. This figure relates only to workers in accredited living wage employers and may
underestimate the numbers covered by living wage arrangements where employers have decided to pay a living wage but have not been accredited.
3 In only taking account of directly employed staff, the analysis presented here overlooks the issue of subcontracted staff. Subcontracted employment is now commonplace across a range of service, distribution and manufacturing sectors, and for this reason most living wage campaigns have sought to bring subcontracted staff within the remit of any wage agreement. In omitting subcontracted staff, this analysis simply measures the cost to the employer’s wage bill, not the increase on total costs that would accrue to the employer if they sought to use their position at the head of the supply chain to ensure subcontracted workers were brought within the remit of a living wage agreement.

What price a living wage? Understanding the impact of a living wage on firm-level wage bills3 IPPR and RESOLUTION FOUNDATION
of 90 per cent of a full living wage (£7.47 in London and £6.48 elsewhere) is introduced rather than the full rate (between 2.0 and 2.6 per cent). This suggests that for listed firms in these sectors there may be merit in exploring living wage accreditation by means of phased increases over time in order to reduce upfront costs and provide time to modify business models.
This paper will inform the joint Resolution Foundation and IPPR project on the living wage, ‘Beyond the bottom line’, which will report later this year.
What price a living wage? Understanding the impact of a living wage on firm-level wage bills4 IPPR and RESOLUTION FOUNDATION
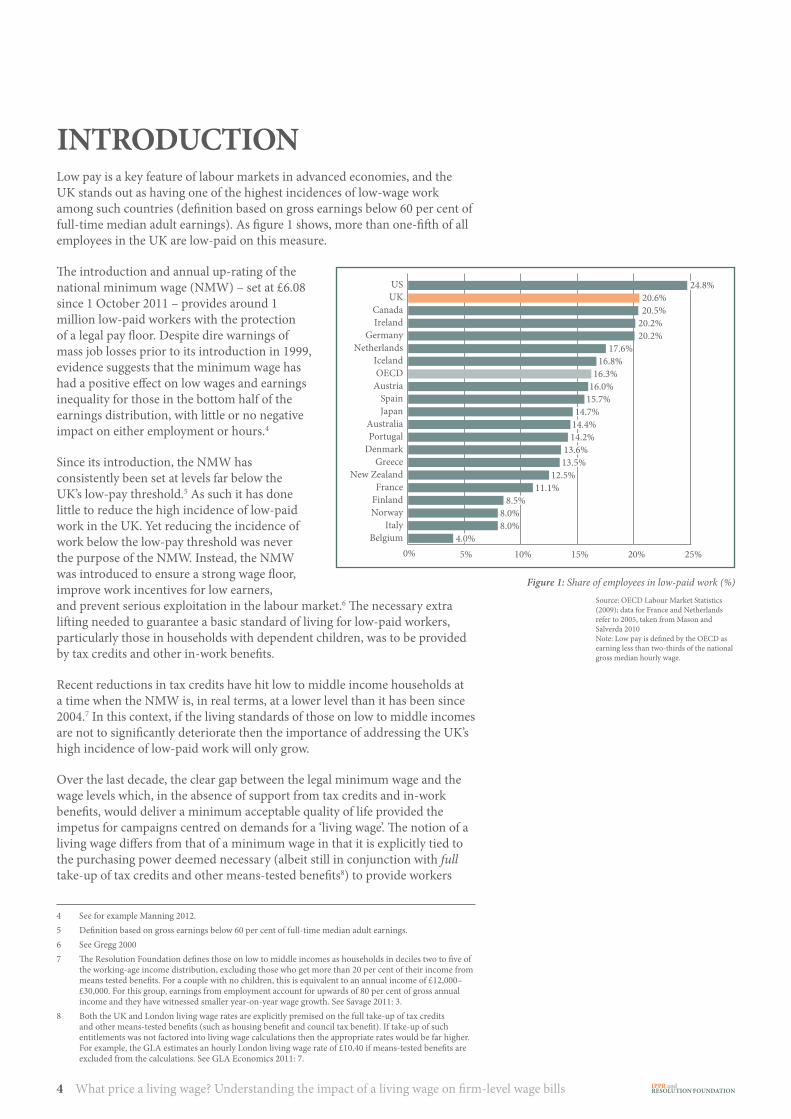
INTRODUCTION Low pay is a key feature of labour markets in advanced economies, and the UK stands out as having one of the highest incidences of low-wage work among such countries (definition based on gross earnings below 60 per cent of full-time median adult earnings). As figure 1 shows, more than one-fifth of all employees in the UK are low-paid on this measure.
The introduction and annual up-rating of the national minimum wage (NMW) – set at £6.08 since 1 October 2011 – provides around 1 million low-paid workers with the protection of a legal pay floor. Despite dire warnings of mass job losses prior to its introduction in 1999, evidence suggests that the minimum wage has had a positive effect on low wages and earnings inequality for those in the bottom half of the earnings distribution, with little or no negative impact on either employment or hours.4
Since its introduction, the NMW has consistently been set at levels far below the UK’s low-pay threshold.5 As such it has done little to reduce the high incidence of low-paid work in the UK. Yet reducing the incidence of work below the low-pay threshold was never the purpose of the NMW. Instead, the NMW was introduced to ensure a strong wage floor, improve work incentives for low earners, and prevent serious exploitation in the labour market.6 The necessary extra lifting needed to guarantee a basic standard of living for low-paid workers, particularly those in households with dependent children, was to be provided by tax credits and other in-work benefits.
Recent reductions in tax credits have hit low to middle income households at a time when the NMW is, in real terms, at a lower level than it has been since 2004.7 In this context, if the living standards of those on low to middle incomes are not to significantly deteriorate then the importance of addressing the UK’s high incidence of low-paid work will only grow.
Over the last decade, the clear gap between the legal minimum wage and the wage levels which, in the absence of support from tax credits and in-work benefits, would deliver a minimum acceptable quality of life provided the impetus for campaigns centred on demands for a ‘living wage’. The notion of a living wage differs from that of a minimum wage in that it is explicitly tied to the purchasing power deemed necessary (albeit still in conjunction with full take-up of tax credits and other means-tested benefits8) to provide workers
4 See for example Manning 2012.5 Definition based on gross earnings below 60 per cent of full-time median adult earnings.6 See Gregg 20007 The Resolution Foundation defines those on low to middle incomes as households in deciles two to five of
the working-age income distribution, excluding those who get more than 20 per cent of their income from means tested benefits. For a couple with no children, this is equivalent to an annual income of £12,000–£30,000. For this group, earnings from employment account for upwards of 80 per cent of gross annual income and they have witnessed smaller year-on-year wage growth. See Savage 2011: 3.
8 Both the UK and London living wage rates are explicitly premised on the full take-up of tax credits and other means-tested benefits (such as housing benefit and council tax benefit). If take-up of such entitlements was not factored into living wage calculations then the appropriate rates would be far higher. For example, the GLA estimates an hourly London living wage rate of £10.40 if means-tested benefits are excluded from the calculations. See GLA Economics 2011: 7.
20% 25%15%5%0% 10%
USUK
CanadaIreland
GermanyNetherlands
IcelandOECD
AustriaSpainJapan
AustraliaPortugal
DenmarkGreece
New ZealandFrance
FinlandNorway
ItalyBelgium
24.8%20.6%20.5%
20.2%20.2%
17.6%16.8%
16.3%16.0%
15.7%14.7%
14.4%14.2%
13.6%13.5%
12.5%11.1%
8.5%8.0%8.0%
4.0%
Figure 1: Share of employees in low-paid work (%)Source: OECD Labour Market Statistics (2009); data for France and Netherlands refer to 2005, taken from Mason and Salverda 2010 Note: Low pay is defined by the OECD as earning less than two-thirds of the national gross median hourly wage.

What price a living wage? Understanding the impact of a living wage on firm-level wage bills5 IPPR and RESOLUTION FOUNDATION
and their families with a basic but acceptable standard of living rather than to estimates of what the market can bear without impacting on employment. Since May 2011, the Greater London Authority has set the London living wage rate at £8.30 per hour; academics at the Centre for Research in Social Policy at Loughborough University have calculated a separate rate for the rest of the UK, at £7.20 per hour. Both of these rates have gained widespread acceptance.9
Figure 2 shows both living wage rates, alongside other selected pay thresholds, and the proportion of jobs potentially affected.
Few living wage activists call for a mandatory living wage pay floor across the economy. Instead, most campaigners have chosen to ground their case for a living wage in appeals to ethical business best practice and anecdotal evidence of the potential benefits to business of paying low-paid workers a higher wage.10 On the basis of this approach, a number of employers, ranging from high-profile legal and financial firms to an expanding number of local authorities, have adopted a living wage over the course of the last decade and in so doing secured tangible improvements in pay for thousands of low-paid workers.
The interest generated by these initiatives has put the concept of a living wage firmly on the political agenda. In 2010, David Cameron responded to mounting awareness by pronouncing the living wage an idea ‘whose time has come’11 and Labour leader Ed Miliband has spoken of the potential of living wage initiatives to make Britain a ‘fairer and more prosperous place’.12 More widely, the publicity surrounding the living wage has contributed to an important reframing of perspectives around low pay and in-work poverty, focusing wider attention on the role that decent pay above the national minimum can play – alongside remedial redistribution through tax credits and in-work benefits – in raising living standards.
Yet despite a small number of high-profile successes, relatively few workers have secured a higher wage as a result of a living wage initiative. There are an estimated 652,000 workers in London earning less than the London living wage,13 yet only around 10,000 London workers won a living wage in the six years between 2005 and 2011 (Wills 2011).14 And while successful living wage campaigns and initiatives in other regions have also delivered higher wages for thousands of workers, there is little evidence to suggest that they have secured living wages for a substantial proportion of low-paid workers.
Within the workforces of current living wage employers, the numbers of directly employed staff that have benefited from an increased wage are
9 For details of the calculation method used by the GLA, see GLA Economics 2011. For details of the calculation method used by Loughborough University’s Centre for Research in Social Policy, see Hirsch and Moore 2011.
10 Supply-side benefits identified have included productivity increases associated with higher effort, cost savings on recruitment and induction training, reduced absenteeism, lower staff turnover, improved worker morale, motivation and commitment, and reputational benefits. See GLA Economics 2009.
11 Cited for example at http://uk.reuters.com/article/2010/05/04/uk-britain-election-rally-idUKTRE64259C20100504
12 See more at http://livingwage.edmiliband.org/13 Resolution Foundation analysis of pooled four-quarter Labour Force Survey data, 2010.14 This figure relates only to workers in accredited living wage employers and may underestimate the
numbers covered by living wage arrangements where employers have decided to pay a living wage but have not been accredited.
4.5%
4.0%
3.5%
3.0%
2.5%
2.0%
1.5%
1.0%
0.5%
0.0%£25£20£15£10£5£0 £30
National minimum wage (2010): £5.93
UK living wage (2011): £7.20
London living wage (2010): £7.85
Low-pay threshold (OECD): £8.38
6 per cent of jobs accrue hourly wages of £30+
Figure 2: Distribution of hourly pay and selected pay thresholds, UK, 2010 (% of total jobs)Source: Low Pay Commission estimates based on ASHE 2010 data Note: A national living wage rate (£7.20 per hour) was first calculated in 2011 and so is used in the absence of an earlier 2010 figure. The small proportion of jobs below the NMW includes legitimate exceptions (16–17 year old rate and apprentice rate), non-compliance and a degree of measurement error.

What price a living wage? Understanding the impact of a living wage on firm-level wage bills6 IPPR and RESOLUTION FOUNDATION
often comparatively small. Subcontracted low-paid employment is now commonplace across a range of service, distribution and manufacturing sectors and, while living wage campaigners have sought to bring subcontracted staff within the remit of any wage agreement, it is often challenging to ensure that a living wage is applied throughout the supply chain. Many of the high-profile financial and legal firms which have made the decision to implement a living wage require relatively small numbers of subcontracted staff and the cost of implementation for them is often minimal, especially weighed against the reputational benefits that living wage accreditation delivers. In contrast, aside from a handful of notable exceptions, relatively few companies in retail, food service or the travel and tourism sectors – accounting for the bulk of low-wage jobs – have become living wage employers. For employers in these sectors, appeals to ethical business best practice and the ostensible and much publicised benefits of paying employees a living wage are seemingly outweighed by ongoing concerns about their capacity to absorb the additional costs that a living wage entails.

What price a living wage? Understanding the impact of a living wage on firm-level wage bills7 IPPR and RESOLUTION FOUNDATION
MEASURING THE COST OF A LIVING WAGE ON FIRM-LEVEL WAGE BILLSWhile there is no definitive evidence as to whether the imposition of a mandatory living wage pay floor across the economy would impact on employment, working hours or terms and conditions, many economists believe that a legislative pay floor set at this rate would have a negative impact. However, few living wage activists advocate the imposition of a mandatory pay floor of this kind. Instead, living wage campaigners have chosen, in the main, to target their campaigns at medium and large employers susceptible to appeals to ethical business best practice and deemed able to absorb the potential costs of implementing a living wage.
However, the potential wage costs associated with a living wage, and how these might vary across sectors, are not well understood. The Low Pay Commission estimated the annual aggregate increase in the wage bill as a result of the introduction of the NMW to be around 0.25 per cent, assuming no change in pay differentials, or around 0.35 per cent if differentials are taken into account (LPC 2001: 52). Yet the mandatory nature of the NMW means it is an imperfect guide to the potential impact of a higher wage floor which would be adopted on a voluntary basis by individual large and medium-sized businesses. And while a small number of such firms have already adopted a living wage, either proactively or as a result of targeted campaigning, their numbers are limited and their distinct profile makes it difficult to assess whether the costs of paying a living wage are feasible for a wider range of firms across different industrial sectors and varying business models.
The aim of this report is to improve the evidence base around the costs of implementing a living wage in large listed UK companies. Firm costs can consist of a range of outlays, including administration, distribution, supplies and finance fees. However, the impact of a living wage at a firm level is best measured by its impact on firm wage bills.
This report uses a custom-built model to estimate the average wage bill increase15 that UK-incorporated firms listed on the London stock exchange (LSE), across a range of sub-sectors, could expect to incur as a result of implementing a living wage. As detailed wage distribution data for individual firms is not publicly available, large-scale survey data is used instead to derive estimated pay distributions for different types of firms across a range of broad industrial sectors.16 These derived pay distributions are then applied to a sample of real firms and the following scenarios applied to their workforces:
▶ Scenario one: every directly employed worker earning an hourly pay rate below the living wage rate is brought up to the full geographically appropriate living wage rate (£8.30 in London, £7.20 elsewhere).
▶ Scenario two: every directly employed worker earning an hourly pay rate below the living wage is brought up to 90 per cent of the geographically appropriate living wage rate (that is, to £7.47 in London and £6.48 elsewhere).
15 As this analysis focuses on the wage bill cost (percentage increase to the total wage bill) of introducing a living wage hourly pay floor and a variant of this hourly rate (90 per cent of the relevant geographical living wage level) across a given firm’s directly employed workforce, the impact described is distinct from the total cost of living wage implementation on a given firm’s labour costs. Analysing the impact of living wage implementation on a firm’s total labour costs would entail consideration of other items, such as national insurance contributions, which are excluded from this analysis.
16 See appendix 1 more detailed information about the data from which assumed wage distributions were derived.

What price a living wage? Understanding the impact of a living wage on firm-level wage bills8 IPPR and RESOLUTION FOUNDATION
Both scenarios are applied to 79 individual medium-sized (maximum of 250 employees) and large (more than 250 employees) firms sampled from a total of 1,058 firms listed on the main market of the LSE in January 2012. Firms for which no accurate data on the total number of UK-based employees is available were excluded from the analysis, as were firms listed as UK-incorporated but which do not base more than 50 per cent of their workforce in the UK.
For each of the 79 firms sampled, consolidated financial data was sourced from publicly available company annual reports. Data sourced included total employee numbers, turnover, operating profit/loss, net profit/loss, and wage costs.
The 79 UK-incorporated firms sampled for this report operate in the following seven industrial sub-sectors listed on the main market of the LSE: banking (3), construction (15), software and computing (13), food production (4), food and drug retailers (7), general retailers (27), and bars and restaurants (10).
These seven industrial sub-sectors are selected from the LSE listings for two principle reasons. The first is that they are representative of the varying incidences of low-paid work across a range of broad industrial sectors. We know from previous research17 that there are employees earning less than the living wage and less than 90 per cent of the living wage in every industrial sector. However, as figure 3 makes clear, there are marked differences in the incidences of low-paid work across broad industrial sectors.
As figure 3 makes clear, in the broad industrial sector of distribution, hotels and restaurants (which includes companies listed on the LSE as general retailers, food and drug retailers, and bars and restaurants) more than 50 per cent of all employees – or, in absolute terms, 2.9 million low-paid workers – earn less than a living wage. In contrast, fewer than 20 per cent of employees earn less than a living wage in the broad industrial sectors of transport and communications (which covers companies listed on the LSE as software and computing firms), construction, and banking, finance, insurance and real estate.18 As the precise magnitude of the wage bill increase that any given firm might expect as a result of implementing a living wage is necessarily linked to the proportion of its workforce on low pay, the selection of a sample of industrial sub-sectors which approximates the variation in low-paid work across broader industrial sectors is crucial to illustrating the relative costs of a living wage across different industries.
The second, and related, reason for selecting the seven industrial sub-sectors from the LSE listings is that they provided a reasonable match for the broad industrial categories found in the large-scale survey data which was used to derive assumed firm-level wage distributions integral to the modelling in this report.19
17 See Savage 201118 The numbers of low-paid workers by broad industrial sectors in absolute terms is as follows: distribution,
hotels and restaurants: 2.6 million; manufacturing: 0.6 million; transport and communications: 0.3 million; construction: 0.2 million, and banking, finance, insurance and real estate: 0.6 million.
19 See appendix 1 for a detailed explanation of how the assumed firm-level wage distributions were derived and for a precise breakdown of the relationship between broad industrial sectors and sampled industrial sub-sectors.
60%40%30% 50%10%0% 20%
Distribution,hotels and
restaurants
Manufacturing
Transport and communications
Banking, �nance,insurance
and real estate
Construction
Below living wage Below 90 per cent living wage
55.0%
42.0%
21.0%
14.0%
19.0%
13.0%
15.0%
11.0%
16.0%
11.0%
Figure 3: Proportion of jobs paying less than the living wage by broad industrial sector, UK, 2010Source: Resolution Foundation analysis of pooled four-quarter Labour Force Survey data, 2010. Note: Living wage is defined as £7.85 per hour in London (2010 rate) and £7.20 per hour outside of London (2011 rate used in lieu of a 2010 rate). 90 per cent of living wage is defined £7.06 per hour in London (on 2010 rates) and £6.48 per hour outside of London. Figures in the chart refer to the proportion of employees earning less than this amount. Industries classified on the basis of Standard Industrial Classification 1992. Each of the seven industrial sub-sectors selected from the LSE and used to sample firms for this research lies within one of the five broad industrial sectors above. See appendix 1 for details of the sampling method used in this report.

What price a living wage? Understanding the impact of a living wage on firm-level wage bills9 IPPR and RESOLUTION FOUNDATION
Wage ‘spillover’ effectsIn analysing the wage bill increases that would result from implementing a living wage, it is necessary to address the issue of whether the imposition of a higher wage floor has effects on wages beyond the increases required to elevate the pay of those previously below the new minimum, and if so how extensive such ‘spillover’ effects are.
Wage spillover effects may occur for a number of reasons, including efforts to preserve wage differentials between different workers (in order to sustain morale or productivity) and the effects of increasing the relative price of low-skilled labour on increased demand (and therefore wages) for higher-skilled labour.
Failing to account for the wage spillover effects would potentially underestimate the true wage bill increases entailed by the implementation of a living wage. However, no evidence currently exists on which to base an estimate of the precise magnitude of wage spillover effects that might result from a living wage, and studies exploring wage spillover effects relating to increases as a result of the introduction of the NMW are divided on this issue.20
The analysis in this report is premised on a modest spillover effect.21 For scenario one (a move to a full living wage), it models a 10 per cent increase in the wage rate for workers who earn between £8.30 and £10.52 in London and between £7.20 and £8.32 elsewhere (the difference between the NMW and the geographically appropriate living wage rate above the new living wage pay floor). For scenario two (a move to 90 per cent of a full living wage) it models a 10 per cent increase in the wage rate for workers who earn between £7.47 and £8.30 in London and £6.48 and £7.20 elsewhere. Of course, wage spillover effects do not necessarily cease to impact on wages at defined limits: rather, the magnitude of spillover effect is likely to taper off as pay rates increase from the new minimum threshold. Therefore, for each scenario the spillover wage increases that are applied to wage rates immediately above each threshold, as set out above, are coupled with modest increases further up the pay distribution to model for such tapering effects.
Potential benefits to business of paying a living wage This report deliberately presents the ‘first round’ impact of implementing a living wage on firm wage bills. The modelling in this report cannot, therefore, account for the potential benefits to business of paying low-paid workers a higher wage, which may offset the cost associated with a higher wage bill to varying degrees. Anecdotal evidence from existing living wage employers suggests those potential benefits include productivity increases associated with higher effort, cost savings on recruitment and induction training, reduced absenteeism, lower staff turnover, improved worker morale, motivation and commitment, and reputational benefits. Further analysis of the precise impact of these benefits and, crucially, to what degree they might potentially offset increases in wage bill costs is required to fully assess whether they strengthen the case for living wages.
Bearing the cost of living wage implementation The analysis in this report does not take account of how firms might behave following the introduction of a living wage. As such, it does not consider any of the various means of coping with additional costs – including limiting profits, improving productivity, adjusting pay structures, reducing non-wage benefits, running down reserves (at present unusually high across private non-financial
20 See appendix 221 See appendix 2 for a detailed explanation of this core scenario and an analysis of alternative wage spillover
scenarios on the costs of living wage implementation on firm-level wage bills.

What price a living wage? Understanding the impact of a living wage on firm-level wage bills10 IPPR and RESOLUTION FOUNDATION
companies), raising prices or reducing quality22 – which any given listed firm might utilise in order to absorb different magnitudes of wage bill increase. It is therefore not the case that an increase in the wage bill necessarily implies a reduction in employment or working hours. Indeed, the fact that a living wage is, unlike the NMW, a voluntary undertaking reduces the likelihood of significant employment effects. The results presented in this paper indicate the scale of the adjustment required by companies seeking to implement a living wage, and those adjustments can come from many sources.
22 The balance sheet, total currency and deposits of private non-financial companies stood at £723.9 billion at Q3 2011, a rise from £616.6 billion from Q3 2007 (ONS 2011: 105).

What price a living wage? Understanding the impact of a living wage on firm-level wage bills11 IPPR and RESOLUTION FOUNDATION
AVERAGE FIRM-LEVEL WAGE BILL COST OF A LIVING WAGEDrawing on the individual firm-level results of 79 UK companies listed on the LSE, figure 4 provides an estimate of the average wage bill increase (as a percentage of the total wage bill) that typical listed companies in seven industrial sub-sectors would be likely to incur as a result of paying all their staff an hourly rate of at least a full living wage (scenario one) or 90 per cent thereof (scenario two).
The results make clear that the estimated average wage bill increase as a result of implementing a living wage across different industrial sub-sectors is closely associated with the proportion of jobs currently paying less than a living wage within them. The results show that the estimated average wage bill increase as a result of introducing a full living wage (scenario one, or £8.30 per hour in London and £7.20 per hour elsewhere) is significant in the major low-wage sectors of general retailers, food and drug retailers, and bars and restaurants (yielding an increase of between 4.7 and 6.2 per cent) while relatively small in other sectors (an increase of around 1.0 per cent or less).
Not surprisingly, the size of the estimated average wage bill increase resulting from the introduction of an initial hourly pay rate of 90 per cent of a full living wage (scenario two, or £7.47 in London and £6.48 elsewhere) is substantially lower across all sampled sectors, but particularly in major low-wage sectors. Under this scenario, there is still a degree of variation across industrial sub-sectors linked to the proportion of jobs paying below a living wage. However, the estimates show that the average wage bill increases associated with the introduction of pay floor of 90 per cent of the living wage are far lower in the major low-wage sectors of general retailers, food and drug retailers, and bars and restaurants (an increase of between 2.0 and 2.6 per cent) and extremely small in other sectors (an increase of less than 0.4 per cent). This suggests that for those firms in industrial sectors which contain a high incidence of low-paid work there may be merit in exploring whether implementing a living wage becomes more feasible if a full living wage rate could be phased in over time, thereby reducing upfront wage bill costs.
6% 7%4%3% 5%1%0% 2%
Bars and restaurants
General retailers
So�ware and computing
Food producers
Food and drug retailers
Banking
Construction
Scenario 1: Implement full living wage
Scenario 2: Implement 90 per cent of living wage
6.2%2.6%
4.9%2.1%
4.7%2.0%
1.1%0.3%
0.5%0.2%
0.5%0.2%
0.2%0.1%
Figure 4: Average firm-level wage bill increase by industrial sub-sector Source: Resolution Foundation analysis Note: Firms and sub-sectors chosen as outlined in the previous chapter.

What price a living wage? Understanding the impact of a living wage on firm-level wage bills12 IPPR and RESOLUTION FOUNDATION
CONCLUSIONLiving wage campaigns have already delivered tangible improvements in pay for thousands of low-paid workers. Yet the organisations that have made the voluntary decision to implement a living wage remain few in number and are confined to a relatively narrow range of sectors. Recent reductions in tax credits mean that wage growth will be more crucial than ever in maintaining the living standards of low-to-middle income households. In this context it is right that, where possible, employers pay their low-paid staff a living wage.
An employer’s decision to implement a living wage will rest on a range of factors but a prerequisite – in addition to any supply-side or reputational benefits that might flow from paying all their workers at least a living wage – is some sense that the introduction of a living wage will not entail exorbitant upfront wage bill increases.
There will, of course, also be differences in wage bill increases among firms within particular industrial sectors, just as there will be variation across industries. However, the analysis presented in this paper estimates that the average wage bill increase as a result of implementing a living wage for LSE-listed firms in construction, software and computing, banking, and food production is small (an increase of around 1.0 per cent of less). Wage bill increases of this magnitude suggest that there is a strong case for listed firms in these sectors to implement a living wage as a matter of course, absorbing the additional costs through a variety of coping mechanisms or, in cases where wage bill increases are very small, through measures such as workplace reorganisation and productivity improvements.
For firms in the major low-wage sectors – general retail, food and drug retail, and bars and restaurants – the analysis presented here suggests that implementing a living wage is likely to be more challenging. Yet our estimates suggest that even for listed firms in these sectors a living wage is not impossible. The fact that estimated average wage bill increases across the low-wage retail sub-sectors are far smaller if an initial hourly pay rate of 90 per cent of the living wage (£7.47 in London and £6.48 elsewhere) is introduced rather than the full rate suggests that there may be realistic ways for such firms to move towards living wage accreditation. Listed firms in these sectors could commit to phasing in a full living wage over time, in order to reduce upfront costs and provide time to modify business models. The Living Wage Foundation’s accreditation process provides for flexibility, allowing employers to agree a schedule for movement toward full implementation which is based on an organisation’s circumstances.
In the context of emerging international evidence which suggests that – when backed up with a specific set of operating practices – investing in employees can boost customer experience and decrease costs while maintaining competitive prices,23 and anecdotal evidence from UK living wage employers which suggests that paying low-paid workers a living wage results in benefits to business, the estimates presented in this paper represent a challenge to listed firms across a range of key sectors to move towards a living wage and thereby play their part in ensuring a decent standard of living for their employees.
23 See for example Ton 2012

What price a living wage? Understanding the impact of a living wage on firm-level wage bills13 IPPR and RESOLUTION FOUNDATION
REFERENCESButcher T, Dickens R and Manning A (2009) The Impact of the National Minimum Wage on the
Wage Distribution, research report for the Low Pay Commission, Low Pay Commission, University of Sussex and London School of Economics. http://www.revenuebenefits.org.uk/national-minimum-wage/policy/research-and-studies/
Dolton P, Rosazza Bondibene C and Wadsworth CJ (2009) The Geography of the National Minimum Wage, research report for the Low Pay Commission, Royal Holloway College and University of London. http://www.revenuebenefits.org.uk/national-minimum-wage/policy/research-and-studies/
GLA Economics (2009) An independent study of the business benefits of implementing a Living Wage policy in London, executive summary, London. http://www.london.gov.uk/mayor/economic_unit/docs/living-wage-benefits-summary.pdf
GLA Economics (2011) A Fairer London: The 2011 Living Wage in London, London: GLA Economics Living Wage Unit. http://www.london.gov.uk/sites/default/files/living-wage-2011.pdf
Gregg P (2000) ‘The use of wage floors as policy tools’, OECD Economic Studies, 31
Low Pay Commission [LPC] The National Minimum Wage: making a difference, Third Report of the Low Pay Commission, volume 1. http://www.lowpay.gov.uk/lowpay/report/pdf/report3.pdf
Manning A (2012) Minimum Wage: maximum impact, London: Resolution Foundation. http://www.resolutionfoundation.org/publications/minimum-wage-maximum-impact/
Hirsch D and Moore R (2011) The Living Wage in the United Kingdom: Building on Success, Living Wage Foundation, Citizens UK and Centre for Research in Public Policy. http://www.citizensuk.org/wp-content/uploads/2011/06/The-Living-Wage-in-the-United-Kingdom-May-2011.pdf
Mason G and Salverda W (2010) ‘Low Pay, Working Conditions and Living Standards’ in Gautie J and Schmitt J (eds) Low-Wage Work in the Wealthy World, New York: Russell Sage Foundation. https://www.russellsage.org/publications/low-wage-work-wealthy-world
Office for National Statistics [ONS] (2011) United Kingdom Economic Accounts, Q3 2011, London. http://www.ons.gov.uk/ons/rel/naa1-rd/united-kingdom-economic-accounts/q3-2011/bod-ukea-11q3.pdf
Savage L (2011) Low pay Britain, London: Resolution Foundation. http://www.resolutionfoundation.org/publications/low-pay-britain/
Stewart M (2009) Testing for Spill-over Effects of the National Minimum Wage, research report for the Low Pay Commission, University of Warwick. http://www.lowpay.gov.uk/lowpay/research/pdf/LPC_Research_for_2010_Report_Testing_for_Spill-over_Effects_of_the_National_Minimum_Wage_December 2009.PDF
Ton Z (2012) ‘Why “Good Jobs” Are Good for Retailers’, Harvard Business Review magazine, Jan–Feb 2012. http://hbr.org/2012/01/why-good-jobs-are-good-for-retailers/ar/1
Wills J (2011) ‘The London living wage: Numbers and money’, webpage, London: Queen Mary University London. http://www.geog.qmul.ac.uk/livingwage/numbersandmoney.html

What price a living wage? Understanding the impact of a living wage on firm-level wage bills14 IPPR and RESOLUTION FOUNDATION
APPENDIX 1: METHODOLOGYThe estimated average wage bill increases (percentage of the total wage bill) presented in this paper were produced using a bespoke ‘what-if ’ firm-level model that identifies the impact of implementing a living wage across a given firm’s workforce on its wage bill. The report does not provide detailed firm-specific wage bill cost projections but instead draws on individual firm-level analysis across a range of industrial sub-sectors to provide an estimate of the average wage bill increase that a typical large (more than 250 employees) or medium-sized (with a maximum of 250 employees) listed firm in a given sector might expect if they made the decision to implement a living wage.
The analysis was run under two different scenarios: ▶ Scenario one: every directly-employed worker earning an hourly pay rate
below the living wage is brought up to the full geographically appropriate living wage rate wage rate (£8.30 in London, £7.20 elsewhere).
▶ Scenario two: every directly-employed worker earning an hourly pay rate below the living wage is brought up to 90 per cent of the full geographically appropriate living wage rate (that is, to £7.47 in London and £6.48 elsewhere).
For any given sampled listed firm, the following was sourced from the consolidated financial data publicly available in company annual reports:
▶ Total number of employees ▶ Firm coverage: regional, national or international ▶ Location of head office ▶ Industrial sector ▶ Turnover ▶ Operating profit/loss ▶ Net profit/loss ▶ Wages ▶ National insurance contributions ▶ Pension costs ▶ Total assets
Where available, the analysis includes a detailed breakdown of the proportion of a given directly employed workforce that is full-time (35 hrs ~ 40 hrs) and part-time (17.5 hrs ~ 20 hrs); in cases where such information was not available, it was assumed that a given firm’s workforce breakdown approximated that outlined in ONS labour market statistics as of October 2011 (73 per cent full-time and 27 per cent part-time).
Given the absence of detailed wage distribution data for individual listed firms, wage distributions derived from an analysis of a four-quarter combined Labour Force Survey (LFS) sample, covering a total of 440,000 records, were assumed to be in place across a range of broad industrial sectors. We broke down the sample of 440,000 records across 13 regions (including the UK as a whole), nine industrial sectors and three firm sizes (small, medium and large), resulting in 351 separate wage distributions (13 x 9 x 3). In some instances, the resulting sample sizes are prohibitively small: for example, we found no employees working in large agricultural firms in Northern Ireland. However, in relation to the sub-sectors covered by the 82 firms we look at in the model, sample sizes are adequate in all cases: the smallest base used is 116 (for

What price a living wage? Understanding the impact of a living wage on firm-level wage bills15 IPPR and RESOLUTION FOUNDATION
medium-sized construction firms in Yorkshire and Humberside) and in most instances the sample is significantly bigger. To take an example, for a large firm with national coverage in the broad industrial sector of distribution, hotels and restaurants, the impact of living wage implementation was calculated on the assumption that that firm’s wage distribution reasonably approximates the average wage distribution derived from 1,572 sampled firms with similar geographic, size and sectoral characteristics.
Firm sampling method Data was taken for 79 individual medium-sized (with a maximum of 250 employees) and large (more than 250 employees) firms quoted on the main market of the London Stock Exchange (LSE) and incorporated in the UK. Listed firms for which no accurate data on total number of UK-based employees was available were excluded from the analysis, as were firms listed on the LSE as UK-incorporated but which did not base more than 50 per cent of their workforce in the UK. Of a total of 1,058 firms listed as of January 2012, we sampled companies from the following industrial sub-sectors:
▶ Banking ▶ Construction ▶ Software and computing ▶ Food production ▶ Food and drug retailers ▶ General retailers ▶ Bars and restaurants
These seven industrial sub-sectors were selected from the LSE listings for two principle reasons. The first reason is that these seven industrial sub-sectors were representative of the varying incidences of low-paid work across a range of broad industrial sectors. Selecting a sample of industrial sub-sectors that was representative of the range of varying incidences of low pay across broad industrial categories was important because the precise size of the wage bill cost that any given firm considering implementing a living wage might expect is necessarily linked to the proportion of its workforce currently employed on hourly rates below the living wage.
The second reason that these seven industrial sub-sectors were selected is that they provided a reasonable match for the broad industrial categories from which the assumed firm-level wage distributions utilised in the firm-level modelling in this report were derived. In selecting industrial sub-sectors from which to sample individual firms it was therefore important that industrial sub-sector categories corresponded approximately to the broad industrial sectors used to derive assumed wage distributions in the modelling behind the analysis. Table 1 illustrates the precise relationship between broad industrial sectors and the industrial sub-sectors sampled in this report.
Dynamic complexity A simplified approach to the cost of living wage implementation at a firm-level was taken. The analysis makes no assumptions about possible supply-side effects of living wage implementation, such as productivity increases associated with higher effort, cost savings on recruitment and induction training, reduced
Broad industrial sector (SIC 2007) (Source for derived wage distributions)
Industrial sub-sector, LSE listings (Source for sample of 79 UK-incorporated firms)
Banking, finance, insurance and real estate (J-K)
Banking (3 firms in sample)
Construction (F) Construction (15)
Transport and communications (I) Software and computing (13)
Manufacturing (D) Food production (4)
Distribution, hotels and restaurants (G-H) Food and drug retailers (7)
Distribution, hotels and restaurants (G-H) General retailers (27)
Distribution, hotels and restaurants (G-H) Bars and restaurants (10)
Table A1: Relationship between broad industrial sectors and sampled industrial sub-sectors

What price a living wage? Understanding the impact of a living wage on firm-level wage bills16 IPPR and RESOLUTION FOUNDATION
absenteeism, lower staff turnover, increased stability of workforce, improved worker morale, motivation and commitment, and reputational benefits.
The analysis also makes no assumptions about the range of different coping strategies that different employers might implement to offset such wage bill increases, including adjusting pay structures, reducing non-wage benefits, attempting to increase productivity, raising prices (or reducing quality), accepting reduced profit margins, adjusting hours of work, or reducing the number of individuals employed.

What price a living wage? Understanding the impact of a living wage on firm-level wage bills17 IPPR and RESOLUTION FOUNDATION
APPENDIX 2: ACCOUNTING FOR WAGE SPILLOVER EFFECTS Within the academic literature – confined to examinations of possible wage spillover effects as a result of increases in the national minimum wage (NMW) – there is little consensus as to the actual magnitude of wage spillover effects (that is, of wage increases further up the income distribution on account of changes to the floor rate). An econometric analysis of spillovers conducted by Mark Stewart (2009) found that, in general, spillover effects from the minimum wage were small and typically did not reach above the fifth percentile of the earnings distribution. In contrast, Butcher, Dickens and Manning (2009), in their analysis of differentials, found that areas most affected by the minimum wage had the largest spillovers, with effects evident up to the 25th percentile. Dolton, Rosazza Bondibene and Wadsworth (2008) found evidence to suggest that the minimum wage may have squeezed differentials at the bottom of the earnings distribution.
Altering the magnitude of the wage spillover effects necessarily produces different average firm-level wage bill increases. For example, figure B1 shows the average firm-level wage bill increase by industrial sub-sector if modelling for zero wage spillover.
In contrast, figure B2 shows the effects of a large wage spillover effect. In this instance, scenario one (full living wage rate) was modelled on a 20 per cent increase in the wage rate for workers who earn between £8.30 and £10.52 in London and between £7.20 and £8.32 elsewhere (the difference between the NMW and the geographically appropriate living wage rate above the new living wage pay floor). Scenario two (90 per cent of full living wage rate) was modelled on a 20 per cent increase in the wage rate for workers who earn between £7.47 and £8.30 in London and £6.48 and £7.20 elsewhere. For each scenario, the spillover wage increases that are applied to wage rates immediately above each threshold, as set out above, are coupled with increases further up the pay distribution to model for the tapering effects of wage spillovers.
The results displayed in figures B1 and B2 make clear that, while modelling for different wage spillover magnitudes necessarily impacts on the magnitude of wage bill increases, the effects are
6% 7%4%3% 5%1%0% 2%
Bars and restaurants
General retailers
So�ware and computing
Food producers
Food and drug retailers
Banking
Construction
Scenario 1: Implement full living wage
Scenario 2: Implement 90 per cent of living wage
5.9%2.4%
4.6%1.9%
4.5%1.8%
1.0%0.4%
0.5%0.2%
0.5%0.2%
0.2%0.1%
Figure B1: Average firm-level wage bill increase by industrial sector, no wage spillover effectSource: Resolution Foundation analysis
6% 7%4%3% 5%1%0% 2%
Bars and restaurants
General retailers
So�ware and computing
Food producers
Food and drug retailers
Banking
Construction
Scenario 1: Implement full living wage
Scenario 2: Implement 90 per cent of living wage
0.1%0.2%
0.3%0.6%
0.3%0.7%
0.5%1.2%
2.2%5.0%
2.2%5.1%
2.8%6.5%
Figure B2: Average firm-level wage bill increase by industrial sector, large wage spillover effectSource: Resolution Foundation analysis

What price a living wage? Understanding the impact of a living wage on firm-level wage bills18 IPPR and RESOLUTION FOUNDATION
not considerable. The range of the average wage bill increases (if modelling for both a large spillover effect and zero wage spillover effect) as a result of moving to a full living wage rate pay floor is just 0.2 percentage points in the food producers sub-sector and 0.1 percentage points in the construction sub-sector. Even in the three retail sub-sectors analysed above the range of average wage bill increase is just 0.6 percentage points in bars and restaurants, 0.5 percentage points in general retailers, and 0.5 percentage points in food and drug retailers.
Given this relatively narrow range of results and the fact that wage spillover effects are a contested issue within the academic literature, the analysis contained in this report is premised on a moderate spillover effect. In this ‘core’ model, scenario one (full living wage rate) is premised on a 10 per cent increase in the wage rate for workers who earn between £8.30 and £10.52 in London and between £7.20 and £8.32 elsewhere (the difference between the NMW and the geographically appropriate living wage rate above the new living wage pay floor). Scenario two (90 per cent of full living wage rate) is premised on a 10 per cent increase in the wage rate for workers who earn between £7.47 and £8.30 in London and £6.48 and £7.20 elsewhere. For each scenario, the spillover wage increases that are applied to wage rates immediately above each threshold, as set out above, are coupled with modest increases further up the pay distribution to model for the tapering effects of wage spillovers. Figure B3 shows once again the results produced under this ‘core’ scenario.
6% 7%4%3% 5%1%0% 2%
Bars and restaurants
General retailers
So�ware and computing
Food producers
Food and drug retailers
Banking
Construction
Scenario 1: Implement full living wage
Scenario 2: Implement 90 per cent of living wage
6.2%2.6%
4.9%2.1%
4.7%2.0%
1.1%0.3%
0.5%0.2%
0.5%0.2%
0.2%0.1%
Figure B3 Average firm-level wage bill increase by industrial sector, moderate wage spillover effectSource: Resolution Foundation analysis


