MSI working papers are distributed for the benefit of MSI corporate and academic
members and the general public. Reports are not be to reproduced or published, in any
form or by any means, electronic or mechanical, without written permission.
Report Summary
People often share opinions and information and word-of-mouth has an important impact on product success. But why are certain products talked about more than others? While research has focused on understanding the consequences of word-of-mouth, less is known about the behavioral processes that drive aggregate outcomes such as product adoption and sales. Similarly, research has considered how particular people may shape the diffusion process, but less attention has been given to how the products themselves may impact buzz.
Here, Jonah Berger and Eric Schwartz examine the psychological drivers of word-of-mouth, investigating how product characteristics and campaign giveaways determine which products people talk about. First, they analyze a dataset from buzz marketing campaigns to test their behavioral hypotheses. Second, they conduct a large field experiment to uncover the underlying process driving the findings in the first analysis. Their dataset comprises everyday conversations from 335 buzz marketing campaigns covering a broad range of products (e.g., food, financial services, and movies). Berger and Schwartz use a hierarchical model of word-of-mouth, which simultaneously reflects underlying differences across people and products, so the behavioral hypotheses are tested with a flexible, heterogeneous model. Their findings include the following: Products that are used more frequently are talked about more frequently (and by more people). For example, an increase in product usage of four additional times per week is associated with a 10% increase in WOM. Similarly, products that are cued more frequently by the surrounding environment are talked about more frequently (and by more people). In addition, cues drive the effect of product usage on WOM: when both cues and product usage are included in the model, cues remain a significant predictor of WOM, while weekly product usage is reduced to insignificance. The effect of cues strengthens as campaigns progress. Compared to earlier in the campaign (e.g., the first quarter) the frequency with which a product is cued by the surrounding environment is more positively linked to WOM later in campaigns. This suggests that as more time elapses since people first experience or learn about a product, being cued by the surrounding environment becomes increasingly important in driving conversation. Results provide no evidence that more interesting products are talked about more frequently over the multi-month period of each campaign. Interesting products may be talked about more right after people experience them, even if they do not receive more WOM overall. Results provide mixed support for the utility of promotional giveaways in boosting WOM. Giving away the product itself is associated with a strong and significant increase in WOM. Sending consumers a full product to try is associated with a 34% increase in WOM. Sending consumers multiple copies of the free product, however, is not associated with any additional WOM. Giving away samples is associated with a marginal increase in WOM and this was driven by the quantity of the giveaway: more samples were associated with more WOM. Non-product extras are associated with only a moderate increase in WOM, and this was
Marketing Science Institute Working Paper Series 1
driven by the quantity of the giveaway. Giving away coupons and rebates is not linked with more WOM. In their second study, the authors sought to test whether the relationship between cues and WOM was truly causal. The experiment was run on 1,687 BzzAgents who participated in a campaign for Boston Market. It corroborated the results of the cross-campaign analysis; increasing the cues for a product, in this case linking it to a usage situation that some participants did not already associate it with, increased WOM. Overall, the studies demonstrate the important role of triggers or stimuli in the environment in shaping word-of-mouth about a product. Products that are cued more frequently—either because they are used more frequently or brought to mind by a related stimulus—receive more WOM. These results suggest that when designing products or marketing messages, marketers should take into account the structure of the surrounding environment. Marketers often think that only outrageous or surprising products are buzz-worthy, but these findings indicate that even seemingly mundane products can get lots of word-of-mouth if they are cued often. Results also indicate that while promotional giveaways can be useful in boosting word-of-mouth, certain types of giveaways (i.e., the product itself) are more effective than others. The framework used here offers a first step for managers to run a cost-benefit analysis of promotional giveaways and the value of the resulting WOM. Jonah Berger is Assistant Professor of Marketing and Eric Schwartz is a doctoral student in
marketing at the Wharton School, University of Pennsylvania.
Acknowledgments
The authors thank Dave Balter, Steve McLaughlin, and the rest of the BzzAgent team for providing the data and for numerous conversations that greatly enriched the research. Eric Bradlow, Pete Fader, Dave Godes, Jacob Goldenberg, Barak Libai, Christophe Van den Bulte, Maria Ana Vitorino, and seminar participants at HKUST, Wharton, Singapore Management University, the 2010 Society for Personality and Social Psychology conference and the 2009 Association for Consumer Research Conference provided helpful feedback on earlier versions of the manuscript. The research was partially funded by a grant from the Wharton Interactive Media Initiative.
Marketing Science Institute Working Paper Series 2
Word of mouth is frequent and important. Consumers often tell their friends about
a great pair of shoes, complain about a terrible hotel stay, and gossip about a restaurant
opening. Social talk generates over 3.3 billion brand impressions each day (Keller and
Libai 2009), and affects everything from the drugs doctors prescribe (Iyengar, Van den
Bulte, and Valente 2009) to the products consumers buy (Godes and Mayzlin 2009;
Leskovec, Adamic, and Huberman 2007; Moe 2009).
But why are certain products talked about more than others? Some movies get a
great deal of buzz while others go unnoticed. Some restaurants are the talk of the town
while others never get discussed. Indeed, research suggests that 10% of consumer
packaged goods account for 85% of the buzz (Niederhoffer, Mooth, Wiesenfeld and
Gordon 2007). But what characteristics of products lead them to be talked about more?
Recent word-of-mouth research has focused on identifying its consequences, but
little empirical work has actually examined the process itself, or what consumers talk
about and why (Stephen and Lehmann 2009). Consequently, while it is clear that word
of mouth affects things like product adoption and sales, less in known about the
behavioral processes that drive these aggregate outcomes (Goldenberg, Libai, and Muller
2001). Further, though research has considered how particular people (e.g., influentials,
opinion leaders, or social hubs; Goldenberg, Han, Lehmann, and Hong 2009; Godes and
Mayzlin 2009; Katz and Lazarsfeld, 1955; though see Watts and Dodds 2007) or network
structures (Watts 2002) shape the diffusion process, less attention has been given to how
products themselves may impact buzz. Brown and Reingen (1987) note that, ―enhanced
understanding of social influence…may simply be obtained by examining which products
or services consumers are more likely to ‗talk about‘‖ (p. 361), yet little work has
Marketing Science Institute Working Paper Series 3
answered this call. Some research even suggests that item characteristics may not matter
at all, arguing that what gets passed along or becomes popular depends mainly on process
of imitation rather than anything about the items themselves (Hahn and Bentley 2003;
Salganik, Dodds, and Watts 2006).
There is also little evidence about how promotional giveaways affect word of
mouth. Marketers have started trying to influence what consumers talk about, hiring
word-of-mouth marketing companies to facilitate buzz (Godes et al 2005; Godes 2008;
Godes and Mayzlin 2009). These firms design marketing campaigns where consumers
are given free products, coupons, or other gifts in the hopes that they will talk more about
the brand. But do such giveaways really encourage buzz? Further, how do these factors
affect not only overall WOM volume, but also the number of people who talk about a
product (reach) and how much they do so (frequency)?
This paper examines psychological drivers of word of mouth, investigating how
product characteristics and campaign giveaways shape what people talk about. First, we
analyze a unique dataset containing reports of actual, everyday conversations from over
300 buzz marketing campaigns. Most prior WOM studies have focused on a single
product, but by looking across many campaigns covering a diverse set of products, we
gain deeper insights into the drivers of word-of-mouth. The data are analyzed with a
multilevel/hierarchical model of WOM, which simultaneously reflects underlying
differences across people and across products, enabling the key behavioral hypotheses to
be tested above and beyond a flexible, heterogeneous model. Second, based on both
theory and the model results, we conduct a large field experiment with random
Marketing Science Institute Working Paper Series 4
assignment across various US cities. By directly manipulating the main psychological
driver identified in the model, we test its causal impact on word-of-mouth.
Our research sheds light on the psychological processes behind word-of-mouth,
and provides insight into how companies can design more effective buzz marketing
campaigns (also see Godes et al. 2005). We find that (1) products that are cued more by
the everyday environment, such as those that are used more frequently, are talked about
more; (2) more interesting products do not receive more word of mouth over a multi-
month period; (3) the relation between interest and talking is more positive soon after
consumers learn about or experience products (i.e., its impact fades over time); (4) the
effectiveness of promotional giveaways in boosting overall WOM is mixed at best, with
certain types of giveaways (e.g., giving away the product itself) more strongly linked to
increased WOM than others; (5) breaking WOM volume into reach and frequency
provides additional insight into how product characteristics and promotional giveaways
shape what people talk about.
The rest of the paper is structured as follows. We discuss potential drivers of
WOM and draw on the behavioral literature to develop our hypotheses. Then we test
these hypotheses across a large set of WOM campaigns and a field experiment. Finally,
we discuss the theoretical and practical implications of this research.
Drivers of Word-of-Mouth
Rather than focusing on product categories (e.g., food or books), or attributes in
the traditional sense (e.g. horsepower), we attempt to understand why people talk more
Marketing Science Institute Working Paper Series 5
about certain products by investigating the underlying psychological drivers (Moldovan,
Goldenberg, and Chattopadhyay 2006). Psychological motivations play an important role
in shaping WOM (Cheema and Kaikati 2010; Wojnicki and Godes 2008). Certain
products may evoke more emotion or fit better with people‘s cognitive constraints, and to
the degree these aspects are common across individuals, they should influence what is
discussed (Heath, Bell, and Sternberg 2001; Kashima 2008; Schaller and Crandall 2004).
People reported greater willingness to share urban legends, for example, that elicited
higher levels of disgust (Heath, Bell, and Sternberg 2001).
One psychological factor that might influence whether people talk about a product
is the amount of interest it evokes. Intuition suggests that people will talk more about an
intriguing high-tech gadget, for example, than a boring breakfast cereal. More generally,
popular perspectives suggest that things which evoke interest (i.e., novel, surprising, or
unexpected things) will receive more discussion (Dichter 1966; Rosen 2009).
But do interesting products or experiences actually get more word of mouth?
Though the notion may seem intuitive, there are a number of reasons to question its
validity. First, self-enhancement motives may lead people to think they will talk about
more interesting products even if they do not actually do so (see Wojnicki and Godes
2008 for a discussion self-enhancement motives and WOM). Most people want to view
themselves as somewhat interesting, and conversation topics can act as self expression.
Consequently, if asked what they would talk about, people may be motivated to report
that they will talk more about interesting rather than boring things even if that is not what
actually occurs. Second, though motivation may drive what people talk about in some
situations (e.g., bringing up interesting topics to look good on a date), most day-to-day
Marketing Science Institute Working Paper Series 6
conversations may resemble idle chatter about whatever normal everyday things happen
to come to mind (Keller Fay Group 2006). While technology or media and entertainment
are probably more interesting, for example, prior work suggest that food and dining (i.e.,
consumer packaged goods) are more frequently discussed (Keller and Libai 2009).
Consequently, though interesting things may be talked about more in a few instances, this
may be overwhelmed by the preponderance of situations where people talk about
anything that happens to come to mind, interesting or not. Third, while more interesting
things may get slightly more WOM right after they are experienced, they may not get
more WOM over a longer time horizon. Characteristics of stimuli like interest, novelty,
and originality fade over time (Moldovan, et al. 2006; Wu and Huberman 2007).
Consequently, while interest may help predict buzz right after people first experience or
learn about a product, it is less likely to be a strong predictor of ongoing buzz. Overall,
given the lack of empirical evidence addressing this issue, we explore whether more
interesting products receive more WOM.
Since conversations may be driven by whatever comes to mind, we also examine
the role of cues in shaping word of mouth. Consumers may find a product interesting, but
if they are not reminded to think about it, they may not discuss it. Cues in the
environment, however, can shape product accessibility (Lynch and Srull 1982;
Nedungadi 1990). Products should be more accessible if they are used more frequently,
for example. Therefore, one example of an environmental cue is a product usage
occasion. Indeed, one reason food and dining may be frequently discussed is because
people are reminded to think about food multiple times a day (i.e., every time they eat).
More broadly, conceptually related cues can also bring products to mind (Collins and
Marketing Science Institute Working Paper Series 7
Loftus 1975). Reese‘s Pieces and orange soda were more top of mind in times of year
when there were more cues related to the color orange in the surrounding environment
(i.e., Halloween in Berger and Fitzsimons 2008). Consequently, to the degree that certain
products tend to be cued more across individuals, because they are used more often or
just cued more generally, they should be talked about more.
While we focus on product characteristics and psychological drivers, we also
examine how aspects of word-of-mouth campaigns themselves shape WOM (also see
Biyalogorsky, Gerstner and Libai 2001; Ryu and Feick 2007). Most campaigns involve
sending consumers promotional giveaways to encourage them to talk about the product.
Participants in a Tabasco campaign, for example, were sent a bottle of the hot sauce to
try. Consumers may also receive free samples (e.g., mini tube of toothpaste), coupons or
product rebates, or extras such as brochures, postcards, or stickers. The prevalence of
such giveaways suggests that firms believe they are effective. More than half the
campaigns conducted by a major buzz marketing firm between August 2002 and January
2009 included a free product and nearly half included some sort of non-product extra
(Table 1, Panel B, following References). Further, consumers are often sent multiple
copies of the same promotional item and encouraged to pass along to their friends. Of
campaigns that included coupons, for example, 77% provided more than one. But while
sending consumers promotional items is a common practice, no work we are aware of has
examined which of the various types of giveaways, if any, are linked to increased WOM.
Finally, we not only examine how product and campaign characteristics affect
overall word of mouth volume, but also the specific way in which they do so. Companies
hiring buzz firms essentially are buying spots in a new medium (e.g., conversations), and
Marketing Science Institute Working Paper Series 8
traditional media metrics like reach and frequency are no less relevant than they are for
print, radio, TV or Internet (Agostini 1961; Rossiter and Danaher 1998). While such
measures typically refer to receiving messages (e.g., audience exposure), we consider
these measures for the senders of WOM. How do product characteristics and campaign
giveaways affect the number of people who talk about a product (reach)? Among the
people who do talk, how do these factors influence how much they do so (frequency)?
The decomposition of overall WOM volume into reach and frequency has important
implications for the consequences of word of mouth. More people talking about a
product (reach), for example, should broaden WOM dispersion (Godes and Mayzlin
2004) and increase the chance that different communities learn about the product,
extending awareness and potentially boosting purchase likelihood. Thus we investigate
how product and campaign characteristics affect how whether an individual talks or not
(reach), and among those talkers, how many conversations they have (frequency).
The Current Research
Building on the preceding discussion, we explore a number of key research
questions:
Are more interesting products talked about more frequently in general? Are products that are cued more by the surrounding environment talked about
more often? For example, are more frequently used products talked about more and is this driven by cueing?
Are promotional giveaways (e.g. free products, samples, and coupons and
rebates) linked to increased word of mouth, and if so, which ones? Does giving away more of a particular item have any additional effect?
Marketing Science Institute Working Paper Series 9
How do these factors predict the reach and frequency of word of mouth? We investigate these questions in two ways. First, we look at WOM across a
variety of buzz marketing campaigns to examine the link between product characteristics,
as well as campaign giveaways and WOM. Second, we use the results of this analysis to
inform the design and implementation of a field experiment, testing whether the key
product characteristic linked to WOM (i.e., cues) has a causal influence on buzz.
A Cross-Campaign Analysis of Buzz
Our first study uses a unique dataset to examine how product and campaign
characteristics impact buzz. Our data focuses on 335 word-of-mouth marketing
campaigns covering a broad range of products (e.g., food, financial services, and movies,
Table 1C, following References). The data includes information about each product, the
campaign itself (i.e., whether free products or coupons were given away), and how much
each individual in each campaign talked about the product.
The data were provided by BzzAgent, a marketing company which helps generate
WOM for its clients (see Godes 2008; Godes and Mayzlin 2009). They maintain a large
database of people (―agents‖) who are interested in learning and talking about new
products. These individuals participate on a volunteer basis. Clients approach BzzAgent
with a product they would like to create buzz around. Then based on the geographic and
demographic specification of the client‘s target audiences (e.g. ―women in Chicago‖),
BzzAgent invites the appropriate agents to participate. Agents are not required to talk
Marketing Science Institute Working Paper Series 10
about the product, or say positive things. They are simply asked to report when they share
WOM about the product.
Each campaign runs for several weeks.1 Agents who have volunteered to
participate are sent a package of materials. This contains information about the product
as well as promotional giveaways that vary across campaigns, such as free products,
rebates, or gifts. All agents in the campaign receive the same materials. Agents also
receive emails throughout the campaign with additional information and reminders to
share WOM. Agents file reports about each incidence of WOM through a simple website,
and the number of reports filed by a given agent in a given campaign serves as our key
outcome measure (see Godes and Mayzlin 2009; Cheema and Kaikati 2010). 2
Campaigns differ in size. The middle 50% of all campaigns involved between
approximately 1,000 and 5,000 agents. Only about 10% of campaigns had more than
10,000 agents, and only about 15% included fewer than 1,000 agents. 3
The median number of campaigns each agent participated in is three campaigns,
but there is a great deal of variability since about 25% of agents participated in only one
campaign and 10% participated in more than 13 campaigns. Agents included in the data
participated in at least one campaign between August 2002 and January 2009.
Participation means that an agent completed a pre-campaign survey and logged into the
BzzAgent website at least once during the campaign. Importantly, participation does
require talking about the product. An agent may participate but end up submitting zero
reports. One report is considered equivalent to one conversation.
For the purposes of this analysis, we take a stratified sample by taking a uniform
sample of 2,000 agents and using all of the campaigns in which those agents participated.
Marketing Science Institute Working Paper Series 11
This yields nearly 11,000 observations, where each observation is how many
conversations that agent had in that campaign (that is, the agent-in-campaign level). It
was important to sample in this manner since there is substantial variability in the number
of agents in each campaign and the number of campaigns in which each agent
participated. The histogram in Figure 1 (following References) summarizes the data
pooled across all campaigns and all agents, so it indicates how frequently each number of
conversations occurs across all of the agent-in-campaign observations. The count data are
skewed towards zero, with 43% of all observations being zeros (i.e., no conversations
were reported by a given agent in a given campaign). The median number of
conversations is one, and 90% of all observations are four conversations or fewer.
Statistically, this follows a very common pattern of over-dispersed count data. The
histograms for each individual campaign follow the same shape as this aggregate
histogram across campaigns. At the observation level, reach is whether or not an agent
talks at all about a product in a campaign, and frequency is, given an agent talks, how
many conversations she has.
Key independent measures
Each product characteristic was quantified by a different set of three independent
raters (see Heath, Bell and Sternberg 2001 for a similar approach). They were given a list
of the products (e.g., Kellogg‘s Smorz Cereal, Ralph Cool perfume, the book Unstuck)
and a brief description of each. Those who rated product usage were asked ―How many
times per week is this product typically used?‖ Those who coded cue frequency were
asked ―How frequently might the surrounding environment cue or remind people to think
Marketing Science Institute Working Paper Series 12
about the product? (1 = not at all, 5 = a great deal). Those who coded interesting were
asked ―How interesting is this product?‖ (1 = not at all, 5 = a great deal). Coding was
done at the product level and participants coded each product individually (e.g., ―How
interesting do you find Ralph Cool perfume‖ or ―How many times per week do you use
Kellogg‘s Smorz Cereal‖). In all cases, coders were asked to rate the products from the
perspective of a potential customer for whom the product is intended (e.g., make up for
women). Inter-rater reliability was high (weekly usage α = 0.91; cues α = 0.83;
interesting α = 0.79) 4 and the scores were averaged across coders for each dimension.
See Table 1, Panel A for more details on these measures of product characteristics.
We also recorded the promotional giveaways sent to the agents. BzzAgent
provided full information about what agents received in each campaign, such as the
product, samples, coupons or rebates, and non-product extras (e.g., stickers). We noted
the presence and number of each type of item agents received (Table 1, Panel B for
details). See Table 2 (following References) for correlations among the independent
variables.
Model development
We explicitly model WOM at the individual level, where yij represents the
number of conversations an individual agent i reported during campaign j for a particular
product. The data structure could be considered a jagged contingency table of counts:
agents participate in different numbers of campaigns, and campaigns differ in number of
agents participating. In addition, agents are not fully nested within campaigns. It is
important to differentially weight the data from individuals and campaigns based on how
Marketing Science Institute Working Paper Series 13
many observations we have for each, and our approach does just this. 5 The model used is
a Poisson log-normal model, which is a type of generalized linear mixed effects models
(see Appendix for a discussion of model fit and the rationale for choosing this approach).
Each observation yij has an unobserved Poisson rate of conversations, ij . This rate
parameter, or the expected number of conversations, is a log-linear combination of the
global mean , each individual agent‘s unobserved talking propensity i, each product-
campaign‘s unobserved propensity to be talked about j, the product-campaign‘s
observed covariate vector Xj, the coefficient vector , and each observation-specific
unobserved error ij . Formally,
yij ~ Poisson ( ij)
log ( ij) = i + j + Xj + ij ,
where the slopes of the observed predictors, the components of are common across all
agents and campaigns, but the parameters i , j , and ij are random effects. These
parameters vary across agents, campaigns, and observations, respectively, and they are
independently distributed as follows:
i ~ N (0, ) , j ~ N (0, ) , and ij ~ N(0, ),
where those random effects are uncorrelated with one another. The parameter reflects
the degree of unobserved heterogeneity across individuals, and reflects the degree of
unobserved heterogeneity across campaigns (not accounted for by observed covariates
Xj). The observation-specific idiosyncratic error can be interpreted as the unobserved
interaction effect of a particular person‘s propensity to talk about a particular product-
campaign. The parameter reflects the degree of over-dispersion in the counts,
conditional on the other parameters. As in random effects models, we assume the
Marketing Science Institute Working Paper Series 14
observed predictors are uncorrelated with the random effects. To investigate our
questions we examine the components of the coefficient vector representing the
associations of each product characteristic and campaign giveaway with WOM.
By including different sets of variables in the model, and using disaggregate data
at the level of an agent-in-campaign, we estimate multilevel models to test which product
characteristics and campaign giveaways are linked to overall WOM. By looking at
models examining overall WOM, reach, and frequency, we can also gain deeper insight
into how the WOM is occurring. The Frequency model is a count (Poisson-based) model,
but the Reach model is a binary choice (binomial-based) model, using a logit link instead
of log link relating the linear predictor to the outcome. 6
Results and discussion
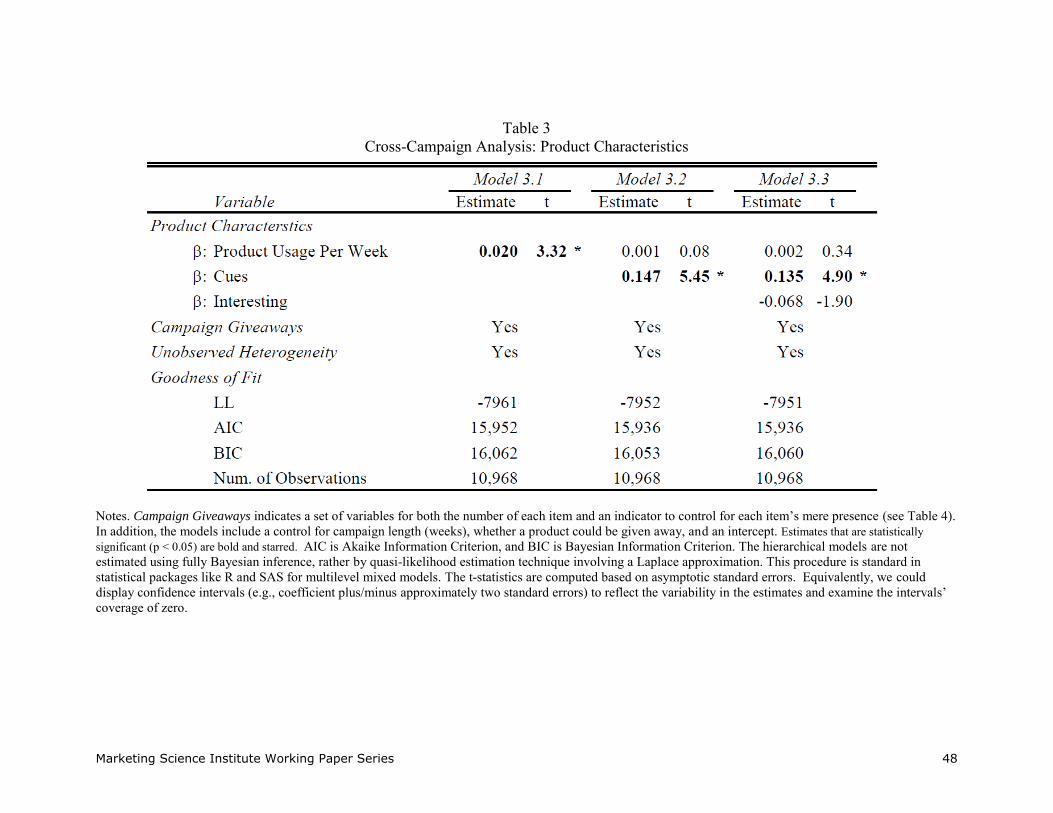
Product characteristics. 7 As shown in Table 3 (following References), not surprisingly,
products that are used more frequently are talked about more (Model 3.1). Parameter
estimates indicate that a one standard deviation increase in product usage (i.e., four more
times per week) is associated with a 10% increase in WOM, or approximately 13 extra
conversations per 100 people (based on the average campaign with 130 conversations per
100 agents, holding all other predictors constant).
More importantly, Model 3.2 illustrates the importance of cues in driving both
this effect, and WOM more generally. First, products that are cued more frequently by
the surrounding environment are talked about more frequently. A one-standard deviation
increase in the frequency of being cued is associated with a 19% increase in WOM, or an
extra 25 conversations per 100 people for the average campaign. Second, cues drive the
Marketing Science Institute Working Paper Series 15
effect of product usage on WOM: when both cues and product usage are included in the
model, cues remains a significant predictor of WOM while weekly product usage is
reduced to insignificance. A mediation test for multilevel models confirms the
hypothesized pattern of mediation (t = 6.20, p <0.0001; see Appendix for a discussion of
meditational analysis for multilevel models and convergent evidence from the linear
model on aggregate data). Using a product more leads it to come to mind more often and
thus be talked about more. Decomposing this into the impact on reach and frequency
shows that cues are related to both: products that are cued more often are talked about by
a greater number of people (Table 4, Reach, following References), and the people who
do talk mention the product more frequently (Table 4, Frequency, following References).
Model 3.3 examines the relationship between interest and WOM (Table 3).
Results provide no evidence that more interesting products are talked about more
frequently over the multi-month period of each campaign. 8 This finding is not driven by
the specific way we measured interest as other ways of measuring the construct and
related constructs yield the same result. First, we had a broader set of individuals (N =
80, mean age = 42) rate how interesting (―How interesting do you find this product?‖) or
original (―How original do you find this product?‖) the products were on 1-5 scales.
Neither measure, however, was linked to WOM. Second, we had research assistants use
1-5 scales to rate the products on related constructs, i.e., how surprising (―How surprising
do you find this product?‖) or how novel (―How novel is this product?‖) they were.
Neither measure, however, was linked to increased WOM. The persistent lack of
relationship across measures and rater populations underscores the notion that more
interesting products may not receive more buzz overall.
Marketing Science Institute Working Paper Series 16
To further test our measure of interest, we examined whether it would predict
intentions to spread WOM (1 = not at all likely, 5 = extremely likely). Each participant
was given a random set of 50 products to avoid fatigue and ratings for each product were
averaged across participants. Results indicate that our measure of interest was
significantly related to intent to share WOM. People reported greater willingness to talk
about more interesting products (r = .22, p < .001). 9 There was no significant
relationship, however, between willingness to talk and either product usage (r = -.04, p >
.40) or frequency of being cued by the environment (r = .02, p > .70). Further, when all
three of these factors were included in a multiple regression predicting WOM intentions,
how much interest the product evoked remained a significant predictor (β = 0.19, t =
4.86) but people did not report any greater likelihood of talking about products that are
used (β = -0.01, t = 1.03), or cued more frequently (β = 0.05, t = 1.52).
These relationships further support the validity of our interest measure. They are
also consistent with the notion that people may think they will talk more about interesting
products, even though they may not actually do so. Finally, the lack of relationship
between cues and WOM intentions suggests that people may not be aware of the role of
cues in shaping what they discuss.
Ancillary analyses also support our suggestion about the temporal relationship
between interest and WOM. As noted earlier, while people may find a product original
or interesting when they first experience it, these feelings fade over time (Moldovan et al
2006). Consequently, the effect of interest on WOM should likely dissipate over the
length of the campaign. Our results are consistent with this suggestion. Given the
campaigns already occurred, it is impossible to go back and measure how interest in each
Marketing Science Institute Working Paper Series 17
product changed over time. We can, however, examine how our interest measure
predicts WOM at different points in the campaign. We allow the slope to vary to test if
the impact of interest on WOM is different early versus late in the campaign.
Consistent with our theorizing, while there is a positive relationship between how
interesting products are and buzz in the first fourth of the campaign ( = 0.03), for
example, this relationship dissipates over the latter three-fourths (interest x time
interaction; = -0.08, t = -2.62).10 The pattern of results is robust to the different ways of
splitting the campaign into early and later periods (e.g., first third, fifth, or tenth of
campaign). This significant interaction suggests that interesting products may be talked
about more right after people experience them, even if they do not receive more WOM
overall. Further it bolsters the notion that our failure to find an association between
interest and ongoing WOM was not due to a poor measure of interest.
Data on how cues relate to conversations over time is also consistent with our
overarching framework. Rather than dissipating, the effect of cues strengthens as
campaigns progress. Compared to earlier in the campaign (e.g., first fourth), the
frequency with which a product is cued by the surrounding environment is more
positively linked to WOM later in campaigns (cues x time interaction; = 0.08, t = 4.13).
The pattern of results is robust to the different ways of splitting the campaign into early
and later periods (e.g., first third, fifth, or tenth of campaign). This suggests that as more
time elapses since people first experience or learn about a product, being cued by the
surrounding environment becomes increasingly important in driving conversations.
Marketing Science Institute Working Paper Series 18
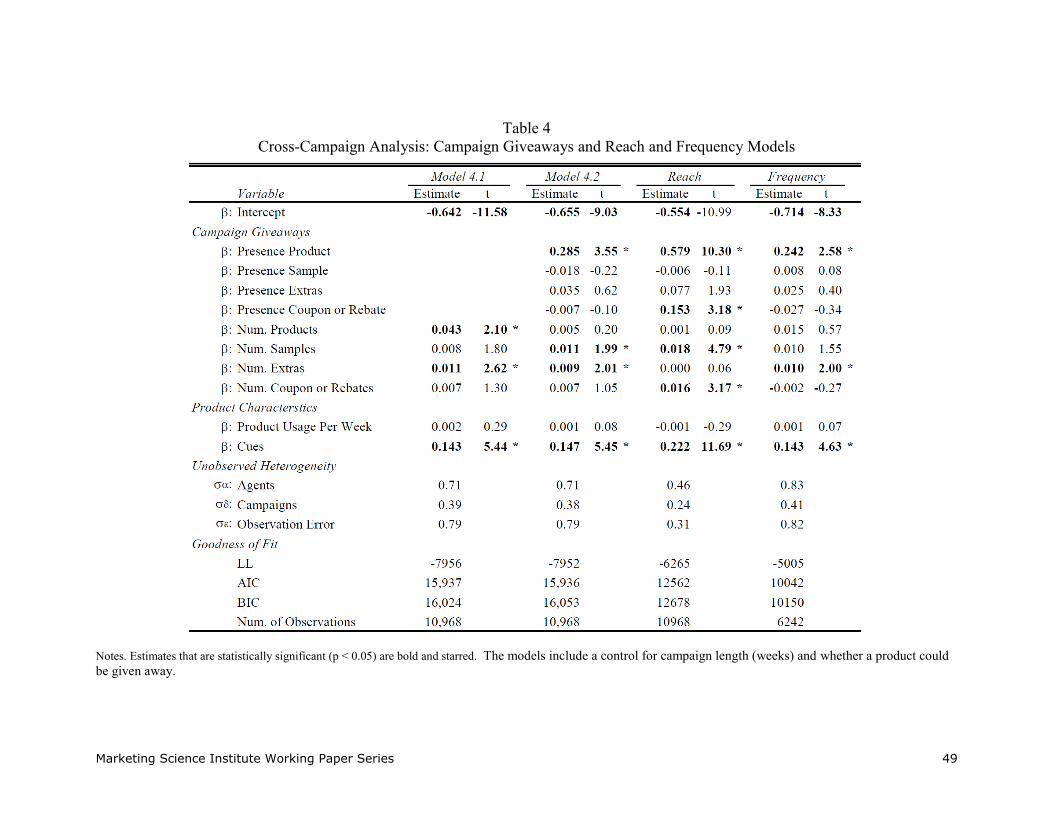
Campaign giveaways. Two models address the effect of promotional items on talking.
We consider Model 4.1 which includes the quantity (0, 1, 2, etc.) of each type of
giveaway that was included in a campaign (Table 4). By running Model 4.2, which also
includes variables for the presence or absence (1 or 0) of each giveaway, we examine
whether giving away more of a certain item is associated with additional word of mouth,
above and beyond the mere presence of that type of item in the campaign. Additionally,
not all products can be sent in the mail (e.g., it is easy to send a book, but hard to mail a
Taco Bell meal or a Dodge truck)11. Consequently, we consider the effect of giving away
a product controlling for whether it could be realistically mailed to an agent.
Results provide mixed support for the utility of promotional giveaways in
boosting word of mouth (Table 4). Giving away the product itself is associated with a
strong and significant increase in word of mouth (Model 4.2). Sending consumers a full
product to try is associated with a 34% increase in WOM, or equivalent to an extra 43
conversations per 100 people. Sending consumers multiple copies of the free product
(i.e., more than one), however, is not associated with any additional word of mouth
(Model 4.2). Decomposing these effects into the impact on reach and frequency shows
that giving away a free product is related to both: it is associated with a greater number of
people talking about the product and the talkers speaking more frequently (Table 4).
Evidence was weaker, however, for the link between word of mouth and other
promotional giveaways. Giving away samples was associated with a marginal increase in
word of mouth (Model 4.1), and this was driven by the quantity of the giveaway: more
samples were associated with more word of mouth (Model 4.2). A one standard deviation
increase (i.e., sending consumers 10 additional samples), for example, is associated with
Marketing Science Institute Working Paper Series 19
15 additional conversations per 100 people. Decomposing this into the impact on reach
and frequency shows that giving away more samples is related to reach but not
frequency: it is associated with a greater number of people talking about the product but
not the talkers speaking any more frequently (Table 4).
Evidence was even weaker for non-product extras. They were associated with a
moderate increase in word of mouth (Model 4.1), and this was driven by the quantity of
the giveaway: giving away more extras was associated with more word of mouth (Model
4.2). A one standard deviation increase (i.e., giving away 7 more extras) is associated
with 9 additional conversations per 100 people. It is worth noting, however, that the
effect of extras becomes non-significant when two campaigns with the largest number of
extras are removed ( = 0.0002, t = 0.03). We leave these points in the analysis because
(a) theory of diagnostics of outliers and influential points is less clear for multilevel
generalized linear models than linear models and (b) each value represented many
observations and was a naturally occurring numbers of giveaways. Removing extreme
values does not change coefficients for any other independent variables. Decomposing
the impact of extras into its link with reach and frequency shows that giving away more
extras is marginally related to frequency but not to reach: it does not lead any more
people to talk, but those who do speak may talk slightly more frequently (Table 4).
There is also mixed evidence for the link between giving away coupons and
rebates and WOM. Neither their presence nor quantity is linked to more word of mouth
overall (Model 4.1, 4.2). Further, they are not associated with more conversations among
the people that do talk (Table 4, Frequency). However, there is a significant link between
this factor and whether or not an agent talks (Table 4, Reach). Including coupons or
Marketing Science Institute Working Paper Series 20
rebates in a campaign is associated with more people talking, with more coupons or
rebates associated with an increase in the number of people that talk.
Potential limitations
Selection oriented explanations (whether at the level of agents, campaigns,
clients, or BzzAgent) have difficulty accounting for these results.
First, one could argue that BzzAgent only offers campaigns to agents who are
most likely to talk about that product. Second, one could argue that agents self-select
into campaigns in which they will talk a lot about the product. Discussions with
BzzAgent, however, cast doubt on these possibilities. BzzAgent has an allocation engine
that satisfies its clients‘ requests that campaigns focus on geographic regions and other
constraints (e.g., gender or having children).12 Thus, rather than the quickest or most
interested agents gaining access, almost all agents in a region are encouraged to join.
Often, this fills the campaign quota. If there is still room, BzzAgent prioritizes people
who have not done a campaign in a while, making it less likely that people with high
propensities to buzz self-select into any campaign of their choice.13 In addition, if the
best agents were getting into campaigns first, average WOM per agent should then be
lower in larger campaigns, as worse agents would need to be included to fill the quota.
This is not the case, however. There is no correlation between the number of agents in a
campaign and average WOM per agent (r = -0.01, p = 0.90). Finally, even if these biases
did exist, they would boost overall talking levels across campaigns but not bias our
coefficients of interest, which depend on differences across campaigns.
To be a true concern, selection would have to be correlated with our suggested
Marketing Science Institute Working Paper Series 21
drivers of WOM. Though selection seems plausible for some product characteristics, it
makes less sense for the ones we find to be significantly associated with WOM. It is
possible agents may pick campaigns based on whether they anticipate the products to be
interesting, but it is less likely most agents would consider how often a product is cued by
the environment when picking campaigns.
Third, one could argue that clients strategically hire BzzAgent only if they think a
campaign will boost WOM, so only easy to talk about products would be in the data. But
the reverse is also possible: firms only hire BzzAgent if their product is not getting
enough WOM naturally, so the dataset contains many products that are difficult to talk
about. Either way, this selection would shift in the average WOM across products but
does not explain how WOM varies with product and campaign characteristics.
Fourth, one could argue that clients only give away their product when they
anticipate that trial will increase WOM (i.e., perhaps when the product is interesting).
That is, the design of a campaign is endogenous to campaign success. A number of
points, however, cast doubt on this possibility. To start, more interesting products are not
any more likely to be given away (r = 0.02, p > 0.20; see Table 2). Additionally,
discussions with BzzAgent indicate that rather than being driven by what clients thought
would increase WOM, variation in giveaways was driven by clients wanting to save
money or not having products available to share. Finally, this argument should hold for
all giveaways (not just the product), but the data do not show this.
Summary
Examining hundreds of word-of-mouth campaigns provides insight into how
Marketing Science Institute Working Paper Series 22
product and campaign characteristics shape WOM. Products that are cued more, whether
through product usage or otherwise, are talked about more frequently. More interesting
products do not generate more WOM over the multi-month campaigns. Ancillary results,
however, suggest that interesting products may get more WOM right after consumers
learn about the product.
These results are particular interesting given they diverge from consumer
expectations. People thought they would talk more about interesting products but did not
think they would talk more about products that were cued more frequently. This
disconnect illustrates that WOM intentions may not always be accurate, particularly in
cases where consumers are unaware of the factors that shape their behavior (e.g., subtle
cues in the environment) or where lay theories (i.e., that people talk about more
interesting things) may not actually be correct.
The effects of promotional giveaways were mixed. Results suggest that sending
people a free product is strongly associated with increases in both the number of people
that talk and how frequently they do so, but sending additional products has little added
benefit. The other effects were weaker. Coupons and rebates are linked to an increase in
the number of people that talk, with more of them (e.g., share with a friend coupons)
having an additional effect, but they do not predict how frequently people talk or the
overall amount of word of mouth. Number of samples is weakly associated with overall
buzz, and that appears to be driven by their association with the number of people who
talk, but they do not lead people to talk more. The number of extras also has a small
relationship on overall buzz, and while they do not seem to get more people to talk, they
are related to the frequency with which the talkers talk.
Marketing Science Institute Working Paper Series 23
Field Experiment
The breadth of products and categories used in the cross-campaign analysis
speaks to the generality of the findings, but one may still wonder whether the relationship
between cues and WOM is truly causal. Consequently, we also conducted a field
experiment; the design was informed by both our prior theorizing and the results of the
observational analysis. Specifically, we test whether manipulating the significant
psychological factor linked to WOM in the observational data (i.e., how frequently the
product is cued) affects WOM.
We examine whether linking the brand to an additional cue in the environment
increases WOM. One way to increase product accessibility is to increase the frequency
of existing cues but another is to create new links to stimuli with which the product was
not already associated. For example, linking a reminder to eat fruits and vegetables to an
object in dining halls increased fruit and vegetable consumption by encouraging people to
think about the reminder more (Berger and Fitzsimons 2008).
We manipulated cues by manipulating the messaging different participants
received during a BzzAgent campaign for the restaurant chain Boston Market. Half the
agents received a message linking the product to a particular cue (dinner), while the other
half received a control message. We also measured participants‘ prior associations
between the brand and that cue to directly test whether cueing is driving any observed
effects. While some consumers (strong dinner associates) already associate Boston
Market with dinner, others (weak dinner associates) do not. Consequently, while
Marketing Science Institute Working Paper Series 24
thinking about dinner should already bring Boston Market to mind among strong dinner
associates, it should not naturally come to mind among weak dinner associates.
We predict that messages which associate the chain with dinner should have a
differential effect on consumers based on their existing product associations. The dinner
manipulation should be more likely to boost product accessibility among weak dinner
associates (because strong dinner associates already associate the brand with dinner), and
consequently, it should be more likely to increase the frequency with which they talk
about the brand. Thus, we predict that the effect of message should be moderated by
participants‘ existing product associations. Among people who do not already associate
the chain with dinner, the dinner message will boost WOM.
Method
The experiment was run on 1,687 BzzAgents who participated in a campaign for
Boston Market. We measured existing product usage associations prior to the start of the
campaign. Agents complete a pre-campaign survey with various campaign-related
questions at the beginning of every campaign. In addition to the standard questions, we
added a question which measured how much participants associated the product with
dinner (―Boston Market is a dinner place," 1 = strongly disagree, 7 = strongly agree).
Participants were stratified into three groups based on their responses to this measure (1-3
= low, 4 = middle, 5-7 = high). Within each stratum, participants were randomly
assigned to one of our two experimental conditions.
We manipulated the focus of the email messages BzzAgents received during the
first six weeks of the campaign. Every two weeks during each campaign, agents receive
Marketing Science Institute Working Paper Series 25
emails with product information and reminders to file WOM reports. We modified the
content of the messages to test our underlying hypothesis. Half the agents received
control messages, while the other half received messages that linked Boston Market to
dinner. For example, for participants in the control [dinner] condition, the subject line of
the first email read ―Thinking About A Place to Eat [Thinking About Dinner]? Think
About Boston Market!‖ (see Appendix for the full text of the email update). The
association between Boston Market and dinner was mentioned 19 times across the three
email updates (compared to zero in the control condition). All other information between
conditions was identical.
Results
Data were analyzed using a hierarchical model similar to the one used in the
cross-campaign analysis. Since we focus on a single campaign, there are just two levels,
agent specific parameter heterogeneity and the idiosyncratic observation error. This
model assumes that conditional on each individual‘s unobserved propensity for talking,
experimental condition, and dinner association, the number of conversations is an over-
dispersed count following a Poisson log-normal distribution.
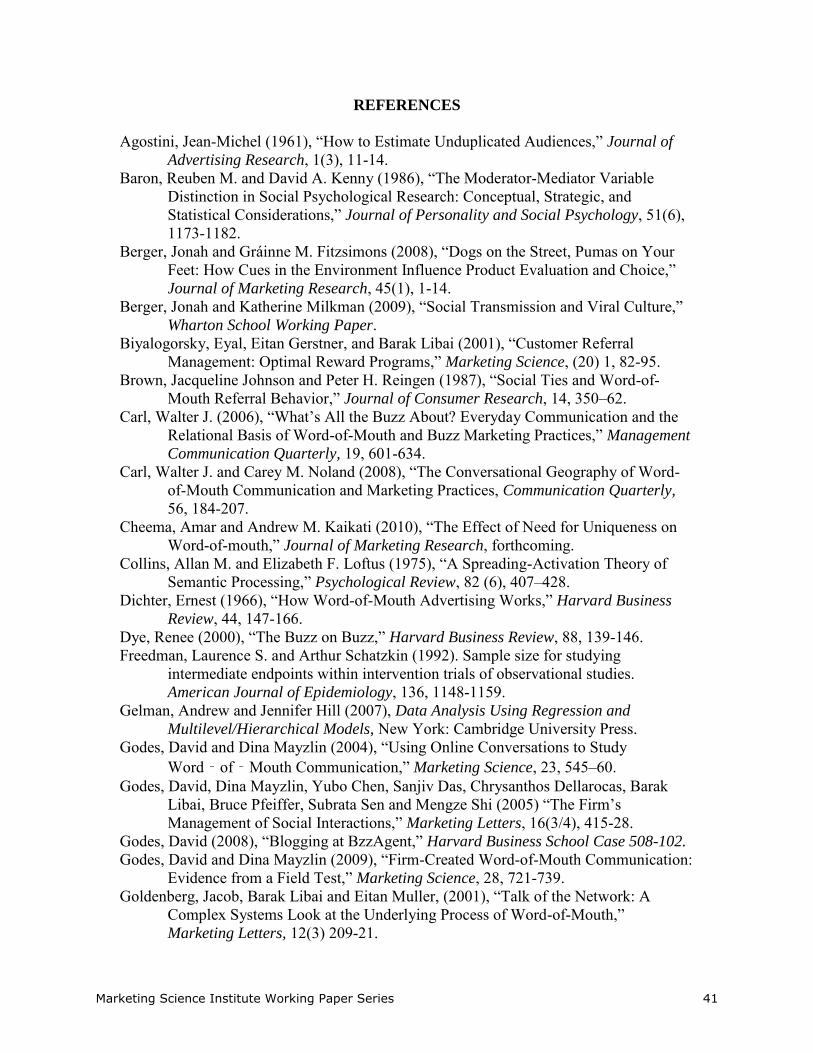
As predicted, broadening the potential set of cues for the product increased word-
of-mouth (Figure 2, following References). There was a significant message x pre-
existing product association interaction ( = -0.067, t = -2.15). Consistent with our
prediction, decomposition of the interaction one standard deviation above and below the
mean product association shows that while there was no effect of the message for
participants who already strongly associated Boston Market with dinner ( = -0.018, t = -
Marketing Science Institute Working Paper Series 26
0.28), it did have an effect among participants who did not associate the chain with that
usage situation. Among these people, the dinner message significantly increased WOM
( = 0.175, t = 2.74).
Stated another way, while the control condition shows that participants with
stronger pre-existing dinner associations naturally tended to talk about the brand more (
= 0.068, t = 2.90), the dinner message reduced this discrepancy. In the dinner condition,
participants with low pre-existing dinner associations now talked about the brand as often
as participants with high pre-existing dinner association ( = 0.001, t = 0.04).14
Discussion
The field study corroborates the results of the cross-campaign analysis; increasing
the cues for a product, in this case, linking it to a usage situation that some participants
did not already associate it with, increased WOM. Among participants who did not
already associate Boston Market with dinner, linking the product to that cue led them to
talk more about the brand. This moderation demonstrates that these effects are driven by
cueing rather than a particular message just happening to be more effective overall.
The interaction in these results can be seen as similar in flavor to the findings that
weaker brands get more of a lift out of referral rewards (Ryu and Feick 2007), and that in
the context of buzz marketing campaigns, WOM from less loyal consumers is more
effective at generating sales (Godes and Mayzlin 2009). Weaker brands likely get more
lift because stronger brands are already discussed, and less loyal customers likely boost
sales more because more loyal customers have already talked to their friends. Similarly,
as predicted, our manipulation had stronger effects among people who did not already
Marketing Science Institute Working Paper Series 27
associate the product with the cue because people who did already have that link likely
already share WOM upon exposure to the cue.
Consistent with the cross campaigns analysis, cues not only increased overall
WOM but also got more people to talk about the brand in the first place (i.e., reach). We
examined the effect of dinner association and our manipulation on whether people talk or
not. This reach model, much like the overall WOM model, yielded a significant
interaction ( = -0.078, t = -2.30). This underscores the notion that manipulating cues not
only increases overall WOM, but it does so by extending its reach.
General Discussion
Word-of-mouth is frequent and important. Social transmission can significantly
affect consumer choice and sales, and as a result, word of mouth campaigns have become
a standard part of many companies‘ marketing plans. But while it is clear that consumer
conversations impact product success, relatively little is known about why certain
products are talked about more than others. Further, while companies often give away
promotional items to encourage consumers to talk, little is known about the effectiveness
of such giveaways. Consequently, while it is clear that word of mouth has important
consequences, less is known about (1) the behavioral processes that drive these outcomes
and (2) how companies can design campaigns to increase word of mouth.
This research addresses both these issues. Analysis of over 300 buzz marketing
campaigns, as well as a field experiment using random assignment provides insight into
how product characteristics and campaign giveaways drive WOM. Products that are
Marketing Science Institute Working Paper Series 28
cued more frequently by the environment, whether by being used more often or
otherwise, are talked about more. Further, while we find little evidence that more
interesting products receive more WOM overall, the data suggest that interest may
predict how much people talk about a product right after they experience or learn about it.
Thus, taken together the results suggest that at least in the face to face WOM context
examined here, what people talk about is driven by what comes to mind. Cueing by the
environment is particularly important in driving ongoing conversations, and it appears to
shape both the number of people who talk and how much they do so. More broadly, by
combining empirical analysis of hundreds of products across dozens of categories with a
field experiment we bolster the generalizability of the results while underscoring the
causal role that cues play in increasing WOM.
In addition, our results suggest that promotional giveaways can be useful in
boosting word of mouth. That said, certain types of giveaways seem more effective, both
overall, and in generating reach and frequency. Giving away the product itself had the
largest effect, and appeared to boost both the number of people who talk and the
frequency with which they do so. The effects of the other giveaways were more mixed.
From both a managerial and psychological perspective, our analyses point to the
importance of decomposing word of mouth into frequency and reach. These metrics have
been shown to be useful in understanding media spending, and by not decomposing the
outcome into these two dimensions, we may be missing key drivers of WOM.
Overall, this research shows the benefits of drawing on behavioral theory and
statistical analysis of observational data to inform a randomized experiment in the field.
By mapping theory and findings onto the design and implementation the experiment, we
Marketing Science Institute Working Paper Series 29
further investigate the causal mechanism driving the observed findings, enhancing both
the contributions to theory and marketing practice.
Managerial implications
When designing products or marketing messages, our results suggest taking into
account the structure of the surrounding environment. Marketers often think that only
outrageous or surprising products are buzz-worthy (Dye 2000), but our findings indicate
(1) people do not recognize the role that cues may play in shaping WOM and (2) that
even seemingly mundane products can get lots of word of mouth if they are cued often.
By not only considering whether something will grab people‘s attention, but also whether
it will be triggered by the surrounding environment, managers can increase the chance
their products come to mind, which will increase WOM (as well as choice and sales,
Berger and Fitzsimons 2008; Nedungadi 1990).
Our results suggest that giveaways vary not only in overall effectiveness, but also
how they shape WOM reach and frequency. Consequently, managers should carefully
consider which of these outcomes they care about most. Reach should be particularly
useful when awareness drives sales, for example, as more people talking about the
product should increase the dispersion of word of mouth, which should increase product
success (Godes and Mayzlin 2004). Increased frequency, on the other hand, may help
generate brand evangelists. Further, given that two people talked to by one person are
more likely to themselves be connected than two people talked to by different people,
boosting frequency could also help foster brand communities.
Marketing Science Institute Working Paper Series 30
Whether giveaways are cost effective, however, depends on their cost and the
value of WOM. As noted earlier, giving away a product is associated with an additional
expected 43 conversations per 100 people, on average. If we assume that 10
conversations convert to even just one additional purchase, then as long as the cost of
mailing the product is less than four times its price, it is worth sending out a free product.
While precisely assigning a dollar value or the ROI of each buzz marketing campaign
element is beyond the scope of our data, the framework we use here should be considered
the first step for researchers and managers to run such a cost-benefit analysis.
These findings may also be useful in explaining relationships between buzz and
other factors. Both purchase rates and advertising budgets, for example, appear to be
positively correlated with word of mouth (Niederhoffer, et al. 2007). While many things
could explain these relationships, they are consistent with our cue-based approach.
Products that are purchased more often, or seen more often in advertisements, should be
more accessible, and thus, talked about more. While advertising and WOM are often
seen in opposition, they may actually be quite complementary (Keller and Libai 2009).
In addition to its direct benefit on sales, advertising may also have an indirect effect
through increasing WOM.
Limitations and future research
While some of the aspects we study here (i.e., promotional giveaways) may be
restricted to WOM campaigns, there is no reason to believe that the psychological drivers
which lead product characteristics to affect WOM, or make giveaways more effective,
should not also hold more generally. People who participate in buzz marketing
Marketing Science Institute Working Paper Series 31
campaigns may be more talkative than most, but regardless of any main effect, things like
cues should have similar effects among the rest of the population. Indeed, prior research
shows that WOM from agents in buzz marketing campaigns is similar to WOM from
regular individuals on a number of dimensions (Carl 2006), as is the WOM that agents
share whether they are in campaigns or not (Carl and Noland 2008).
With better individual level data, future work might examine the role of
individual heterogeneity in psychological drivers of buzz. The high degree of reliability
across the people rating our product characteristics suggests that there is a good degree of
overlap in what different people find interesting and cued by the environment. The fact
that these aggregate product- and campaign-level measures were related to buzz suggests
that these shared psychological aspects are useful in predicting collective outcomes.
There is certainly some variation, however, in what people find interesting or how often
they are cued. The retrospective nature of our analysis (i.e., most campaigns occurred
years ago) makes it impossible to get real-time ratings of each product from each
campaign participant, but doing so, particularly over time, would yield even more precise
estimates of the various drivers of buzz. This would also shed light on how much
individuals perceive different levels of each product characteristic (i.e., value of variable)
versus having different importance weights (i.e., coefficient) on what drives them to talk.
Though we did find any evidence that more interesting products receive more
WOM overall, this does not mean that interest (or other factors like surprise, novelty, or
originality) have no link to what is discussed. Indeed, our results provide some
suggestion that more interesting products may be talked about more right after people
Marketing Science Institute Working Paper Series 32
experience them (also see Moldovan et al. 2006). Future work might examine more
directly when interest does and does not shape word of mouth.
The factors examined here are by no means the only product aspects linked to
WOM. Consumers may talk more about products that have higher perceived risk or
uncertainty (Van den Bulte and Wuyts 2007), to collect information or reduce their
unease. Visible products or those used in public rather than private may generate more
WOM because their physical presence acts as a cue to remind people to talk about them.
Further, while our analysis focused on whether people talked about a product, future
research might also examine how product and campaign characteristics affect other
outcomes (e.g., the quality of conversations or whether those conversations translate into
sales). More interesting products, for example, may generate longer conversations.
One particularly rich area for further investigation is offline or face-to-face word
of mouth. Researchers often use online conversations, reviews, or content transmission to
study WOM (Berger and Milkman 2009; Godes and Mayzlin 2004; Moe 2009), but given
that most WOM occurs face-to-face (76%, Keller and Libai 2009) this area deserves
more attention.
This is particularly true given the potential differences between face-to-face and
online transmission (see Godes et al 2005). One potential difference may be the
threshold for discussion. One could argue that compared to face-to-face interactions, the
threshold for sharing things online is much higher. While some face-to-face interactions
are motivated, in many instances there is just conversational space that needs to be filled.
It is awkward to have dinner with a friend in silence, or ride in a cab with a colleague
without conversing, and so few things will be deemed too boring to talk about (consider
Marketing Science Institute Working Paper Series 33
how often people talk about the weather). With online WOM, however, the threshold is
often higher. Most decisions to post a review or share a news article are not driven by the
need to fill conversational space, but by the belief that there is useful or interesting
information to be passed along. More practically useful or surprising New York Times
articles, for example, are more likely to make the most emailed list (Berger and Milkman
2009). Consequently, factors like interest or practical utility may have a greater impact
on online transmission.
Another potential difference may be the temporal distance between first
experiencing or learning about the product and WOM. People often forward online
content (e.g., articles or videos) soon after they find it, but face-to-face interactions often
involve discussions about more distal experiences. When a friend asks for a book
recommendation, responses depend a lot on memory as people think back to what they
read recently. Consequently, how top of mind various experiences are (i.e., accessibility)
may play a larger role in face-to-face versus online WOM.
From a practical standpoint, it would also be worth investigating when WOM
intentions predict behavior. Many WOM studies use willingness or intentions to talk
(e.g., Harrison-Walker 2001), and many companies use measures like Net Promoter
Score, which ask consumers about their intentions to recommend. Our results, however,
suggest that intentions measures may not always be accurate. Further, such measures
may be biased in predictable ways. Intention measure may be driven by lay theories, but
in cases where consumers may have less insight into what drives their behavior (e.g.,
subtle cues in the environment) or rely on theories that may be incorrect (e.g., that people
talk more about interesting things) their predictions may be incorrect.
Marketing Science Institute Working Paper Series 34
The preceding analysis also suggests that WOM intentions should be reasonably
good at predicting online WOM or more motivated face-to-face interactions, because the
threshold to talk about something is high. People will only talk if something seems worth
talking about, and thus their intentions should be a reasonable proxy. On the other hand,
in cases of face-to-face WOM where less motivation exists, intentions may be less
accurate because people may overestimate talking about interesting things and
underestimate the prevalence of idle chatter about whatever comes to mind.
Future research might also examine how motivation and cues combine to drive
WOM. There are some situations where what people talk about may be driven more by
self-presentation, information gathering, or building social capital (e.g., Godes et al.
2005; Stephen and Lehmann 2009; Wojnicki and Godes 2009). Accessibility should still
play a role in these instances but potentially a more subordinate one. In the absence of
motivation, consumers may just talk about whatever comes to mind, but when a
particular motivation is active, they will likely select from accessible information based
on what best serves the driving motive.
In conclusion, word-of-mouth provides a fertile domain to integrate consumer
psychology and marketing science (Winer 1999; Wittink 2004). The emergence of social
media and online WOM has provided a wealth of data on what consumers say, share, and
do. While analyzing this data correctly requires an appropriate statistical toolkit, it
provides the opportunity to address a rich set of behaviorally and managerially relevant
questions.
Marketing Science Institute Working Paper Series 35
APPENDIX
Model Selection and Goodness of Fit
For the cross-campaign analysis models of overall WOM, we use the following
criteria for assessing the goodness of fit: Akaike Information Criterion (AIC), Bayesian Information Criterion (BIC), likelihood ration test (LRT), a scatter plot of campaign-level predictions versus actual data, and a histogram of predicted number of conversations versus actual data.
We consider a benchmark model containing no predictors to illustrate the relative amount of variation in each layer of unobserved heterogeneity (LL = -7993, AIC = 15,994, BIC = 16023). The three batches of parameters vary across 2,000 agents, 335 campaigns, and 10,968 observations according to independent normal distributions with means zero and standard deviations and = 0.79, respectively. This suggests that the variation across agents talking propensity and variation across the observation specific error are both greater than the variation across campaigns.
Among models including different product characteristics (Table 3), the model with the best (lowest) BIC and AIC is Model 3.2, which only includes cues and usage per week. In addition, a likelihood ratio test confirms this that adding cues is worthwhile ( 2(1) = 18, p < 0.0001), but adding interesting is not ( 2(1) = 2, p = 0.16). Therefore, Model 3.2 is referred to as the ―proposed model‖ and serves as the basis of comparison
for examining the effect of campaign giveaways. In fact, Model 4.2 and Model 3.2 are the same model, but different aspects of the model are presented in the two tables.
Among models including number of campaign giveaways versus both number and mere presence of those giveaways, the implications for model selection are mixed (Table 4). The model including both number and presence (Model 4.2) is worse than Model 4.1 in terms of BIC and only very slightly better in terms of AIC. The likelihood ratio test reveals that the extra four parameters are hardly worthwhile ( 2(4) = 8.0, p = 0.09). Nevertheless, the objective of this analysis is to test behavioral hypotheses by testing the significance of components of the coefficient vector, , so we use a model that captures the key aspects of the data and contains covariates allowing us to test these hypotheses. In this case, it is of interest to tease apart the effects of the number of giveaways and the mere presence of each.
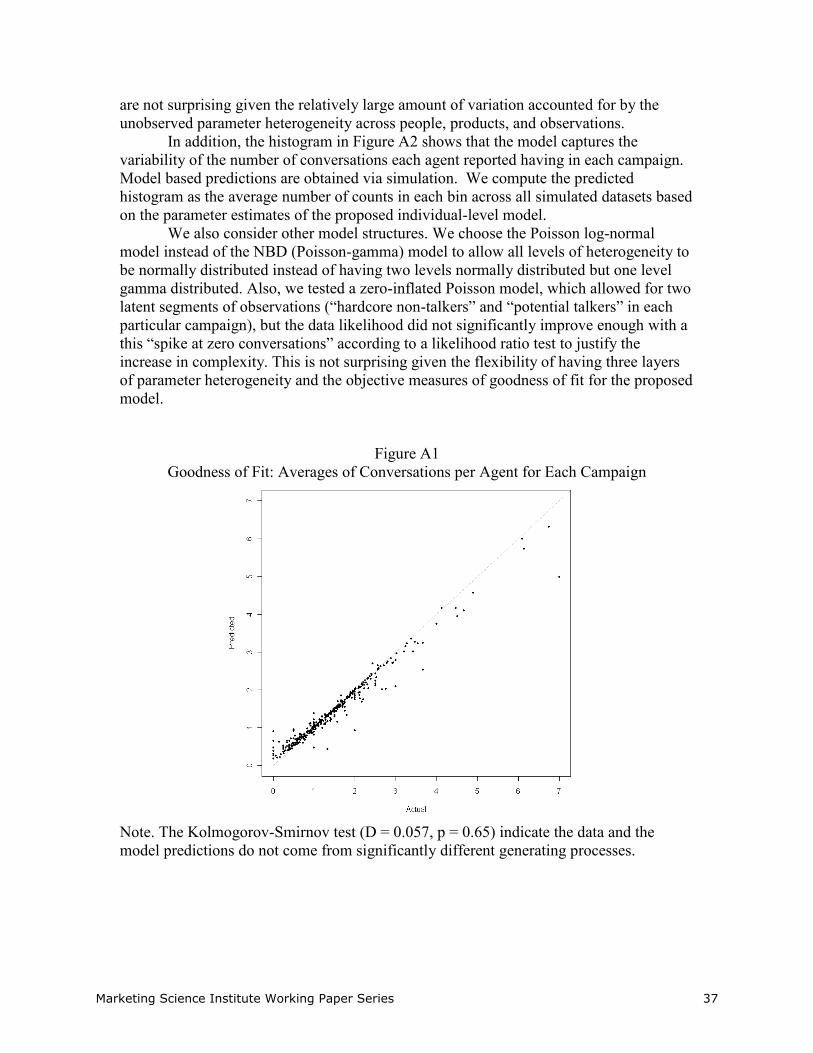
The scatter plot in Figure A1 shows that the model does capture the campaign-level average of number of conversations per agent. We look the campaign average because the questions of scientific interest deal with variation in talking across campaigns. We compare the proposed model‘s predictions of conversations per agent in
each campaign with the actual average. The predictions are calculated by taking the campaign-level average of the fitted values based on the individual-level multilevel model. Formally, the Kolmogorov-Smirnov test provides evidence that the proposed model fits the data well (D = 0.057, p = 0.65). We cannot reject the null hypothesis that the actual and predicted data have come from the same data generating process. The nested models also fit the data well, but not quite as well as the proposed model. The benchmark model without any predictors performs worse (D = 0.075, p = 0.31), followed by the model with only campaign characteristics, but no product characteristics (D = 0.063, p = 0.53). The relatively small improvements in fit by adding observed covariates
Marketing Science Institute Working Paper Series 36
are not surprising given the relatively large amount of variation accounted for by the unobserved parameter heterogeneity across people, products, and observations.
In addition, the histogram in Figure A2 shows that the model captures the variability of the number of conversations each agent reported having in each campaign. Model based predictions are obtained via simulation. We compute the predicted histogram as the average number of counts in each bin across all simulated datasets based on the parameter estimates of the proposed individual-level model.
We also consider other model structures. We choose the Poisson log-normal model instead of the NBD (Poisson-gamma) model to allow all levels of heterogeneity to be normally distributed instead of having two levels normally distributed but one level gamma distributed. Also, we tested a zero-inflated Poisson model, which allowed for two latent segments of observations (―hardcore non-talkers‖ and ―potential talkers‖ in each
particular campaign), but the data likelihood did not significantly improve enough with a this ―spike at zero conversations‖ according to a likelihood ratio test to justify the increase in complexity. This is not surprising given the flexibility of having three layers of parameter heterogeneity and the objective measures of goodness of fit for the proposed model.
Figure A1 Goodness of Fit: Averages of Conversations per Agent for Each Campaign
Note. The Kolmogorov-Smirnov test (D = 0.057, p = 0.65) indicate the data and the model predictions do not come from significantly different generating processes.
Marketing Science Institute Working Paper Series 37
Figure A2 Goodness of Fit: Histogram of Number of Conversations by Agents in CampaignsNote. A visual inspection of the fit of the histogram of number of conversations each agent had in a campaign shows that the model captures the distribution quite well.
Evidence of Mediation
Our goal is to test the hypothesis that the effect of product usage on WOM is
driven by cues. The fact that we have a multilevel generalized linear model means that meditational techniques based on ordinary least squares (OLS) are not sufficient. We follow the recommendation of causal inference work on testing mediation in multilevel models (Krull and Mackinnon 1999; Freedman and Schatzkin 1992). In OLS, the difference between the direct and indirect effect of the predictor is algebraically equivalent to the product of the effect of the predictor on the mediator and the effect of the mediator on the outcome (Baron and Kenny 1986). In a multilevel and non-linear model, this is not the case. By simply just looking at the difference in the change in the direct and indirect effect we can begin to understand the potential mediation. That is the difference in the coefficient of usage in Model 3.1 and in Model 3.2 is 0.020 (= 0.02019 - 0.00058). In other words, the effect of weekly product usage decreases in the presence of cues.
To quantify this difference, we use a test statistic specifically for multilevel models (Freedman and Schatzkin 1992). There is a strong correlation between product usage and cues (r = 0.43, p < 0.0001). This correlation is used to compute the Freedman-Schatzkin t-stat with N-2 degrees of freedom, where N is the number of observations. For our data, this test allows us to reject the null hypothesis and show evidence of mediation (t = 6.1 , p < 0.0001). On the other hand, the data do not support the reverse of this direction, but only support the hypothesized direction of our mediation. As an extra check, we use the linear model estimated with OLS on the aggregate campaign-level data to calculate the classic Sobel test statistic, which serves as another
Marketing Science Institute Working Paper Series 38
piece of evidence in support of mediation of the effect of product usage on WOM by cues (Sobel z = 3.7, p=0.0001).
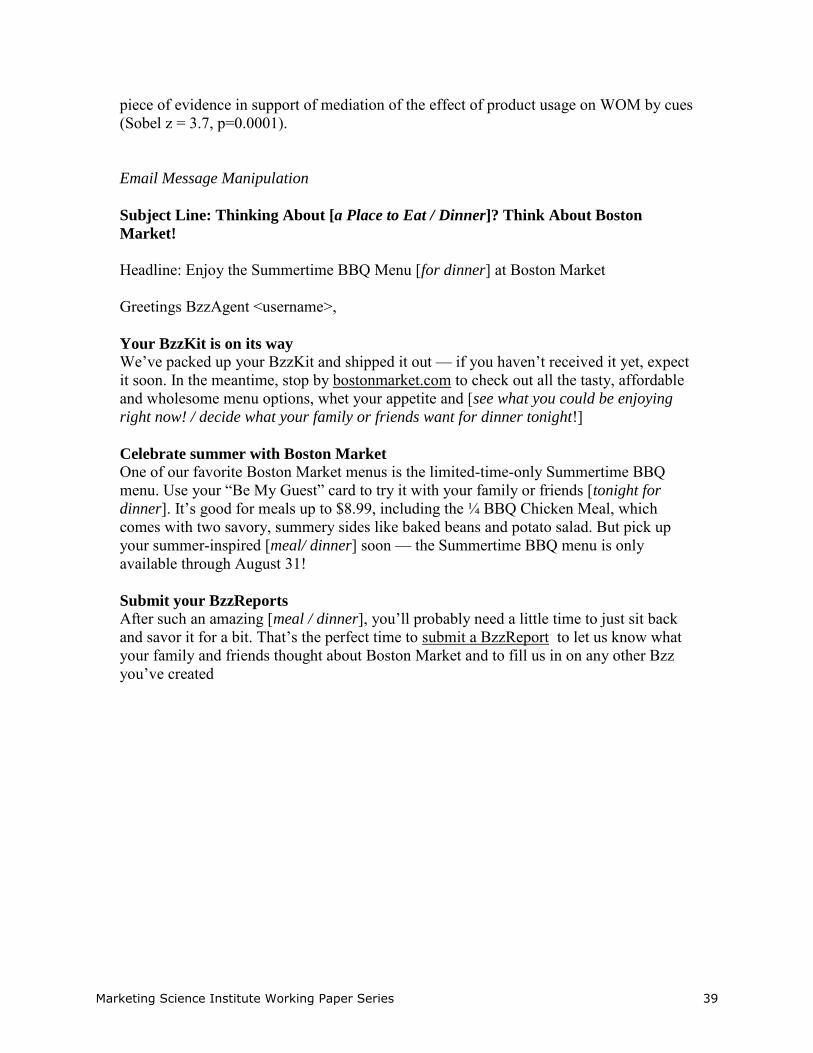
Email Message Manipulation
Subject Line: Thinking About [a Place to Eat / Dinner]? Think About Boston
Market!
Headline: Enjoy the Summertime BBQ Menu [for dinner] at Boston Market Greetings BzzAgent <username>, Your BzzKit is on its way
We‘ve packed up your BzzKit and shipped it out — if you haven‘t received it yet, expect
it soon. In the meantime, stop by bostonmarket.com to check out all the tasty, affordable and wholesome menu options, whet your appetite and [see what you could be enjoying
right now! / decide what your family or friends want for dinner tonight!] Celebrate summer with Boston Market
One of our favorite Boston Market menus is the limited-time-only Summertime BBQ menu. Use your ―Be My Guest‖ card to try it with your family or friends [tonight for
dinner]. It‘s good for meals up to $8.99, including the ¼ BBQ Chicken Meal, which comes with two savory, summery sides like baked beans and potato salad. But pick up your summer-inspired [meal/ dinner] soon — the Summertime BBQ menu is only available through August 31!
Submit your BzzReports
After such an amazing [meal / dinner], you‘ll probably need a little time to just sit back
and savor it for a bit. That‘s the perfect time to submit a BzzReport to let us know what your family and friends thought about Boston Market and to fill us in on any other Bzz you‘ve created
Marketing Science Institute Working Paper Series 39
Notes 1 Campaigns are generally sequential and most agents are involved in only one campaign at a time. 2 One could argue that people exaggerate the number of conversations they have to seem hard working, or under report due to laziness. If such biases exist, however, they should occur across campaigns. Other potential selection concerns are addressed in subsection on Potential Limitations. 3 Campaigns also differ in length, but 80% lasted between 10 and 13 weeks. Campaign length was set with clients before the start of campaigns and was not endogenously extended as campaigns progressed. BzzAgent believes that variation in campaign length should be independent of our variables of interest. We control for campaign length in each model. 4 High inter-rater reliability and the fact that these measures are averages both reduce measurement error. Any remaining noise should make it harder to find effects, as long as the unobserved heterogeneity of the independent measures is uncorrelated with unobserved biases in our dependent measure across individuals. 5 To best capture these aspects of the data we use a model that stems from the classic Item Response Theory (IRT) model (Gulliksen 1950; Lord 1980) and standard hierarchical modeling (Gelman and Hill 2007). The traditional IRT framework models individuals responding to various items; we model agents reporting conversations about various product campaigns. 6 We also consider models on the aggregate campaign-level data where the dependent variable is the average number of conversations per agent per campaign. The aggregate data (a) provide another test of the suggestion that cues mediates the effect of product usage on WOM (see Appendix) and (b) allow us to answer questions regarding moderating effect of timing, where the disaggregate count data are too sparse. 7 The coefficient values of the coded variables should be interpreted carefully, since these variables are proxies for latent constructs (e.g., interesting) rather than exact measures (e.g. whether a product was given away). The inferences do not change when controlling for price or product involvement, neither of which is significantly associated with WOM. This holds even when price is transformed (log, square root) or when outliers are removed. These variables are also not significantly correlated with any of the other predictors. 8 Though one could argue that this result is driven by the set of products studied, the fact that the data spans a large number of products (i.e., over 300) from a broad range of product categories (i.e., from movies and cars to household cleanser and food) casts doubt on this possibility. Further, the mean level of interest is similar to other work that has looked at a broad set of cultural items (Berger and Milkman 2009). 9 Intentions to talk were also correlated with ratings of surprise (r = .16, p < .005), novelty (r = .18, p < .001), and originality (r = .10, p = .06). 10 We use aggregate campaign-level data for this ancillary analysis because splitting the individual-level conversation data into two time parts left the data too sparse. We estimate the effects using a linear mixed effects model of WOM with random effects to for the two repeated measures from each campaign. Since campaigns vary in length, we performed the analysis on (1) all campaigns and (2) a focused set (125 campaigns) with the modal length (68- 72 days). Results are even stronger when the subset is used. 11Effects of campaign characteristics are based on Model 2, but results are robust across specifications. 12 By using a multilevel modeling approach, we control for the idiosyncratic and unmeasured factors that may affect each agent‘s talking propensity, each campaign‘s propensity to be talked about, and the
interaction of the two. Thus, any selection story would have to be told above and beyond these controls. 13 Another aspect of BzzAgent‘s allocation engine identifies and removes ―free loaders,‖ people who sign
up for many campaigns to receive free giveaways but have never talked.. This does not differ across campaigns nor should it be correlated with our drivers of interest. 14 Ancillary analyses cast doubt on the notion that these results could be explained by the manipulation making Boston Market seem more interesting or novel. A separate set of participants (N = 62) were given the text of either the control or dinner conditions from the main study and asked to rate how interesting they found Boston Market and how novel they found the campaign. Prior to reading the text, they also completed the measure of how much they associated Boston Market with dinner from the main study. Participants who more strongly associated the chain with dinner found the chain more interesting (β = 0.44,
SE = 0.14, t = 3.16, p < .002), but there were no main effects or interactions due to condition (ts < .90, ps >.39). This rules out the possibility that the dinner cue somehow made Boston Market more interesting overall, or more interesting among individuals who do not already associate the chain with dinner.
Marketing Science Institute Working Paper Series 40
REFERENCES
Agostini, Jean-Michel (1961), ―How to Estimate Unduplicated Audiences,‖ Journal of
Advertising Research, 1(3), 11-14. Baron, Reuben M. and David A. Kenny (1986), ―The Moderator-Mediator Variable
Distinction in Social Psychological Research: Conceptual, Strategic, and Statistical Considerations,‖ Journal of Personality and Social Psychology, 51(6), 1173-1182.
Berger, Jonah and Gráinne M. Fitzsimons (2008), ―Dogs on the Street, Pumas on Your Feet: How Cues in the Environment Influence Product Evaluation and Choice,‖
Journal of Marketing Research, 45(1), 1-14. Berger, Jonah and Katherine Milkman (2009), ―Social Transmission and Viral Culture,‖
Wharton School Working Paper. Biyalogorsky, Eyal, Eitan Gerstner, and Barak Libai (2001), ―Customer Referral
Management: Optimal Reward Programs,‖ Marketing Science, (20) 1, 82-95. Brown, Jacqueline Johnson and Peter H. Reingen (1987), ―Social Ties and Word-of-
Mouth Referral Behavior,‖ Journal of Consumer Research, 14, 350–62. Carl, Walter J. (2006), ―What‘s All the Buzz About? Everyday Communication and the
Relational Basis of Word-of-Mouth and Buzz Marketing Practices,‖ Management
Communication Quarterly, 19, 601-634. Carl, Walter J. and Carey M. Noland (2008), ―The Conversational Geography of Word-
of-Mouth Communication and Marketing Practices, Communication Quarterly,
56, 184-207. Cheema, Amar and Andrew M. Kaikati (2010), ―The Effect of Need for Uniqueness on
Word-of-mouth,‖ Journal of Marketing Research, forthcoming. Collins, Allan M. and Elizabeth F. Loftus (1975), ―A Spreading-Activation Theory of
Semantic Processing,‖ Psychological Review, 82 (6), 407–428. Dichter, Ernest (1966), ―How Word-of-Mouth Advertising Works,‖ Harvard Business
Review, 44, 147-166. Dye, Renee (2000), ―The Buzz on Buzz,‖ Harvard Business Review, 88, 139-146. Freedman, Laurence S. and Arthur Schatzkin (1992). Sample size for studying
intermediate endpoints within intervention trials of observational studies. American Journal of Epidemiology, 136, 1148-1159.
Gelman, Andrew and Jennifer Hill (2007), Data Analysis Using Regression and
Multilevel/Hierarchical Models, New York: Cambridge University Press. Godes, David and Dina Mayzlin (2004), ―Using Online Conversations to Study
Libai, Bruce Pfeiffer, Subrata Sen and Mengze Shi (2005) ―The Firm‘s
Management of Social Interactions,‖ Marketing Letters, 16(3/4), 415-28. Godes, David (2008), ―Blogging at BzzAgent,‖ Harvard Business School Case 508-102.
Godes, David and Dina Mayzlin (2009), ―Firm-Created Word-of-Mouth Communication: Evidence from a Field Test,‖ Marketing Science, 28, 721-739.
Goldenberg, Jacob, Barak Libai and Eitan Muller, (2001), ―Talk of the Network: A
Complex Systems Look at the Underlying Process of Word-of-Mouth,‖
Marketing Letters, 12(3) 209-21.
Marketing Science Institute Working Paper Series 41
Goldenberg, Jacob, Sangman Han, Donald R. Lehmann and Jaewon Hong (2009), ―The
Role of Hubs in the Adoption Process,‖ Journal of Marketing, 73(March), 1-13 Gulliksen, Harold (1950). Theory of Mental Tests. New York: Wiley. Harrison-Walker, L. Jean (2001), ―The Measurement of Word-of-Mouth Communication
and an Investigation of Service Quality and Customer Commitment as Potential Antecedents,‖ Journal of Service Research, 4 (August), 60-75.
Hahn, Matthew W. and R. Alexander Bentley (2003), ―Drift as a Mechanism for Cultural
Change: An Example from Baby Names,‖ Proceedings of the Royal Society
London B, Biology Letters, 270, S120-S123. Heath, Chip, Chris Bell, and Emily Sternberg (2001), ―Emotional Selection in Memes:
The Case of Urban Legends. Journal of Personality and Social Psychology, 81, 1028-1041.
Irwin, Julie R. and Gary H. McClelland (2001), ―Misleading Heuristics and Moderated
Multiple Regression Models,‖ Journal of Marketing Research, 38 (February), 100–109.
Iyengar, Raghuram, Christophe Van den Bulte, and Thomas W. Valente (2009), ―Opinion
Leadership and Social Contagion in New Product Diffusion,‖ working paper. Kashima, Yoshi (2008), ―A social psychology of cultural dynamics: examining how
cultures are formed, maintained, and transformed,‖ Social and Personality
Psychology Compass, 2, 107-120. Katz, Elihu and Paul F. Lazarsfeld (1955), Personal Influence; the Part Played by People
in the Flow of Mass Communications, Glencoe, IL: Free Press. Keller, Ed and Barak Libai (2009) ―A Holistic Approach to the Measurement of WOM,"
ESOMAR Worldwide Media Measurement Conference, Stockholm. Keller Fay Group (2006), ―The Steak is the Sizzle: A Study on Product attributes that
Drive Word-of-Mouth Success,‖
http://www.bzzagent.com/downloads/Keller_Fay_Product_Drivers_Study.pdf Krull, Jennifer L. and David P. MacKinnon (1999). Multilevel mediation modeling in
group based intervention studies. Evaluation Review, 33, 418-444. Leskovec, Jure, Lada A. Adamic, and Bernardo A. Huberman (2007), ―The Dynamics of
Viral Marketing,‖ ACM TWeb 1(1). Lord, Frederic. M. (1980). Applications of Item Response Theory to Practical Testing
Problems. Hillsdale, New Jersey: Erlbaum Associates. Lynch, John R. Jr. and Thomas K. Srull (1982), ―Memory and Attentional Factors in
Consumer Choice: Concepts and Research Methods,‖ Journal of Consumer Research, 9 (June), 18-37.
Moe, Wendy W (2009), ―How Much Does a Good Product Rating Help a Bad Product?
Modeling the Role of Product Quality in the Relationship between Online Consumer Ratings and Sales,‖ University of Maryland Working Paper.
Moldovan, Sarit, Jacob Goldenberg, and Amitava Chattopadhyay (2006), ―What Drives
Word-of-Mouth? The Roles of Product Originality and Usefulness,‖ MSI working
papers series, report number 06-111. Nedungadi, Prakash (1990), ―Recall and Consumer Consideration Sets: Influencing
Choice Without Altering Brand Evaluations,‖ Journal of Consumer Research, 17 (December), 263–76.
Marketing Science Institute Working Paper Series 42
Niederhoffer, Kate, Rob Mooth, David Wiesenfeld and Jonathon Gordon (2007), ―The
Origin and Impact of CPG New-Product Buzz: Emerging Trends and Implications,‖ Journal of Advertising Research, 47(4), 420-426.
Rosen, Emanuel (2009), The Anatomy of Buzz Revisited: Real-life lessons in Word-of-
Mouth Marketing, New York: Doubleday. Rossiter, John R. and Peter J. Danaher, (1998), Advanced Media Planning, Norwell, MA:
Kluwer Academic Publishers. Ryu, Gangseog and Lawrence Feick. (2007), ―A Penny for Your Thoughts: Referral
Reward Programs and Referral Likelihood,‖ Journal of Marketing, 71(1), 84-94. Salganik, Matthew J., Peter S. Dodds, and Duncan J. Watts (2006), ―Experimental Study
of Inequality and Unpredictability in an Artificial Cultural Market.‖ Science, 311, 854-856.
Schaller, Mark and Christian Crandall (2004), The Psychological Foundations of Culture, Mahwah, NJ: Lawrence Erlbaum Associates.
Stephen, Andrew and Donald R. Lehmann (2009), ―Why Do People Spread Word-of-Mouth? Effects of Recipient and Relationship Characteristics on Transmission Behaviors,‖ INSEAD Working Paper.
Van den Bulte, Christophe and Stefan Wuyts (2009), Leveraging Customer Networks, in The Network Challenge: Strategy, Profit, and Risk in an Interlinked World, Paul R. Kleindorfer and Yoram (Jerry) Wind, eds., Upper Saddle River, NJ, Wharton School Publishing.
Watts, Duncan J. (2002), ―A simple model of global cascades on random networks,‖
Proceedings of the National Academy of Sciences, 99, 5766-5771. Watts, Duncan J. and Peter Sheridon Dodds (2007), ―Influentials, Networks, and Public
Opinion Formation,‖ Journal of Consumer Research, 34, 441-458. Winer, Russell S. (1999), ―Experimentation in the 21st Century: The Importance of
External Validity,‖ Journal of the Academy of Marketing Science, 27 (3), 349–58 Wittink, Dick R. (2004) ―Journal of Marketing Research: 2 Ps,‖ Journal of Marketing
Research, 41 (February), 1–6. Wojnicki, Andrea C. and Dave Godes (2008), ―Word-of-Mouth as Self-Enhancement,‖
University of Toronto Working Paper. Wu, Fang and Bernardo Huberman (2007), ―Novelty and collective attention,‖
Proceedings of the National Academy of Sciences, 105(45), 17599-17601.
Marketing Science Institute Working Paper Series 43
Figure 1 Cross-Campaign Data: Relative Frequency of Number of Conversations by Agents in a
Campaign
Notes. Based on a the sample of all observations from 2,000 agents across 335 campaigns.
Marketing Science Institute Working Paper Series 44
Figure 2 Field Experiment: Effect of Dinner Message on WOM is Strongest for People with Weak
Dinner Association
Notes. The four points indicate the predicted WOM at one standard deviation below and above the average dinner association for each treatment condition (Dinner Message and Control Message). Hypothesis test for spotlight analysis was conducted following Irwin and McClelland (2001).
Marketing Science Institute Working Paper Series 45
Table 1 Summary of Product and Campaign Characteristics and Product Categories
Marketing Science Institute Working Paper Series 46
Table 2 Correlation Matrix for Product Characteristics and Campaign Giveaways
Notes: Shaded values indicate absolute value of correlation larger than 0.30 and a difference from 0 at the 5% significance level.
Marketing Science Institute Working Paper Series 47
Notes. Campaign Giveaways indicates a set of variables for both the number of each item and an indicator to control for each item‘s mere presence (see Table 4). In addition, the models include a control for campaign length (weeks), whether a product could be given away, and an intercept. Estimates that are statistically significant (p < 0.05) are bold and starred. AIC is Akaike Information Criterion, and BIC is Bayesian Information Criterion. The hierarchical models are not estimated using fully Bayesian inference, rather by quasi-likelihood estimation technique involving a Laplace approximation. This procedure is standard in statistical packages like R and SAS for multilevel mixed models. The t-statistics are computed based on asymptotic standard errors. Equivalently, we could display confidence intervals (e.g., coefficient plus/minus approximately two standard errors) to reflect the variability in the estimates and examine the intervals‘
coverage of zero.
Marketing Science Institute Working Paper Series 48
Table 4 Cross-Campaign Analysis: Campaign Giveaways and Reach and Frequency Models
Notes. Estimates that are statistically significant (p < 0.05) are bold and starred. The models include a control for campaign length (weeks) and whether a product could be given away.
Marketing Science Institute Working Paper Series 49