30
What we know and what we don’t know about twaite shad in the Severn Estuary in relation to predicting the impact of tidal power schemes. Miran Aprahamian APEM / IFM April 25 2017
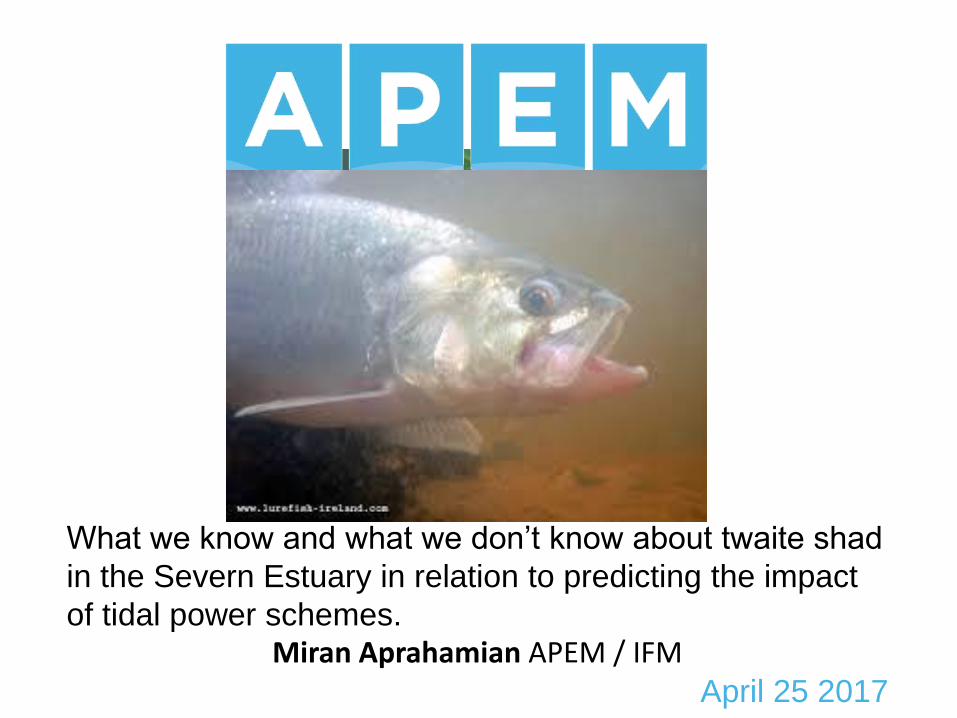
What we know and what we don’t know about twaite shad
in the Severn Estuary in relation to predicting the impact
of tidal power schemes.Miran Aprahamian APEM / IFM
April 25 2017
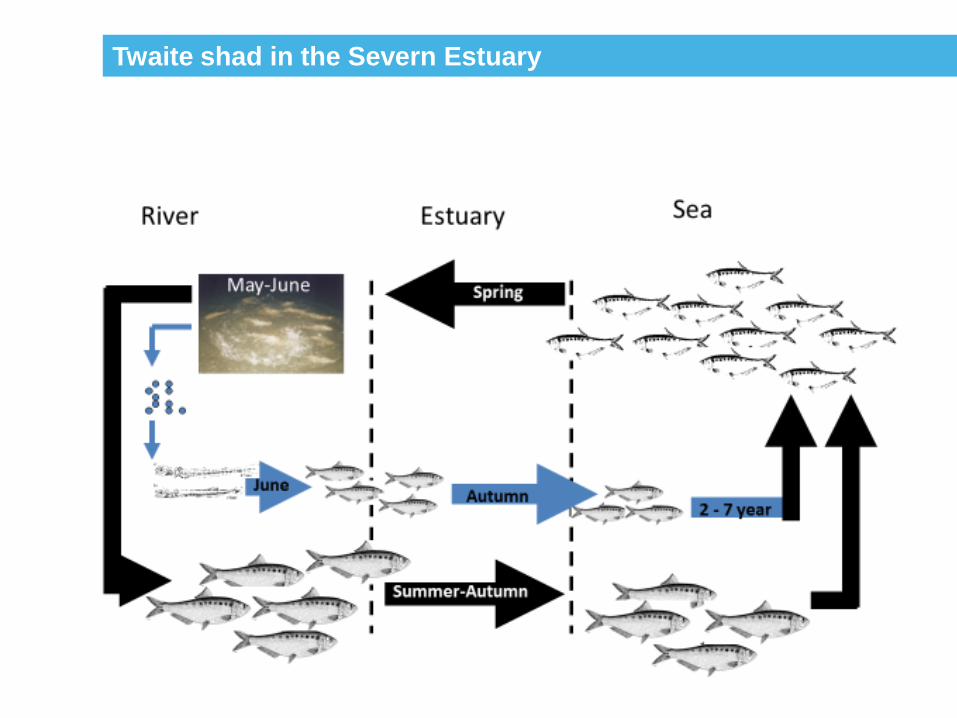
Twaite shad in the Severn Estuary
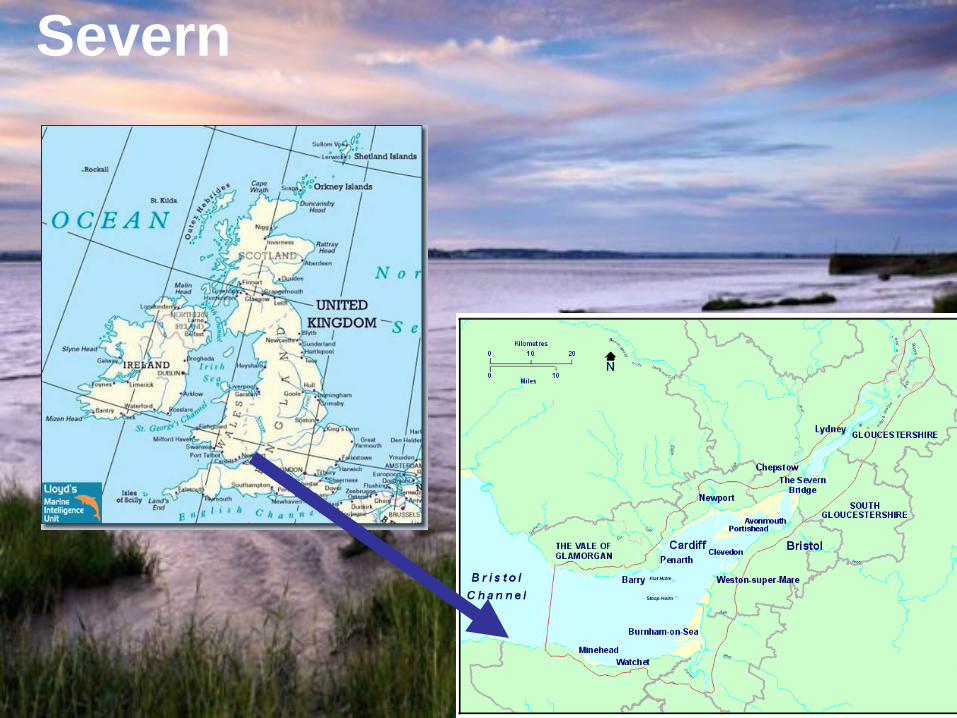
Severn
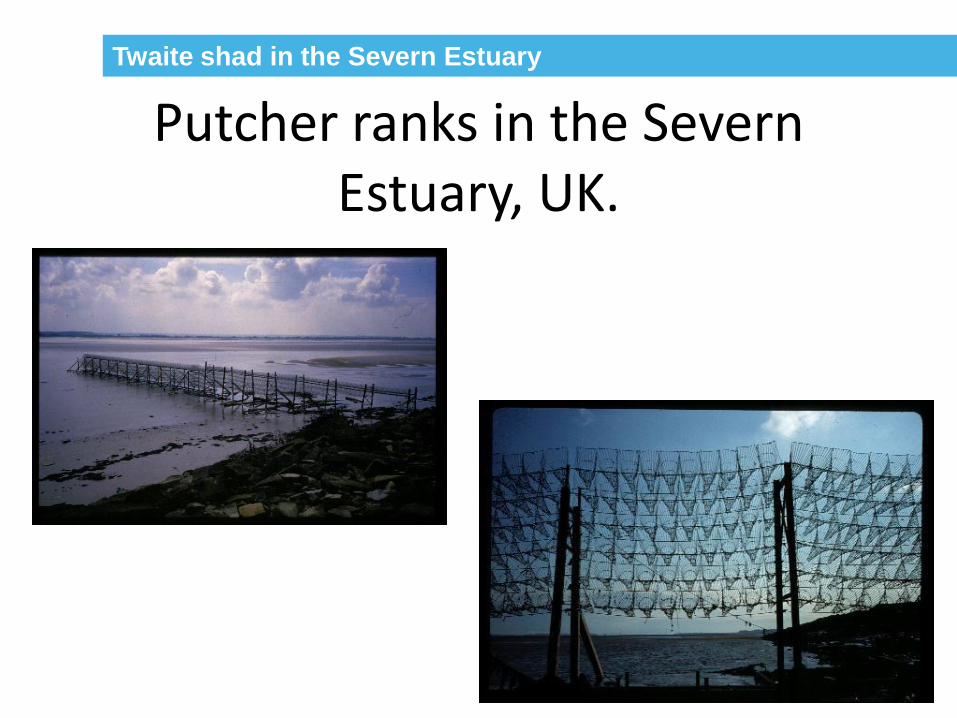
Twaite shad in the Severn Estuary
Putcher ranks in the Severn Estuary, UK.
Twaite shad in the Severn Estuary
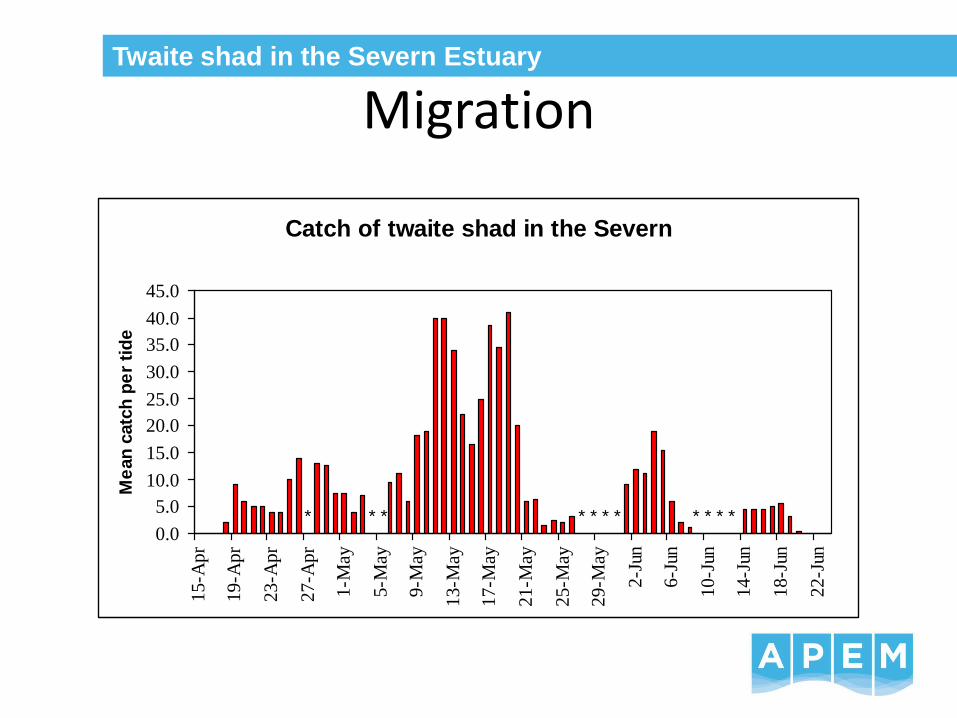
Migration
Catch of twaite shad in the Severn
0.0
5.0
10.0
15.0
20.0
25.0
30.0
35.0
40.0
45.0
15
-Ap
r
19
-Ap
r
23
-Ap
r
27
-Ap
r
1-M
ay
5-M
ay
9-M
ay
13
-May
17
-May
21
-May
25
-May
29
-May
2-J
un
6-J
un
10
-Jun
14
-Jun
18
-Jun
22
-Jun
Me
an
catc
h p
er
tid
e
* * * * * * * * * * *
Twaite shad in the Severn Estuary
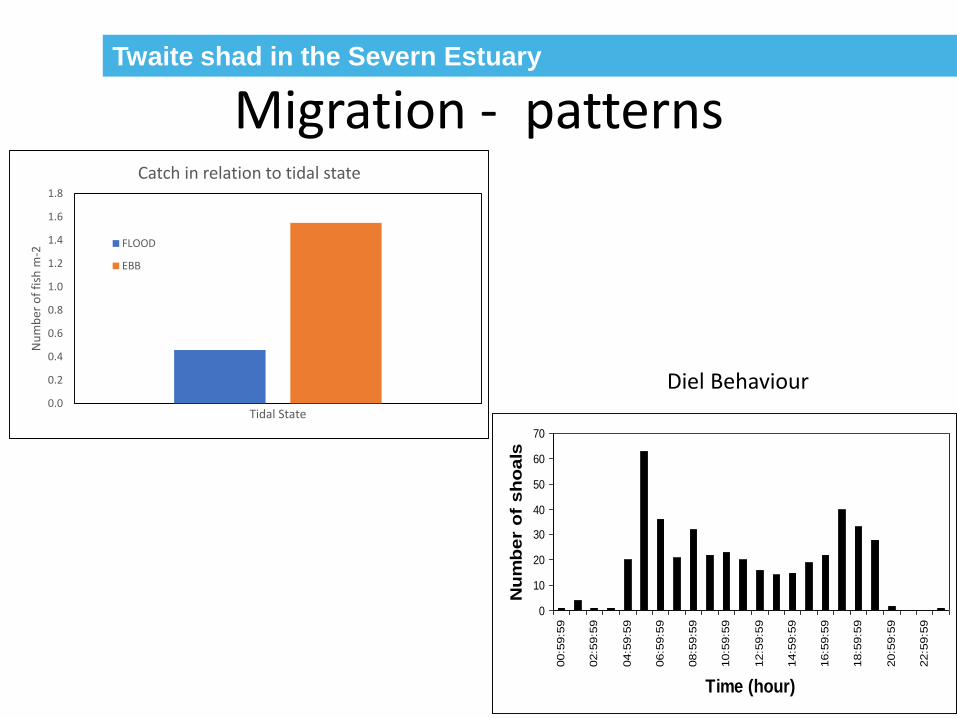
Migration - patterns
0.0
0.2
0.4
0.6
0.8
1.0
1.2
1.4
1.6
1.8
Nu
mb
er o
f fi
sh m
-2
Tidal State
Catch in relation to tidal state
FLOOD
EBB
0
10
20
30
40
50
60
70
00:5
9:5
9
02:5
9:5
9
04:5
9:5
9
06:5
9:5
9
08:5
9:5
9
10:5
9:5
9
12:5
9:5
9
14:5
9:5
9
16:5
9:5
9
18:5
9:5
9
20:5
9:5
9
22:5
9:5
9
Time (hour)
Nu
mb
er
of
sh
oals
Diel Behaviour
Twaite shad in the Severn Estuary
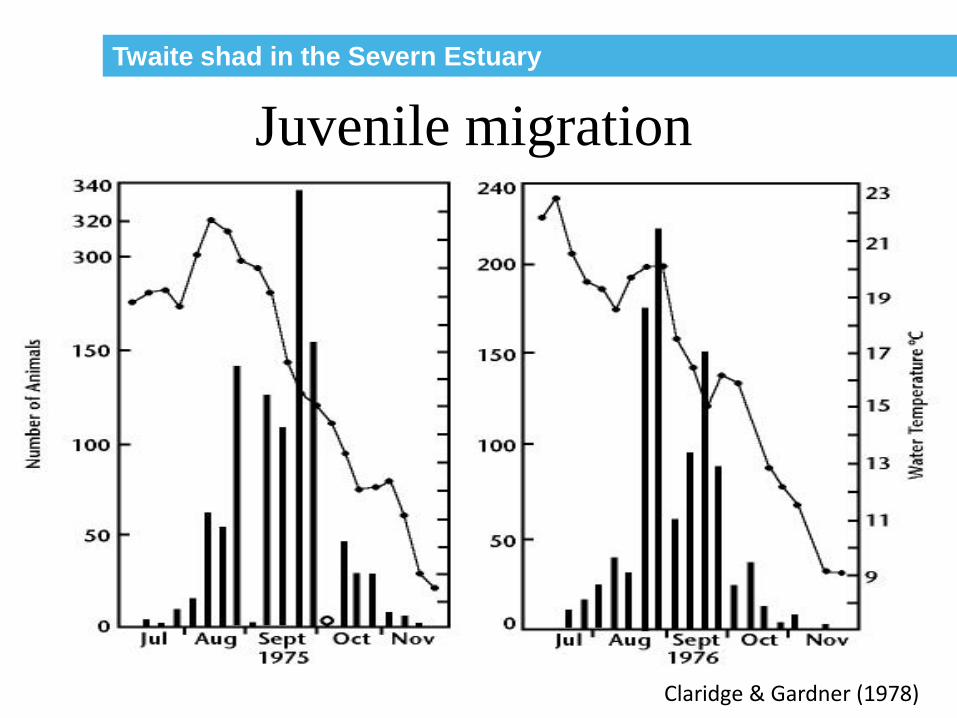
Juvenile migration
Claridge & Gardner (1978)
Twaite shad in the Severn Estuary
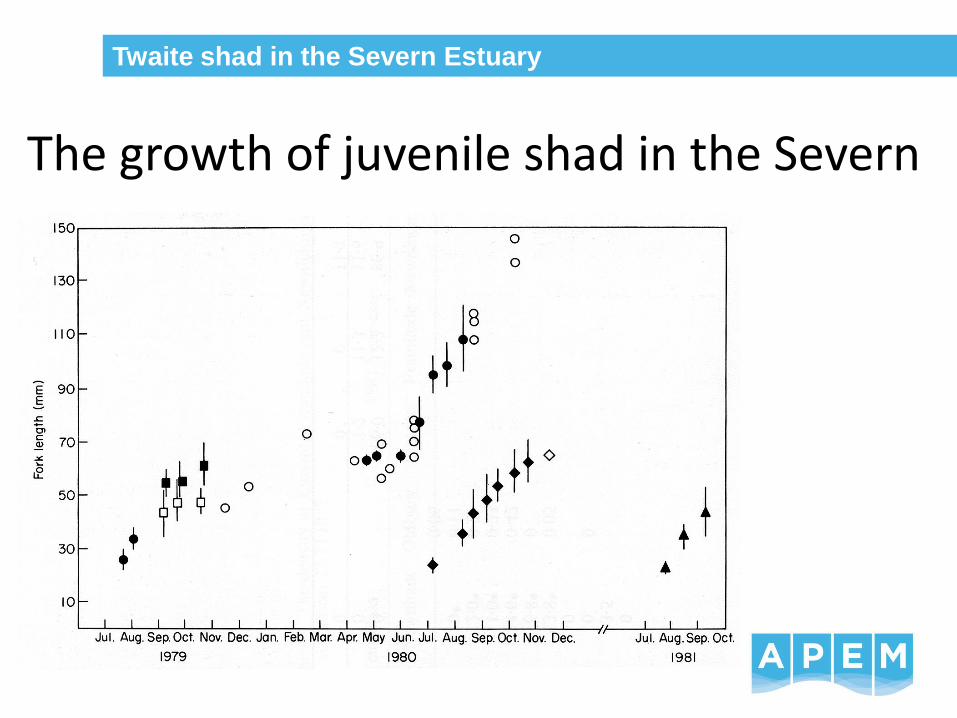
The growth of juvenile shad in the Severn
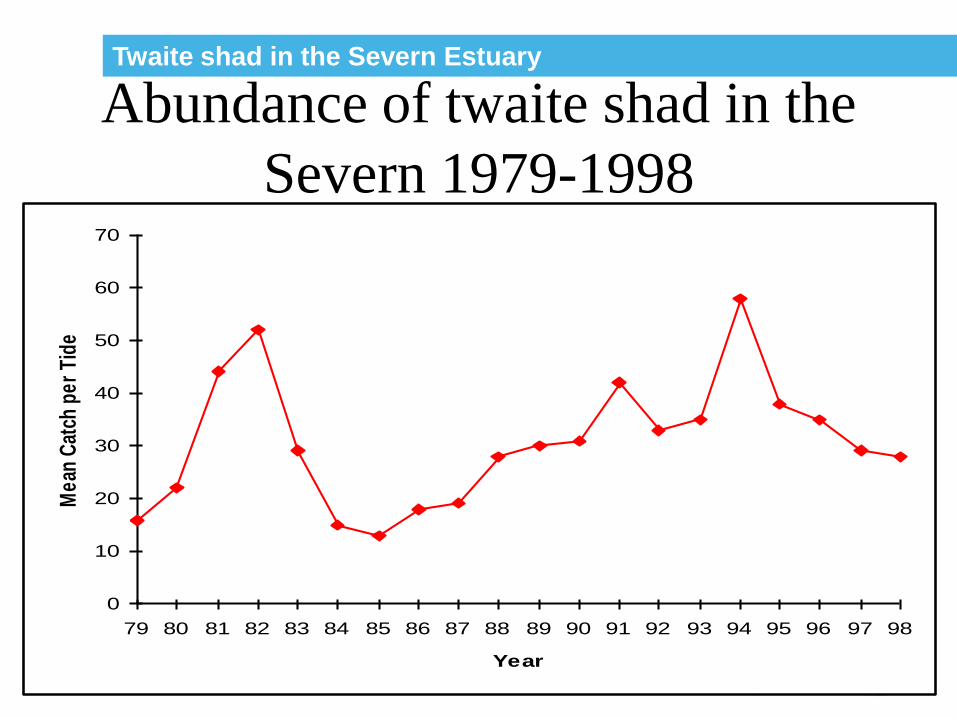
Twaite shad in the Severn Estuary
Abundance of twaite shad in the
Severn 1979-1998
0
10
20
30
40
50
60
70
79 80 81 82 83 84 85 86 87 88 89 90 91 92 93 94 95 96 97 98
Year
Mea
n C
atch
per
Tid
e
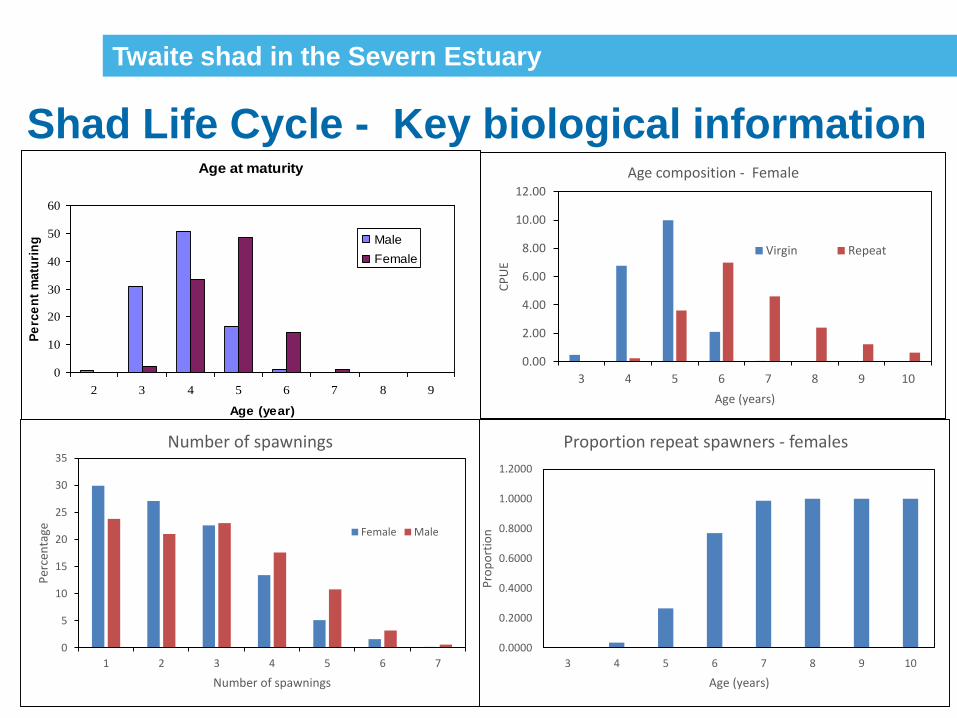
Shad Life Cycle - Key biological information
Twaite shad in the Severn Estuary
Age at maturity
0
10
20
30
40
50
60
2 3 4 5 6 7 8 9
Age (year)
Pe
rce
nt
ma
turi
ng Male
Female
0.0000
0.2000
0.4000
0.6000
0.8000
1.0000
1.2000
3 4 5 6 7 8 9 10
Pro
po
rtio
n
Age (years)
Proportion repeat spawners - females
0.00
2.00
4.00
6.00
8.00
10.00
12.00
3 4 5 6 7 8 9 10
CP
UE
Age (years)
Age composition - Female
Virgin Repeat
0
5
10
15
20
25
30
35
1 2 3 4 5 6 7
Per
cen
tage
Number of spawnings
Number of spawnings
Female Male
1986
0
20
40
3 4 5 6 7 8 9 > 10
1987
0
20
40
3 4 5 6 7 8 9 > 10
1988
0
20
40
3 4 5 6 7 8 9 > 10
1989
0
20
40
3 4 5 6 7 8 9 > 10
1990
0
20
40
3 4 5 6 7 8 9 > 10
1991
0
20
40
3 4 5 6 7 8 9 > 10
1992
0
20
40
3 4 5 6 7 8 9 > 10
1993
0
20
40
3 4 5 6 7 8 9 > 10
1994
0
20
40
3 4 5 6 7 8 9 > 10
1995
0
20
40
3 4 5 6 7 8 9 > 10
1996
0
20
40
3 4 5 6 7 8 9 > 10
1997
0
20
40
3 4 5 6 7 8 9 > 10
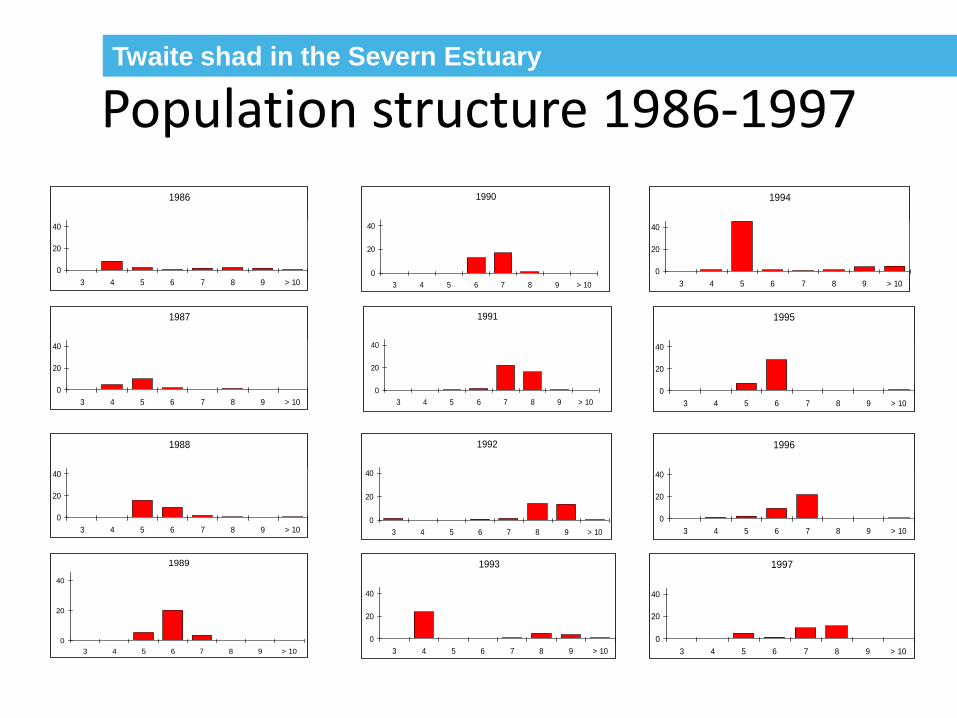
Population structure 1986-1997Twaite shad in the Severn Estuary
Twaite shad in the Severn Estuary
0
20
40
60
80
100
120
Nu
mb
er o
f O
+ A
losa
fal
lax
Year class
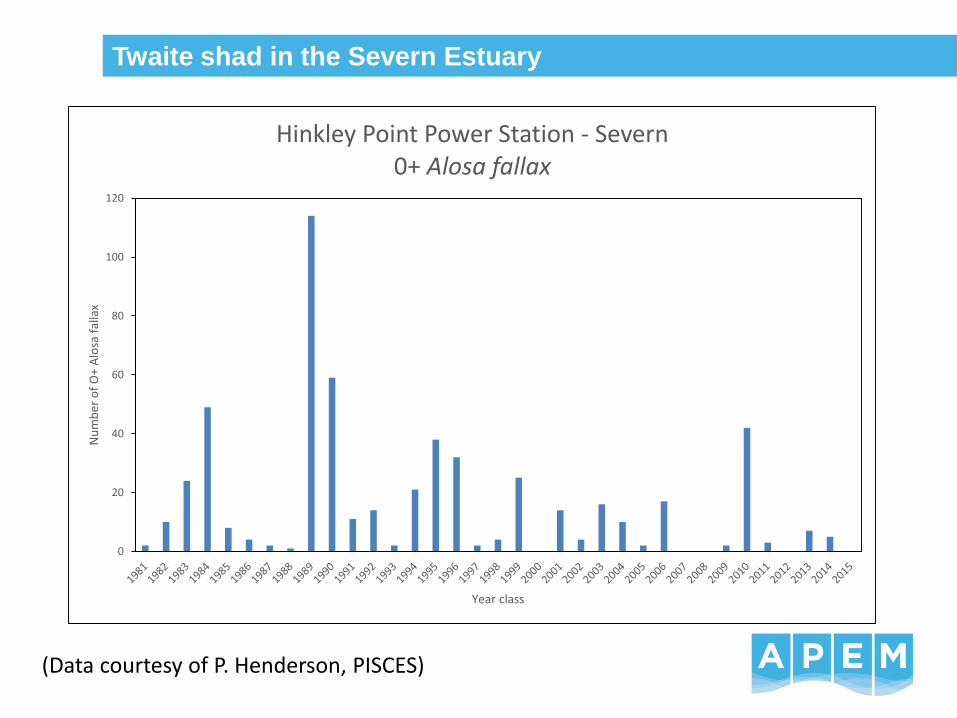
Hinkley Point Power Station - Severn0+ Alosa fallax
(Data courtesy of P. Henderson, PISCES)

Twaite shad in the Severn Estuary
YCS in relation to mean June-August temperature
y = 0.851x - 13.341
R2 = 0.7708
0.00
0.50
1.00
1.50
2.00
2.50
3.00
3.50
4.00
16.0 17.0 18.0 19.0 20.0
Mean daily temperature (degrees celsius)
Lo
ge
Ye
ar
cla
ss
str
en
gth
Twaite shad in the Severn Estuary
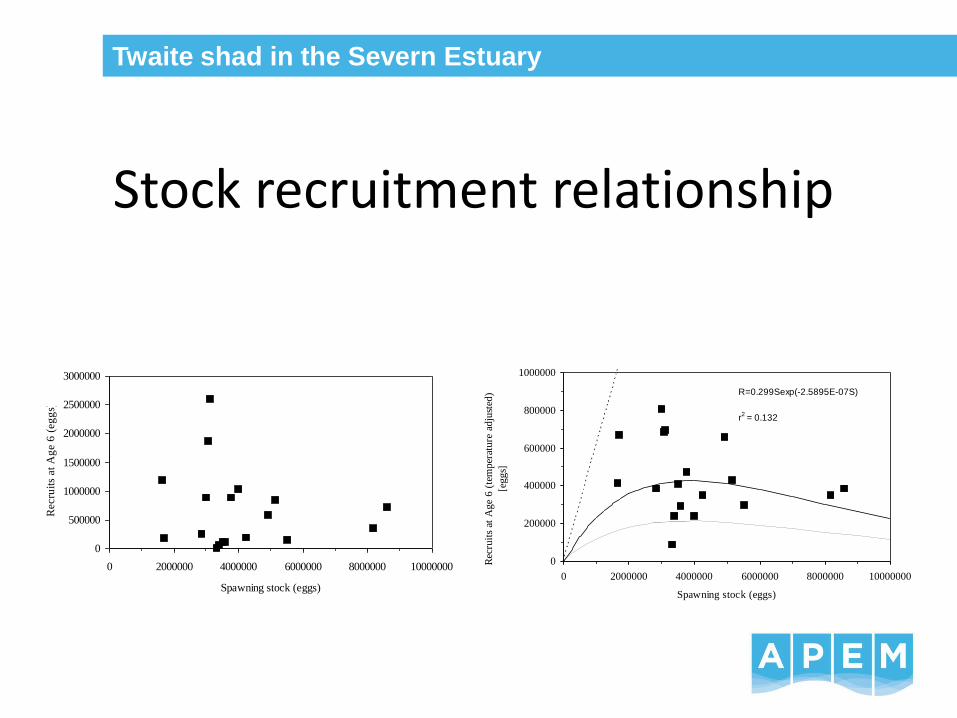
Stock recruitment relationship
0
500000
1000000
1500000
2000000
2500000
3000000
0 2000000 4000000 6000000 8000000 10000000
Spawning stock (eggs)
Recru
its
at
Ag
e 6
(eg
gs)
0
200000
400000
600000
800000
1000000
0 2000000 4000000 6000000 8000000 10000000
Spawning stock (eggs)
Rec
ruit
s at
Ag
e 6
(te
mp
erat
ure
ad
just
ed)
[eg
gs]
R=0.299Sexp(-2.5895E-07S)
r2 = 0.132
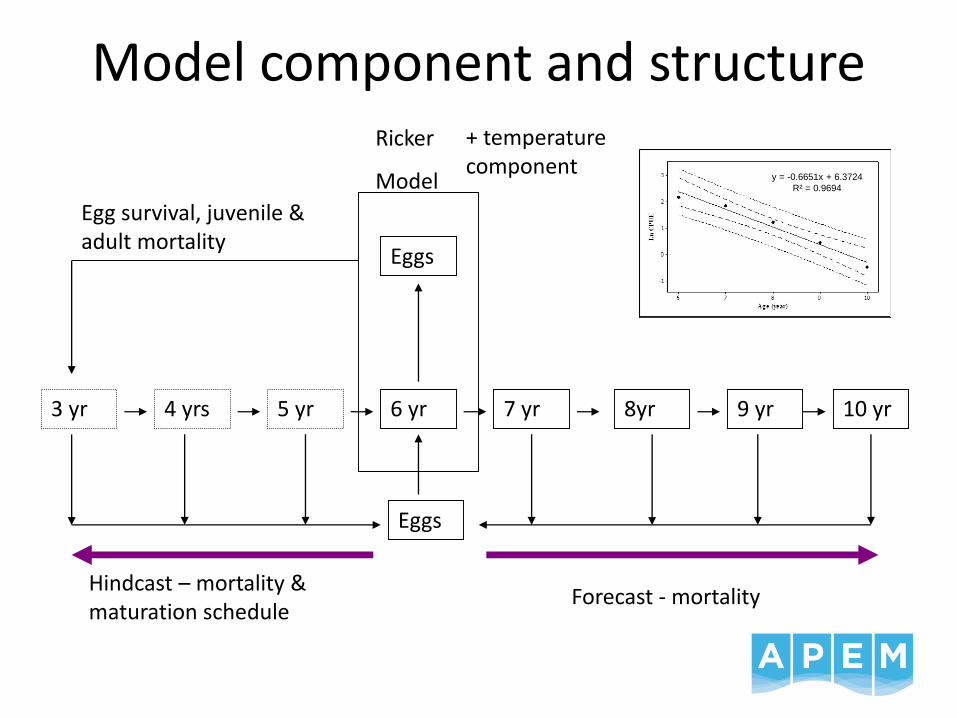
Model component and structure
Eggs
5 yr 10 yr9 yr 8yr7 yr6 yr
Eggs
3 yr 4 yrs
Ricker
Model
Egg survival, juvenile & adult mortality
+ temperature component
Hindcast – mortality & maturation schedule
Forecast - mortality
y = -0.6651x + 6.3724
R² = 0.9694

Twaite shad in the Severn Estuary
Influence of temperature on S/R relationship
0
2000000
4000000
6000000
8000000
10000000
12000000
0 1000000
2000000
3000000
4000000
5000000
6000000
7000000
8000000
9000000
10000000
Stock (eggs)
Recru
its (
eg
gs)
+2oC
+1oC
Current
1;1
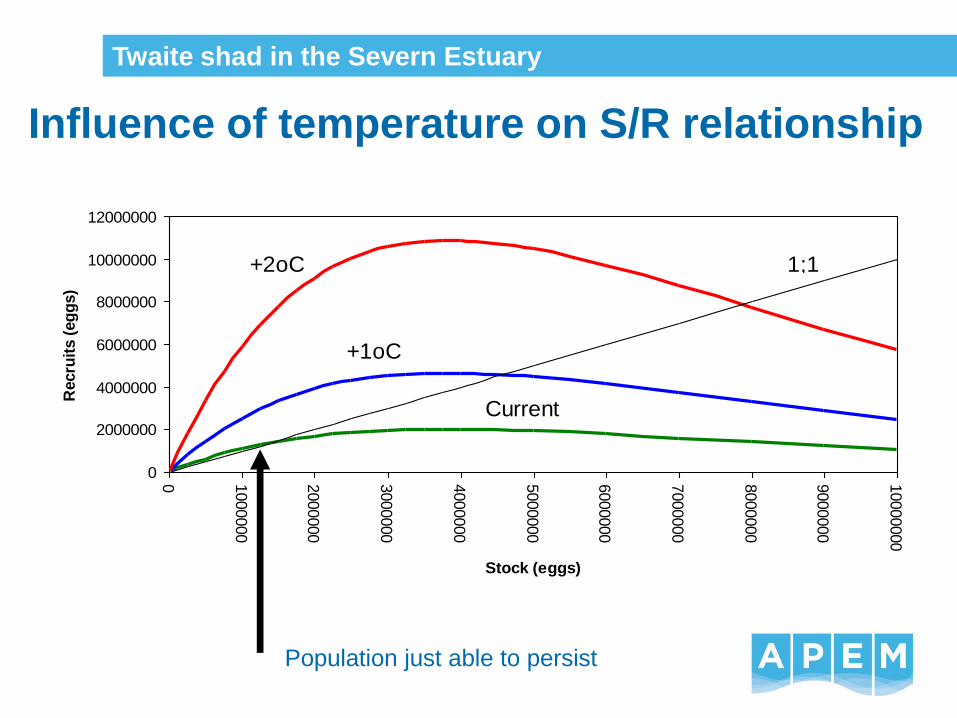
Twaite shad in the Severn Estuary
Influence of temperature on S/R relationship
0
2000000
4000000
6000000
8000000
10000000
12000000
0 1000000
2000000
3000000
4000000
5000000
6000000
7000000
8000000
9000000
10000000
Stock (eggs)
Recru
its (
eg
gs)
+2oC
+1oC
Current
1;1
Population just able to persist
Twaite shad in the Severn Estuary
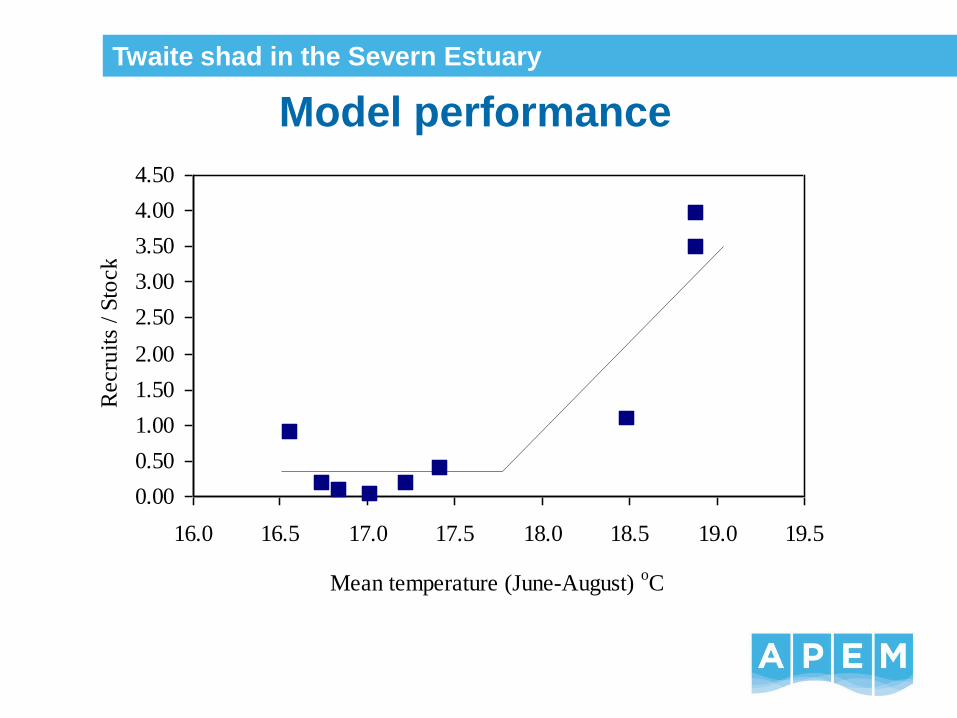
Model performance
0.00
0.50
1.00
1.50
2.00
2.50
3.00
3.50
4.00
4.50
16.0 16.5 17.0 17.5 18.0 18.5 19.0 19.5
Mean temperature (June-August) oC
Recru
its
/ S
tock
Twaite shad in the Severn Estuary
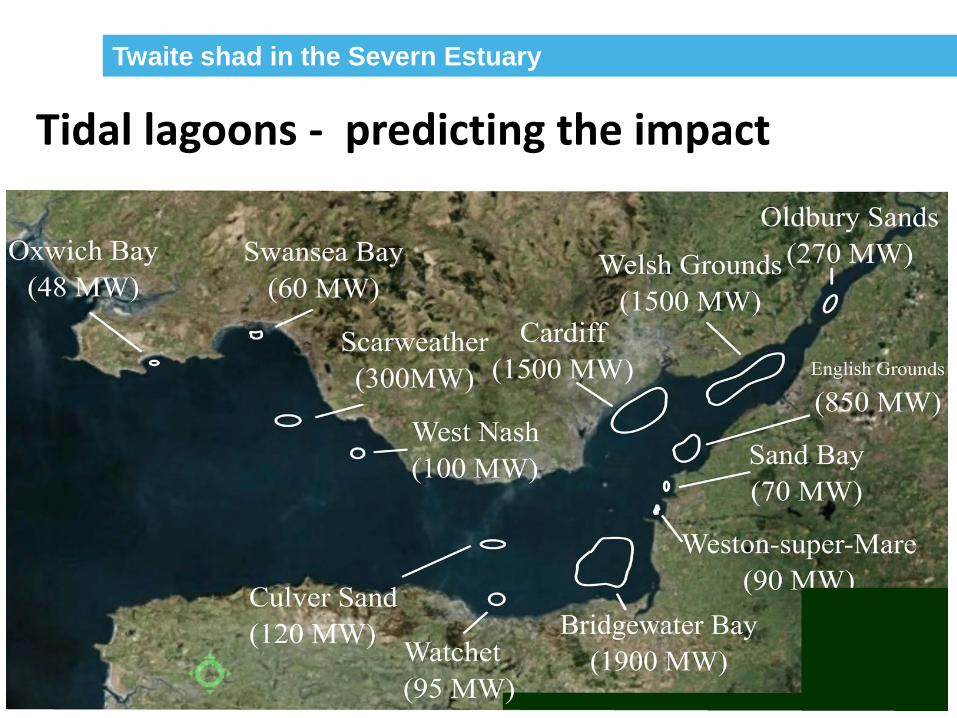
Tidal lagoons - predicting the impact
Twaite shad in the Severn Estuary
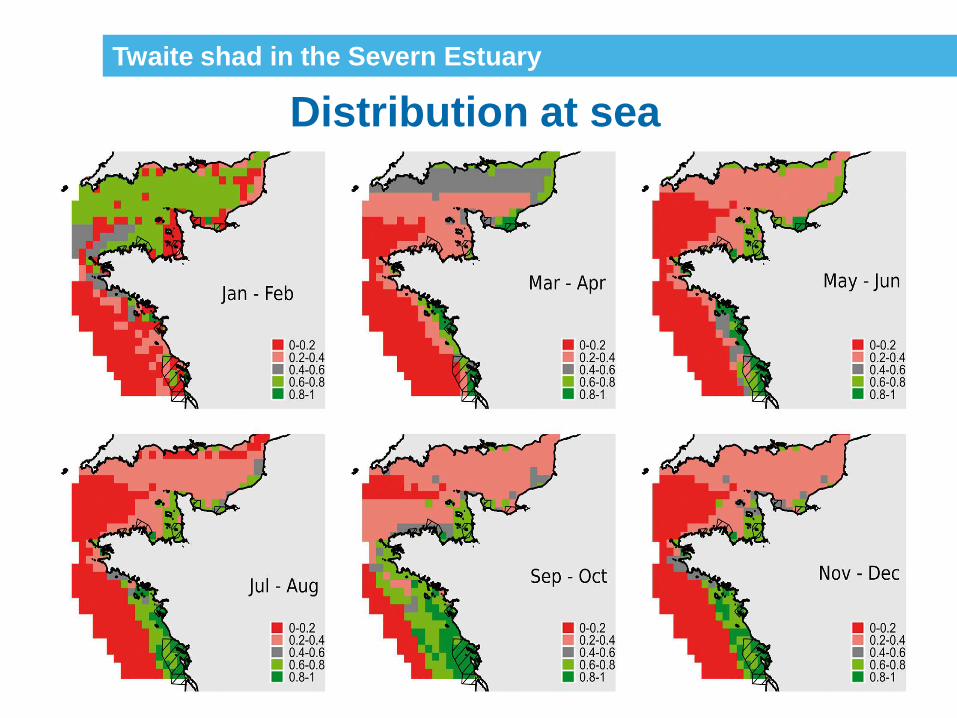
Distribution at sea
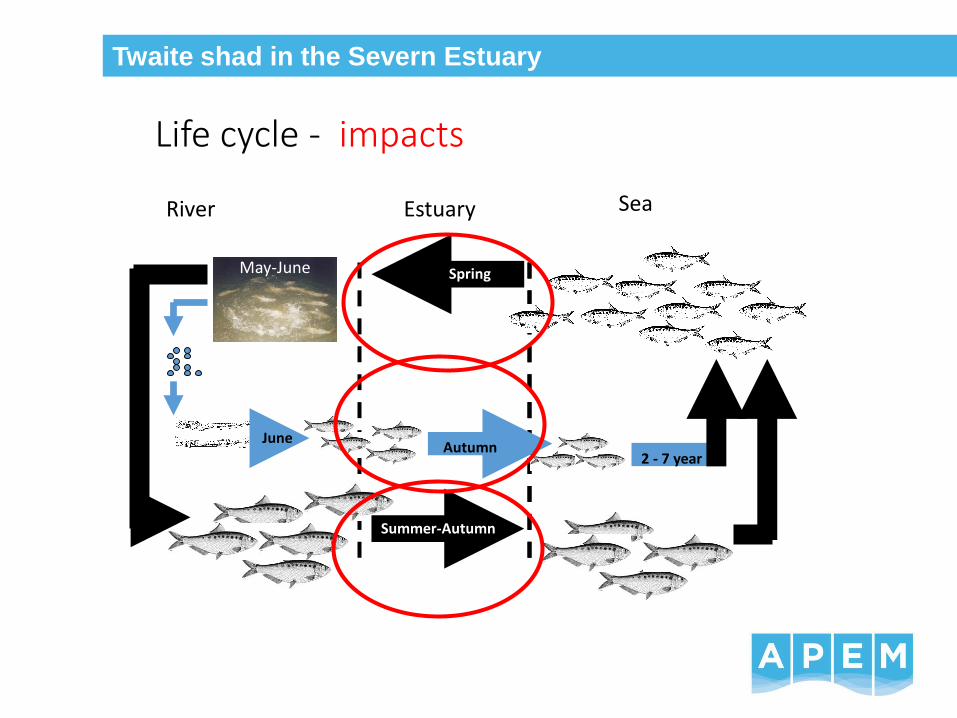
Life cycle - impacts
SeaEstuaryRiver
Autumn
May-June Spring
Summer-Autumn
2 - 7 year
June
Twaite shad in the Severn Estuary

Model predicting impact
Eggs
5 yr 10 yr9 yr 8yr7 yr6 yr
Eggs
3 yr 4 yrs
Ricker
Model
Egg survival, juvenile & adult mortality
+ temperature component
Hindcast – mortality & maturation schedule
Forecast - mortality
Additional mortalityAdditional mortality
https://www.google.co.uk/search?q=Tidal+turbine&espv=2&source=lnms&tbm=isch&sa=X&ved=0ahUKEwjr79muy7rTAhWSYVAKHewSA0kQ_AUIBigB&biw=1920&bih=974#imgrc=PC9BY9ADh-srpM:

Twaite shad in the Severn Estuary
Turbine mortality rates – Shad (juvenile)
Mechanism Percent mortality
Pressure 0%
Sheer 48%
Strike 5%
Total 53%
Twaite shad in the Severn Estuary
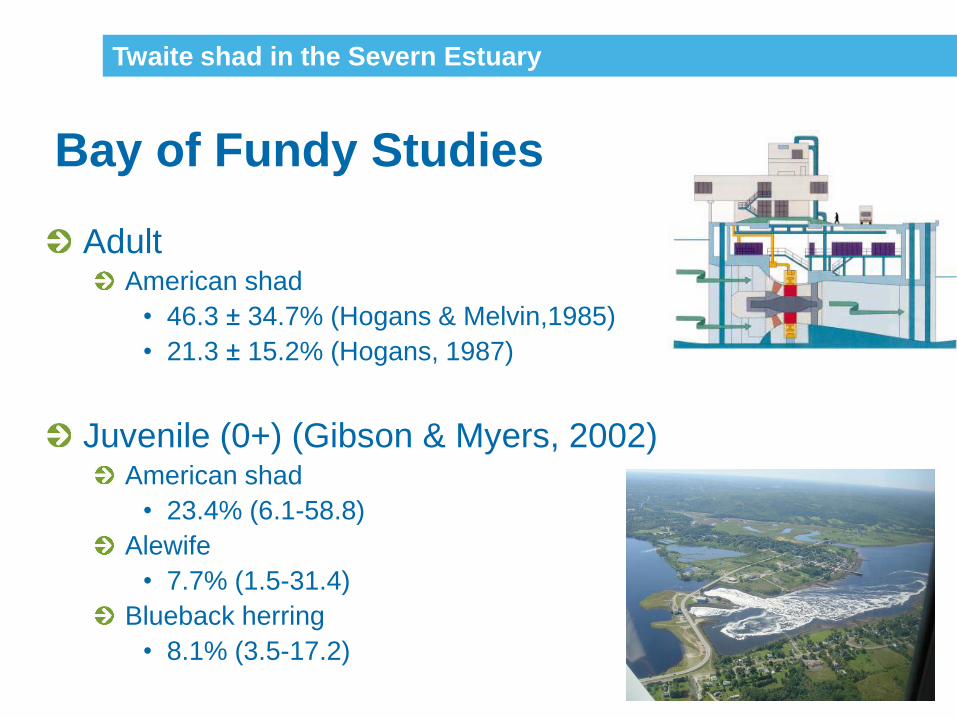
Bay of Fundy Studies
AdultAmerican shad
• 46.3 ± 34.7% (Hogans & Melvin,1985)
• 21.3 ± 15.2% (Hogans, 1987)
Juvenile (0+) (Gibson & Myers, 2002) American shad
• 23.4% (6.1-58.8)
Alewife
• 7.7% (1.5-31.4)
Blueback herring
• 8.1% (3.5-17.2)
Twaite shad in the Severn Estuary
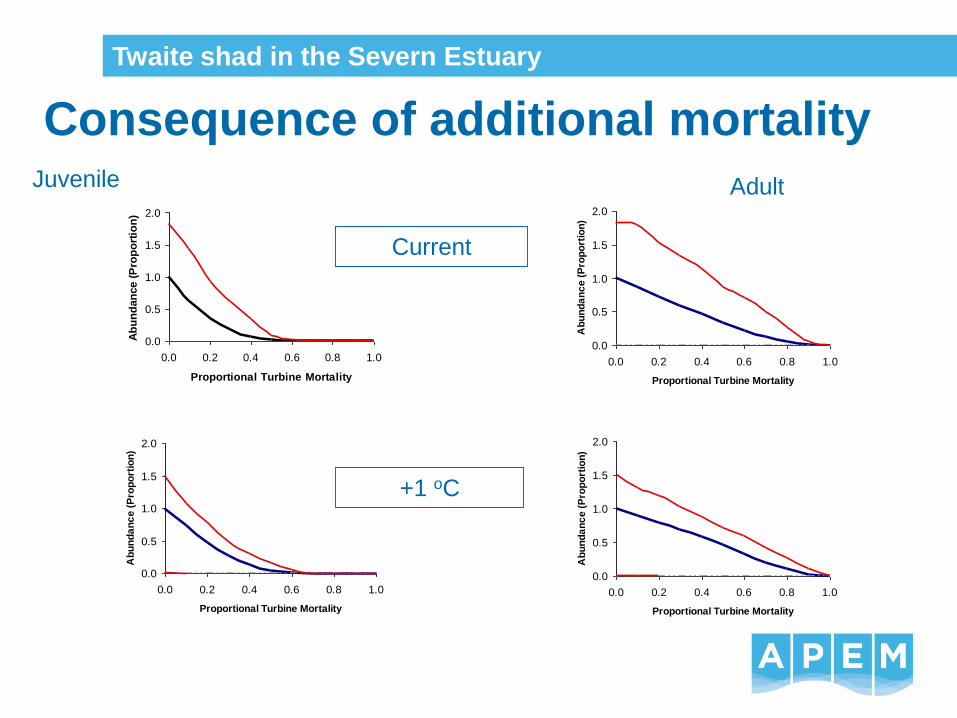
Consequence of additional mortality
0.0
0.5
1.0
1.5
2.0
0.0 0.2 0.4 0.6 0.8 1.0
Proportional Turbine Mortality
Ab
un
dan
ce (
Pro
po
rtio
n)
0.0
0.5
1.0
1.5
2.0
0.0 0.2 0.4 0.6 0.8 1.0
Proportional Turbine Mortality
Ab
un
da
nc
e (
Pro
po
rtio
n)
0.0
0.5
1.0
1.5
2.0
0.0 0.2 0.4 0.6 0.8 1.0
Proportional Turbine Mortality
Ab
un
da
nc
e (
Pro
po
rtio
n)
0.0
0.5
1.0
1.5
2.0
0.0 0.2 0.4 0.6 0.8 1.0
Proportional Turbine Mortality
Ab
un
da
nc
e (
Pro
po
rtio
n)
Juvenile Adult
Current
+1 oC

Information Needs
Twaite shad in the Severn Estuary
• 1) how often and what proportion of the
adult pre-and post spawned
population/s might pass through the
turbines,
• 2) how often and what proportion of the
juvenile population/s might pass through
the turbines and
• 3) the level of adult and juvenile turbine mortality.

Twaite shad in the Severn Estuary - thank you for listening
Environmental concerns are so serious that, if
not faced head on from the start, a great deal of
engineering time and effort will be wasted’
‘traditional engineering feasibility studies which
concentrate on finding the most economically
attractive scheme followed by environmental
scrutiny are no longer acceptable.
‘ENVIRONMENTAL ISSUES NEED TO BE PART
OF THE DESIGN.’ Eric Van Walsum
SEVERN BARRAGE
as first proposed by Thomas Fulljames in 1849
Twaite shad in the Severn Estuary
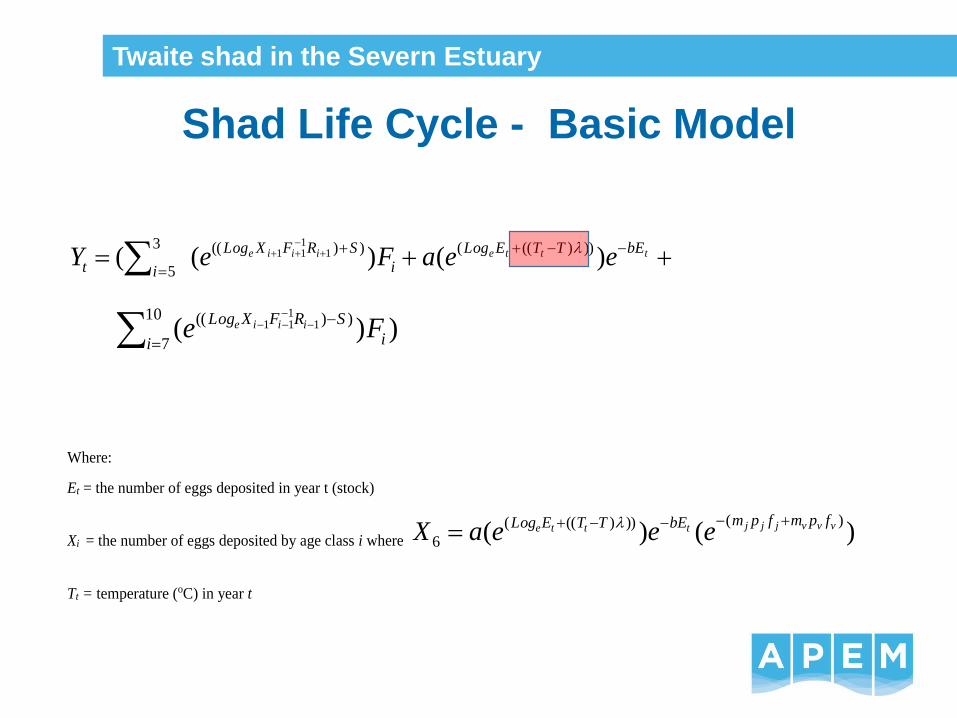
Shad Life Cycle - Basic Model
Twaite shad in the Severn Estuary
ttteiiie bETTELog
i
SRFXLog
it eeaFeY )()(()))((())((3
5
1111
))(
10
7
))(( 1111
i i
SRFXLogFe iiie
Where:
Et = the number of eggs deposited in year t (stock)
Xi = the number of eggs deposited by age class i where )()()()))(((
6vvvjjjttte
fpmfpmbETTELogeeeaX
Tt = temperature (oC) in year t
)()()((
)()))((())((3
5
1111 vvvjjjttteiiie
fpmfpmbETTELog
i
SRFXLog
it eeeaFeY
))(
10
7
))(( 1111
i i
SRFXLogFe iiie
))1()()((((
)())((3
5
1111 aaavvvjjjiiie fpm
i
fpmfpm
i
SRFXLog
ieReFe
))1()()(()()))((( aaavvvjjjttte fpm
i
fpmfpmbETTELogeReeea
)))1()()(()())((10
7
1111 aaavvvjjjiiie fpm
i
fpmfpm
i
SRFXLog
ieReFe
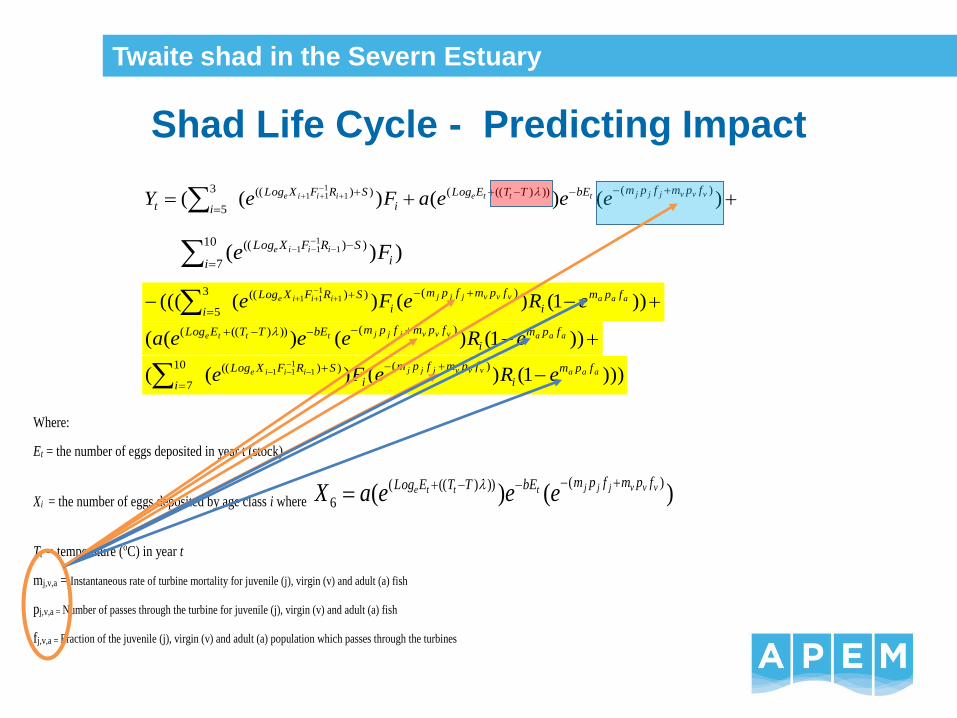
Shad Life Cycle - Predicting Impact
Where:
Et = the number of eggs deposited in year t (stock)
Xi = the number of eggs deposited by age class i where )()()()))(((
6vvvjjjttte
fpmfpmbETTELogeeeaX
Tt = temperature (oC) in year t
mj,v,a = Instantaneous rate of turbine mortality for juvenile (j), virgin (v) and adult (a) fish
pj,v,a = Number of passes through the turbine for juvenile (j), virgin (v) and adult (a) fish
fj,v,a = Fraction of the juvenile (j), virgin (v) and adult (a) population which passes through the turbines
Twaite shad in the Severn Estuary


