21
How do the markets actually work? What you and your employees need to know. Sean O’Brien and James Humza Merrill Lynch Global Wealth & Investment Management ARYM9SSQ
| Date post: | 06-May-2018 |
| Category: |
Documents |
| Upload: | nguyenkiet |
| View: | 214 times |
| Download: | 1 times |
How do the markets actually work?
What you and your employees need to
know.
Sean O’Brien and James Humza
Merrill Lynch Global Wealth & Investment Management
ARYM9SSQ

-2-
DISCLAIMER This presentation is not an offer to enter into a transaction on specific terms and does not disclose all of the risks and other significant aspects of entering into a transaction. Before entering into any transaction, you should carefully review and understand its specific terms and conditions, including the risks related to the specific transaction or strategy being implemented. The information in this document should not be construed as business, financial, investment, hedging, trading, legal, regulatory, tax or accounting advice. Merrill Lynch makes no representation and has not provided, nor undertaken to provide, any advice to you concerning the appropriate accounting treatment or possible tax consequences related to any transaction. You should consult your own investment, legal, tax, accounting and other advisors before transacting. This material does not take into account your particular investment objectives, financial situations or needs and is not intended as a recommendation, offer or solicitation for the purchase or sale of any security, financial instrument, or strategy. Before acting on any information in this material, you should consider whether it is suitable for your particular circumstances and, if necessary, seek professional advice. Merrill Lynch makes available products and services offered by Merrill Lynch, Pierce, Fenner & Smith Incorporated (“MLPF&S”) and other subsidiaries of Bank of America Corporation (“BofA Corp.”). Investment products: MLPF&S is a registered broker-dealer, registered investment adviser, member SIPC and a wholly owned subsidiary of BofA Corp. ARYM9SSQ
Are Not FDIC Insured Are Not Bank Guaranteed May Lose Value

-3-
How the market works: why should you care
How the market is changing: things to look for
Impacts of the changing landscape: will it affect your future?
How you are affected: weaknesses/exposure
Take-away
Today’s session:

-4-
History of (Active) Domestic Exchanges:
ISE: 2013 – NYC
MIAX: 2012 - NYC
IEX: 2012 - NYC
C2: 2010 - Chicago
NYSE Arca: 2006 – NYC (public NYSE)
BYX: 2005 - Lenexa, Kansas
BZX: 2005 - Lenexa, Kansas
BOX: 2002 - Boston
EDGA/X: 1998 - Jersey City
CBOE: 1973 - Chicago
NASDAQ: 1971 - Boston
NYSE Market: 1908
CHX: 1882 - Chicago
BX: 1834 – Philadelphia
NYSE: 1817 - NYC
PHLX: 1790 - Jersey City

-5-
The NYSE of Yore

-6-
Historical benchmarks: NYSE
10M 1BN 100M
Highlighted date
represents the
first day that the
NYSE traded
over 10 million
shares in a day
Highlighted date
represents the first day
that the NSE traded
over 100 million shares
in a day
Highlighted date
represents the
first day that the
NYSE traded
over 1 billion
shares in a day

-7-
The changing landscape
For the past two decades, the securities markets have experienced sweeping changes.
• A few national exchanges have evolved into a range of trading centers.
• Trading has become almost completely automated.
• Orders are executed across multiple for-profit liquidity venues, including exchanges and dark pools.
• Exchanges are competing for order flow and are willing to pay wholesalers to provide liquidity.
2 to16 0 to 36
Public securities exchanges
competing for order flow Off-exchange
dark pools
Average shares per
trade order
SOURCES:
ATS Venues https://ats.finra.org/TradingParticipants
Average Trade Size http://www.batstrading.com/market_summary
FINRA ATS data…. https://ats.finra.org/TradingParticipants
-8-
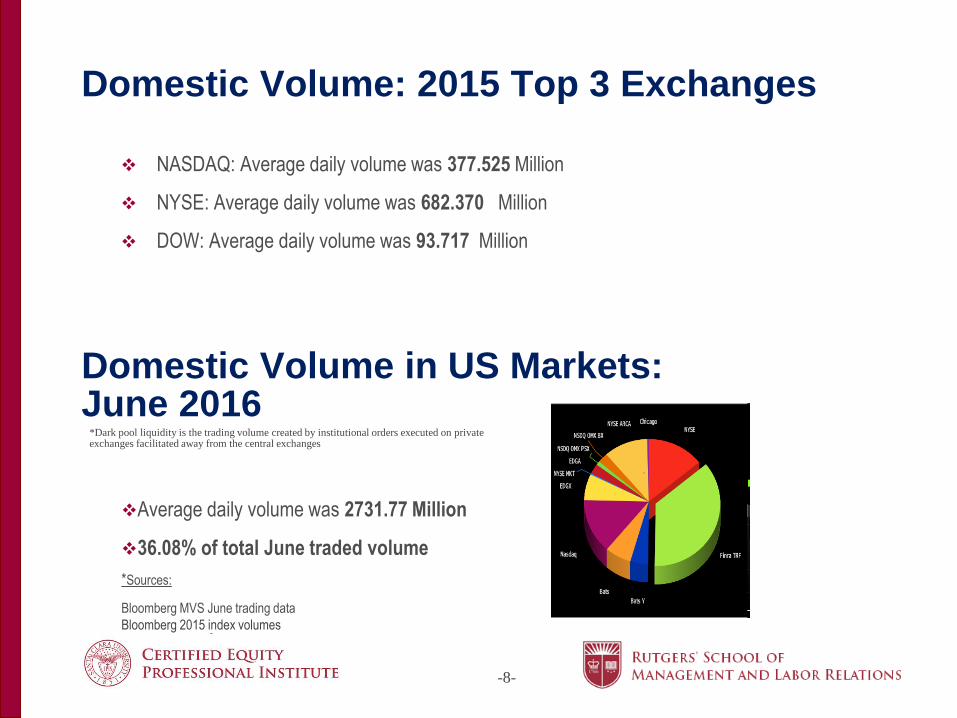
Domestic Volume: 2015 Top 3 Exchanges
NASDAQ: Average daily volume was 377.525 Million
NYSE: Average daily volume was 682.370 Million
DOW: Average daily volume was 93.717 Million
Domestic Volume in US Markets: June 2016
Average daily volume was 2731.77 Million
36.08% of total June traded volume
*Sources:
Bloomberg MVS June trading data
Bloomberg 2015 index volumes
*Dark pool liquidity is the trading volume created by institutional orders executed on private exchanges facilitated away from the central exchanges

-9-
Today’s Exchanges
-10-
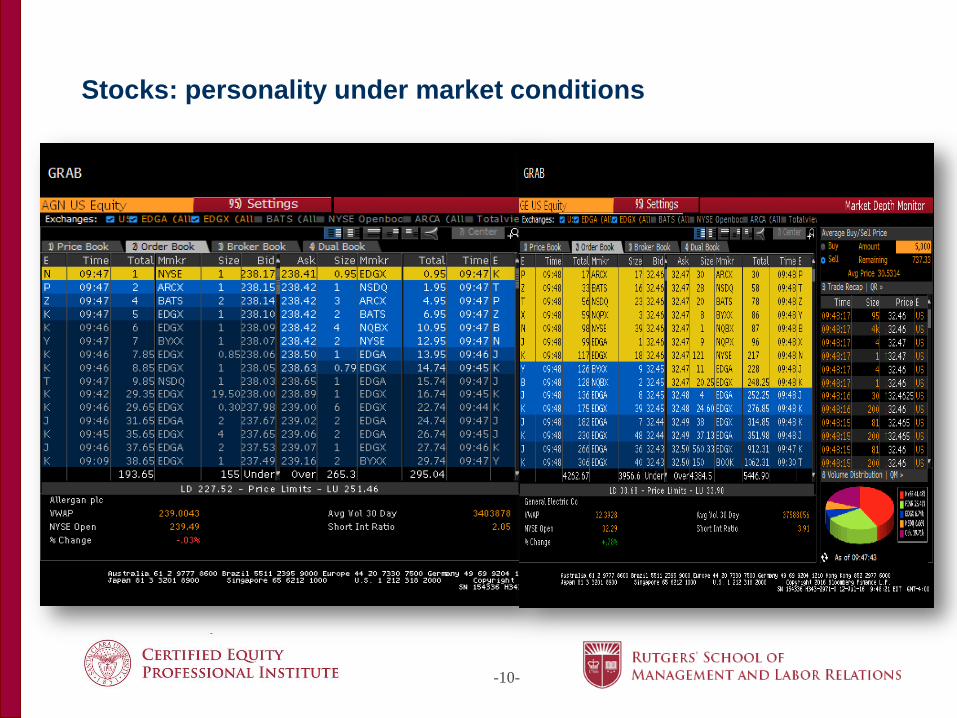
Stocks: personality under market conditions

-11-
Bids and Asks: Slippage rates - why they matter
Cost to trade 10K shares at BID:
KORS: $101.50
HON: $134.50
IART: $552.50
NOC: $504.00
VSI: $155.50
KO: $49.00
GE: $49.50
AGN: $1,150.00 $1,150.0
$287.5
$862.5
$0.0
$200.0
$400.0
$600.0
$800.0
$1,000.0
$1,200.0
$1,400.0
BID Slippage Rate 1 Slippage Rate 2
Comparison Based on Data from SEC 605 Reports Average Cost Benefit of Trading a Block of 10,000 Listed Shares of the Company
For illustrative purposes only
As of July 15, 2016
Sources: RegOne 605 Analysis Tool
https://cdr.regonesolutions.com/Query605/Query/Index?PageN
ame=Create
100% 25%
75%
0%
0% 10% 20% 30% 40% 50% 60% 70% 80% 90% 100%
BID
Slippage Rate 1
Slippage Rate 2
Midpoint
Comparison Based on Data from SEC Rule 605 Reports Effective / Quoted Spread Ratio (%) - Lower Is Better (Slippage Rate)
For All Orders of NOC 100—9,999 Shares

-12-
605 calculations:
Effective/Quoted Spread Ratio (%) (or the Slippage Rate) is a ratio that is commonly used in the securities industry for comparing the “average effective spread” of orders executed with the national best bid and offer spread or “quoted spread” at the time of order rece ipt. The average effective spread is based on the difference between the execution price and the midpoint of the quoted spread. The ratio focuses primarily on price improvement. Price improvement is the execution of an order at a price better than the public quote at the time the market center receives an order. In the chart, 0% represents order execution at the midpoint between the national best bid and offer, while 100% represents order execution at the national best bid or offer. For purposes of this ratio, a lower ratio number is better and represents price improvement and cost savings to a client. The above comparison relates only to the period presented. There is no guarantee that cost savings will be achieved on any particular order or during any specific period or over any particular firm. Past performance is no guarantee of future performance.
The above cost savings reflect the average dollar amount by which Merrill Lynch’s execution cost for a 10,000-share block is less than the firms listed calculated as described below. The above cost savings is calculated as follows: (i) the difference between Merrill Lynch’s Effective/Quoted Spread Ratio (%) and the Effective/Quoted Spread Ratio (%) of the firm being compared x (ii) ½ the weighted average bid/offer spread per share (in USD) for all trades between 100–9,999 shares traded during the above period x (iii) 10,000 shares. The above comparison does not take into account commissions and fees charged, which can vary among broker-dealers. The above comparison is an illustration of average cost savings based on the above calculations only and during the above-referenced period only–there is no guarantee that cost savings will be achieved on any particular order or during any specific period or over any particular firm. Past performance is no guarantee of future performance

-13-
Market- an order instructing a broker to buy or sell an asset immediately at the best prevailing price
Limit- a direction given to a broker to buy or sell a security or commodity at a specified price or better
Stop Loss- denoting an order to sell a security or commodity at a specified price in order to limit a loss
Spread - the difference between the bid and the ask price of a security or asset; point being that the bid and ask prices dictate what level you buy and sell at
Market Not Held - market or limit order that gives the broker or floor trader both time and price discretion to attempt to get the best possible price
Block Orders - significant order placed for sale or purchase of a large number of securities. Block orders are often used by institutional investors
Types of Orders:

-14-
How do the markets work: a focus on execution
A core focus of Merrill Lynch is pursuing the best execution price for Firm clients, regardless of order size.
For individual investors, we believe the question of “Am I getting the best execution?” is at the forefront of their concerns. Individual investors are bombarded by discount broker-dealers advertising low-cost or free trades with the promise of fast execution. In many cases, these discount broker-dealers are selling customer order flow to specific market makers to increase their revenue rather than going to the market maker with the best price. Merrill Lynch attempts to match client’s order with those of other clients within the Merrill Lynch Crossing Network (MLXN), which would provide pricing at the midpoint between bid and offer.
Unlike some other firms, Merrill Lynch does not sell or receive payment for the order flow from any third-party wholesalers to whom orders may be directed.
“Held” Orders:
A “held” order is a market or limit order that must be promptly executed by the broker-dealer without discretion.
“Not Held” Orders:
A “not held” order is an order that provides a broker dealer with flexibility through a grant of price and time discretion to exercise its professional judgment in handling the order. Merrill Lynch’s GWIM Equity Execution Desk provides special handling for “not held” block orders to help maximize execution quality by minimizing market impact. cone

-15-
Vestings
Award Expirations:
Blackouts / Open Windows
Sell to Cover transactions
IPO - Lock up expirations
Impact of stock plan events on trading:

-16-
Accessing Greater Liquidity Below is a snapshot comparing the trading volumes of various firms for the security listed over the time period
specified below. The snapshot below is simply an illustration of potential sources of liquidity for the given security as measured by the trading volume of the firms listed below. It is not intended to depict or compare execution prices, commissions, fees, or return to investors. Source: Bloomberg.

-17-
The impact on trading:
NOTE: The execution of the orders and the prices on this page is illustrative of a “not held” trade execution based only on a single case study. It is not
representative of all orders executed. Market conditions and other factors will impact prices and ability to execute.

-18-
The impact on trading:
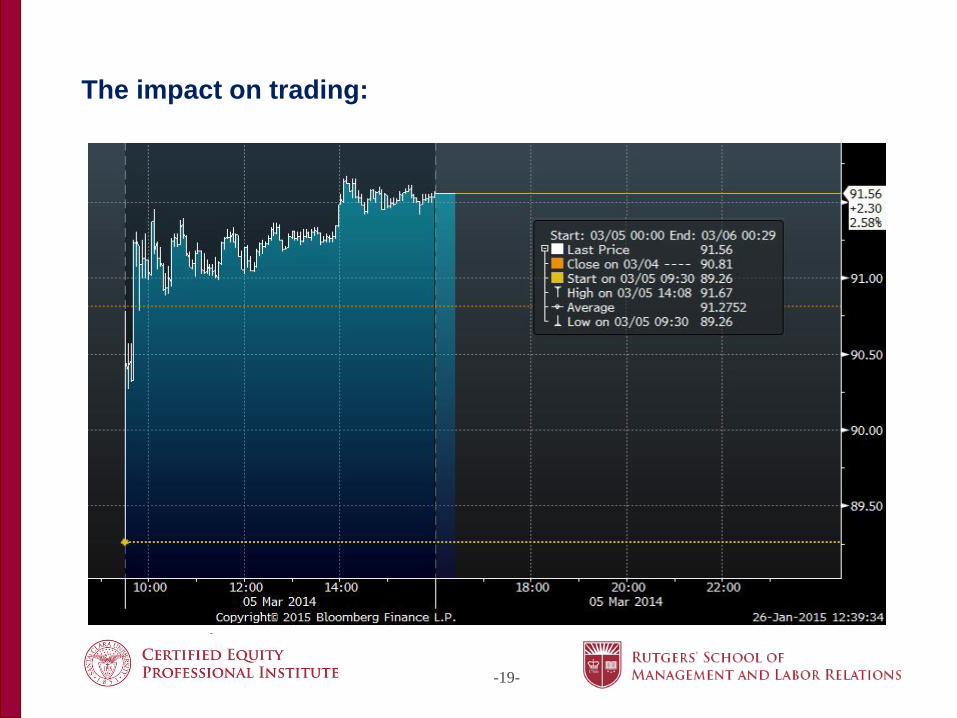
-19-
The impact on trading:

-20-
Electronic and high frequency trading
– Low-touch algotrading happening in nanoseconds
– Trading centers dependent upon sophisticated technology and extremely fast and interconnected systems
Flash Crash of August 24, 2015
– S&P 500 opened at 1965.15
– Within minutes fell 5% to a low of 1867.01
– Trading halted 1,200 times in one day
– Driven by lack of liquidity in the marketplace and a massive sell-off due to uncertainty around China
Additional impacts on trading:
SOURCES:
http://www.cnbc.com/2015/09/25/
http://www.investopedia.com/articles/investing/011116/two-biggest-flash-crashes-2015.asp

-21-
Key Takeaways:
Selling shares is more complex than it appears on the surface.
“Point and click” is not always the most efficient execution method.
To navigate the changing marketplace, high-touch service and expertise is needed.
Knowing the security of how and where your order flow is handled can provide peace of mind.
By ensuring your equity trading is handled effectively and efficiently, you are doing the right thing for employees and equity award holders.


