30
What’s Different Today Versus The Mid 1990’s? Morgan Stanley Basic Materials Conference February 25, 2004 Dan F. Smith President and CEO
| Date post: | 27-Dec-2015 |
| Category: |
Documents |
| Upload: | sandra-lyons |
| View: | 213 times |
| Download: | 0 times |

What’s Different Today Versus The Mid 1990’s?
Morgan Stanley Basic Materials Conference February 25, 2004
Dan F. SmithPresident and CEO

2
Safe Harbor LanguageStatements in this presentation relating to matters that are not historical facts are forward-looking statements. These forward-looking statements are just predictions or expectations and are subject to risks and uncertainties. Actual results could differ materially, based on factors including but not limited to the cyclical nature of the chemical and refining industries; availability, cost and volatility of raw materials and utilities; governmental regulatory actions and political unrest; global economic conditions; industry production capacity and operating rates; the supply/demand balance for Lyondell's and its joint ventures' products; competitive products and pricing pressures; access to capital markets; and technological developments and other risk factors. For more detailed information about the factors that could cause our actual results to differ materially, please refer to Lyondell Chemical Company’s Annual Report on Form 10-K for the year ended December 31, 2002, filed in March 2003, Lyondell’s Quarterly Report on Form 10-Q, filed in November, 2003, and Lyondell’s Annual Report on Form 10-K for the year ended December 31, 2003, which will be filed in March 2004. Reconciliations of GAAP financial measures to non-GAAP financial measures are provided at the end of this presentation.
3
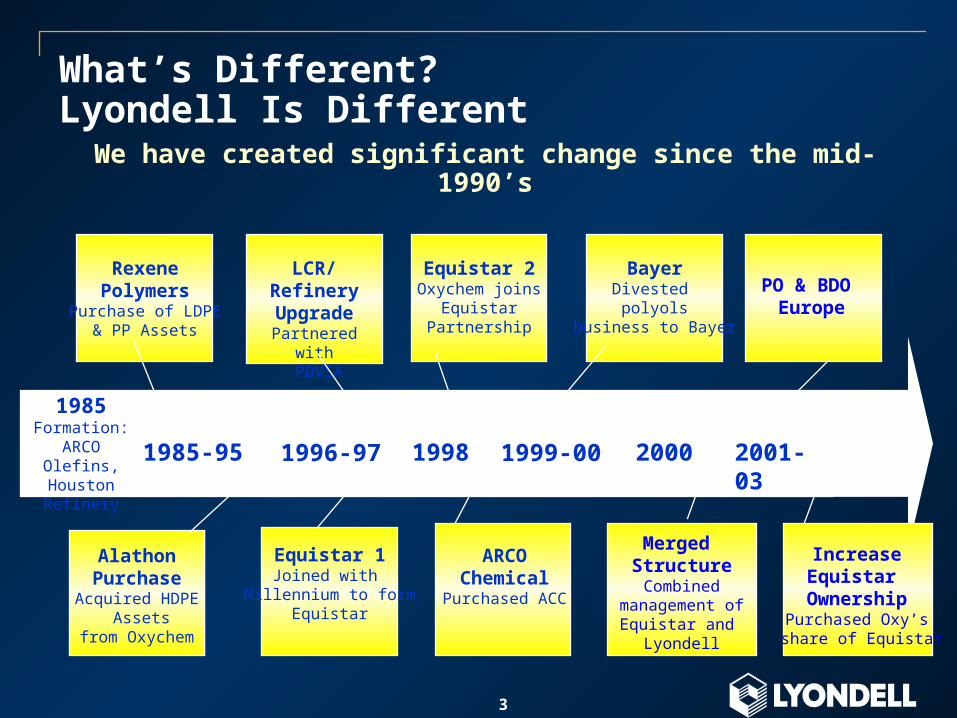
RexenePolymers
Purchase of LDPE& PP Assets
AlathonPurchase
Acquired HDPE Assets
from Oxychem
LCR/RefineryUpgrade
Partnered with PDVSA
Equistar 1Joined with
Millennium to formEquistar
Equistar 2Oxychem joins
EquistarPartnership
ARCOChemical
Purchased ACC
BayerDivested polyols
business to Bayer
Merged StructureCombined
management ofEquistar and
Lyondell
PO & BDO Europe
What’s Different?Lyondell Is Different
1985Formation:
ARCO Olefins, Houston Refinery
1998 1999-00 2000 2001-031996-971985-95
IncreaseEquistar
OwnershipPurchased Oxy’s share of Equistar
We have created significant change since the mid-1990’s

4
We’ve Developed A Balanced Portfolio
Lyondell
IC&D
LCR
Equistar
Commodity Leverage-- A leading North American producer of ethylene, propylene
and polyethylene-- Low cost position based on feedstock flexibility and scale
Growth & International Presence-- A leading global producer of PO and derivatives-- Process technology strength
Cash Generation-- Unique capability to refine heavy crude oils-- Contractually stable business; strong cash flow generator
($ MM)
Revenues EBITDALyondell
OwnershipIC&D $3,801 $245 100.0%Equistar 6,545 175 70.5LCR 4,162 377 58.75
2003

5
Leading Product Positions Create Significant Earnings Leverage
1 Source: LYO capacities as of January 2004, CMAI2 Includes 100% of joint venture volumes3 Does not include refinery-grade material or production from the product flexibility unit at Equistar’s Channelview
facility.4 Based on 1¢/gal change
Inte
rmed
iate
C
hem
ica
ls a
nd
D
eriv
ati
ves
Eq
uis
tar
Product Annual Capacity(1)
Capacity Position
Propylene Oxide(2)
( lbs) 4.5 billion 1st in North America1 st in the world
Styrene Monomer (lbs) 5.0 billion 1st in North America4th in the world
MTBE (bbl/day) 58,500 1st in North America1st in the world
Ethylene (lbs) 11.6 billion 2nd in North America5th in the world
Propylene (lbs) 5.0 billion 2nd in North America7 th in the world
Polyethylene (lbs) 5.7 billion 3 rd in North America4 th in the world
(1)
(3)
$23MM
$21MM
$ 9MM
$116MM
$50MM
$57MM
Pre-TaxLeverage(∆1¢/unit)
(4)

6
We’ve Significantly Strengthened Our Operations
0
30
60
90
120
150
180
Lyondell Equistar PO11 Spending Regulatory
4.2%
9.0%
0.0%
2.0%
4.0%
6.0%
8.0%
10.0%
12.0%
14.0%
LYO+EQU Peers
SG
&A
+ R
&D
, %S
ale
s
0102030405060708090
1998 2003
Lyondell Equistar
Safety PerformanceEnterprise Incident Rate
Days of Working Capital *Capital Spending
Average SG&A and R&D, % Sales 2000 - 2002
1999 2004 Budget
$MM
Re
co
rda
ble
In
jury
Ra
te
1st Quartile ’02 1.001.180.99
0.8
0.52 0.52
0
0.5
1
1.5
2
1999 2000 2001 2002 2003
Days
* Based on accounts receivable (including those sold), inventories & accounts payable as of 12/03, and fourth-quarter days of sales.
Peers include:
Dow, Nova,
Eastman, Celanese,
Solutia, Westlake,
Millennium, Georgia Gulf

7
Lyondell’s Portfolio Is Significantly Larger Than In The Early 1990’s
Early 1990’s Today
Petrochemicals - 100% Owned - 70.5% Owned
& Polymers - 2 Ethylene Plants - 8 Ethylene Plants
- 1 Polymer Plant - 7 Polymer Plants
- 2 MEG Plants
Refining - 100% Owned - 58.75% Owned
- Sour Crude Refinery - Heavy Crude Refinery
- PDVSA Contract
IC&D - 100% Owned
- 3 POSM Plants
- 5 PO/MTBE Plants
- Nihon Oxirane JV POSM
Plant

8
We’ve Increased Market Cap and Liquidity
Late 1993 Jan-Feb 2004
Shares Outstanding 80 MM 176 MM
Share Price $20 – 23 $17 – 19
Trading Liquidity ~100 M Shares/Day ~1 MM Shares/Day
9
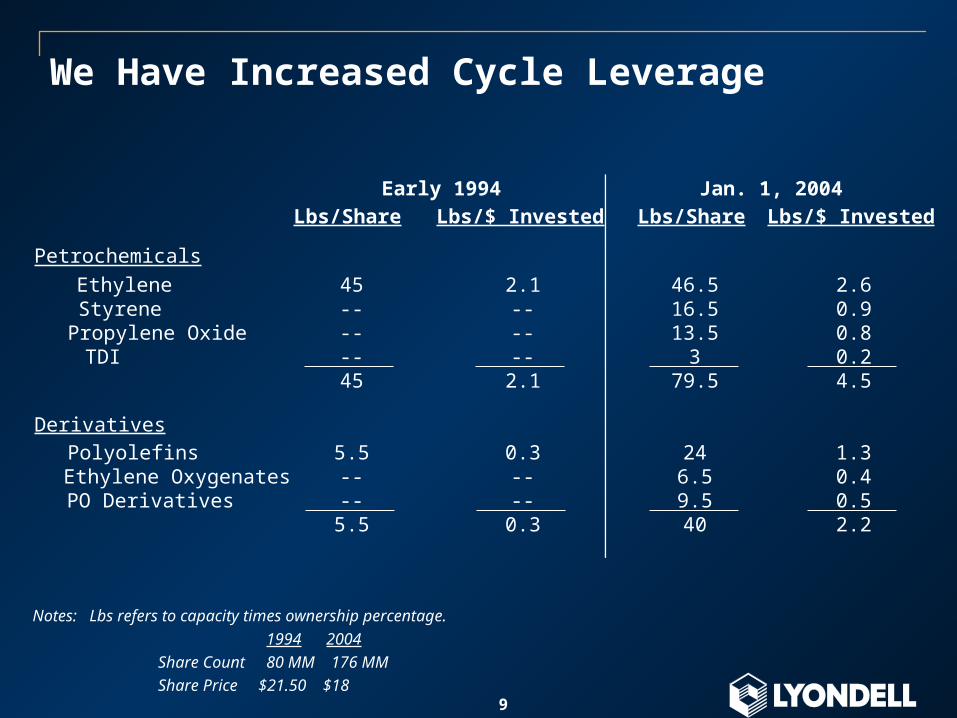
We Have Increased Cycle Leverage
Lbs/Share Lbs/$ Invested Lbs/Share Lbs/$ Invested
Petrochemicals
Ethylene 45 2.1 46.5 2.6 Styrene -- -- 16.5 0.9 Propylene Oxide -- -- 13.5 0.8 TDI -- -- 3 0.2
45 2.1 79.5 4.5
Derivatives
Polyolefins 5.5 0.3 24 1.3 Ethylene Oxygenates -- -- 6.5 0.4 PO Derivatives -- -- 9.5 0.5
5.5 0.3 40 2.2
Early 1994 Jan. 1, 2004
Notes: Lbs refers to capacity times ownership percentage.
1994 2004
Share Count 80 MM 176 MM
Share Price $21.50 $18

10
Lyondell Stock Has Performed Well In Recessions and Recoveries
-15-10
-505
101520253035
Q4 '90 - Q4 '93Downturn
Q4 '93 - July '95Recovery
Q4 '00 - Q4 '03Downturn
Q4 '03 - ?Recovery
Lyondell S&P 500
1990 – 1995 Cycle 2000 – 200? Cycle
Sh
areh
old
er R
etu
rn %
/ Y
r
Source: Bloomberg

11
Most But Not All Industry Fundamentals Are Unchanged
Energy prices have changed
Economy emerging from a downturn
Cyclicality has not been repealed
Product growth driven by improved quality of life
Sustained advantage requires differential cost, scale and/or technology

12
The Energy World Was Very Different
Source: Platt’s
Early Jan / Feb1990's 1994 / 95 2004
Crude ($/Bbl) $18 - 24 $17 - 18 $32 - 35
Natural Gas ($/MMBtu) $1.50 - 2.00 $1.50 - 1.85 $5.25 - 5.50
Crude / Gas 9 - 14 9 - 11 6
13
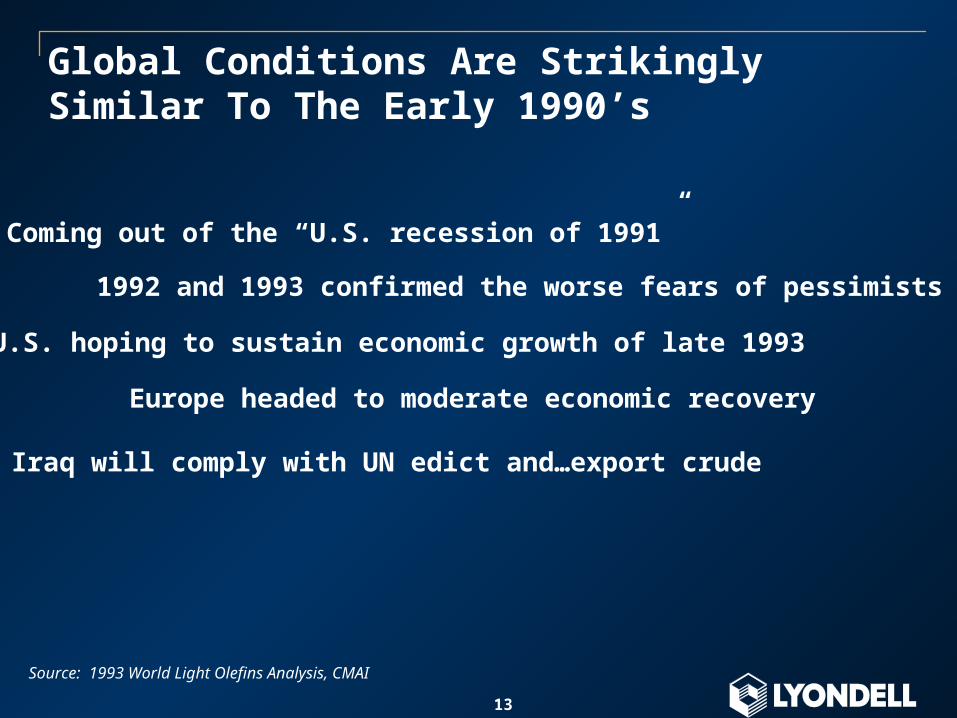
Global Conditions Are Strikingly Similar To The Early 1990’s
Coming out of the “U.S. recession of 1991”
1992 and 1993 confirmed the worse fears of pessimists
U.S. hoping to sustain economic growth of late 1993
Europe headed to moderate economic recovery
Iraq will comply with UN edict and…export crude
Source: 1993 World Light Olefins Analysis, CMAI

14
0
1
2
3
4
5
1986 1989 1992 1995 1998 2001 2004 2007
The Global Economy is Emerging from a Difficult Period
(Percent change in real GDP)Global GDP
Source: Global Insights

15
Within The Ethylene Industry, There Are Striking Similarities Between 1993 And 2003
Demand forecasts
• Annual rate of 4.9% per year 1992-1998 period
• Worldwide growth…during 1993 . . . 2%
• New light olefins in Asia/Pacific and Africa/Middle East will severely impact exports
Source: 1993 World Light Olefins Analysis, CMAI
Operating rate forecasts
• Slowly improve from 85% in 1993
• Between 1993 and 1997…17.9 MM tons capacity will be added
• In the U.S. between 1990 and 1992 three new world scale plants
16
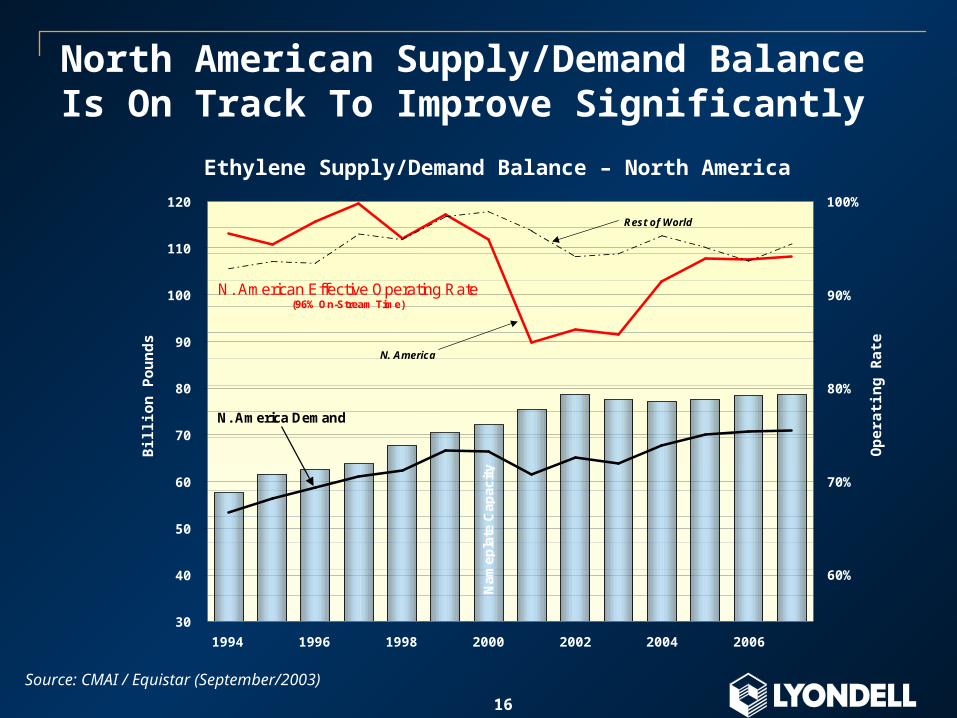
North American Supply/Demand Balance Is On Track To Improve Significantly
30
40
50
60
70
80
90
100
110
120
1994 1996 1998 2000 2002 2004 2006
Bil
lio
n P
ou
nd
s
60%
70%
80%
90%
100%
Op
erat
ing
Rat
e
Ethylene Supply/Demand Balance – North America
Source: CMAI / Equistar (September/2003)
Nam
epla
te C
apac
ity
N. American Effective Operating Rate(96% On-Stream Time)
N. America Demand
Rest of World
N. America

17
We Believe that Global Ethylene Supply/Demand is on a Path to a Tight Balance
175
200
225
250
275
300
2003 2007 '07 + 2% Growth '07 - 18 Mo Delay
Wo
rld
Eth
yle
ne
Su
pp
ly -
De
ma
nd
(billio
n p
ou
nd
s/y
ear)
Effective Capacity Demand
Source: CMAI
SensitivityCMAI base case
96%104%
99%

18
0
20
40
60
80
100
120
0 5, 000 10, 000 15, 000 20, 000 25, 000 30, 000 35, 000 40, 000
US
Korea
Taiwan
WE
Singapore
Japan
Thailand
Malaysia
ChinaIndiaIndonesia
The Emergence of a Middle Class Increases Local Demand for Plastics
Sources: CMAI 2001; Nexant Chemsystems
0
2
4
6
8
10
12
Domestic Exports
1995 2001
China PE Demand
Domestic vs. Export
PE Consumption/capita, lbs
2000 GDP/Capita

19
Historically Ethylene And Styrene Have Had The Most Leverage To A Cyclical Upturn
0
5
10
15
20
25
30
Naphtha -HDPE
Styrene
Contract Pricing Margin Change: Trough To Peak
1992/93 vs. 1995Δ Margin
¢ / lb
Source: CMAI; Lyondell Databook

20
Enterprise Earnings Capability Far Exceeds Recent Trough Results
0
500
1000
1500
2000
2500
3000
2003 1999/2000Margins
1995 Margins 1988 Margins
$MM
LCR IC&D Equistar
1 Chem Data/CMAI industry margins conditions for IC&D and Equistar products (ex. MTBE) applied to current capacities and ownership, LCR 2003 EBITDA. Note: Assumes current capital structure; 175 MM shares.
1
1 1
Recession/ Trough
Pre-Recession
PeakCycle EBITDA Potential
$6.90 / share
$1.40 / share
2003Proportional
Interest,Dividends &
Capital

21
Investing Based on Differential Technology – PO & Derivatives
• Growth rate: 4-5%/yr
• End Use:
• Polyols: seating, mattresses, insulation,
coatings
• PG: deicers, boat hulls, coatings,
countertops/showers, personal care
• Ethers: coatings, electronics
• BDO: Spandex, electrical & auto parts
• Basis of differentiation:
• Proprietary process technology/cost
• Global position
• Derivative integration
Dow
Shell/BASF
LYO & PartnersOther
2003 PO Capacity Share
PG
OtherBDO
Ethers
Polyols
2003 Derivative Demand
Source: SRI, Tecnon, Lyondell estimates

22
Propylene Oxide Is Differentiated From Other Commodity Petrochemicals By Its Technology Position
Co-Product Technology
Chlorine-Based
Technology
LYO &Partners
Asian Region European
Region
AmericanRegion
LYO LYO
LYO
PO Regional CapacityPO Technology Source
Source: SRI, Tecnon , Lyondell estimates
23
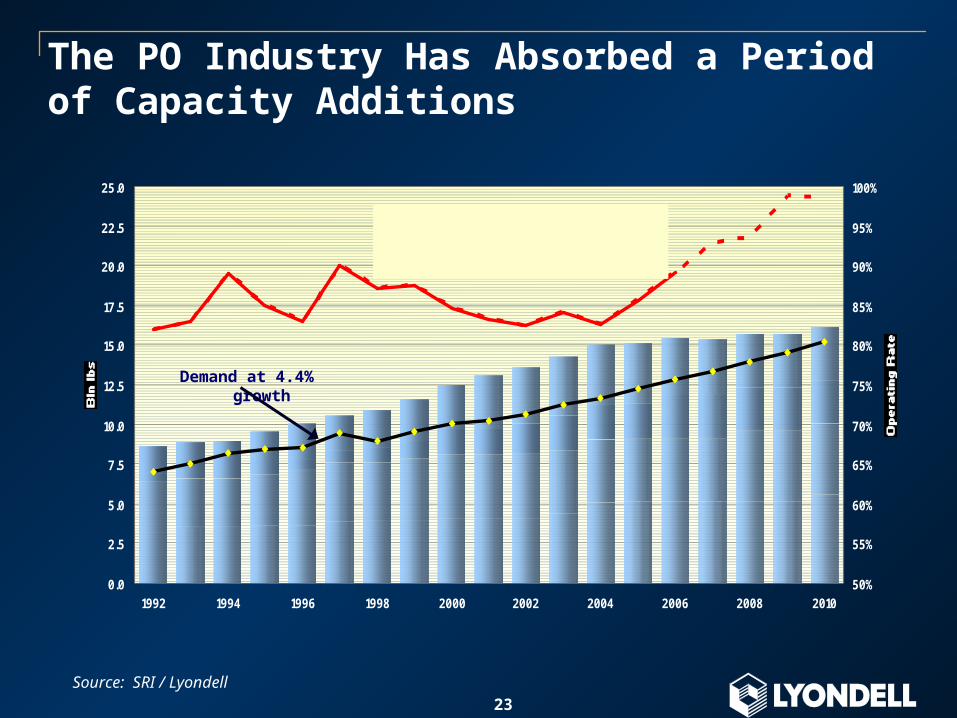
The PO Industry Has Absorbed a Period of Capacity Additions
Source: SRI / Lyondell
0.0
2.5
5.0
7.5
10.0
12.5
15.0
17.5
20.0
22.5
25.0
1992 1994 1996 1998 2000 2002 2004 2006 2008 201050%
55%
60%
65%
70%
75%
80%
85%
90%
95%
100%
Nam
epla
te C
apac
ity
Effective Operating Rate(96% On Stream Time)
Demand at 4.4% growth

24
The Lyondell Enterprise Has A Well Established Presence in Asia
Presence established in 1972
40% interest in Nihon Oxirane
$1 B revenue 1
2.5 B lbs of sales 1
Leading PO and derivative positions
Strong styrene relationships
1 Includes 100% of Nihon Oxirane
BeijingTokyo
Shanghai
Taipei
Hong Kong
Guangzhou
Offices
Inventory
Point
Manufacturing

25
The Asian / Middle East Propylene And PO Chain Supply / Demand Balance Represent An Opportunity
0
2
4
6
8
10
12
14
16
18
20
Demand Growth Supply Growth0
1
2
3
4
DemandGrowth
SupplyGrowth
DemandGrowth
SupplyGrowth
Propylene Oxide GrowthPropylene Growth
2002 - 2007 2002 - 2007 2007 - 2010Blbs Blbs
EthyleneEthylene
Co-ProductCo-Product
FCCFCC
Co-ProductCo-Product
Source: CMAI, SRI, Lyondell Estimates

26
LyondellWhat Is NOT Different? Our Financial Strategy
Maintain Sufficient Liquidity
Repay Debt
Create Shareholder Value

27
Lyondell Stock Has Performed Well In Recessions and Recoveries
-15-10
-505
101520253035
Q4 '90 - Q4 '93Downturn
Q4 '93 - July '95Recovery
Q4 '00 - Q4 '03Downturn
Q4 '03 - ?Recovery
Lyondell S&P 500
1990 – 1995 Cycle 2000 – 200? Cycle
Sh
areh
old
er R
etu
rn %
/ Y
r
Source: Bloomberg
28
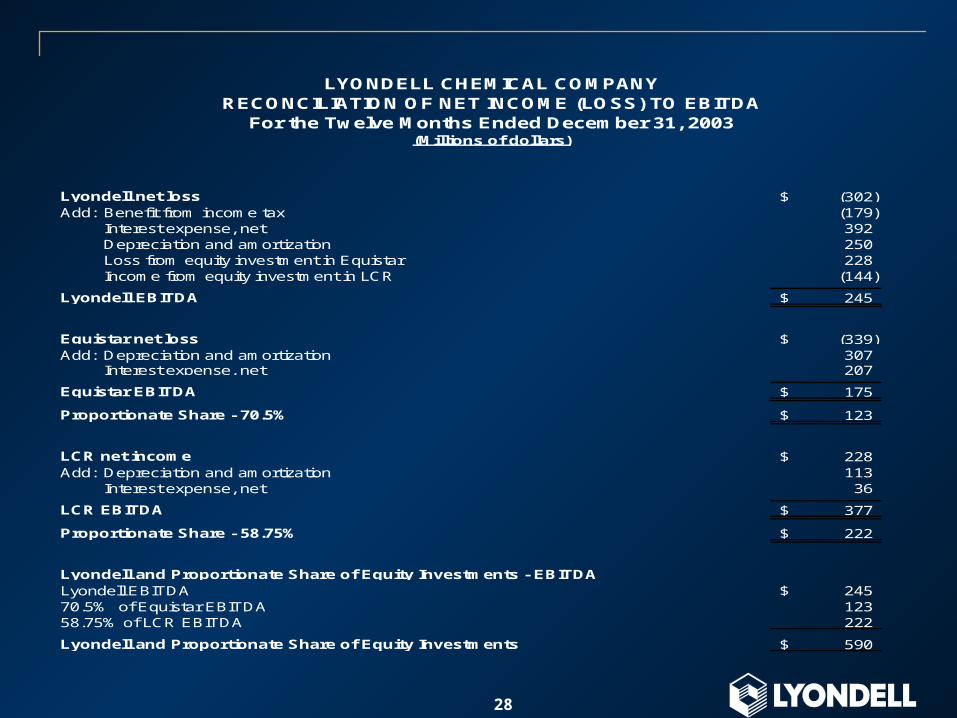
Lyondell net loss (302)$ Add: Benefit from income tax (179)
Interest expense, net 392 Depreciation and amortization 250 Loss from equity investment in Equistar 228 Income from equity investment in LCR (144)
Lyondell EBITDA 245$
Equistar net loss (339)$ Add: Depreciation and amortization 307
Interest expense, net 207
Equistar EBITDA 175$
Proportionate Share - 70.5% 123$
LCR net income 228$ Add: Depreciation and amortization 113
Interest expense, net 36
LCR EBITDA 377$
Proportionate Share - 58.75% 222$
Lyondell and Proportionate Share of Equity Investments - EBITDA Lyondell EBITDA 245$ 70.5% of Equistar EBITDA 123 58.75% of LCR EBITDA 222
Lyondell and Proportionate Share of Equity Investments 590$
LYONDELL CHEMICAL COMPANYRECONCILIATION OF NET INCOME (LOSS) TO EBITDA
(Millions of dollars)For the Twelve Months Ended December 31, 2003
29
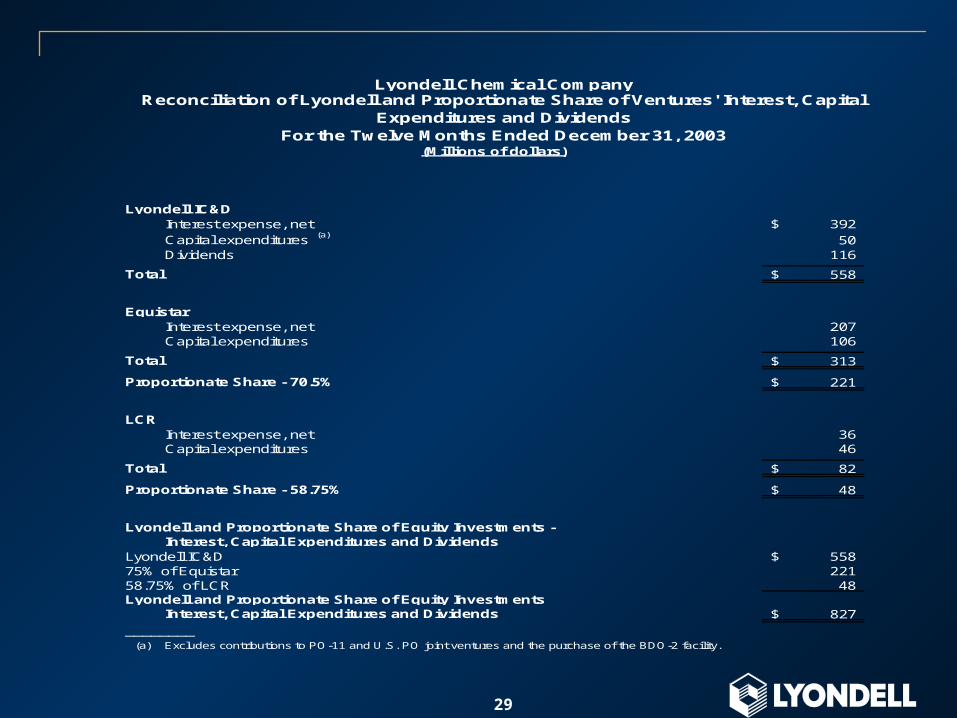
Lyondell IC&DInterest expense, net 392$ Capital expenditures (a) 50 Dividends 116
Total 558$
Equistar Interest expense, net 207 Capital expenditures 106
Total 313$
Proportionate Share - 70.5% 221$
LCRInterest expense, net 36 Capital expenditures 46
Total 82$
Proportionate Share - 58.75% 48$
Lyondell and Proportionate Share of Equity Investments - Interest, Capital Expenditures and DividendsLyondell IC&D 558$ 75% of Equistar 221 58.75% of LCR 48 Lyondell and Proportionate Share of Equity Investments
Interest, Capital Expenditures and Dividends 827$
________(a) Excludes contributions to PO-11 and U.S. PO joint ventures and the purchase of the BDO-2 facility.
Lyondell Chemical Company
(Millions of dollars)For the Twelve Months Ended December 31, 2003
Reconciliation of Lyondell and Proportionate Share of Ventures' Interest, Capital Expenditures and Dividends

30
Dec. 31, 1998 * Dec. 31, 2003
Lyondell Equistar Lyondell Equistar
Working Capital: (a)
Accounts receivable (b) 479$ 522$ 449$ 608$
Inventories 550 549 347 408
Accounts payable (310) (337) (431) (513)
Total 719 734 365 503
Add: Accounts receivable sold (c) 160 130 75 102
Adjusted working capital 879$ 864$ 440$ 605$
Days of Working Capital:
Fourth Quarter Sales Revenue 872$ 1,141$ 945$ 1,665$
Days in Quarter 92 92 92 92
Sales per day 9.5$ 12.4$ 10.3$ 18.1$
Days of working capital (b) (d) 93 70 43 33
(a) Defined as the major controllable components of working capital - receivables, inventories and payables. (b) In consideration of discounts offered to certain customers for early payment for product delivered in December 2003, some
receivable amounts were collected in December 2003 that otherwise would have been expected to be collected in January 2004, including $41 million from Occidental. Had such amounts been collected in January 2004, days of working capitalwould have been 36 days.
(c) Receivables sold are added back for consistency as such amounts are included in sales and in the sales per day calculation. Management believes that this provides useful information to investors because it reflects Lyondell's and Equistar's responsibility for administration and collection of said amounts.
(d) Days of working capital are calculated as adjusted working capital divided by sales per day.
Days of Working CapitalReconciliation
Dollars in Millions


