35

© 2020 RTi Research
2Issued: 4/22/20
What’s In This Report?
Research Methodology ............................... 3
Insights Summary ........................................ 5
General Attitudes ........................................ 6
C19 Impact on…
Health/Well-Being ............................. 13
Emotional Health ............................... 17
Personal Finances .............................. 20
Spending ............................................ 22
Shopping Behavior ............................ 27
Dining Behavior ................................. 29
Post-C19 Expectations ............................... 31

© 2020 RTi Research
3Issued: 4/22/20
Research Overview
Online survey fielded biweekly in the U.S. (see next page for details)
Survey focus on Coronavirus 19 (C19) attitudes and self-reported behavior changes related to C19 concerns
Methodology Sample Research Goal
A random selection of U.S. consumers• N=~500 per wave
Census balanced:• Age • Gender• Ethnicity• Region• Household income
To monitor the impact of C19 on consumers as it relates to various aspects of their daily lives
Thank you to for providing sample.

© 2020 RTi Research
4Issued: 4/22/20
Research Overview: Wave Interviewing Dates
W1
W1 W2 W3
W3 W4
W4 W5
W5 W6 W7
W7 W8 W9
W9

CONSUMERS WANT ACTION
FROM DATA TO MEANING®
GOOD VIBES AREN’T ENOUGHOnly one-in-five consumers want messaging that provides a sense of escape.
Even fewer want nostalgia.
THEY WANT TO HEAR HOW COMPANIES ARE MAKING A DIFFERENCE
61% feel positive towards brands helping essential workers.
73% are open to new products that help them navigate the new normal.
AND THEY WANT HELP WITH THEIR NEW LIFESTYLE
READ THE FULL REPORT TO LEARN MORE
© RTi Research 2020
(Through Wave 9: April 22, 2020)

© 2020 RTi Research
6Issued: 4/22/20
GENERAL ATTITUDES
KEY TAKEAWAYS•Americans’ expectations around the timing for
a “return to normal” continue to extend
•Support for a mandated government quarantine is still prevalent
•Opportunities exist for companies to strengthen brand equity by showing how they’re supporting frontline responders and consumers who lost jobs
•Consumers remain willing to provide their feedback to companies
© 2020 RTi Research
7Issued: 4/22/20
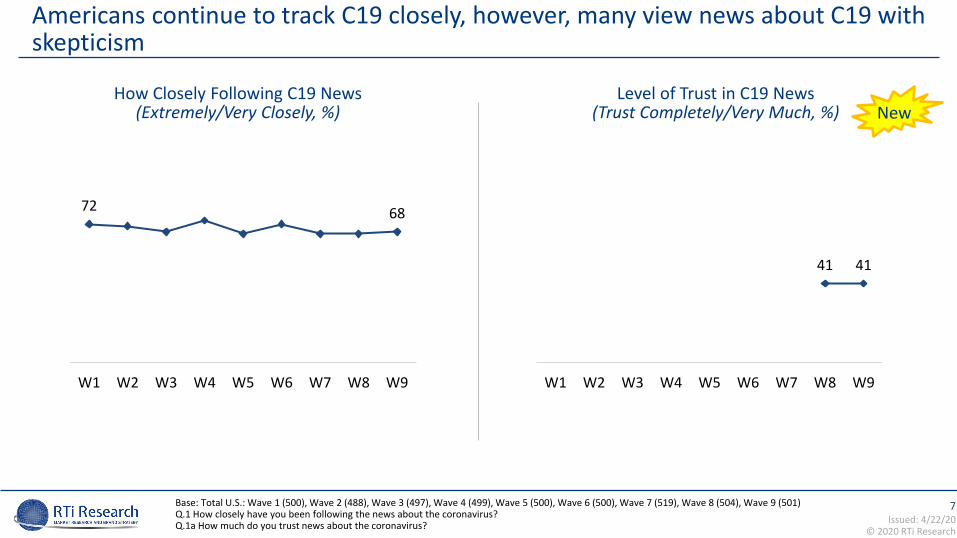
Americans continue to track C19 closely, however, many view news about C19 with skepticism
How Closely Following C19 News(Extremely/Very Closely, %)
Base: Total U.S.: Wave 1 (500), Wave 2 (488), Wave 3 (497), Wave 4 (499), Wave 5 (500), Wave 6 (500), Wave 7 (519), Wave 8 (504), Wave 9 (501)Q.1 How closely have you been following the news about the coronavirus?Q.1a How much do you trust news about the coronavirus?
Level of Trust in C19 News(Trust Completely/Very Much, %)
72 68
W1 W2 W3 W4 W5 W6 W7 W8 W9
41 41
W1 W2 W3 W4 W5 W6 W7 W8 W9
New

© 2020 RTi Research
8Issued: 4/22/20
Expectations around when C19 will end continue to lengthen, with a growing number of Americans anticipating we won’t “return to normal” until 2021
How Long Think C19 Will Last(%)
Base: Total U.S.: Wave 1 (500), Wave 2 (488), Wave 3 (497), Wave 4 (499), Wave 5 (500), Wave 6 (500), Wave 7 (519), Wave 8 (504), Wave 9 (501)Q.2a How long do you think the current coronavirus will last in your country?
Note: Waves 4-5 fielded after President Trump’s announcement that the timeline for a “return to normal” was pushed back to the end of April
14 217
9
3335
4635
W1 W2 W3 W4 W5 W6 W7 W8 W9
Into 2021
Q4 ‘20
Q3 ‘20
Q2 ‘20

© 2020 RTi Research
9Issued: 4/22/20
Widespread support for a government mandated quarantine held steady over the past week
Agreement That Government Should Quarantine the U.S.
Base: Total U.S.: Wave 1 (500), Wave 2 (488), Wave 3 (497), Wave 4 (499), Wave 5 (500), Wave 6 (500), Wave 7 (519), Wave 8 (504), Wave 9 (501)“Shelter in Place” Source: NY TimesQ.14b To what extent do you agree or disagree that the government should mandate a quarantine of the U.S. to help contain the spread of the coronavirus?
64% 66%
10
45
W1 W2 W3 W4 W5 W6 W7 W8 W9
Strongly/Somewhat Agree # of States with "Shelter in Place" Order

© 2020 RTi Research
10Issued: 4/22/20
Companies have a multitude of options to garner goodwill with consumers, especially by demonstrating how they are supporting frontline responders
Impact of Action on Consumers’ Opinion of Non-Essential Companies/Brands(%)
Base: Total U.S.: Wave 1 (500), Wave 2 (488), Wave 3 (497), Wave 4 (499), Wave 5 (500), Wave 6 (500), Wave 7 (519), Wave 8 (504), Wave 9 (501)Q.14 Please think about companies that the government has deemed non-essential (anything except critical healthcare, grocery stores, pharmacies, and gas). Would your opinion of these types of companies/brands change if a non-essential company/brand took each of the following actions in response to the coronavirus?
37 36
54 53
9 11
W1 W2 W3 W4 W5 W6 W7 W8 W9
Much/Somewhat More Positive No Impact Much/Somewhat Less Positive
Asked Customers to Participate in Surveys
51 50
40 409 10
W1 W2 W3 W4 W5 W6 W7 W8 W9
Provided Content to Support Customers’ Emotional Well-Being
53 49
39 418 11
W1 W2 W3 W4 W5 W6 W7 W8 W9
Helped Customers Navigate the Pandemic
48 45
40 4412 11
W1 W2 W3 W4 W5 W6 W7 W8 W9
Advised How Their Products/Services Could Help
38 37
54 52
7 11
W1 W2 W3 W4 W5 W6 W7 W8 W9
Sponsored an Online Activity
64 61
30 30
6 9
W1 W2 W3 W4 W5 W6 W7 W8 W9
Supported Frontline Responders
New
New
© 2020 RTi Research
11Issued: 4/22/20
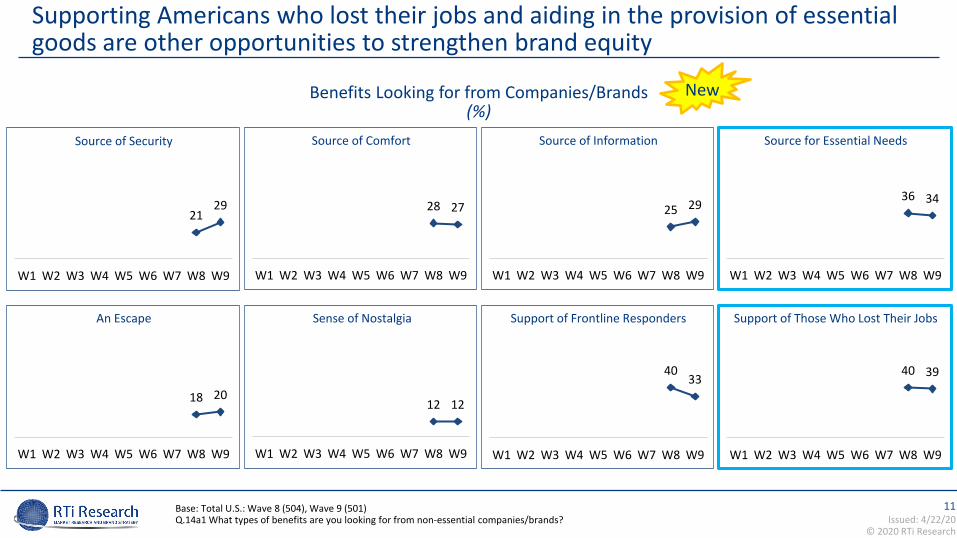
Supporting Americans who lost their jobs and aiding in the provision of essential goods are other opportunities to strengthen brand equity
Benefits Looking for from Companies/Brands(%)
Base: Total U.S.: Wave 8 (504), Wave 9 (501)Q.14a1 What types of benefits are you looking for from non-essential companies/brands?
28 27
W1 W2 W3 W4 W5 W6 W7 W8 W9
18 20
W1 W2 W3 W4 W5 W6 W7 W8 W9
12 12
W1 W2 W3 W4 W5 W6 W7 W8 W9
2129
W1 W2 W3 W4 W5 W6 W7 W8 W9
25 29
W1 W2 W3 W4 W5 W6 W7 W8 W9
4033
W1 W2 W3 W4 W5 W6 W7 W8 W9
36 34
W1 W2 W3 W4 W5 W6 W7 W8 W9
40 39
W1 W2 W3 W4 W5 W6 W7 W8 W9
Source of ComfortSource of Security Source of Information Source for Essential Needs
An Escape Sense of Nostalgia Support of Frontline Responders Support of Those Who Lost Their Jobs
New

© 2020 RTi Research
12Issued: 4/22/20
Companies perceived to be responding well are seen as providing essential goods and support to frontline responders who also might be their own employees
Companies with Most Impressive Response to C19
Note: font size for each brand represents the frequency of mentions (i.e., larger font=more mentions, smaller font=fewer mentions)Base: Total U.S.: Wave 9 (501)Q.14a Which company(s) or brand(s) have you been most impressed with in terms of their response to the coronavirus?

© 2020 RTi Research
13Issued: 4/22/20
IMPACT ON HEALTH/WELL-BEING
KEY TAKEAWAYS•Health concerns remain widespread
•Americans are concerned about both their mental/emotional and physical health
•Consumers continue to eat junk food with greater frequency

© 2020 RTi Research
14Issued: 4/22/20
Base: Total U.S.: Wave 1 (500), Wave 2 (488), Wave 3 (497), Wave 4 (499), Wave 5 (500), Wave 6 (500), Wave 7 (519), Wave 8 (504), Wave 9 (501)Q.3 How worried are you about…?
Health concerns are still widespread
Level of Worry About Overall Health(%)
25 24
31 34
44 42
W1 W2 W3 W4 W5 W6 W7 W8 W9
Personal Health
18 20
29 27
53 53
W1 W2 W3 W4 W5 W6 W7 W8 W9
Family’s Health
Not At All/Not Very Worried Somewhat Worried Very/Extremely Worried
© 2020 RTi Research
15Issued: 4/22/20
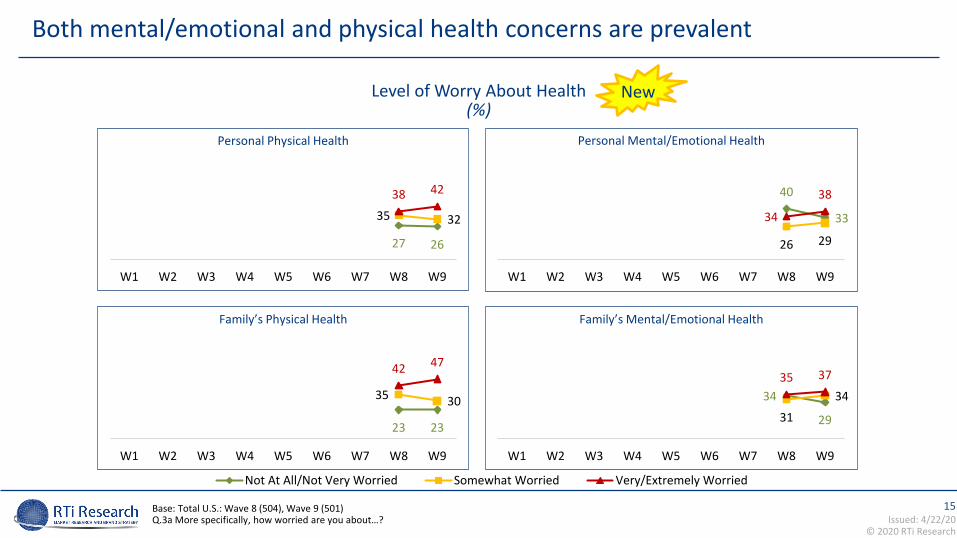
Both mental/emotional and physical health concerns are prevalent
Base: Total U.S.: Wave 8 (504), Wave 9 (501)Q.3a More specifically, how worried are you about…?
27 26
35 32
38 42
W1 W2 W3 W4 W5 W6 W7 W8 W9
Personal Physical Health
23 23
35 30
42 47
W1 W2 W3 W4 W5 W6 W7 W8 W9
Family’s Physical Health
40
33
26 29
34
38
W1 W2 W3 W4 W5 W6 W7 W8 W9
Personal Mental/Emotional Health
34
2931
3435 37
W1 W2 W3 W4 W5 W6 W7 W8 W9
Family’s Mental/Emotional Health
Level of Worry About Health(%)
Not At All/Not Very Worried Somewhat Worried Very/Extremely Worried
New

© 2020 RTi Research
16Issued: 4/22/20
Junk food consumption remains elevated vs. wave 1
Impact of C19 on Activity Frequency: General Health/Well-Being(%)
Base: Total U.S.: Wave 1 (500), Wave 2 (488), Wave 3 (497), Wave 4 (499), Wave 5 (500), Wave 6 (500), Wave 7 (519), Wave 8 (504), Wave 9 (501)Q.10/10a How has the coronavirus impacted how often you do the following? Would you say you’re doing these activities…?
65 65
29 28
6 7
W1 W2 W3 W4 W5 W6 W7 W8 W9
Cooking at Home
30 35
5242
18 23
W1 W2 W3 W4 W5 W6 W7 W8 W9
Exercising
40 40
51 46
9 14
W1 W2 W3 W4 W5 W6 W7 W8 W9
Eating Healthy Foods
22 20
45
3633
44
W1 W2 W3 W4 W5 W6 W7 W8 W9
Seeking Routine/Non-Essential Medical Care
2838
5142
21 20
W1 W2 W3 W4 W5 W6 W7 W8 W9
Eating Unhealthy/Junk Foods
Much/Somewhat More No Impact Somewhat/Much Less

© 2020 RTi Research
17Issued: 4/22/20
IMPACT ON EMOTIONAL HEALTH
KEY TAKEAWAYS•Americans report their relationships are in
good shape and continue to rely on technology to stay in touch

© 2020 RTi Research
18Issued: 4/22/20
63 64
32 29
5 7
W1 W2 W3 W4 W5 W6 W7 W8 W9
Watching TV
45
4948
427 9
W1 W2 W3 W4 W5 W6 W7 W8 W9
Making Phone Calls
49 50
41 4110 9
W1 W2 W3 W4 W5 W6 W7 W8 W9
Staying in Touch w/Friends/Family on Social Media
3647
54
4310 10
W1 W2 W3 W4 W5 W6 W7 W8 W9
Videoconferencing/FaceTime
46 45
44 4310 12
W1 W2 W3 W4 W5 W6 W7 W8 W9
Reading Social Media
Technology remains critical for social connection
Impact of C19 on Activity Frequency: Social Connection(%)
Base: Total U.S.: Wave 1 (500), Wave 2 (488), Wave 3 (497), Wave 4 (499), Wave 5 (500), Wave 6 (500), Wave 7 (519), Wave 8 (504), Wave 9 (501)Q.10a How has the coronavirus impacted how often you do the following? Would you say you’re doing these activities…?
Much/Somewhat More No Impact Somewhat/Much Less
New

© 2020 RTi Research
19Issued: 4/22/20
Relationships continue to hold strong
Impact of C19 on Relationships(%)
Base: Total U.S.: Wave 1 (500), Wave 2 (488), Wave 3 (497), Wave 4 (499), Wave 5 (500), Wave 6 (500), Wave 7 (519), Wave 8 (504), Wave 9 (501) Note: Balance of responses is “Not Applicable”Q.10c What impact has the coronavirus had on your relationship(s) with your…?
21 25
5041
14 12
W1 W2 W3 W4 W5 W6 W7 W8 W9
Spouse/Partner Other Family Members
Friends Colleagues
29 32
5346
16 17
W1 W2 W3 W4 W5 W6 W7 W8 W9
23 27
52 49
21 10
W1 W2 W3 W4 W5 W6 W7 W8 W9
19 19
51 48
16 16
W1 W2 W3 W4 W5 W6 W7 W8 W9
Large/Small Positive Impact No Impact Small/Large Negative Impact

© 2020 RTi Research
20Issued: 4/22/20
IMPACT ON PERSONAL FINANCES
KEY TAKEAWAYS•Consumers are still worried about both their
job security and personal finances
•Less volatile assets remain the preferred investment vehicles

© 2020 RTi Research
21Issued: 4/22/20
Both job security and financial concerns remain prevalent
Level of Worry About…(%)
*Base: Non-Business Owner & Still Working: Wave 1 (143), Wave 2 (128), Wave 3 (158), Wave 4 (148), Wave 5 (152), Wave 6 (151), Wave 7 (161), Wave 8 (176), Wave 9 (158) Base: Total U.S.: Wave 1 (500), Wave 2 (488), Wave 3 (497), Wave 4 (499), Wave 5 (500), Wave 6 (500), Wave 7 (519), Wave 8 (504), Wave 9 (501)Q.9 How worried are you about…?
27
3035
29
38 41
W1 W2 W3 W4 W5 W6 W7 W8 W9
40 37
31 32
29 31
W1 W2 W3 W4 W5 W6 W7 W8 W9
44 40
30 35
26 25
W1 W2 W3 W4 W5 W6 W7 W8 W9
Not At All/Not Very Worried Somewhat Worried Very/Extremely Worried
Note: The stimulus package was signed into law part way into wave 3 fielding.
Current Personal Financial Situation Long-Term Personal Financial SituationJob Security*
© 2020 RTi Research
22Issued: 4/22/20
KEY TAKEAWAYS•Health/Hygiene, cleaning, and food/beverage
product purchasing is elevated vs. pre-C19
•Consumers still perceive non-cash payments as more hygienic compared to cash
•Americans are open to trying new products that will help them navigate the current environment
IMPACT ON SPENDING

© 2020 RTi Research
23Issued: 4/22/20
Increased spending vs. before the C19 outbreak is focused on health/hygiene products and cleaning supplies
Impact on Spending Since C19 Started(%)
Base: Total U.S.: Wave 1 (500), Wave 2 (488), Wave 3 (497), Wave 4 (499), Wave 5 (500), Wave 6 (500), Wave 7 (519), Wave 8 (504), Wave 9 (501)Q.11 How has the coronavirus impacted your spending on each of the following since the coronavirus started?
Much/Somewhat More No Impact Somewhat/Much Less
43
4946
4111 10
W1 W2 W3 W4 W5 W6 W7 W8 W9
Cleaning Supplies
19 18
70 70
11 12
W1 W2 W3 W4 W5 W6 W7 W8 W9
Prescription Medicine
40 41
46 46
14 13
W1 W2 W3 W4 W5 W6 W7 W8 W9
Healthcare/Personal Hygiene Supplies
25 25
62 61
13 14
W1 W2 W3 W4 W5 W6 W7 W8 W9
Non-prescription Medicine/Vitamins/Supplements

© 2020 RTi Research
24Issued: 4/22/20
Food/Beverages also saw a lift in spending vs. prior to C19, more so than less essential items
Impact on Spending Since C19 Started(%)
Base: Total U.S.: Wave 1 (500), Wave 2 (488), Wave 3 (497), Wave 4 (499), Wave 5 (500), Wave 6 (500), Wave 7 (519), Wave 8 (504), Wave 9 (501)Q.11 How has the coronavirus impacted your spending on each of the following since the coronavirus started?
Much/Somewhat More No Impact Somewhat/Much Less
20 25
6254
18 21
W1 W2 W3 W4 W5 W6 W7 W8 W9
19 24
31 25
50 51
W1 W2 W3 W4 W5 W6 W7 W8 W9
15 16
68 65
17 18
W1 W2 W3 W4 W5 W6 W7 W8 W9
40
4846
39
14 13
W1 W2 W3 W4 W5 W6 W7 W8 W9
Food/Beverages
Alcoholic Beverages/Liquor
Restaurants (Dine-in or Takeout)
Tobacco Products
17 20
61 56
22 24
W1 W2 W3 W4 W5 W6 W7 W8 W9
Beauty/Grooming Products

© 2020 RTi Research
25Issued: 4/22/20
56 54
22 25
22 21
W1 W2 W3 W4 W5 W6 W7 W8 W9
59 57
21 23
20 20
W1 W2 W3 W4 W5 W6 W7 W8 W9
Consumers continue to perceive non-cash transactions as more sanitary vs. cash
Level of Worry About Catching C19 by Paying With…(%)
Base: Total U.S.: Wave 1 (500), Wave 2 (488), Wave 3 (497), Wave 4 (499), Wave 5 (500), Wave 6 (500), Wave 7 (519), Wave 8 (504), Wave 9 (501)Q.11a How worried are you about catching the coronavirus as a result of paying with…?
Credit/Debit Card Cashless Payments
41 36
29 34
29 30
W1 W2 W3 W4 W5 W6 W7 W8 W9
Cash
Not At All/Not Very Worried Somewhat Worried Very/Extremely Worried

© 2020 RTi Research
26Issued: 4/22/20
Americans are open to trying new products to help them through the pandemic; they’re more leery of trying new restaurants
Openness to Trying…(%)
Base: Total U.S.: Wave 8 (504), Wave 9 (501)Q.11a1 At this moment, how open are you to trying…?
New
28
43
29
Extremely/Very Open
Somewhat Open
Not Very/Not At All Open
26
45
29
Products That Are Brand New Restaurants Never VisitedProducts That Have Been Out,
But Haven’t Used
71 71
26
44
29
28
45
27
71 73
22
31
47
22
31
47
53 53
W8 W9 W8 W9 W8 W9

© 2020 RTi Research
27Issued: 4/22/20
IMPACT ON SHOPPING BEHAVIOR
KEY TAKEAWAYS•Online shopping continues to see higher
patronage vs. pre-C19

© 2020 RTi Research
28Issued: 4/22/20
Shopping online has spiked since the onset of C19, with nearly half of Americans reporting higher online frequency
Impact of C19 on Activity Frequency(%)
Base: Total U.S.: Wave 8 (504), Wave 9 (501)Q.10 How has the coronavirus impacted how often you do the following? Would you say you’re doing these activities…?
21
15
64
Much/Somewhat More
No Impact
Somewhat/Much Less
19
21
60
Shopping OnlineShopping in Stores
47
37
16
47
38
15
W8 W9 W8 W9

© 2020 RTi Research
29Issued: 4/22/20
IMPACT ON DINING BEHAVIOR
KEY TAKEAWAYS•Restaurants continue to rely on takeout and
delivery to navigate the C19 threat

© 2020 RTi Research
30Issued: 4/22/20
Takeout and delivery remain critical to keeping restaurants open
Impact of C19 on Activity Frequency: Dining(%)
Base: Total U.S.: Wave 1 (500), Wave 2 (488), Wave 3 (497), Wave 4 (499), Wave 5 (500), Wave 6 (500), Wave 7 (519), Wave 8 (504), Wave 9 (501)Q.10 How has the coronavirus impacted how often you do the following? Would you say you’re doing these activities…?
Picking Up Takeout From Restaurants Getting Takeout Delivered to Your House From Restaurants
Eating in Restaurants
22 21
16 14
62 65
W1 W2 W3 W4 W5 W6 W7 W8 W9
32
4037
283132
W1 W2 W3 W4 W5 W6 W7 W8 W9
30 32
45 39
26 29
W1 W2 W3 W4 W5 W6 W7 W8 W9
Much/Somewhat More No Impact Somewhat/Much Less

© 2020 RTi Research
31Issued: 4/22/20
KEY TAKEAWAYS•C19’s impact continues to reinforce contactless
behaviors, including digital communication and virtual hobbies
•That said, Americans are also using this time for home improvement and are rediscovering cooking at home
•Consumers say they plan to continue using social distancing once C19 subsides and are becoming more conservative regarding when they plan to return to engaging in activities with crowds
POST-C19 EXPECTATIONS

© 2020 RTi Research
32Issued: 4/22/20
C19 is spurring digital progress, from contactless payments to virtual communications, and may be creating new shopping habits
Actions Would Continue Taking After C19 Ends(%)
Base: Total U.S.: Wave 9 (501)Q.13c Which of these would you continue doing after the coronavirus ends?
28
23
22
21
21
20
20
19
19
19
17
15
Trying new recipes
Ordering food from a restaurant that features contactless services
Using videoconferencing/FaceTime for social purposes
Ordering groceries online
Shopping at large national/regional grocery chain
Shopping at small, locally owned grocery stores/chains
Shopping at large national/regional chains other than for groceries
Using contactless payment methods
Having food delivered to home from a restaurant
Shopping at small, locally owned stores/chains other than for groceries
Using videoconferencing/FaceTime for work purposes
Taking virtual tours

© 2020 RTi Research
33Issued: 4/22/20
Americans are exploring a range of virtual diversions and home improvement tasks
Activities Exploring During C19(%)
Note: These numbers represent a net of current participation and desired future participation; ratings are similar for both metricsBase: Total U.S.: Wave 9 (501)Q.13c1 Which activities have you participated in since the coronavirus started?Q.13c2 Which activities would you like to participate in over the next few weeks?
New
36
33
33
30
29
26
24
21
21
Planting a garden
Online exercise
Redecorating/Rearranging home
Online personal growth course
Online adult education
Adopting/Fostering a pet
Backyard camping
Watching virtual sports
Participating in virtual sports

© 2020 RTi Research
34Issued: 4/22/20
27 24
W1 W2 W3 W4 W5 W6 W7 W8 W9
U.S. consumers plan to continue social distancing and cooking at home for the foreseeable future
Behaviors Expect to Continue After C19 Ends(%)
Base: Total U.S.: Wave 8 (504), Wave 9 (501)Q.13e Which of these behaviors do you see yourself continuing after the coronavirus is over?
47 48
W1 W2 W3 W4 W5 W6 W7 W8 W9
Keeping Social Distance
16 20
W1 W2 W3 W4 W5 W6 W7 W8 W9
More Staycations Insteadof Vacations
More DIYHome Improvements
43 45
W1 W2 W3 W4 W5 W6 W7 W8 W9
Not Shaking Hands
37 37
W1 W2 W3 W4 W5 W6 W7 W8 W9
Spending More Time as a Family
19 18
W1 W2 W3 W4 W5 W6 W7 W8 W9
Continuing a New Hobby
New
31 34
W1 W2 W3 W4 W5 W6 W7 W8 W9
Baking at Home More
25 27
W1 W2 W3 W4 W5 W6 W7 W8 W9
Getting Takeout/Delivery Instead of Going to Restaurants
30 31
W1 W2 W3 W4 W5 W6 W7 W8 W9
Exercising at Home/Outdoors vs. a Gym
48 50
W1 W2 W3 W4 W5 W6 W7 W8 W9
Cooking at Home More
Question added in wave 8

© 2020 RTi Research
35Issued: 4/22/20
1.0 1.3
W1 W2 W3 W4 W5 W6 W7 W8 W9
1.9 2.1
W1 W2 W3 W4 W5 W6 W7 W8 W9
1.51.9
W1 W2 W3 W4 W5 W6 W7 W8 W9
2.0 2.3
W1 W2 W3 W4 W5 W6 W7 W8 W9
1.4 1.6
W1 W2 W3 W4 W5 W6 W7 W8 W9
2.4 2.6
W1 W2 W3 W4 W5 W6 W7 W8 W9
1.8 2.1
W1 W2 W3 W4 W5 W6 W7 W8 W9
Going to Sports/Entertainment Events Traveling Outside Your CountryTraveling Within Your Country
Stopping Practicing Social Distancing Eating at RestaurantsShopping in Physical Stores
Americans’ personal expectations for resuming activities are becoming more conservative
Expected # of Months Would Wait Once Things Return to Normal Before…(Mean)
Base: Total U.S.: Wave 1 (500), Wave 2 (488), Wave 3 (497), Wave 4 (499), Wave 5 (500), Wave 6 (500), Wave 7 (519), Wave 8 (504), Wave 9 (501)Q.13d How long would you wait to do the following after things start returning to normal (e.g., people return to work, stores/restaurants reopen)?
Going to the Movies


