49


Strategies: Reduce the time until first calving and
lactation
Reduce the input expenses required
While not reducing the future
productive potential

Calf mortality: < 5% ; 2% better
Age first heat: < 11 mo.
Age bred: 12.5-14 mo.
Age to calve: 22-24 mo; average 23
Weight at breeding: 55% MBW
Weight at calving: 85-90% MBW

Body
Weight
Age
Animal Growth
Mature
puberty
calving
ring this age; growth will aosta

Makes up the largest single component of the cost of raising a dairy heifer
Is often given lowest priority on the dairy farm

Gabler et al., 2000. JDS. 83:1104–1109
Feed costs are the largest cost input for heifer production (>60%)
Heifer feed costs >12% of total farm expenses
050
100150200250300350400450500550600650
Ave
rage
Tot
al Cos
t

Improve FE Increase
growth rates
Reduce feed costs

12 weeks old –fed TMR

Intake Saliva
HCO3-
HPO42-
Organic Acid Production
pH
AbsorptionROUGHAGE
(avg. 1.18 mm)
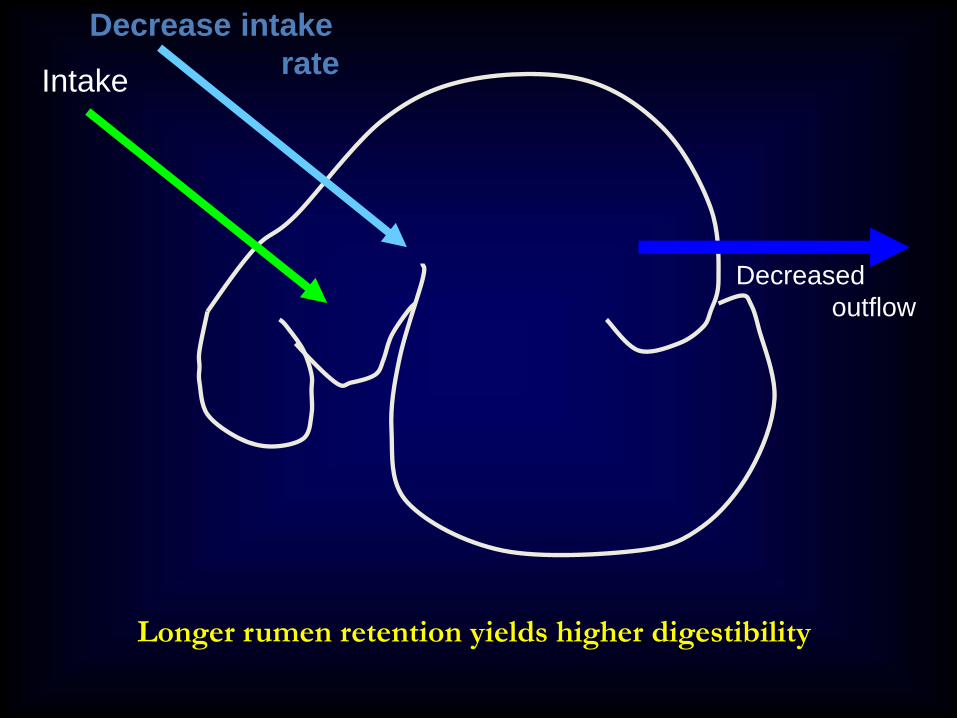
Decreased
outflow
Intake
Decrease intake
rate
Longer rumen retention yields higher digestibility

Dairy Heifer
Nutrition
Ad LibitumPrecision
Feeding
Low
Quality
Diet
High
Quality
Diet

There are many
ways to feed
heifers
All may work well and allow heifers to grow
Not all are feed efficient
Feed In-effcient
Feed efficient
40% of maintance energy goes to feed the GI
tract.


Zanton and Heinrichs, 20084 5 6 7 8
DMI, kg/d
0
10
20
30
Am
ou
nt
excr
eted
, k
g/d
Total Manure
Fecal wet matter
Urine
Fecal dry matter

Shown to be approx. 40% of total metabolizableenergy intake
Reynolds, 1991

If we limit feed intake by use of straw/corn stover feeding, we decrease FE and increase ME requirements.

Age (mo)
DMI (% body weight)
4 2.2
6 2.1
9 1.9
14 1.8
18 1.7
20 1.6
23 1.6

Should be able to rely primarily on forages for energy feeds
Provided they are digestible; not high fiber and lignin
Grains (corn) can be used as part of energy intake
Chop size of forage (particle size) is not important for a heifer
Can be long hay
Can be quite short cut silages/hays

After 6 months, the rumen can most often provide all of the protein needs (microbial) of the dairy heifer
At least by 8 months
Provided the proteins fed are rumen degradable
Not heat damaged (fiber bound)
Not rumen bypass proteins

NPN (non-protein nitrogen) is excellent for a heifer
As long as intake is spread out during the day
Slow release NPN is very effective
Using a combination of NPN and protein feeds will also work in that situation
The rumen of a heifer can recycle blood ammonia very effectively
No mammary gland to take urea out

Goal of raising dairy heifers is to minimize costs without sacrificing future productive potential
Age at first calving 22-24 mo avg 23.x mos
Genetics allows for top milk production at young ages
Growth rates must reflect mammary growth needs
Body weight at calving should be 90% of mature weight
Height at calving should be 95% of mature height

Weaning to 6 months
6 months to puberty/breeding
Breeding to pre-calving
Pre-calving

Grain- 4-6 lbs per day from weaning to 4-6 months of age
After 6 mos- may
depend on forage
program.
At 4-6 mos- may go to
a TMR.

Diets based on 2.5-3 kg of grain/hd/d
Forage based TMR- limited corn silage is easier
Supplement energy, minerals on pasture
Base intake on 700-900 g/day ADG
Total diet 15% CP; 30 – 35% soluble protein

Diets based on forage plus 1-1/5 kg (2-3 lbs) grain/d unless forage quality is high
Based on forages- can be higher corn silage
CP 15%- emphasis on rumen degradable feeds; NPN works well
TMR excellent

Growth rate = required calving weight –breeding (conception) weight/ 282 days (gestation)
Diets most often high forage (likely not only corn silage) – quality may limit intake/day
Cheaper feeds can be used and intake adjusted accordingly
13-14% CP –need soluble and rumen degradable protein sources and slow release NPN

High starch silages are problems –
Feed limited amounts unless you are limit feeding
Limit with poor quality forage or less dry matter intake
Other silages: grass, alfalfa, small grains are excellent

70.00
72.00
74.00
76.00
78.00
80.00
DM Old OM Old DM Young OM Young
Treatment
% D
igesti
bil
ity (
A)
LC LC+Y
HC HC+Y
DM and OM Digestibility
F = Forage a = P < 0.01 * = Age
Effect (P < 0.01 )
Y = Yeast b = P < 0.05
FaYb FaYb FaYb Fa
Yb
Penn State Study
Yea Sacc fed 10gm/hd/d

0
20
40
60
80
100
120
140
160
-2 0 2 4 6 8 10 12 14 16 18 20 22 24
Hour relative to feeding
mg
/ml
NO YEAST
YEAST
VFA Pattern
* * = P < 0.01
* = P < 0.1
*****
* *
Penn State Study- 1 time /day feeding

Yeast and Heifer Diets- Precision Fed
Bacteria, 1011cells/ml
NH3N, mg/dL
VFA, mmol
DMI, kg/d
Digestibility, %
-2 0 2 4 6 8 10
2,6
-0,8
10
-2
1,7
Lascano et al. 2009. Livest. Sci .
Lascano et al. 2009. JDS
Differences respect to control

Keep heifers healthy/clean
Maximize forage use; then add supplements as needed
Poor quality forages may not make sense or economics in a heifer program
Silages and pasture likely cheapest/best for heifers if fed/managed correctly
Dry forages are also good; often less available and more costly
Heifers always need mineral and vitamin supplements- and often protein

Costs to Raise Heifers, birth to fresheningsurvey of 44 PA herds, winter 2011/spring 2012
$/heifer Mean SD Min Max
Feed 1,318 281 819 1,980
Labor 203 99 66 436
Bedding 90 81 10 392
Repro 49 22 13 122
Health 17 13 3 66
Total 1,808 339 1,129 2,505
Total/day 2.38 0.41 1.50 3.24

Looked at Efficiency of heifer raising• Costs at all time points
• Nutrition/feeding rates at all time points/groups
• Growth at weaning, breeding, calving
• Age at calving
• DHI records- milk (total, fat, protein), reproduction, culling; all compared total
herd averages

Efficient farms compared to Inefficient farmsdata envelopment analysis of 44 PA herds, winter 2011-2012
Efficient Inefficient
Number 9 35
Feed costs ($/heifer) 1,137 1,364
Labor costs ($/heifer) 141 218
Milk produced by first lactation heifers (% of mature herd mates)
88% 82%
Age at calving (mo) 23.7 25.3
Heinrichs et al., 2013
Moderate
Average
High
Low
-20.00%
-15.00%
-10.00%
-5.00%
0.00%
5.00%
10.00%
15.00%
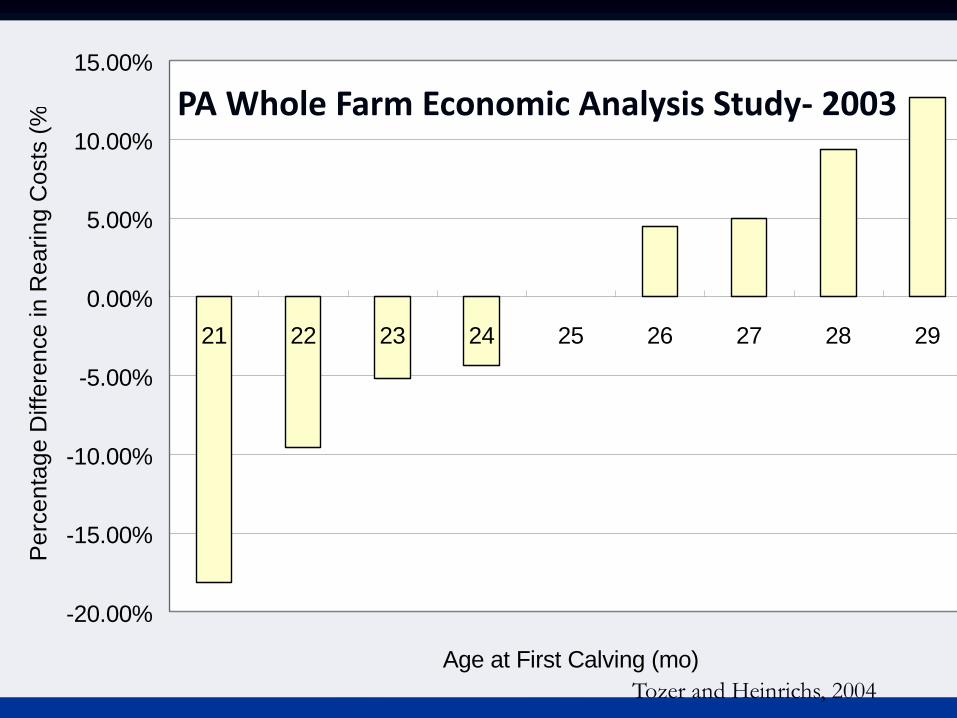
21 22 23 24 25 26 27 28 29
Age at First Calving (mo)
Pe
rce
nta
ge
Diffe
ren
ce
in
Re
arin
g C
osts
(%
)
Tozer and Heinrichs, 2004
PA Whole Farm Economic Analysis Study- 2003
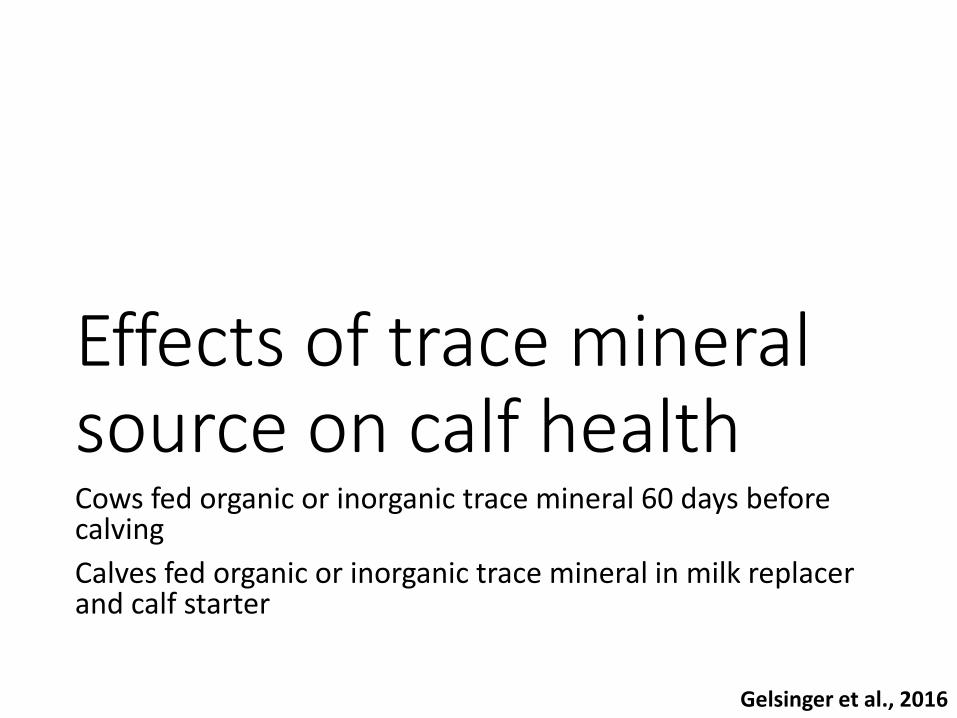
Effects of trace mineral source on calf healthCows fed organic or inorganic trace mineral 60 days before calving
Calves fed organic or inorganic trace mineral in milk replacer and calf starter
Gelsinger et al., 2016

Number of sick days (health score >2)
8,1
0,6
2.5a
8,7
0,40.6b
7,1
0,61.3a
7,5
0,5 0.8b
0
2
4
6
8
10
12
Feca
l
Res
pir
ato
ry
Gen
eral
Feca
l
Res
pir
ato
ry
Gen
eral
Feca
l
Res
pir
ato
ry
Gen
eral
Feca
l
Res
pir
ato
ry
Gen
eral
Inorganic:Inorganic Inorganic:Organic Organic:Inorganic Organic:Organic
Day
s w
ith
Sco
re >
2
Treatment (Calf : Cow)Gelsinger et al., 2016

Frequency of sick days (weeks with haptoglobin > 50 µg/mL)
a
b
a
b
0,0
0,5
1,0
1,5
2,0
2,5
3,0
3,5
4,0
Inorganic:Inorganic Inorganic:Organic Organic:Organic Organic:Inorganic
We
eks
Hap
togl
ob
in>
50
µg
/mL
Treatment (Calf : Cow)
Gelsinger et al., 2016

Dry matter intake by week
0,0
2,0
4,0
6,0
8,0
10,0
12,0
14,0
1 2 3 4 5 6 7
Dry
mat
ter
inta
ke, k
g/w
k
Week of Age
Inorg:Inorg Inorg:Org Org:Inorg Org:OrgTreatment Calf : Cow
Gelsinger et al., 2016

Table 4. Age at calving in heifers fed OTM or ITM during growth
Treatment1 Age at calving2 SE P-value
IH 24.77 0.30 0.07
OH 24.04
IC 24.59 0.35 0.05
OC 23.72
IH-IC 24.66 0.54 0.51
IH-OC 24.30
OH-IC 24.91
OH-OC 23.27
1 IH-IC: ITM in heifer, ITM in cow; IH-OC: ITM in heifer, OTM in cow; OH-IC: OTM in heifer, ITM in cow;
OH-OC: OTM in heifer, OTM in cow2 29 OTM and 28 ITM heifers

Figure 12. Accumulative production at 100 DIM in heifers fed OTM or ITM during
growth and first lactation
Figure 13.Accumulative production at
100 DIM in heifers by treatment

Rabiee et al, 2010
Cows Milk Yield and Quality

Figure 9. Open days after calving in cows fed OTM or ITM during dry period

Conclusions
• Overall the source of TM did not have an impact on growth characteristics.
• Heifers supplemented with OTM tended to calve earlier the animals.
• Cow TM affect significantly the age of calving of the heifers, where the OTM cows have daughters that calve earlier than the ITM supplemented cows.

• TM did not showed a significant effect on milk quality
• Heifers supplemented with OTM showed a significant effect on milk yield until 100 DIM
• Probably the high variability in the variable analyzed presented a lack of power in the analysis suggesting that for further studies the number of animals analyzed has to be larger.
Conclusions

Goals-
• Set heifer goals for 2019 not 1969
• Monitor heifers- growth, BCS
• Maintain correct ADG
• Balance rations- feed to amount needed, not all they can eat
• Track age at calving and consider not raising all the heifers all the time!

Thanks

Distribution of age at first calving in PA Holsteins, 2002 v. 2017
DRMS data
0,0%
10,0%
20,0%
30,0%
18 19 20 21 22 23 24 25 26 27 28 29 30
He
ife
rs a
t e
ach
age
, % o
f to
tal
Age at first calving, months
2017 2002
Heifers with AFC of 21 – 24 mo2002 – 31.1% 2017 – 63.4%

Comparison of actual 305-d milk by age at first calving in PA Holsteins, 2010 v. 2017
16.000
17.000
18.000
19.000
20.000
20 21 22 23 24 25 26 27 28Act
ual
30
5-d
milk
yie
ld, l
bs.
Age at calving, months
2010 2017
DRMS data


