23
What’s on an investor’s mind? Stephen Blackman, RBS Group Economics
| Date post: | 20-Dec-2015 |
| Category: |
Documents |
| View: | 218 times |
| Download: | 3 times |
What’s on an investor’s mind?
Stephen Blackman, RBS Group Economics
Slide 2
Three questions
What is the likely path of global growth?
Why does macro matter so much to investors?
Where would you put your last penny?
Slides available from: [email protected] or http://www.rbs.com
Slide 3
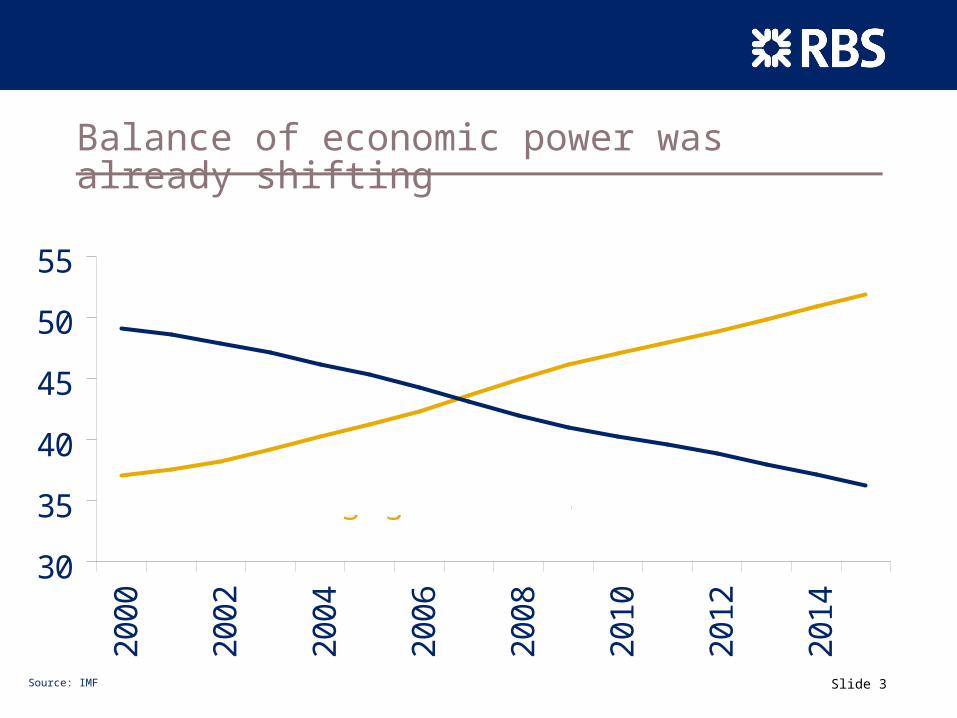
Balance of economic power was already shifting
30
35
40
45
50
55
2000
2002
2004
2006
2008
2010
2012
2014
Share of World GDP in PPP terms (%)
G7
Emerging Economies
Source: IMF
Slide 4
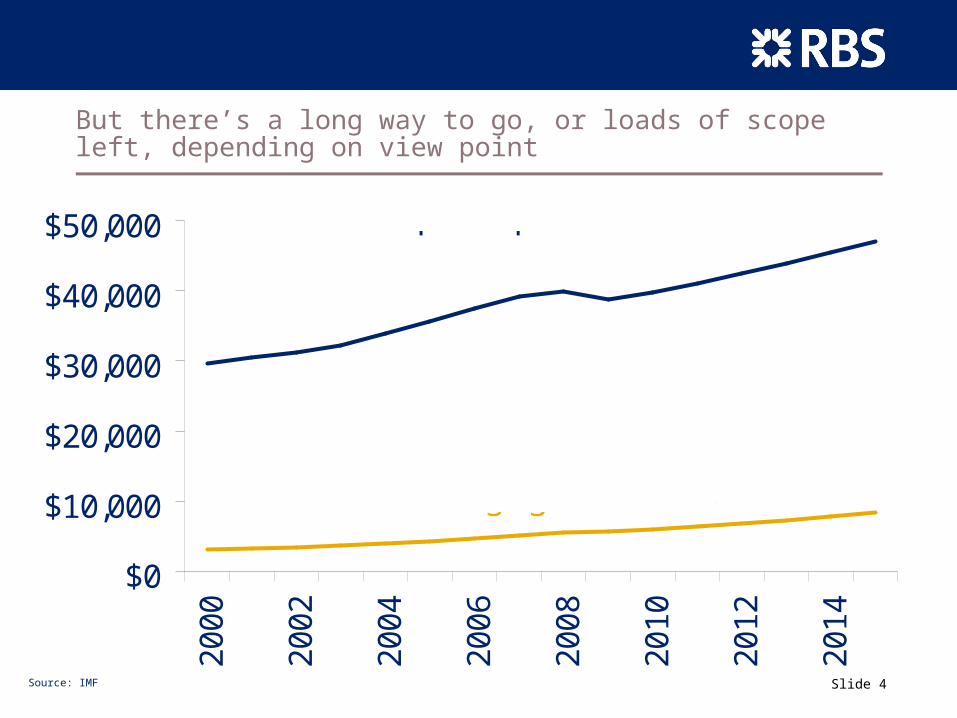
But there’s a long way to go, or loads of scope left, depending on view point
$0
$10,000
$20,000
$30,000
$40,000
$50,00020
00
2002
2004
2006
2008
2010
2012
2014
GDP per Capita in PPP
G7
Emerging Economies
Source: IMF
Slide 5
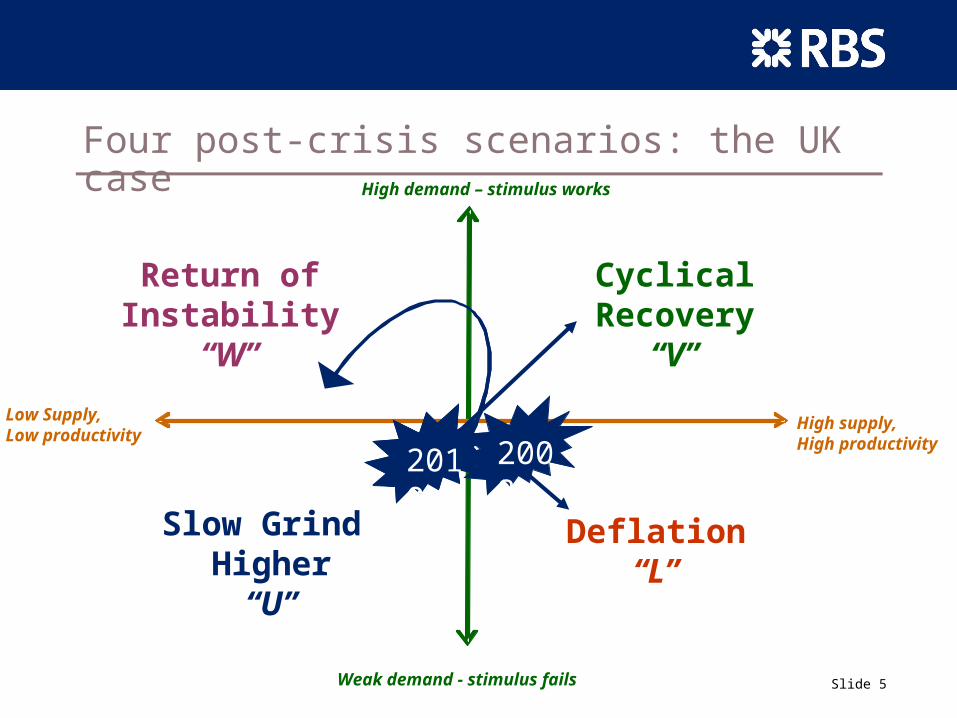
Four post-crisis scenarios: the UK case
Slow Grind Higher
“U”
Return ofInstability
“W”
Cyclical Recovery“V”
Deflation“L”
High supply, High productivity
Low Supply,Low productivity
High demand – stimulus works
Weak demand - stimulus fails
2009 20082010
Slide 6
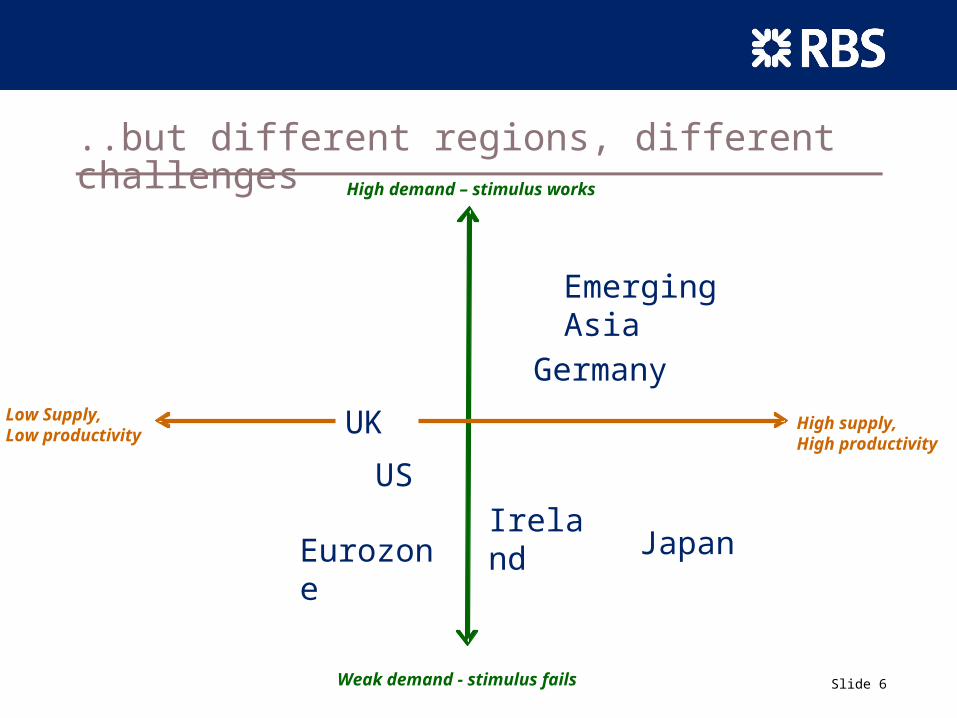
..but different regions, different challenges
Japan
US
UK
Eurozone
Emerging Asia
Ireland
GermanyLow Supply,Low productivity
High supply, High productivity
High demand – stimulus works
Weak demand - stimulus fails
Slide 7
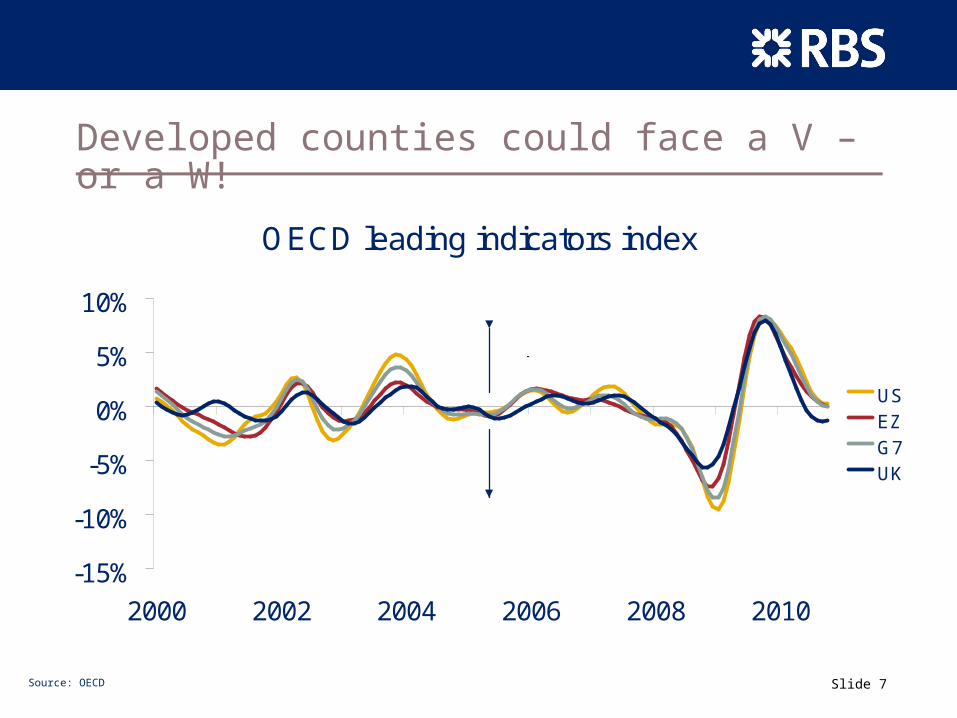
Developed counties could face a V – or a W!
OECD leading indicators index
-15%
-10%
-5%
0%
5%
10%
2000 2002 2004 2006 2008 2010
USEZG7
UK
Expansion
Contraction
Source: OECD
Slide 8
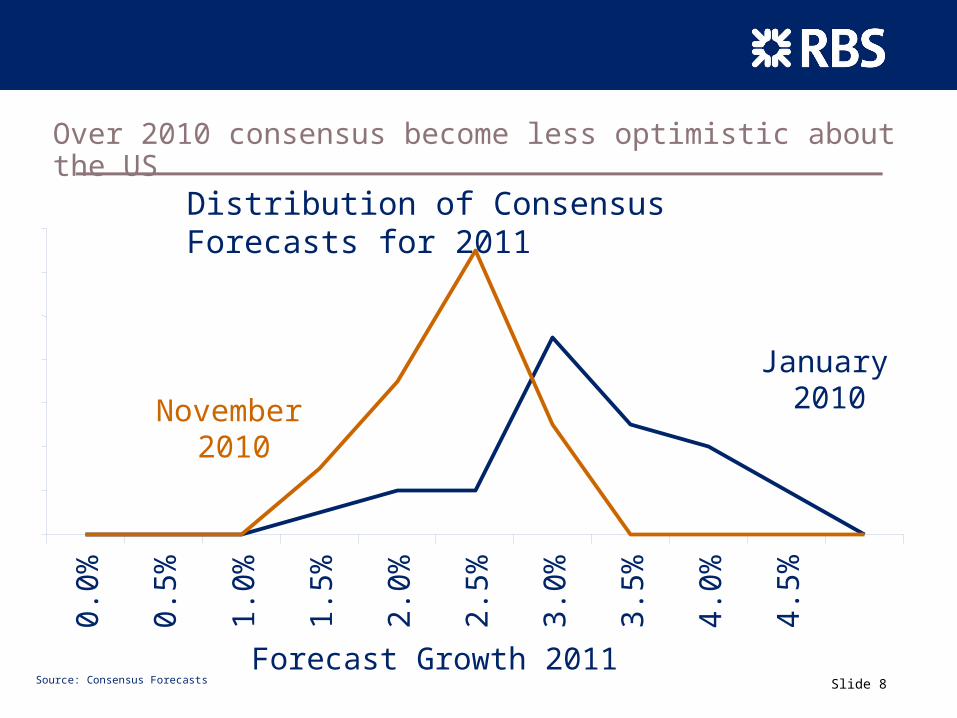
Over 2010 consensus become less optimistic about the US
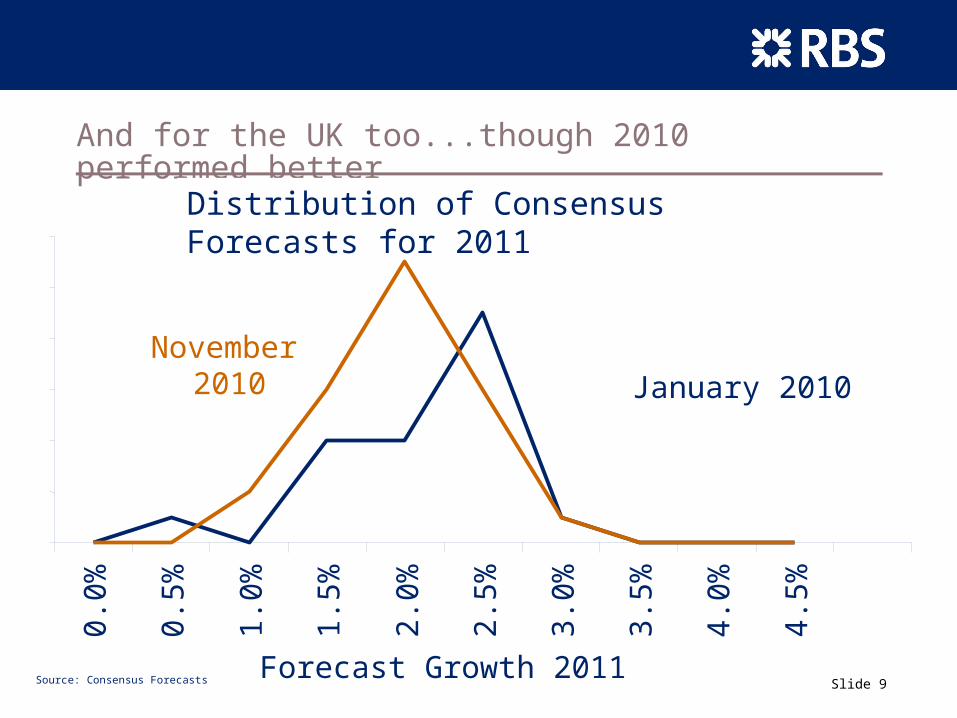
Distribution of Consensus Forecasts for 2011
Source: Consensus Forecasts
0.0
%
0.5
%
1.0
%
1.5
%
2.0
%
2.5
%
3.0
%
3.5
%
4.0
%
4.5
%
Forecast Growth 2011
January 2010November
2010
Slide 9
And for the UK too...though 2010 performed better
Source: Consensus Forecasts
Distribution of Consensus Forecasts for 2011
0.0
%
0.5
%
1.0
%
1.5
%
2.0
%
2.5
%
3.0
%
3.5
%
4.0
%
4.5
%
Forecast Growth 2011
January 2010November
2010
Slide 10
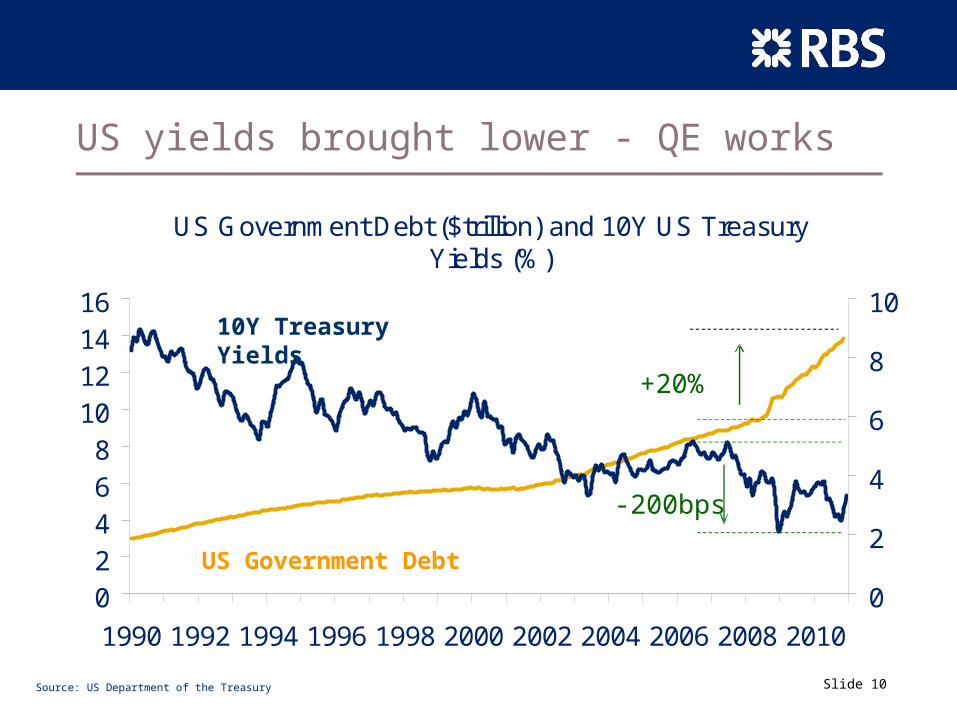
US yields brought lower - QE works
Source: US Department of the Treasury
US Government Debt ($trillion) and 10Y US Treasury Yields (%)
02468
10121416
1990 1992 1994 1996 1998 2000 2002 2004 2006 2008 2010
0
2
4
6
8
10
US Government Debt
10Y Treasury Yields
+20%
-200bps
Slide 11
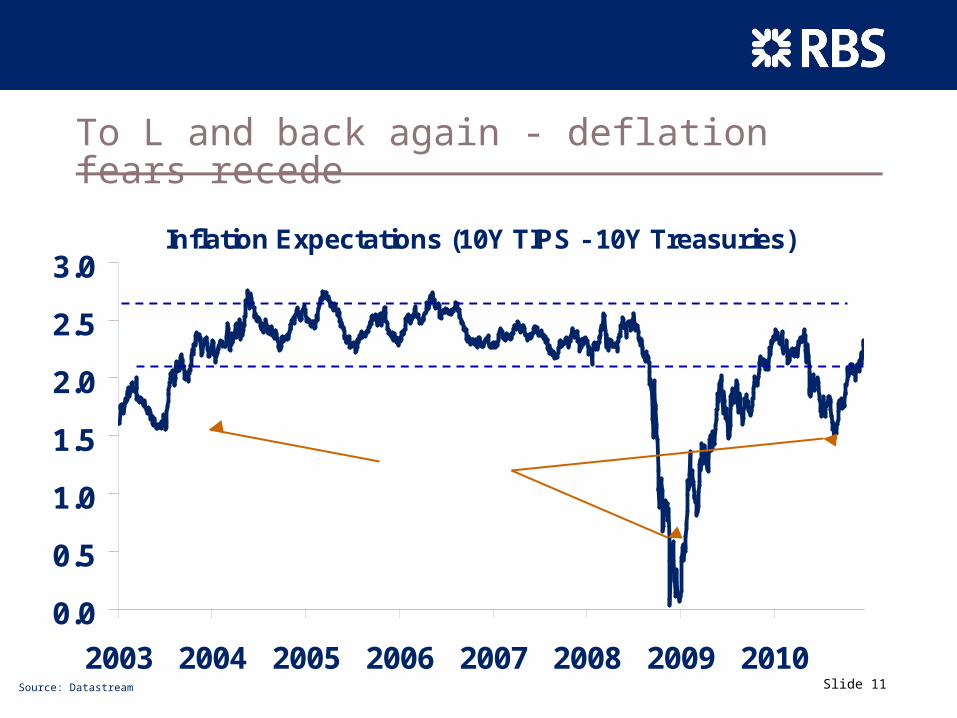
To L and back again - deflation fears recede
Source: Datastream
Inflation Expectations (10Y TIPS - 10Y Treasuries)
0.0
0.5
1.0
1.5
2.0
2.5
3.0
2003 2004 2005 2006 2007 2008 2009 2010
Deflation Scares
Slide 12
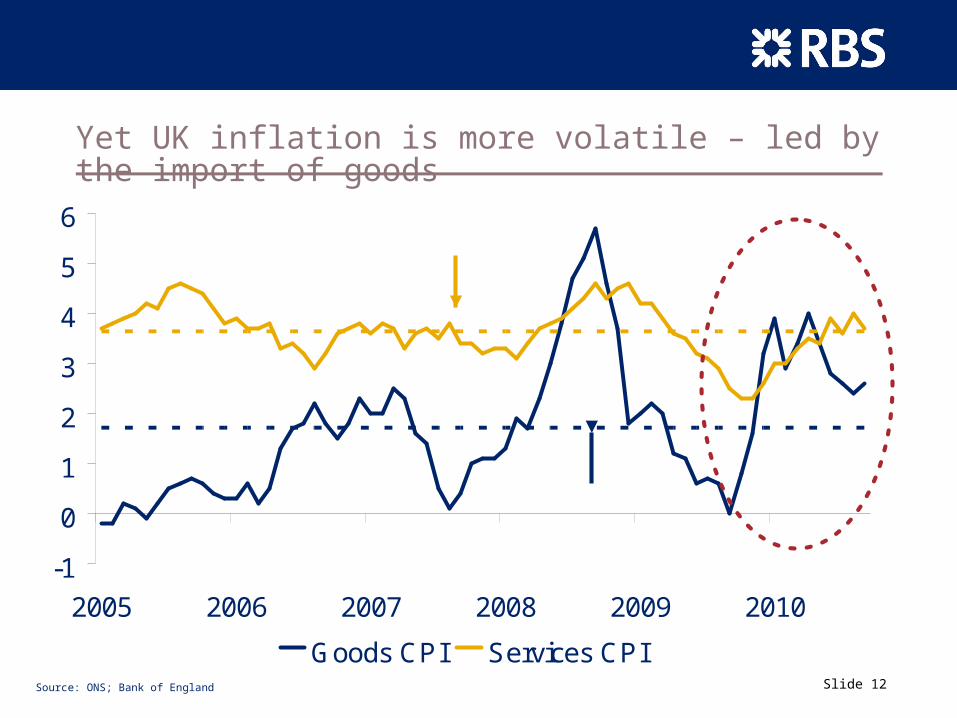
Yet UK inflation is more volatile – led by the import of goods
Source: ONS; Bank of England
-1
0
1
2
3
4
5
6
2005 2006 2007 2008 2009 2010
Goods CPI Services CPI
Average Goods CPI
Average Services CPI
Slide 13
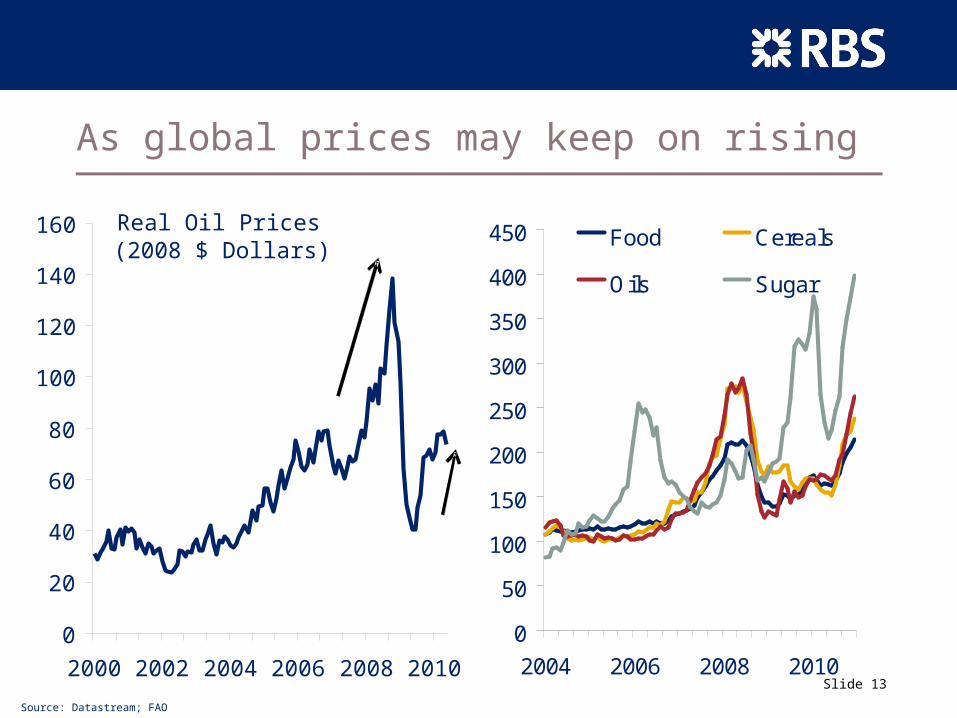
As global prices may keep on rising
0
50
100
150
200
250
300
350
400
450
2004 2006 2008 2010
Food Cereals
Oils Sugar
0
20
40
60
80
100
120
140
160
2000 2002 2004 2006 2008 2010
Real Oil Prices (2008 $ Dollars)
Source: Datastream; FAO
Slide 14
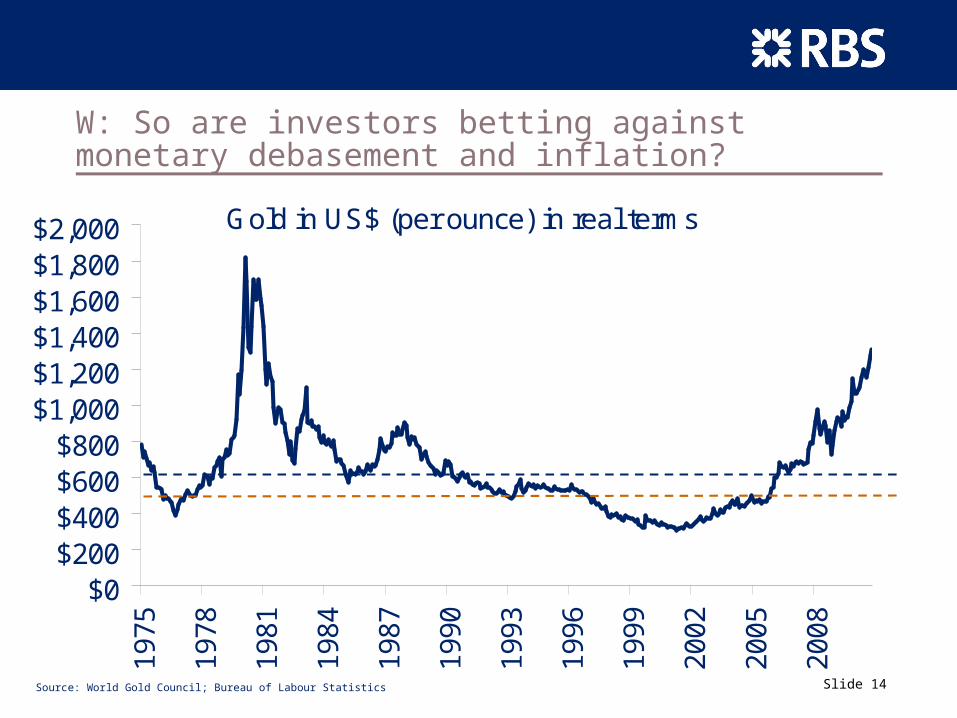
W: So are investors betting against monetary debasement and inflation?
Source: World Gold Council; Bureau of Labour Statistics
Gold in US$ (per ounce) in real terms
$0$200$400$600$800
$1,000$1,200$1,400$1,600$1,800$2,000
1975
1978
1981
1984
1987
1990
1993
1996
1999
2002
2005
2008
Average Price
Marginal cost
Slide 15
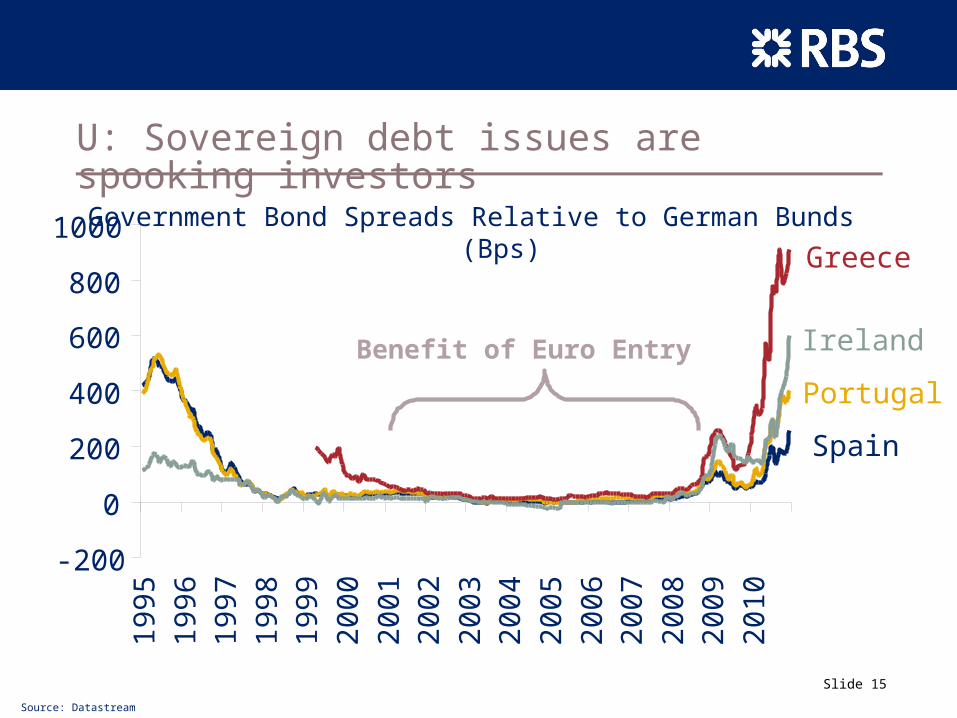
U: Sovereign debt issues are spooking investors
-200
0
200
400
600
800
1000
1995
1996
1997
1998
1999
2000
2001
2002
2003
2004
2005
2006
2007
2008
2009
2010
Greece
Ireland
Portugal
Spain
Government Bond Spreads Relative to German Bunds (Bps)
Benefit of Euro Entry
Source: Datastream
Slide 16Slide 16
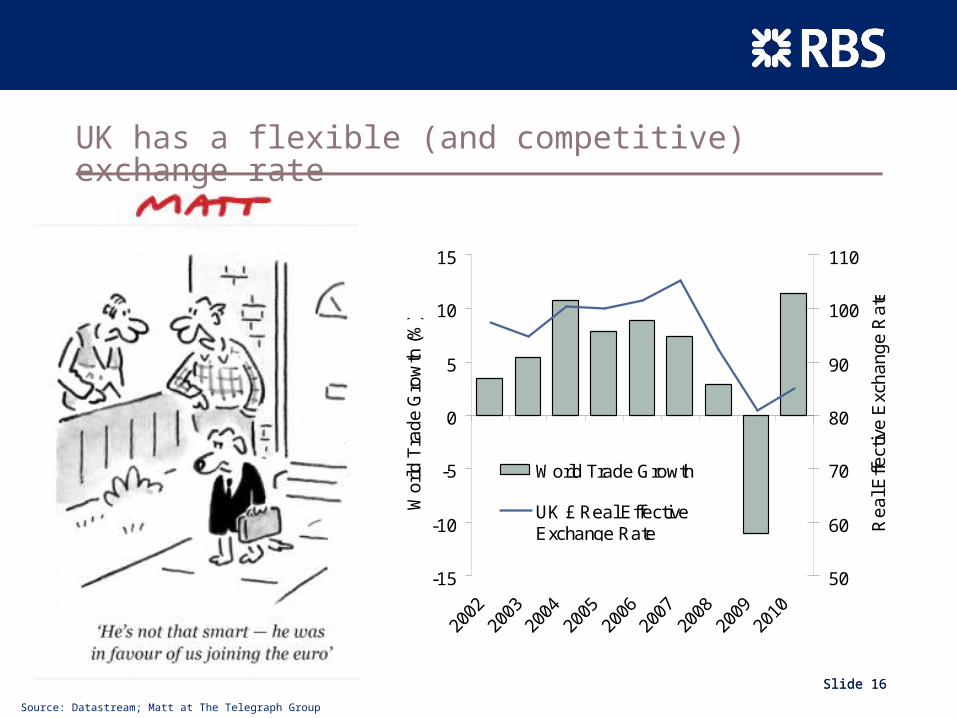
UK has a flexible (and competitive) exchange rate
-15
-10
-5
0
5
10
15
200
2 2
003
200
4 2
005
200
6 2
007
200
8 2
009
201
0
Wo
rld
Tra
de
Gro
wth
(%
)
50
60
70
80
90
100
110
Re
al E
ffect
ive
Exc
ha
ng
e R
ate
World Trade Growth
UK £ Real EffectiveExchange Rate
Source: Datastream; Matt at The Telegraph Group
Slide 17
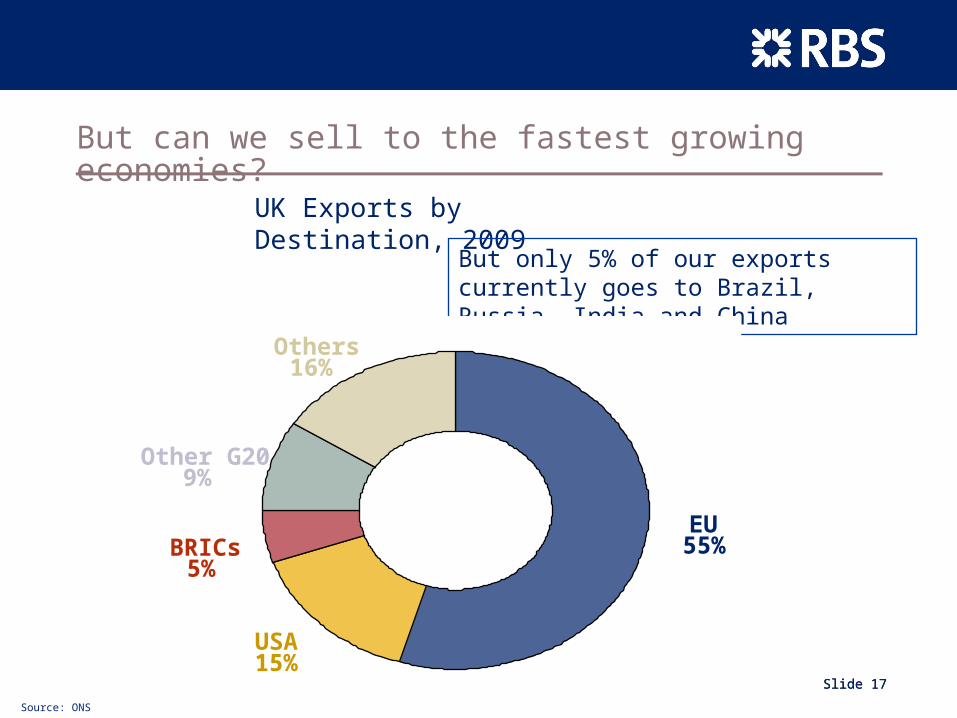
But can we sell to the fastest growing economies?
Slide 17
UK Exports by Destination, 2009
But only 5% of our exports currently goes to Brazil, Russia, India and China
EU55%
Others16%
USA15%
BRICs5%
Other G209%
Source: ONS
Slide 18
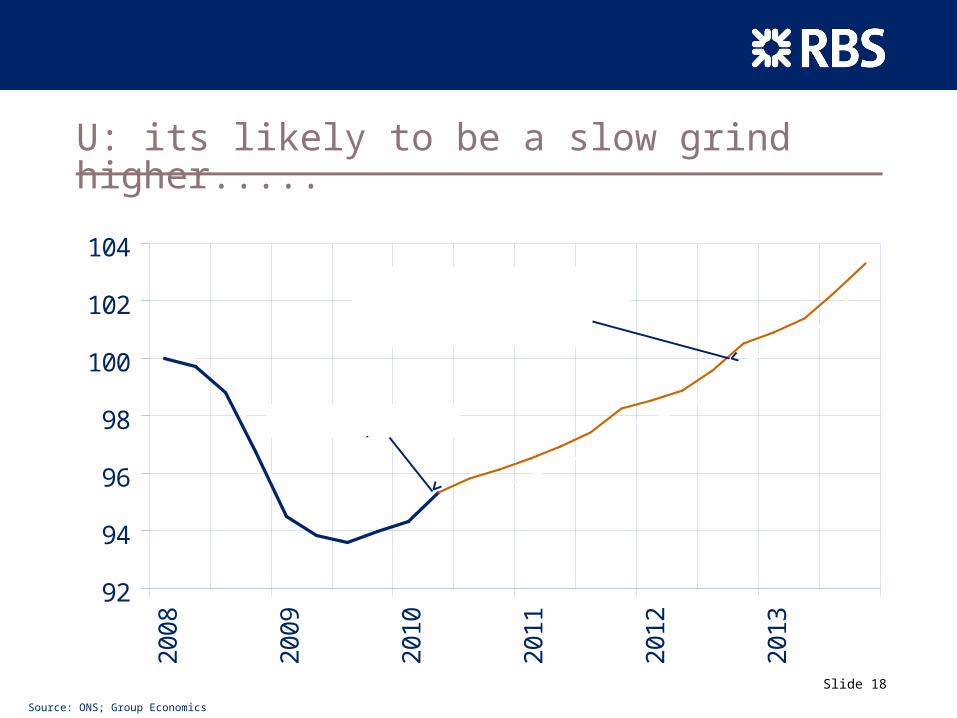
U: its likely to be a slow grind higher.....
92
94
96
98
100
102
104
20
08
20
09
20
10
20
11
20
12
20
13
UK Economic Output (Index Start of Recession Q1 2008 = 100)
Current position
3 Years to make up the ground we've lost
Source: ONS; Group Economics
Slide 19
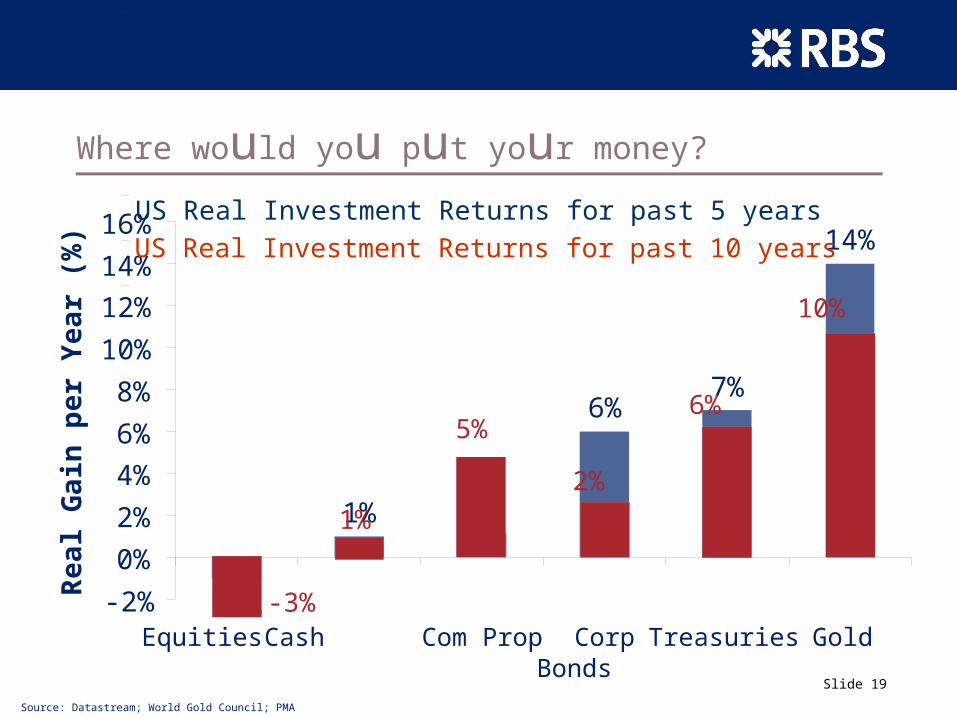
Where would you put your money?
-1%
1% 1%
6%7%
14%
-2%
0%
2%
4%
6%
8%
10%
12%
14%
16%
Equities Cash Com Prop CorpBonds
Treasuries Gold
Rea
l G
ain
per
Yea
r (%
)
US Real Investment Returns for past 5 years
-3%
1%
5%
2%
6%
10%
US Real Investment Returns for past 10 years
Source: Datastream; World Gold Council; PMA
Slide 20
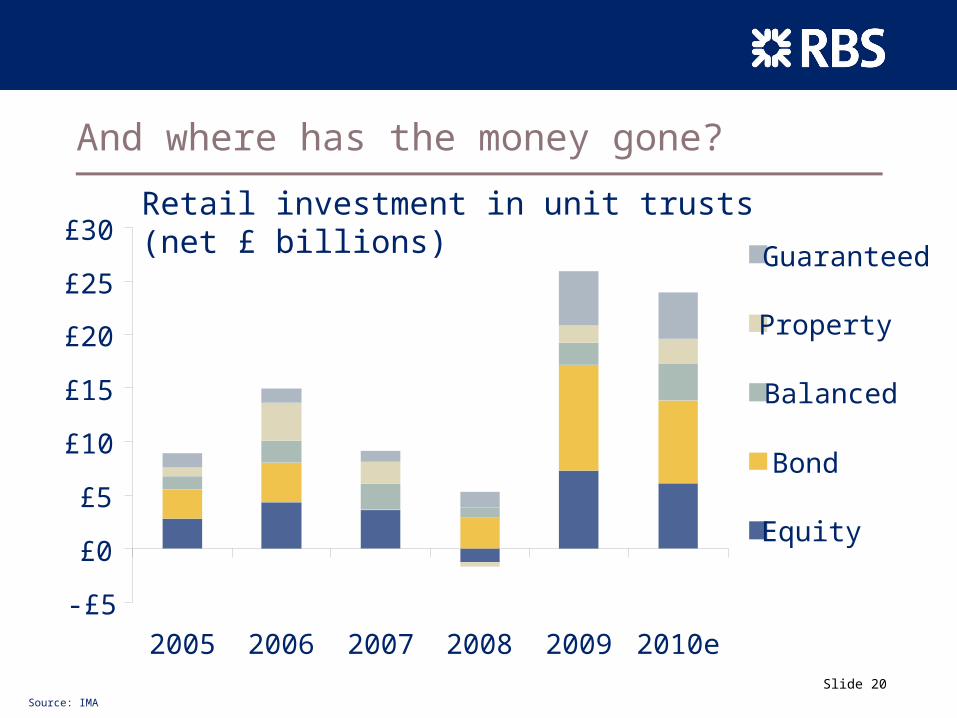
And where has the money gone?
Source: IMA
-£5
£0
£5
£10
£15
£20
£25
£30
2005 2006 2007 2008 2009 2010e
Guaranteed
Property
Balanced
Bond
Equity
Retail investment in unit trusts (net £ billions)

Slide 21
Thank You and Questions
Slide 22
Legal disclaimer
This material is published by The Royal Bank of Scotland plc (“RBS”) which is authorised and regulated by the Financial Services Authority for the conduct of regulated activities in the UK. It has been prepared for information purposes only and does not constitute a solicitation or an offer to buy or sell any securities, related investments, other financial instruments or related derivatives (“Securities”). It should not be reproduced or disclosed to any other person, without our prior consent.
This material is not intended for distribution in any jurisdiction in which its distribution would be prohibited.
Whilst this information is believed to be reliable, it has not been independently verified by RBS and RBS makes no representation, express or implied, nor does it accept any responsibility or liability of any kind, with regard to the accuracy or completeness of this information. Unless otherwise stated, any views, opinions, forecasts, valuations, or estimates contained in this material are those solely of the RBS Group’s Group Economics Department, as of the date of publication of this material and are subject to change without notice. Recipients of this material should make their own independent evaluation of this information and make such other investigations as they consider necessary (including obtaining independent financial advice), before acting in reliance on this information.
This material should not be regarded as providing any specific advice. RBS accepts no obligation to provide any advice or recommendations in respect of the information contained in this material and accepts no fiduciary duties to the recipient in relation to this information.
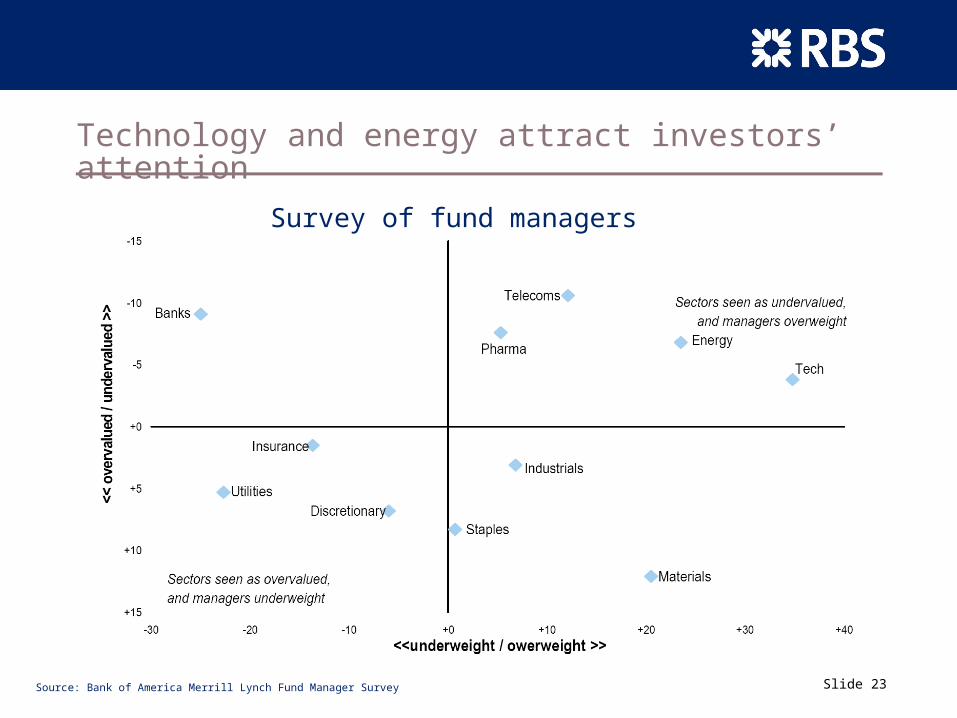
Slide 23
Technology and energy attract investors’ attention
Survey of fund managers
Source: Bank of America Merrill Lynch Fund Manager Survey


