What's the deal with the left fusiform activity during reading positively correlated with phonological awareness in lower-SES children but not in higher-SES children? Most of the study attributes low-SES to negative attributies of neurocognitive systems. Is this an exception of a "positive" attribute to lower-SES?
Transcript
What's the deal with the left fusiform activity during reading positively correlated with phonological awareness in lower-SES children but not in higher-SES children?
Most of the study attributes low-SES to negative attributies of neurocognitive systems. Is this an exception of a "positive" attribute to lower-SES?
Hypothesis?
They described studies in humans that show that SES influences cognitive and affective function in children, adolescents and young adults.
Then, they discussed studies in human populations that have identified possible mediators of the effects of SES, and reviewed research in animals in which these factors were directly manipulated to assess their effect on offspring outcomes.
Socioeconomic status (SES), a measure of one’s overall status and position in society, strongly influences an individual’s experiences from childhood and through adult life.
Methods? But it’s a review
Distribution of genes associated with Diabetes respect to SES in cases and controls.
SES and neurocognitive systems:Prefrontal Activity in response to a Surprising Stimulus
Varies According to Socioeconomic Status.
Socioeconomic status predicts hemispheric specialization of the left inferior frontal gyrus in young children
Causation, correlation or association?
Disentangling cause and effect
2 non-mutually exclusive hypotheses:
• Social causation: The experiences that are typical of different levels of SES affect brain development. (More evidence: twins studies,)
• Social selection: Differences in brain functioning predispose people to a particular level of socioeconomic success and, therefore, to a particular SES (squizofrenia).
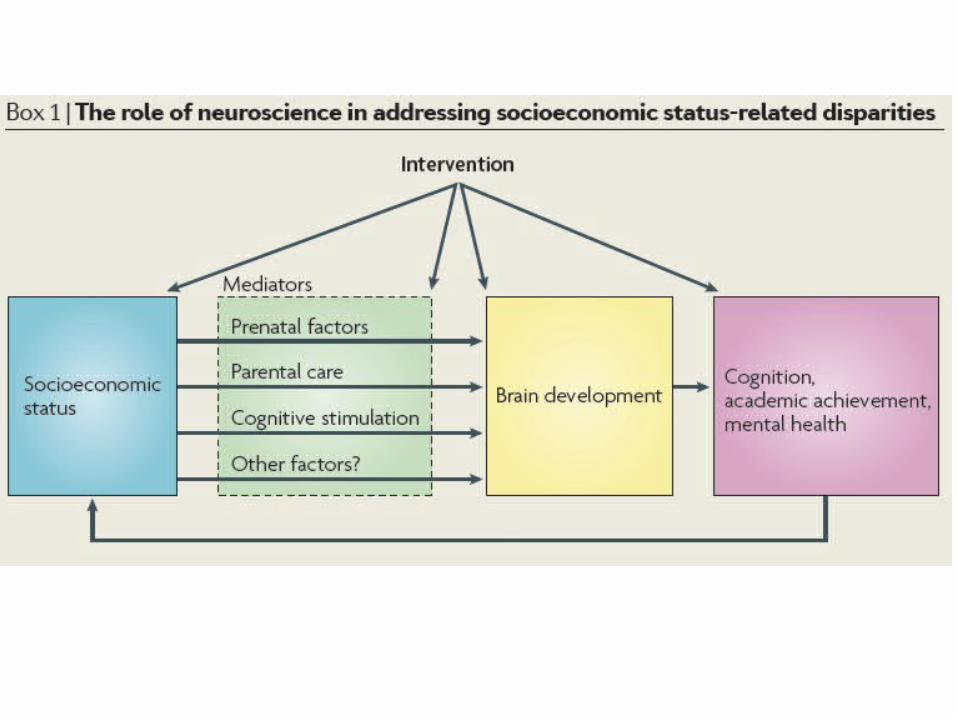
Candidate mechanisms of SES effects
Prenatal influences
Low SES is associated with higher levels of stress, higher infection rates and poor nutrition during pregnancy.
Higher levels of corticotropin-releasing factor (CRF) and glucocorticoids in both the mother and the fetus.
In rodents, pre- or peri-natal glucocorticoid administration to pregnant females reduces brain weight at birth, inhibits neurogenesis and delays neuronal maturation, myelination, gliogenesis and synapse formation.
There is evidence in rodents that prenatal influences on hypothalamus–pituitary–adrenal (HPA) axis activity can be transmitted across generations in an epigenetic manner
Parental care
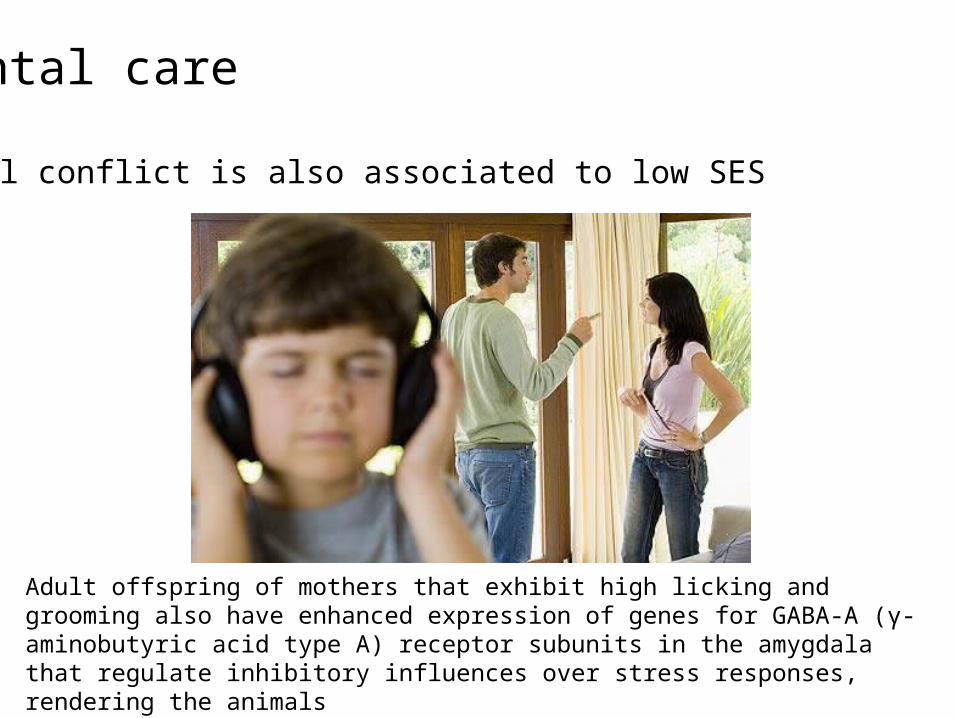
Familial conflict is also associated to low SES
Adult offspring of mothers that exhibit high licking and grooming also have enhanced expression of genes for GABA-A (γ-aminobutyric acid type A) receptor subunits in the amygdala that regulate inhibitory influences over stress responses, rendering the animalsless fearful.
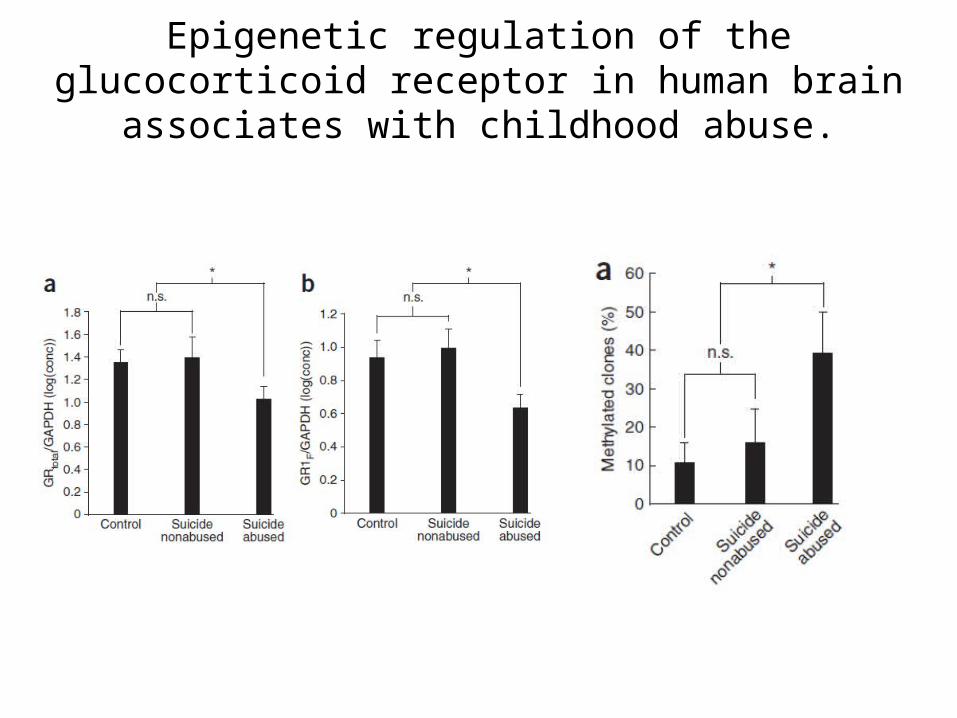
Epigenetic regulation of the glucocorticoid receptor in human brain associates with childhood abuse.
The home environment: cognitive stimulation
“FOR some time now, if you asked architects and urban planners for proof of the power of public architecture and public space to remake the fortunes of a city, they’d point here…”
http://www.nytimes.com/2012/05/20/arts/design/fighting-crime-with-architecture-in-medellin-colombia.html?_r=0(Medellin: Fighting crime with architecture)From the New York Times
“Obviously it’s not just that we built and renovated schools,” he said. “You have to work on the quality of teaching and nutrition in conjunction with architecture.