28
WhatScotlandThinks. org Combining and visualising attitudinal data relating to Scottish independence ASC September 2013
| Date post: | 16-Dec-2015 |
| Category: |
Documents |
| Upload: | marvin-goodman |
| View: | 223 times |
| Download: | 0 times |
WhatScotlandThinks.orgCombining and visualising attitudinal data relating to Scottish independence
ASC September 2013
2
Purpose of WhatScotlandThinks.org
WhatScotlandThinks.org is the ‘go to’ place for accessible data on attitudes to Scotland’s constitutional future
Impartial analysis from Professor John Curtice and guest bloggers
Key audience journalists, bloggers and academics
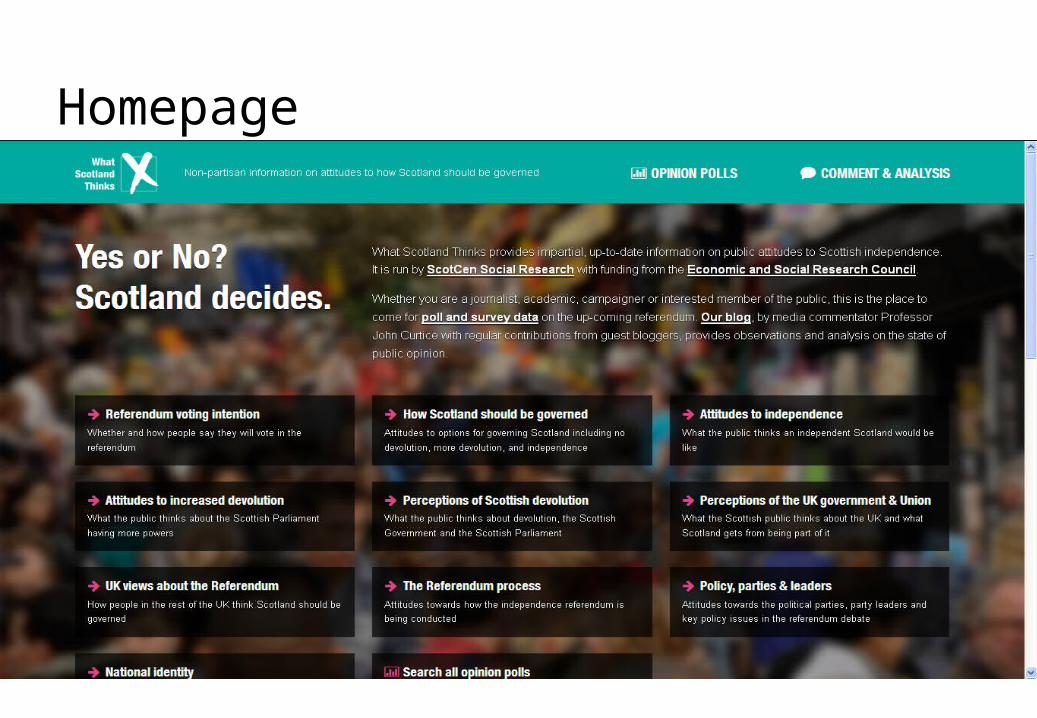
Homepage
4
Challenges of commissioning the website
Two main challenges we will cover today Bringing together data from different sources
and in different formats Presenting it in a way that is easy to
understand and encourages user explorationOther aspects of the site
Many challenges for website agency Storm ID but not the focus of this presentation
Impartial blog with user comments on highly contentious issue but also not the focus today
Introducing the data
6
Poll data
Collating all Scottish polls from 2007 to the present that ask about: Scottish independence Devolution Opinion on parties and leaders Relevant policy issues (e.g. trident, tuition fees) National identity
Some UK and England only data tooJust topline percentages – not individual level
data
7
Showing change over time
Most tables by polling companies contain figures without reference to previous findings
In contrast, our Content Management System (CMS) is designed to make links between figures from different polls – even by different companies - that ask the same question
This has raised the issue of how similar two polling questions must be to before data is merged
8
Phase one development by Storm ID
This included poll data management, content management system and search facility
Storm SDK In house SDK for developing applications, uses C# and a
range of open source software such as NHibernate, Castle Windsor, AutoMapper as well as some Microsoft frameworks like ASP.NET Mvc.
SQL Server 2008
Highcharts for data visualisation
Lucene.NET for text search engine.
9
Scottish Social Attitudes Survey Started in 1999 Carried out annually Sample of 1200 to 1500 respondents each year Interview one adult (over 18) per address Modular structure with many modules repeated
over the years Major source of data on change in attitudes over
time in Scotland All data available through UKDS, widely used by
academics

10
SSA datafiles
Data created in SPSS and held as individual years files
SPSS datasets accompanied by a lot of documentation files
We need to condense this information (metadata) so that users can select the questions they are interested in

11
SSA combined dataset Puts together data from 1999 to 2012
Contains questions relating to constitutional change in Scotland and demographics (125 variables)
Resulting dataset contains the opinions of 19,614 people
Web users will be search for questions and produce their own cross-tabulations, see them as charts and downoad the tables
12
Creating combined dataset
Anticipated challenges in combining data due to change over time
Would changes to questions mean changing data?
Would SPSS files transfer to another system? What about weighting?
13
Change over time
Researchers are careful to ensure consistency of questions across the years and document changes
Within datasets we try to ensure consistency with variable naming, major change in question=new variable name
Combining years should be no problem ……
14
Labels in SPSS
Earlier version of SPSS limited labelling capabilities so datasets are not self-explanatory
‘Creative’ use of those limited number leads to cryptic labels
“Con.pty in Scotland look aft.Scots?Q2.1d” [2001]
Documentation files had full questions
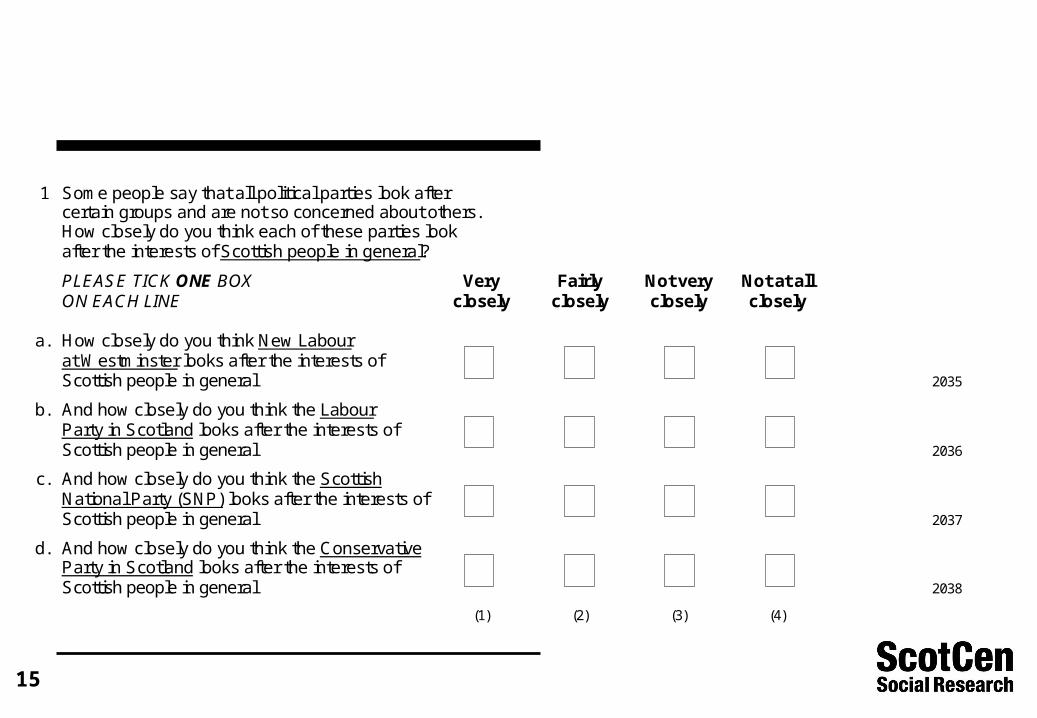
15
1 Some people say that all political parties look after certain groups and are not so concerned about others. How closely do you think each of these parties look after the interests of Scottish people in general?
PLEASE TICK ONE BOX Very Fairly Not very Not at all ON EACH LINE closely closely closely closely a. How closely do you think New Labour at Westminster looks after the interests of Scottish people in general 2035
b. And how closely do you think the Labour Party in Scotland looks after the interests of Scottish people in general 2036
c. And how closely do you think the Scottish National Party (SNP) looks after the interests of Scottish people in general 2037
d. And how closely do you think the Conservative Party in Scotland looks after the interests of Scottish people in general 2038
(1) (2) (3) (4)
16
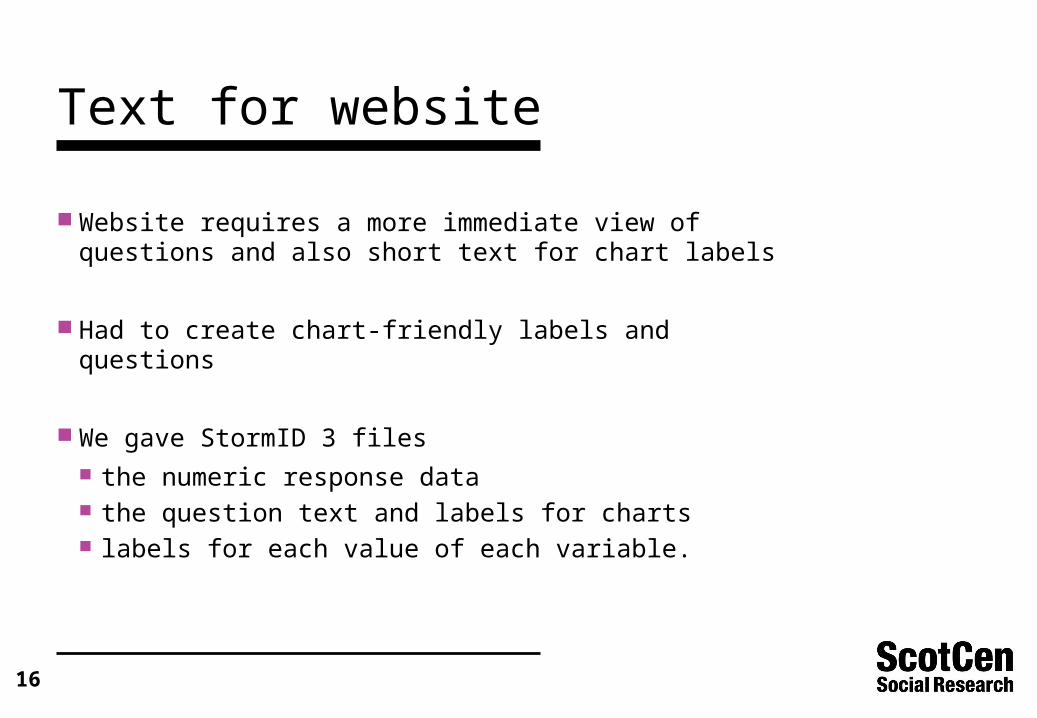
Text for website
Website requires a more immediate view of questions and also short text for chart labels
Had to create chart-friendly labels and questions
We gave StormID 3 files the numeric response data the question text and labels for charts labels for each value of each variable.

17
Phase two development by Storm ID
Incorporation of Scottish Social Attitudes individual level data including crosstabs functionality
MongoDB Developers at Storm ID chose not to use SQL
server as schema got in the way and normalising the data was causing huge performance issues
Presenting two types of data online

19
Bringing the two types of data together
Suggestion from Storm ID that topline data and SSA were not different from user perspective
Search will bring up time series for all questions, irrespective of data type
In development: under each SSA graph, user is presented with options to crosstab this variable with 120 other SSA variables
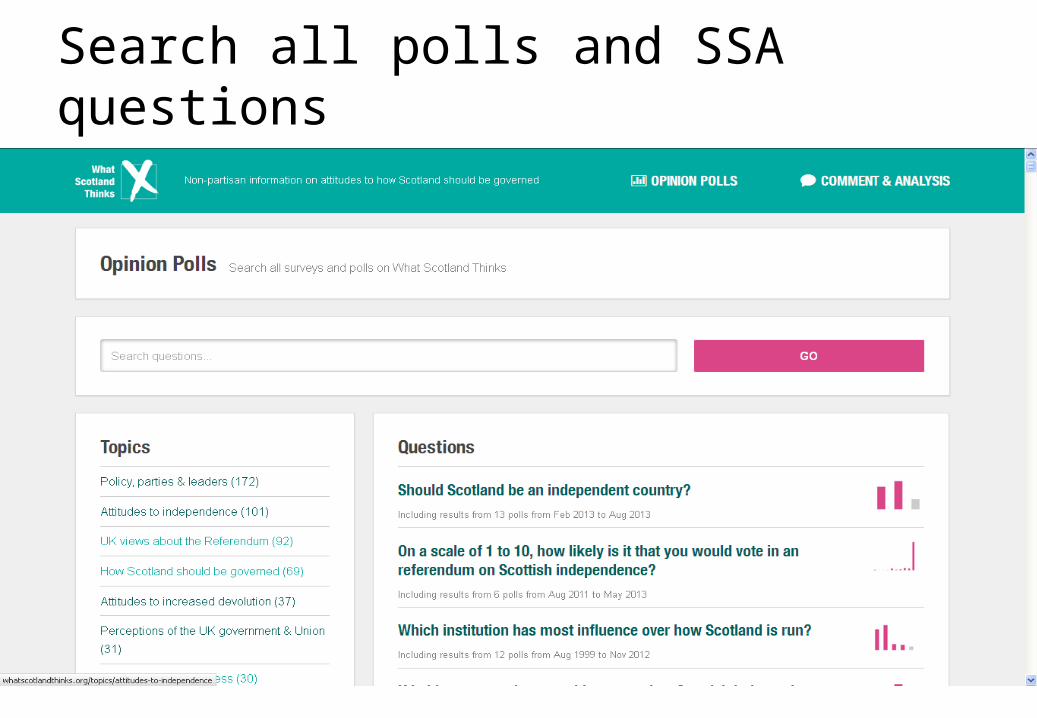
Search all polls and SSA questions
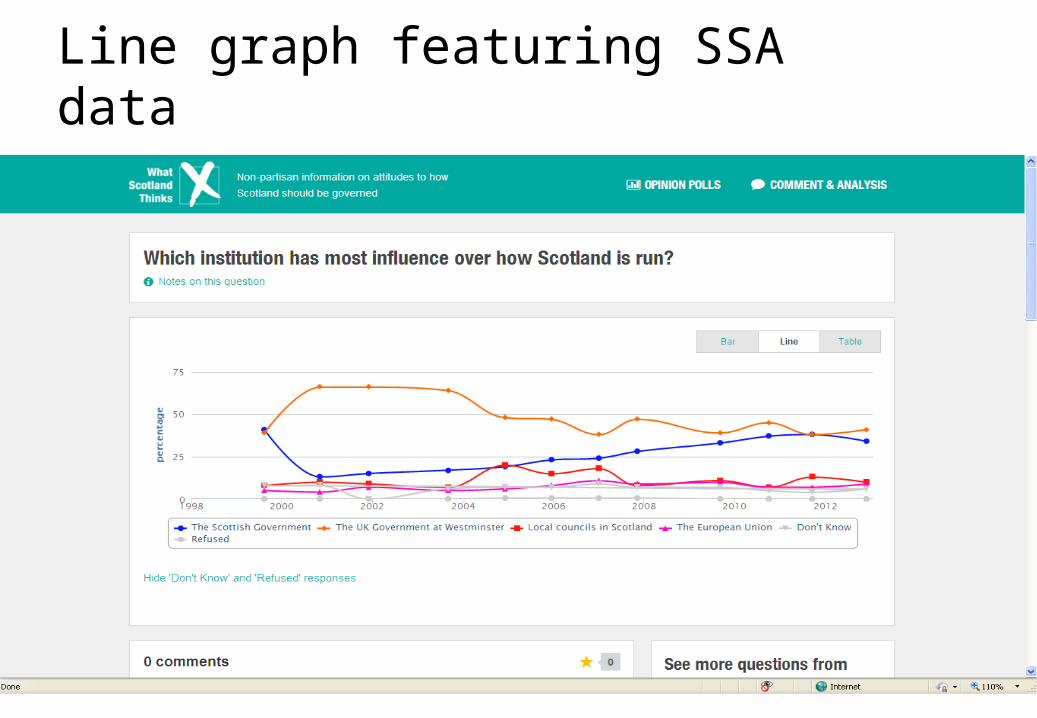
Line graph featuring SSA data
22
Visualising the data
Tried to keep it simple, in line with what we were told in user workshop
Bar chart and table of figures available for every question
Line graph for question asked that has been asked more than once
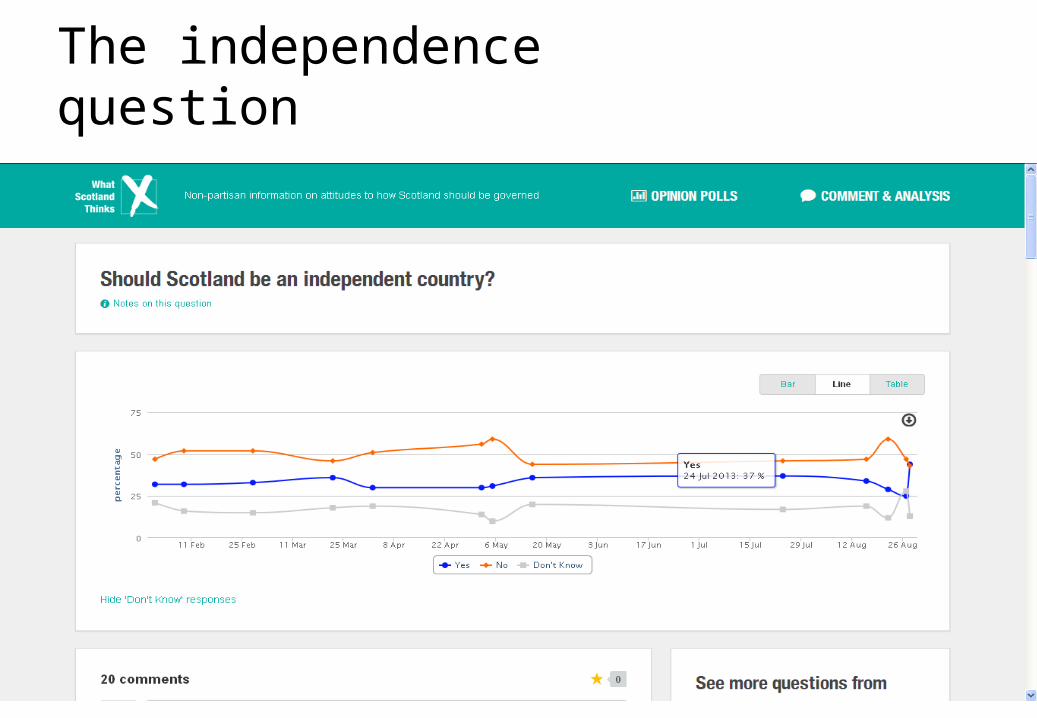
The independence question

24
Topic headings
Some users may find it hard to know where to start searching such a huge amount of data
Solution to break up questions into 10 topics
Topic pages feature introductory content, an example graph and popular questions
Topic tagging also helps make links between blog posts and relevant data

Topic landing page
26
Putting data online and opening up the debate
Combination of accessible data and blog which covers methodological issues has already sparked lively debate in comments section
Graphs and other content have been reproduced and used by newspaper journalists, bloggers and on Newsnight Scotland
Website provides one model of how data can be made more accessible
27
Looking ahead…
Project has obtained ESRC funding for 2014
Focus will inevitably change following the referendum in September next year, irrespective of whether it’s a ‘yes’ or ‘no’ vote
No fixed plans but it is likely we will be looking to make more NatCen survey data available online in future
Thank youJoan Corbett
Data Manager
Annie Wild
Researcher
www.scotcen.org.uk
WhatScotlandThinks.org


