35
WhatsUp ® Gold Evaluation Guide

WhatsUp® Gold Evaluation Guide
2
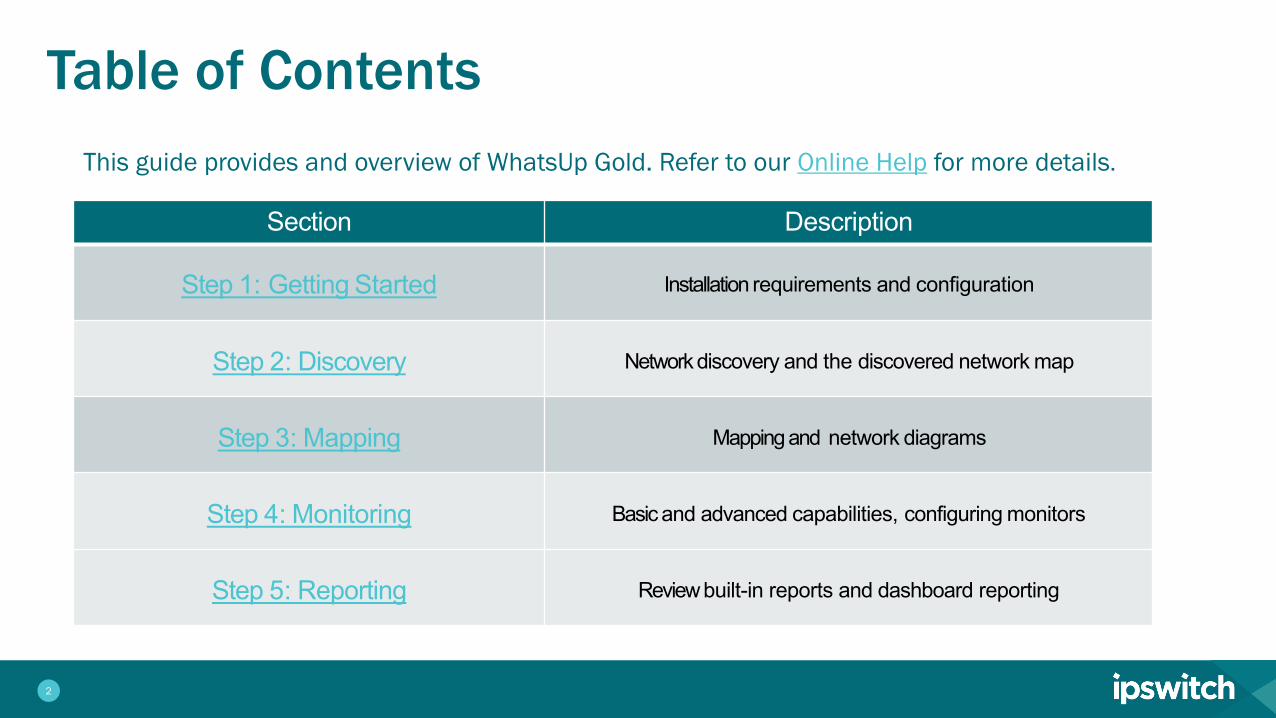
This guide provides and overview of WhatsUp Gold. Refer to our Online Help for more details.
Table of Contents
Section Description
Step 1: Getting Started Installation requirements and configuration
Step 2: Discovery Network discovery and the discovered network map
Step 3: Mapping Mapping and network diagrams
Step 4: Monitoring Basic and advanced capabilities, configuring monitors
Step 5: Reporting Review built-in reports and dashboard reporting

3
Getting Started❯ Prior to installation
• Consult the release notes to ensure your system meets the minimum requirements. If you plan on discovering over 500 devices.
❯ Have Credentials Ready• WhatsUp Gold requires credentials to get the most information out of the devices on
the network. Be sure your devices are configured correctly and you have proper access prior to running a discovery. See the credentials section for more details.
❯ Review additional resources• Our Online Help section provides additional detail on setup and configuration
• Our Ipswitch Community provides questions, answers and scripts

4
DiscoveryDiscovery
New Scan Settings
New Scan Credentials
New Scan Schedule
Discovered Network Map
Filter Devices
Hide Devices
Device Roles

5
Discovery: New Scan Settings❯ Launch a new discovery
• From the main page, select Discover > New Scan
❯ Determine discovery scope• You can discover Individual IPs, ranges, or subnets with the IP
range scan. The Seed discovery relies on SNMP to find connected devices. You can select a discovery depth with this method (to discover neighbors of neighboring devices)
❯ Provide discovery limits• Be sure to limit the discovery. Consider limiting it to private
networks, or set a maximum number of discovered devices
❯ Review advanced settings• Set your data collection settings accordingly. If you are
discovering wireless or virtualization environments, be sure those are selected. To have the discovery complete faster, you can increase the maximum thread count.
Discovery Video
6
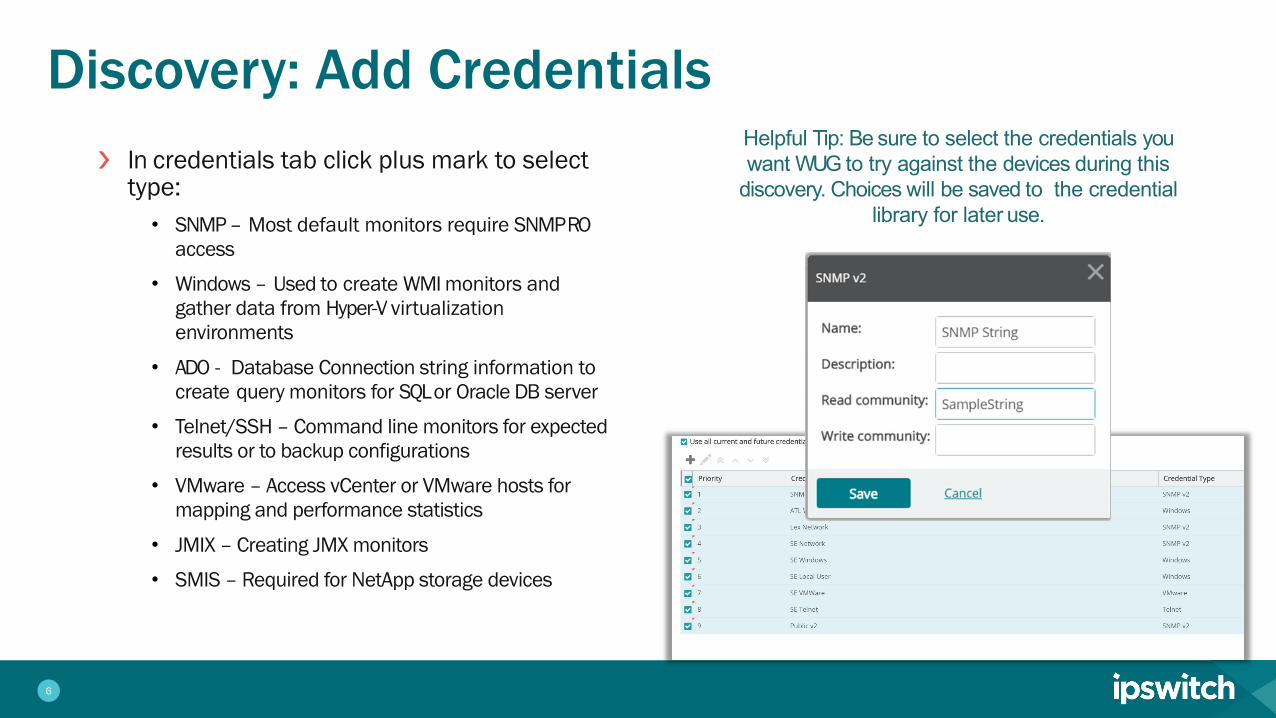
Discovery: Add Credentials❯ In credentials tab click plus mark to select
type:• SNMP – Most default monitors require SNMPRO
access
• Windows – Used to create WMI monitors and gather data from Hyper-V virtualizationenvironments
• ADO - Database Connection string information to create query monitors for SQL or Oracle DB server
• Telnet/SSH – Command line monitors for expected results or to backup configurations
• VMware – Access vCenter or VMware hosts for mapping and performance statistics
• JMIX – Creating JMX monitors
• SMIS – Required for NetApp storage devices
Helpful Tip: Be sure to select the credentials you want WUG to try against the devices during this
discovery. Choices will be saved to the credential library for later use.

7
Discovery: Scan Schedule❯ Regularly scheduled discoveries
• Schedule discoveries to occur on a regular basis to refresh monitors or find new devices on the network.
• Prior to selecting this option be sure to double check your scan settings
• Check off ‘schedule’ to reveal discovery schedule options. Consider running scheduled discoveries during non-peak business hours.
• You can also setup notifications when the discovery finds new devices
❯ Unscheduled discoveries• You can also run ad hoc discoveries
• The summary tab provides details about the discovery you are about to run. When you are ready, select “run” to kick it off.
Helpful Tip: You can schedule multiple discovery scans at different intervals for different subnets

8
Discovery: Discovered Network Map❯ Discovery results
• If the Role appears as “device” no credentials worked against it. Check for credential typos or bad device configurations. Rediscovery with working credentials will correct classification
❯ Add monitoring to devices• Choose a single unmonitored device or use the
‘selector tool’ to chose multiple unmonitored devices
• Select ‘start monitoring’ (top right)
• Confirm ‘Start/Update’ monitoring by selecting Start
Helpful Tip: WhatsUp Gold has built-in device roles that apply monitors based on device type. The
device role will only apply a ping monitor to unclassified devices. Be sure that your devices are
classified correctly before monitoring them

9
Discovery: Device Filters❯ Use Filters to group devices
• Filters provide an easy way to group devices by criteria. The devices that do not fit the criteria will be greyed out and are unable to be selected
• Choose a filter and use the selector tool to begin monitoring selected devices
Examples: Use the Roles Filter to select all devices with device role of switch. Use the credential filter to select all SNMP devices. Use the scan time filter to
select recently discovered devices.

10
Discovery: Hiding Devices❯ When and how to hide devices
• Hidden devices are removed from the discovered network map
• Once hidden they are not added back to the discovered map on subsequent discoveries.
• Consider hiding devices that you do not wantmonitored. workstations or printers.
• Click on a device on the map to hide it. Select ‘Hide’ from the Device Card that pops up.
• Select “Hidden Devices” from the icon on the top left of screen to validate selection
Helpful Tip: Take advantage of the selector tool and Filters to hide devices in bulk. Many users will hide Role: Device or
Credentials Types: None.
11
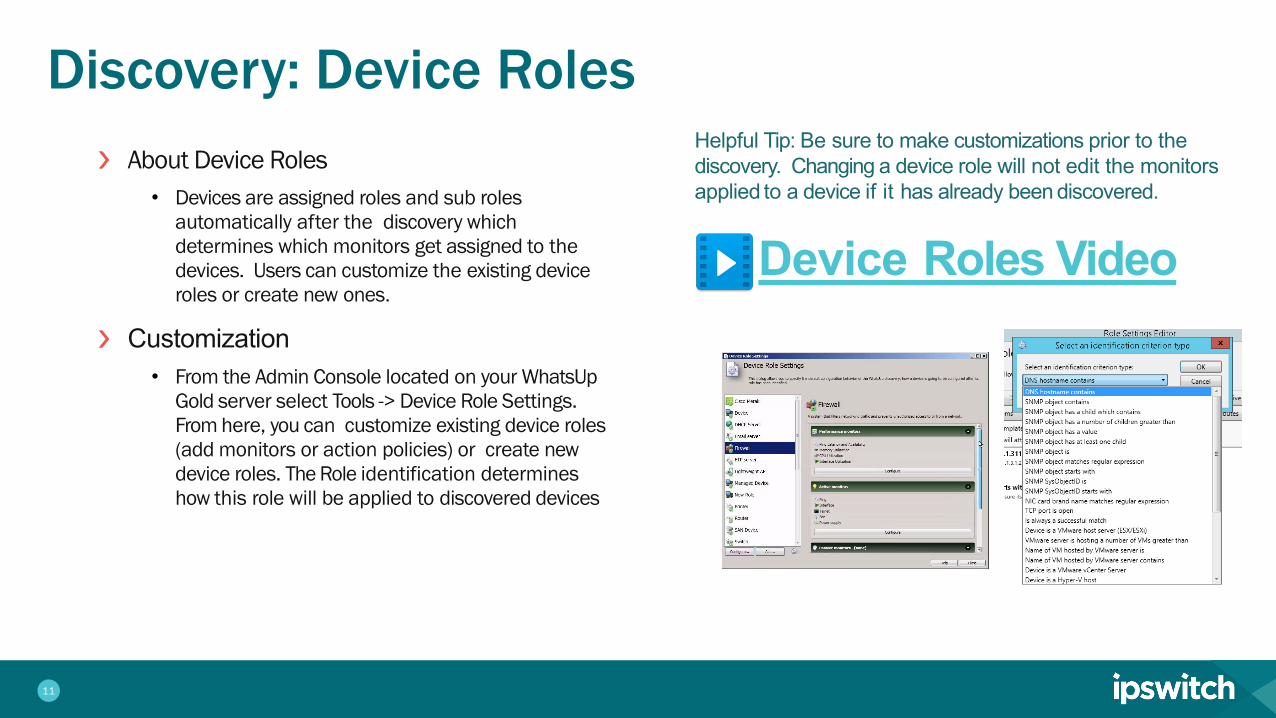
Discovery: Device Roles❯ About Device Roles
• Devices are assigned roles and sub roles automatically after the discovery which determines which monitors get assigned to the devices. Users can customize the existing device roles or create new ones.
❯ Customization • From the Admin Console located on your WhatsUp
Gold server select Tools -> Device Role Settings. From here, you can customize existing device roles (add monitors or action policies) or create new device roles. The Role identification determines how this role will be applied to discovered devices
Helpful Tip: Be sure to make customizations prior to the discovery. Changing a device role will not edit the monitors applied to a device if it has already been discovered.
• Device Roles Video
12
Mapping
Mapping
Monitored Network Map
Device Groups
Customizing Maps
Device Dependencies

13
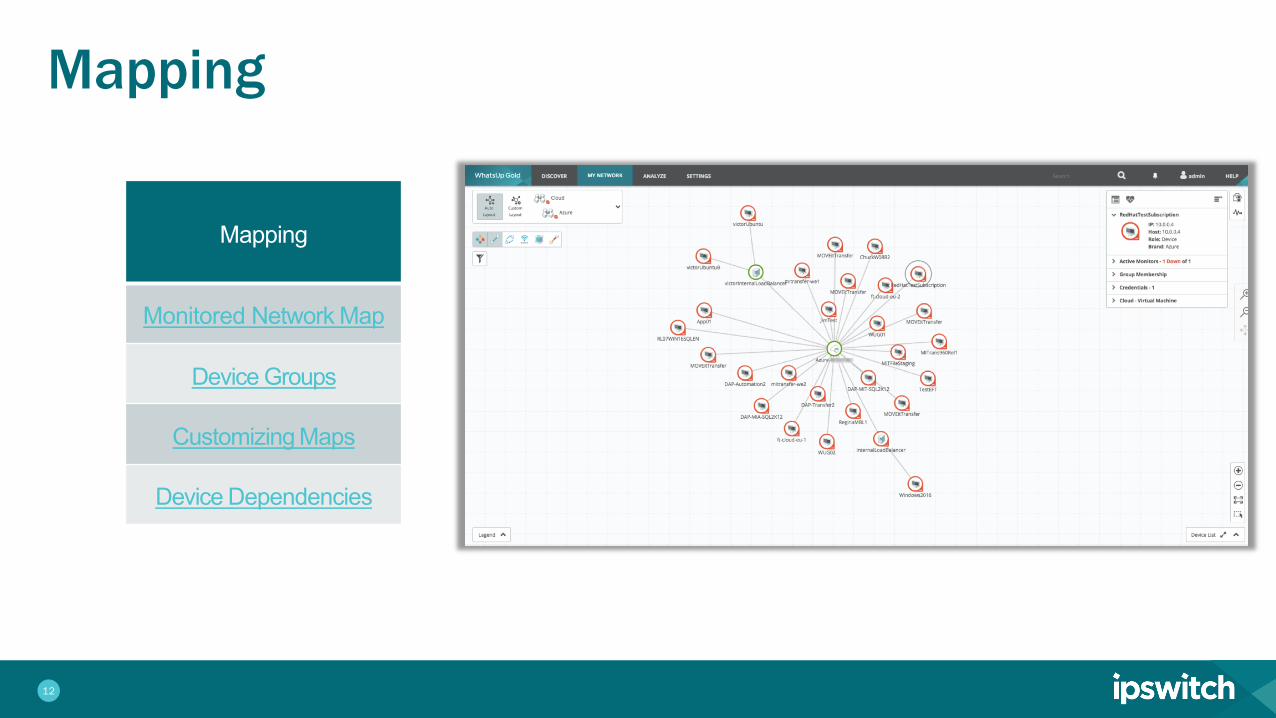
Mapping: Monitored Network Map❯ About the Map
• After adding monitoring to devices from the discovered map they appear on the “My Network”tab.
❯ Navigation• Selecting a device on the map reveals its device
card from which you can 1) assign credentials, 2) navigate to device properties, 3) review status and 4) navigate to the monitor setup page
❯ Overlays• Map overlays add additional information to the
network map. Overlays exist for connectivity, dependencies, link status and utilization, wireless networks and virtual machine and host relationships
Helpful Tip: The majority of tasks can be initiated directly from the map itself. If list view is preferred, you can click the list view button on the bottom right of the map..
Topology Video
14
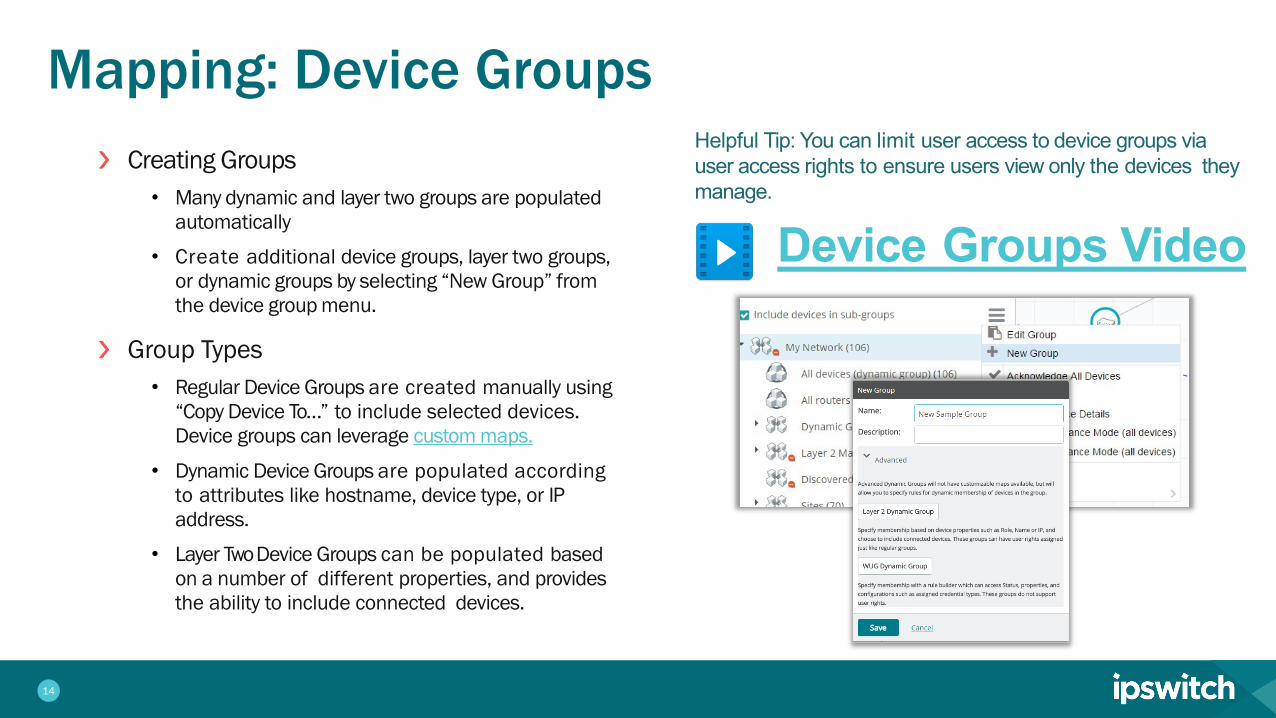
Mapping: Device Groups❯ Creating Groups
• Many dynamic and layer two groups are populated automatically
• Create additional device groups, layer two groups, or dynamic groups by selecting “New Group” fromthe device group menu.
❯ Group Types• Regular Device Groups are created manually using
“Copy Device To…” to include selected devices. Device groups can leverage custom maps.
• Dynamic Device Groups are populated according to attributes like hostname, device type, or IPaddress.
• Layer Two Device Groups can be populated based on a number of different properties, and provides the ability to include connected devices.
Helpful Tip: You can limit user access to device groups via user access rights to ensure users view only the devices theymanage.
Device Groups Video
15
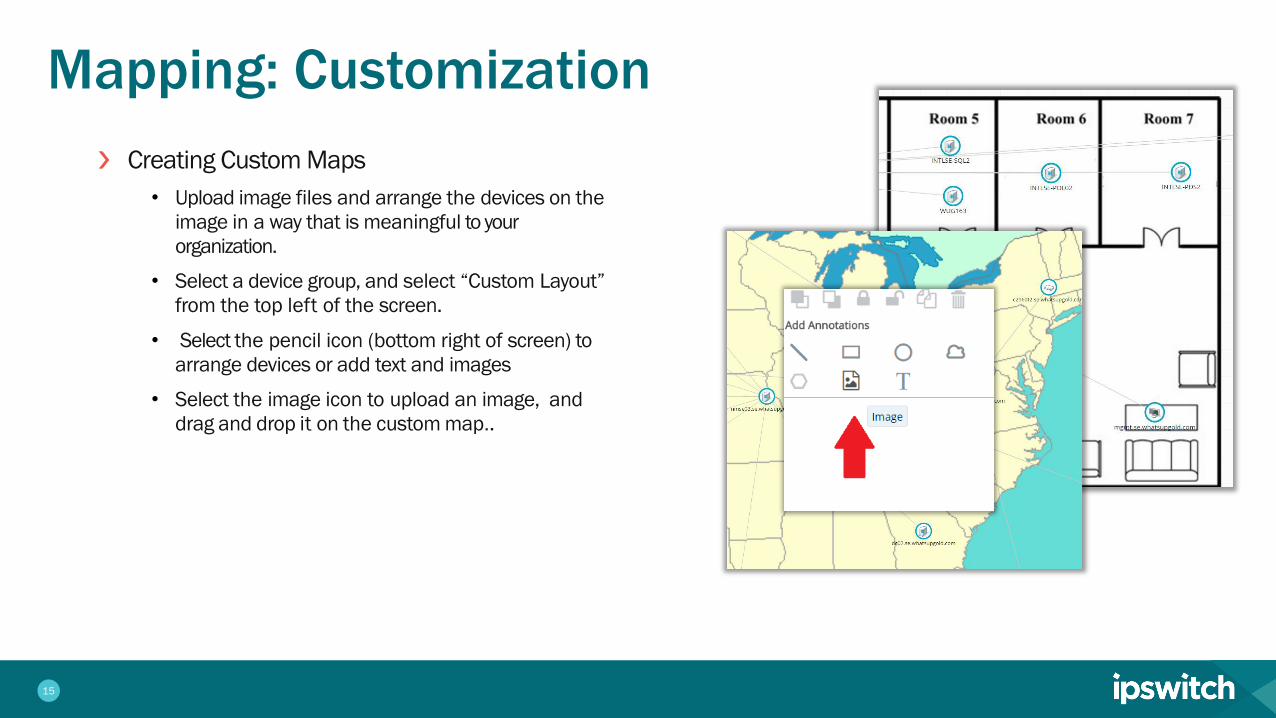
Mapping: Customization❯ Creating Custom Maps
• Upload image files and arrange the devices on the image in a way that is meaningful to your organization.
• Select a device group, and select “Custom Layout”from the top left of the screen.
• Select the pencil icon (bottom right of screen) to arrange devices or add text and images
• Select the image icon to upload an image, anddrag and drop it on the custom map..
16
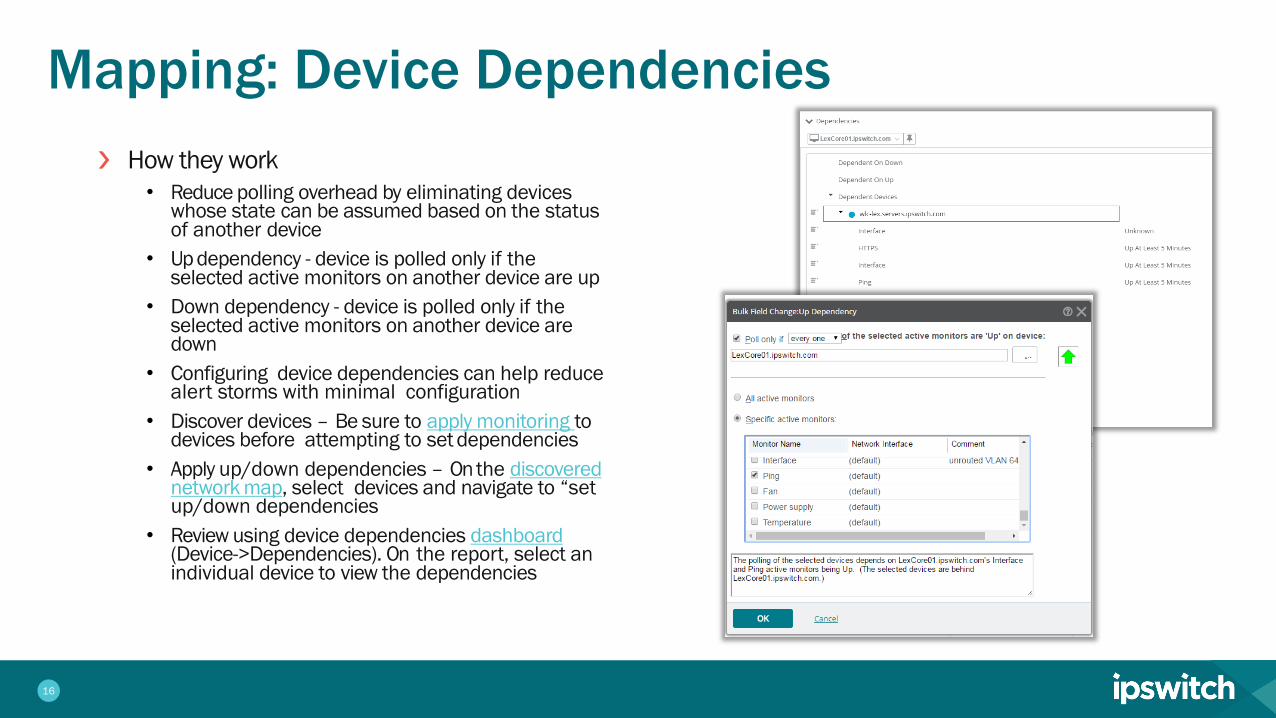
Mapping: Device Dependencies❯ How they work
• Reduce polling overhead by eliminating devices whose state can be assumed based on the status of another device
• Up dependency - device is polled only if the selected active monitors on another device are up
• Down dependency - device is polled only if the selected active monitors on another device are down
• Configuring device dependencies can help reduce alert storms with minimal configuration
• Discover devices – Be sure to apply monitoring todevices before attempting to set dependencies
• Apply up/down dependencies – On the discovered network map, select devices and navigate to “set up/down dependencies
• Review using device dependencies dashboard (Device->Dependencies). On the report, select an individual device to view the dependencies

17
MonitoringBasic MonitoringActive MonitorsPassive MonitorsPerformance MonitorsApplying MonitorsAction PoliciesAlert CenterMaintenance ModeAdvancedMonitoringConfiguration ManagementNetwork TrafficAnalysisVirtual MonitoringApplication Monitoring

18
Monitoring: Active Monitors❯ How they work
• Active Monitors poll devices for an up/down or yes/no response.
• The active monitor library includes built-in, configurable monitors including ping, port checks, file and folder monitoring, HTTP content monitors and SSL certificate monitors
❯ Configuring an Active Monitor (example)• From the main page, navigate to Settings-
>Libraries->Monitors.• Click on the plus mark, select active monitor and
add “NT Service Monitor.” • Select a protocol to use, and select “…” to enter
WMI/SNMP credentials• Provide a name and description and save to library• After the service monitor is created, you can apply
the monitor to devices
Helpful Tip: Activemonitors poll devices every 60 seconds by default. The polling interval can be customized.
19
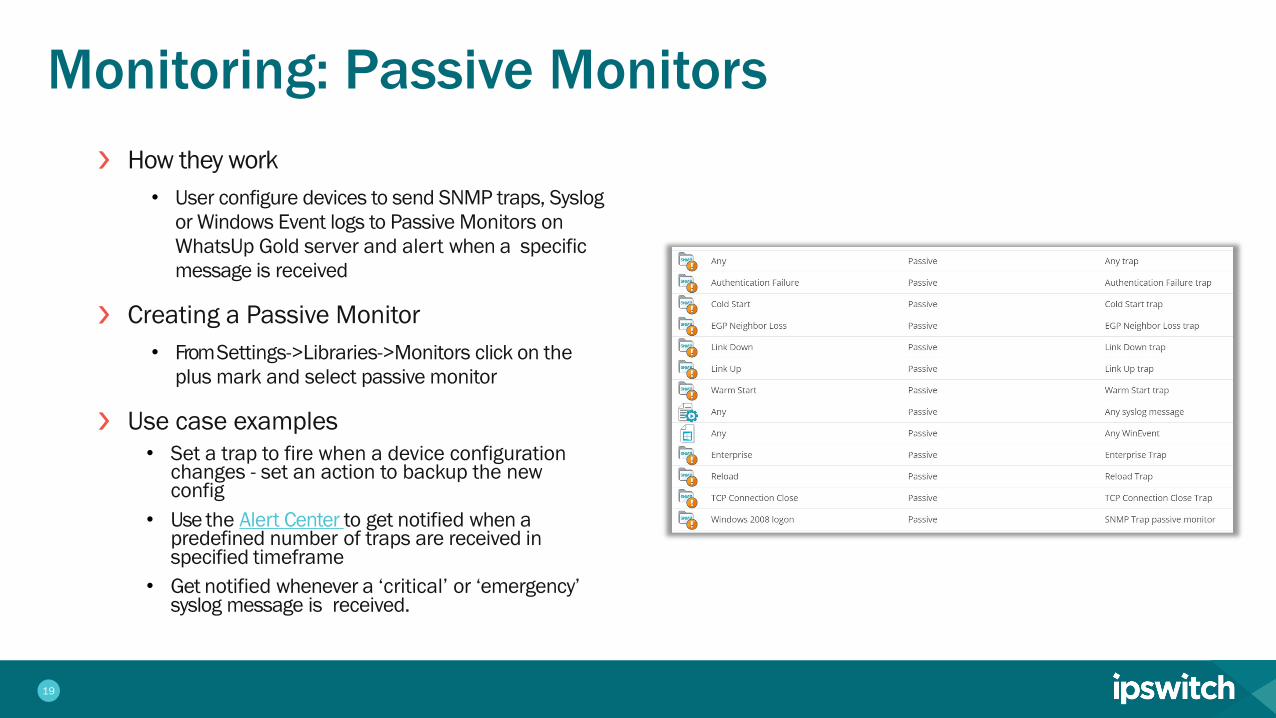
Monitoring: Passive Monitors❯ How they work
• User configure devices to send SNMP traps, Syslog or Windows Event logs to Passive Monitors on WhatsUp Gold server and alert when a specific message is received
❯ Creating a Passive Monitor • From Settings->Libraries->Monitors click on the
plus mark and select passive monitor
❯ Use case examples• Set a trap to fire when a device configuration
changes - set an action to backup the new config
• Use the Alert Center to get notified when a predefined number of traps are received in specified timeframe
• Get notified whenever a ‘critical’ or ‘emergency’ syslog message is received.

20
Monitoring: Performance Monitors❯ How they work
• Performance monitors track integers metrics like CPU, memory, disk or interface utilization over by polling devices on regular intervals (10 min default and configurable).
❯ Creating a Passive Monitor • From Settings->Libraries->Monitors click plus
mark, select performance monitor.
• You can create performance monitors using a number of different protocols including SSH, SNMP, or WMI.
• You can use the Alert center to create threshold based alerts for performance monitors.
21
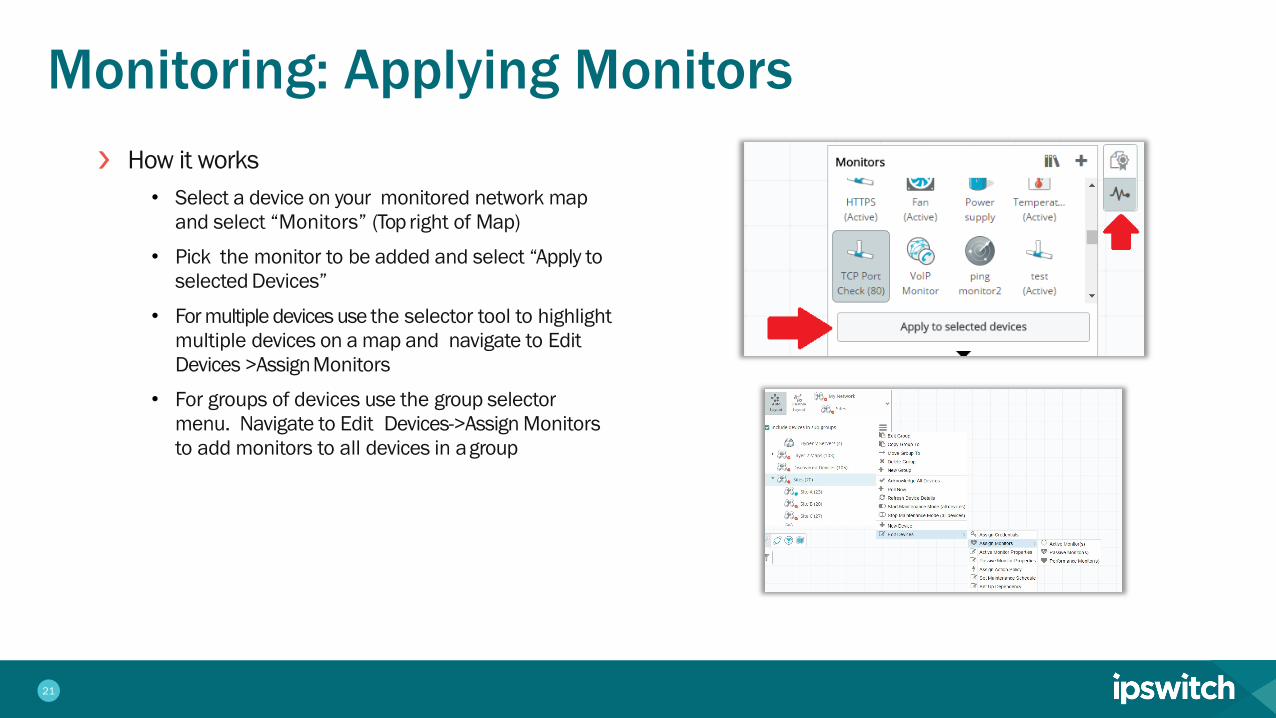
Monitoring: Applying Monitors❯ How it works
• Select a device on your monitored network map and select “Monitors” (Top right of Map)
• Pick the monitor to be added and select “Apply to selected Devices”
• For multiple devices use the selector tool to highlight multiple devices on a map and navigate to Edit Devices >AssignMonitors
• For groups of devices use the group selector menu. Navigate to Edit Devices->Assign Monitors to add monitors to all devices in agroup

22
Monitoring: Action Policies❯ How they work
• They determine actions to initiate upon active monitor state changes and can be assigned to individual monitors or on the device level
• Actions include: email alerts, SMS alerts, service restarts,and web alarms
❯ Creating Action Policies• From Settings > Actions & Alerts > Action & Policies
create actions in the action library
• Create an action policy from the actions from the library.
❯ Applying Action Policies• From the monitor setup page you can assign to
individual monitors or on the device level under the actions and action policies section
Helpful Tip: Change action initiated times in the admin console under Configure > Program Options > Device States
Action Policies Video
23
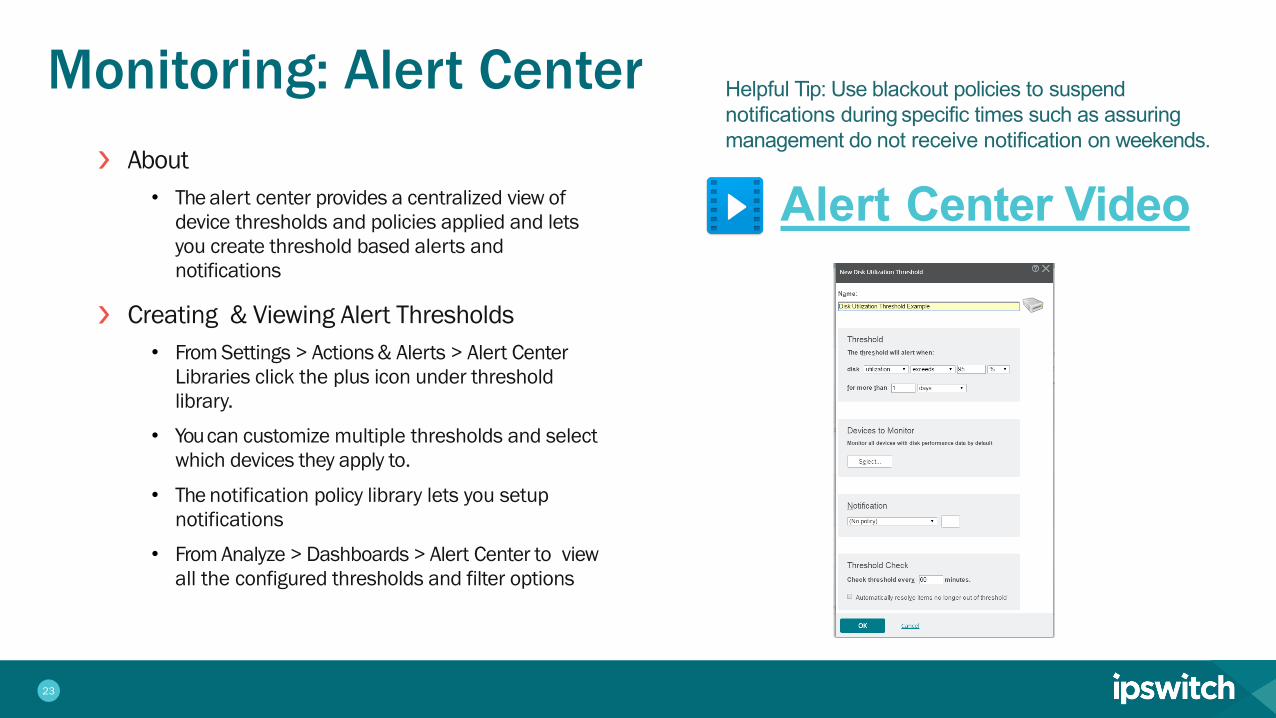
Monitoring: Alert Center❯ About
• The alert center provides a centralized view of device thresholds and policies applied and lets you create threshold based alerts and notifications
❯ Creating & Viewing Alert Thresholds• From Settings > Actions & Alerts > Alert Center
Libraries click the plus icon under threshold library.
• You can customize multiple thresholds and select which devices they apply to.
• The notification policy library lets you setup notifications
• From Analyze > Dashboards > Alert Center to view all the configured thresholds and filter options
Alert Center Video
Helpful Tip: Use blackout policies to suspend notifications during specific times such as assuring management do not receive notification on weekends.
24
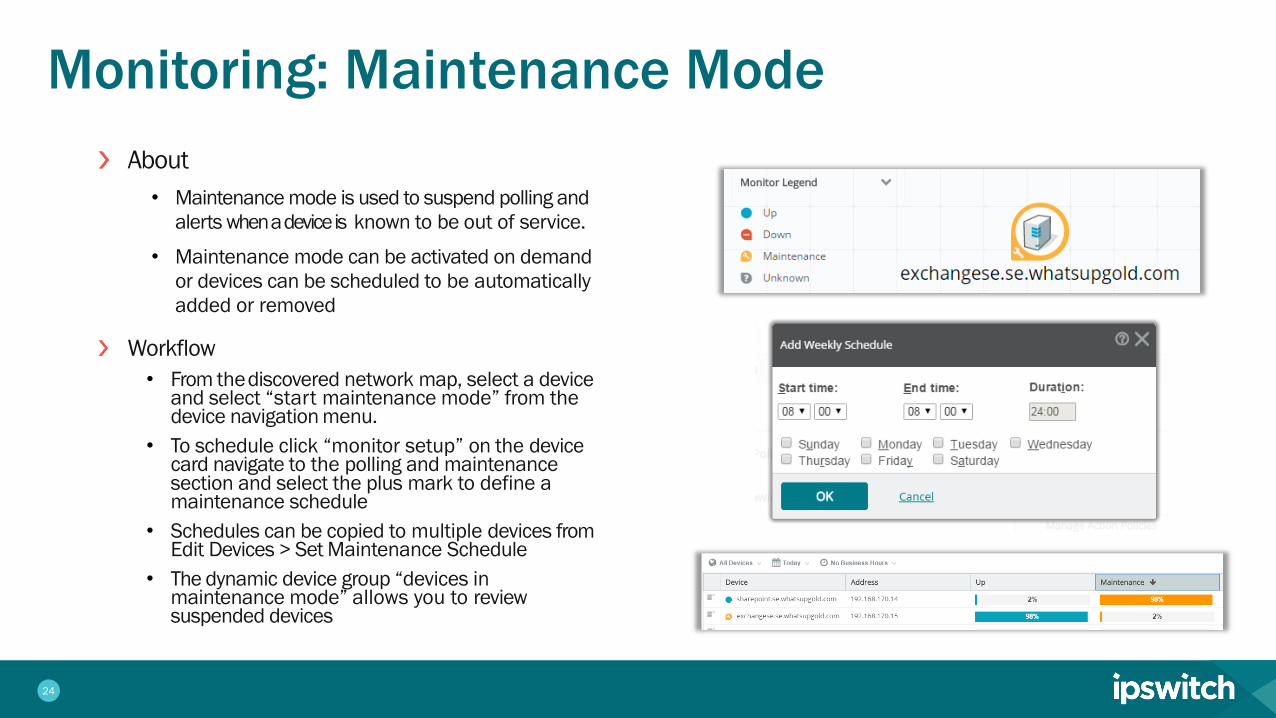
Monitoring: Maintenance Mode❯ About
• Maintenance mode is used to suspend polling and alerts when a device is known to be out of service.
• Maintenance mode can be activated on demand or devices can be scheduled to be automatically added or removed
❯ Workflow• From thediscovered network map, select a device
and select “start maintenance mode” from the device navigation menu.
• To schedule click “monitor setup” on the devicecard navigate to the polling and maintenance section and select the plus mark to define a maintenance schedule
• Schedules can be copied to multiple devices from Edit Devices > Set Maintenance Schedule
• The dynamic device group “devices in maintenance mode” allows you to review suspended devices

25
Monitoring: Maintenance Mode❯ About
• Maintenance mode is used to suspend polling and alerts when a device is known to be out of service.
• Maintenance mode can be activated on demand or devices can be scheduled to be automatically added or removed
❯ Workflow• From thediscovered network map, select a device
and select “start maintenance mode” from the device navigation menu.
• To schedule click “monitor setup” on the devicecard navigate to the polling and maintenance section and select the plus mark to define a maintenance schedule
• Schedules can be copied to multiple devices from Edit Devices > Set Maintenance Schedule
• The dynamic device group “devices in maintenance mode” allows you to review suspended devices
26
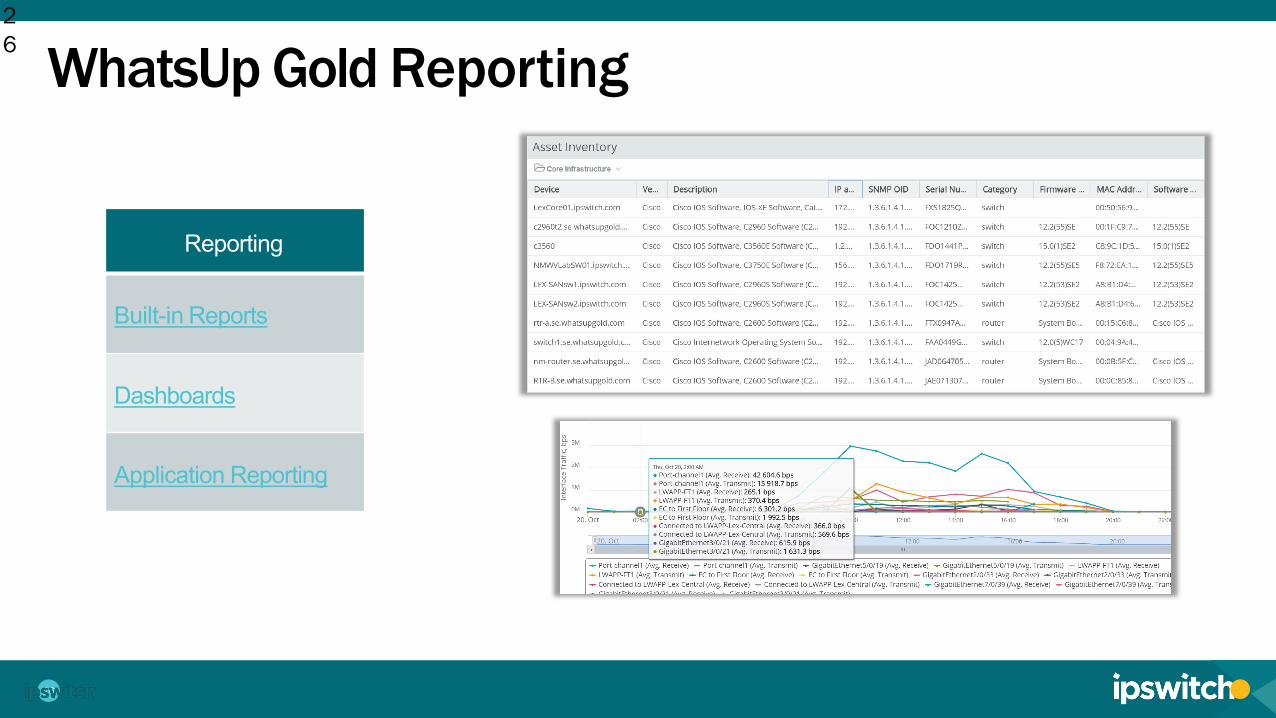
WhatsUp Gold Reporting
Reporting
Built-in Reports
Dashboards
Application Reporting
26
27
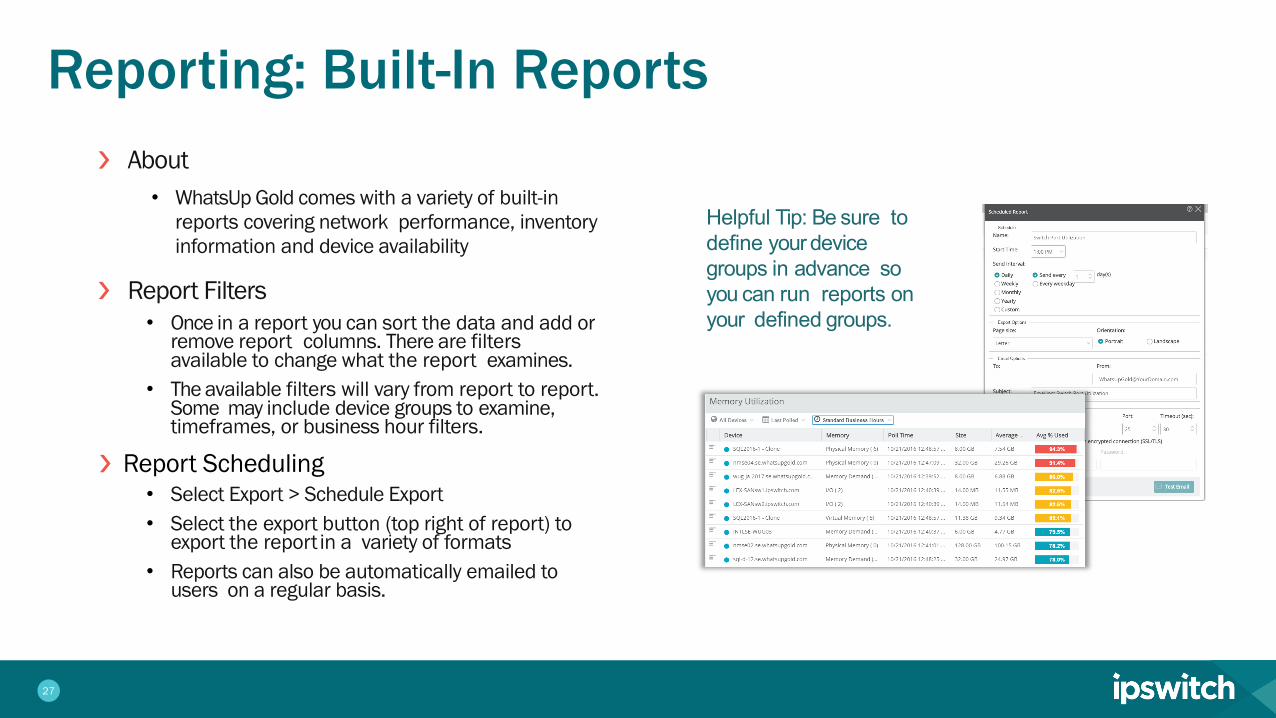
Reporting: Built-In Reports❯ About
• WhatsUp Gold comes with a variety of built-in reports covering network performance, inventory information and device availability
❯ Report Filters• Once in a report you can sort the data and add or
remove report columns. There are filters available to change what the report examines.
• The available filters will vary from report to report. Some may include device groups to examine, timeframes, or business hour filters.
❯ Report Scheduling• Select Export > Schedule Export • Select the export button (top right of report) to
export the report in a variety of formats• Reports can also be automatically emailed to
users on a regular basis.
Helpful Tip: Be sure to define your device groups in advance so you can run reports on your defined groups.

28
Reporting: Dashboards❯ About
• Create your own custom dashboards at Analyze > Dashboards > Home Dashboards
❯ Customization• From the dashboard screen, select “Add view >
Empty view.” Provide a dashboard name and select the amount of columns to be included. Select “Add Reports” to populate dashboard
• You can ‘filter’ reports’ by selecting the Settings button
• Use the thumbtack icon to pin the filter –applying it to all reports in a dashboard
Helpful Tip: Users can sharedashboard views with otherusers using the drop downmenu on the top left
Dashboards Video
29
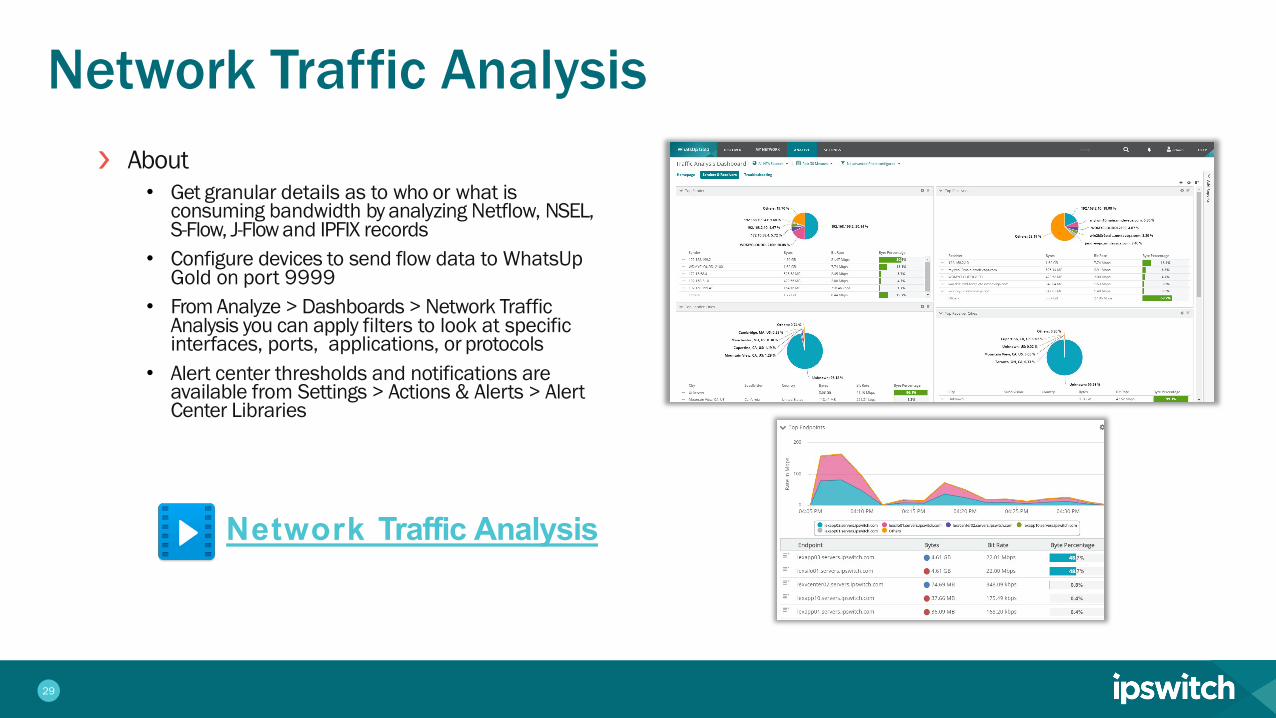
Network Traffic Analysis❯ About
• Get granular details as to who or what is consuming bandwidth by analyzing Netflow, NSEL, S-Flow, J-Flow and IPFIX records
• Configure devices to send flow data to WhatsUp Gold on port 9999
• From Analyze > Dashboards > Network Traffic Analysis you can apply filters to look at specific interfaces, ports, applications, or protocols
• Alert center thresholds and notifications are available from Settings > Actions & Alerts > Alert Center Libraries
Network Traffic Analysis
30
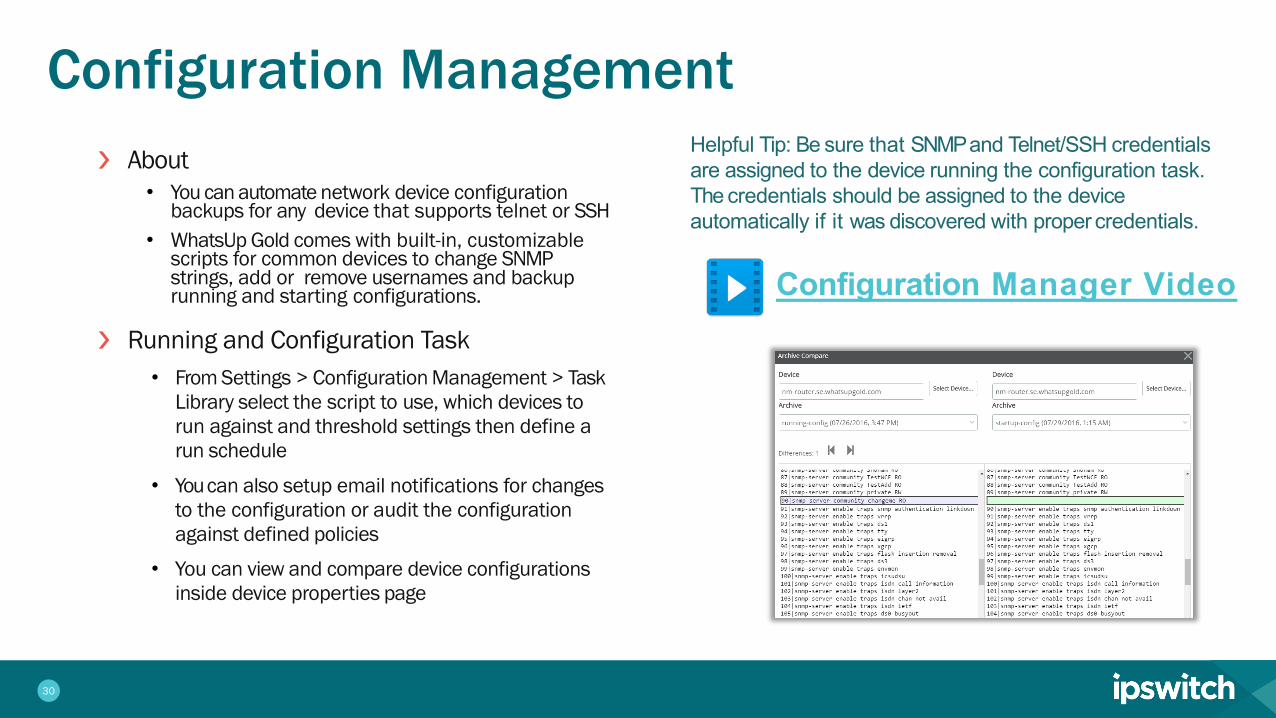
Configuration Management❯ About
• You can automate network device configuration backups for any device that supports telnet or SSH
• WhatsUp Gold comes with built-in, customizable scripts for common devices to change SNMP strings, add or remove usernames and backup running and starting configurations.
❯ Running and Configuration Task• From Settings > Configuration Management > Task
Library select the script to use, which devices to run against and threshold settings then define a run schedule
• You can also setup email notifications for changes to the configuration or audit the configuration against defined policies
• You can view and compare device configurations inside device properties page
Helpful Tip: Be sure that SNMP and Telnet/SSH credentials are assigned to the device running the configuration task. The credentials should be assigned to the device automatically if it was discovered with proper credentials.
Configuration Manager Video

31
Virtualization Monitoring❯ About
• Virtual Monitoring gathers performance statistics, maps out the virtual environment and can allows users to be notified based on Hyper-V or VMware event logs
• From Analyze > Dashboards > Virtual Monitoring select a virtual device to view virtual machinestatistics
• Navigate to Settings->Actions & Alerts->Alert Center Libraries to setup either VMware or Hyper-V event log notification policies.
Helpful Tip: VMware virtual monitoring requires devices to be discovered with VMware credentials. Hyper-V monitoring uses windows credentials.
Virtualization Monitoring
32
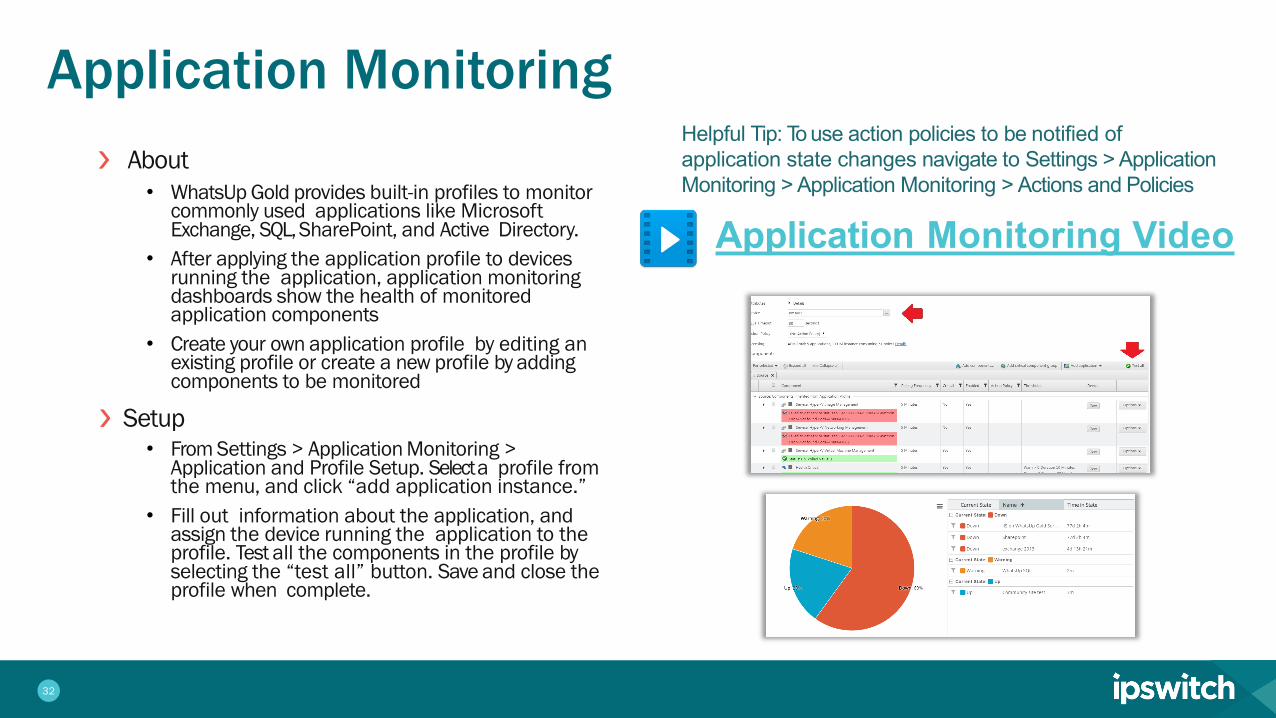
Application Monitoring❯ About
• WhatsUp Gold provides built-in profiles to monitorcommonly used applications like Microsoft Exchange, SQL, SharePoint, and Active Directory.
• After applying the application profile to devices running the application, application monitoring dashboards show the health of monitored application components
• Create your own application profile by editing an existing profile or create a new profile by adding components to be monitored
❯ Setup• From Settings > Application Monitoring >
Application and Profile Setup. Select a profile from the menu, and click “add application instance.”
• Fill out information about the application, and assign the device running the application to the profile. Test all the components in the profile by selecting the “test all” button. Save and close the profile when complete.
Helpful Tip: To use action policies to be notified of application state changes navigate to Settings > Application Monitoring > Application Monitoring > Actions and Policies
Application Monitoring Video
33
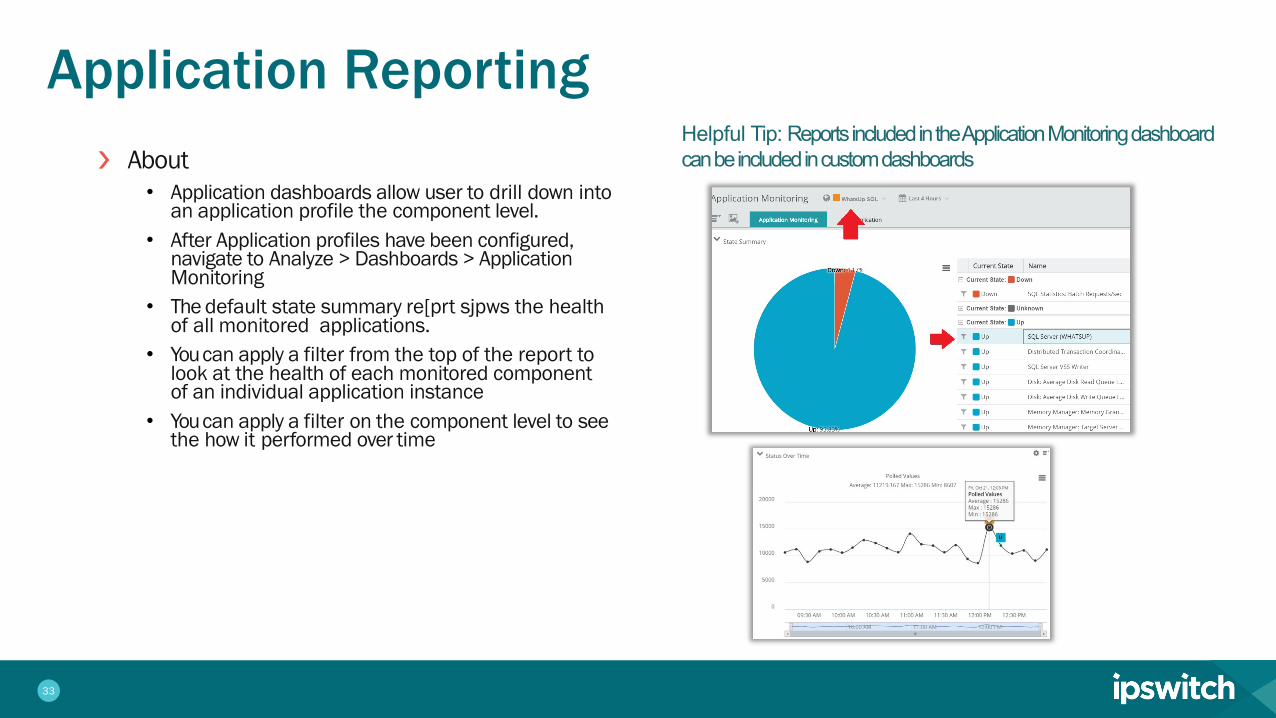
Application Reporting❯ About
• Application dashboards allow user to drill down intoan application profile the component level.
• After Application profiles have been configured, navigate to Analyze > Dashboards > Application Monitoring
• The default state summary re[prt sjpws the health of all monitored applications.
• You can apply a filter from the top of the report to look at the health of each monitored component of an individual application instance
• You can apply a filter on the component level to see the how it performed over time
Helpful Tip: Reports included in the Application Monitoring dashboard can be included in custom dashboards

34
More Features to Check Out❯ See WhatsUp Gold 2018
• Cloud Monitoring• Overview Dashboard• Meraki monitoring• Storage Monitoring• Interface Utilization Overlay
35
Contact sales or your Local reseller
to learn more or get pricing information


