100
AND WHE RE DO WE STAND IN 2003 MEGHALAYA & NORTH INDIA & THE WORLD Government of Meghalaya Directorate of Economics & Statistics Meghalaya :: Shillong

AND
WHE RE DO WE STAND IN 2003 MEGHALAYA & NORTH EAS~
INDIA & THE WORLD
Government of Meghalaya Directorate of Economics & Statistics
Meghalaya :: Shillong

PREFACE
t The Publication "Where Do We Stand in 2003, Meghalaya In North East and
India and the world" is the second in the series. It seeks to present the comparative
estimates on some important socio-economic aspects of the eight sister States ofthe
North East namely Arunachal Pradesh, Assam, Manipur, Meghalaya, Mizoram, Nagaland
and Tripura and also ofSikkim. The data for this issue has been collected from various
sources including Government organizations..
This Publication have been prepared by the Publication and Reference Section
ofthe Directorate, and efforts have beenmade to improve the presentation..
However comments and suggestionsare most welcome.
'" Dated: Shillong the 2nd June, 2004.
B. Purkayastha, lAS
Director Economics & Statistics Meghalaya, Shillong.
I

CONTENTS Table No.
() ,,,"f
( I, ) , WJ 'All
1.01
1.02
1.03
1.04
1.05
1.06
1.07
1.08
1.09
1.10
1. Area and Population Area and Population 2001(P)
Population Trends 1991-2001
Distribution of population by sex 2001(P)
Estimated slum population
Population of scheduled caste/tribes and other 1991
Distribution of Main, Marginal and Non-workers 2001(P)
Distribution of workers by categories 2001(P)
Estimated Birth Rate, Death Rate and Natural growth rate 20C1(P)
Infant Mortality Rate
Population below the poverty line 1999-2000
2. Agriculture 2.01
2.02
. Number and area of agricultural operational holdings 1990-2001
Land utilization statistics
~... (
(~~ ..
2.03
2.04
2.05
2.06
Area and Production of principal crops
Season wise consumption of fertilizers 2001
Fertilizer consumption per hectare 2000-01
Irrigated area
III
Page No.
1
2 3 4
5 6
7 8
9
10
11
12
13
14
15
16
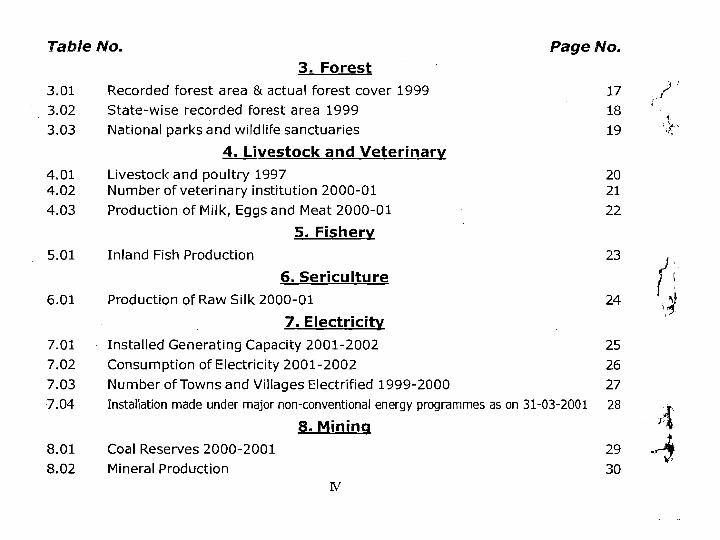
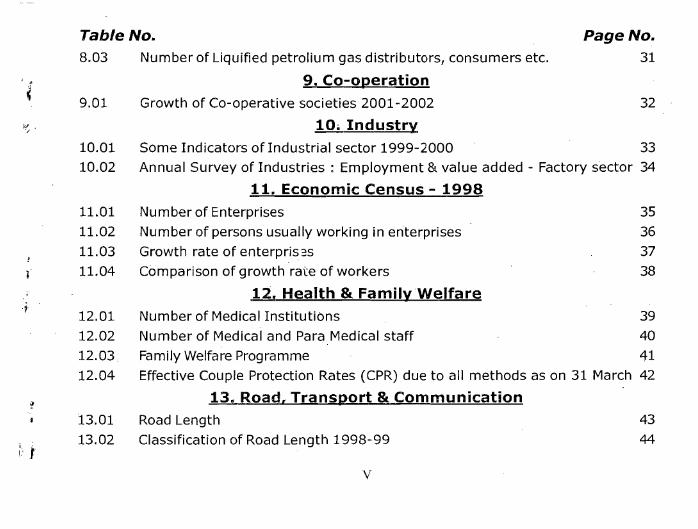
Table No. Page No.
8.03
'l 9.01
.~ ,
10.01
10.02
r
11.01
11.02
11.03
11.04
j 12.01
12.02
12.03
12.04
~
I J
13.01
13.02
Number of Liquified petrolium gas distributors, consumers etc. 31
9. Co-operation
Growth of Co-operative societies 2001-2002 32
10. Industry
Some Indicators ofIndustrial sector 1999-2000 33
Annual Survey of Industries: Employment & value added - Factory sector 34
11. Economic Census - 1998
Number of Enterprises 35
Number of persons usually working in enterprises 36 Growth rate of enterpris=s 37
Comparison of growth rate of workers 38
12. Health & Family Welfare
Number of Medical Institutions 39
Number of Medical and Para Medical staff 40
Family Welfare Programme 41
Effective Couple Protection Rates (CPR) due to all methods as on 31 March 42
13. Road. Transport & Communication
Road Length 43
Classification of Road Length 1998-99 44
v


Table No. Page No. 16.04
·. 17.01
17.02
17.03
18.01
18.02
18.03 ,\.'~
19.01 'i 19.02
19.03
20.01
21.01
"1 22.01
Incidence of crimes against woman 1999 63
17. Banking
Number of Scheduled Commercial Banks Offices December 2002· 64
Agregate Bank Deposits and Gross Credit of All Scheduled
Commercial Banks as on December, 2002 65
Performances of Regional Rural Banks as on December 2001 and 2002 66
18. Price Indices Consumer Price indices for urban non manual employees (Base 1984-85 =100) 67
Consumer price indices for Rural Labourers (Based 1996-97 = 100) 2002 68
Consumer price indices for agricultural labourers (Based 1986-87 = 100) 69
19. State Domestic product Per-capita Net State Domestic Product at Current prices (New Series) 70
Contribution of Agriculture to G.D.P of North Eastern States
(comparable estimates at current prices as new series 1993-94) 71
Net State Domestic product by Industry of origin at Current Prices 72
20. Tourism Number of Tourists & Tourist Spots 73
Economiclndicators: Meghalaya & India 74-75
India and the World , 76Demographic Trends in selected countries
VII


,,;:),
'. Population of North Eastern States, 2001.
~
..
8% 6% I!!IMeghalaya
I!!IArunachal Pradesh
OAssam
0Manipur
• Mizoram
III Nagaland
I!!ISikkim
0Tripura
69%
'"
l,r

Table 1.01
'"
·i
States
(1 )
Meghalaya
Area
(Sq. km)
(2)
22,429
Area and Population: 2001 (P)
Population Density
Growth rate (pc)
1981-91 1991-2001
(3) (4 ) (5) (6)
23,06,069 103 32.86 29.94
Decennial Average annual
exponential growttl rate (p.c)
1981-1991 1991-2001
(7) (8)
2.84 2.65
Arunachal Pradesh
83,743 10,96.,702 13 36.83 26.85 3.14 2.41
Assam 78,438 2,66,38,407 340 24.24 18.84 2.17 1.74
"
Manipur
Mizoram
22,327
21,081
23,88,068
8,91,058
107
42
29.29
39.70
30.02
29.18
2.57
3.34
2.66
2.59
Nagaland 16,579 19,88,636 120 56.u8 64.41 4.45 5.10
Sikkim 7,096 5,40,493 76 28.47 32.98 2.54 2.89
Tripura 10,486 31,91,168 304 34.30 15.74 2.95 1.47
N.E. Region 2,62,179 390,40,601 149 27.47 22.18 2.46 2.02
All India 32,87,263 102,70,15,245 312 23.85 21.35 2.15 1.95
Source :. Census of India
(',


~,
Census Population of North Eastern States
,. 30000 T'---------------------------------------,
25000'1----------- --
~ 20000 g -+-- Meghalaya
~ --II-- Arunachal Pradesh g
.. :g 15000 j----- Assam
$. c ~Manipuro iii ~ -------Mizoram ~ 10000
" ---Sikkim
-....+-- Nagaland
5000 -Tripura
"),
01. • I , , ,~iiiiifEA I 1901 1911 1921 1931 1941 1951 1961 1971 1981 1991 2001
Years
OJ


Table 1.05
Population of Scheduled Class/Tribes and Others : 1991 ,.~.)
States Scheduled Castes Scheduled Tribes Others Total ~
(1 )
Meghalaya
Arunachal Pradesh
Assam
Manipur
> Mizoram
Nagaland
" Sikkim
Tripura
N.E. Region
All India
(2) (3) (4 ) (5)
9,on 15,17,927 2,47,779 17,74,778
4,052 5,50,351 3,10,155 8,64,558
16,59,412 28,74,441 1,78,80,469 2,24,14,322
37,105 6,32,173 11,67,871 18,37,149
691 6,53,565 35,500 6,89,756
10,60,822 1,48,724 12,09,546
24,084 90,901 2,91,472 4,06,457
4,51,116 8,53,345 14,S2,744 27,57,205
21,85,532 82,33,525 2,15,34,714 3,19,53,771
13,82,23,277 6,77,58,380 64,03,21,031 84,63,02,688
Source;- Census oflndia, 1991
'>
5


.',
States
" (1 )
Meghalaya
Arunachal Pradesh
Assam
Manipur
Mizoram
" Nagaland
Sikkim
Tripura
N.E. Region
All India
()
Table 1.07
Distribution of Workers by Category, 2001 (P)
Workers (Main + Marginal)
Cultivators AgruGultural Household Ind- Other Total Non Labourers ustry workers Workers Workers
(2) (3 ) (4) (5) (6) (7)
457195 172975 17956 308299 956425 1349644
281822 18569 4130 177685 482206 614496
3741912 1289902 328541 4196709 9557064 17081343
492696 120991 97955 357936 1069578 1318490
253167 27494 6572 182364 469597 421461
544433 33852 18072 253625 849982 1138654
131422 16939 3250 113709 263320 277173
311378 278334 33535 534943 1158190 2032978
6214025 1959056 510011 6123270 14806362 24234239
127628287 107447725 16395870 151040308 402512190 622738869
Source:- Census oflndia, 2001.
7


'4
Estimated Birth,Death and Natural Growth Rate, 2001.
30 'r'~-'~"-'-----"----"------------------'----'--"-----'-------.---'---'-".---"---"----.----"--"--~.-'---'---------"
IJIBlrth Rate
iii Death Rate
DNatural Growth Rate
~
•
25
20
15
10
Meghalaya Arunachal Pradesh Assam Manrpur Mizoram Sikkim Tripura All India
o

Table 1.09
Infant Mortality Rate (Per '000)
States
1997-99 1998-2000 1999-2001
Total Rural Urban Total Rural Urban Total Rural Urban
(1 )
Meghalaya
Arunachal Pradesh
(2 )
56
43
(3)
59
45
(4)
33
10
(5)
5.8
44
(6)
61
45
(7)
32
11
(8)
56
39
(9)
57
41
(10)
41
11
Assam 66 75 37 75 78 35 74 77 34
Manipur
Mizoram
25
19
22
22
24
14
23
21
23
23
25
17
20
19
19
23
23
12
.. Nagaland
Sikkim
NA
49
NA
50
16
33
NA
49
NA
49
23
36
NA
42
NA
43
13
31
Tripura
All India'
42
70
43
75
33
44
41
68
42
74
32
44
39
66
40
72
30
42
* • Excludes Nagaland (Rural) due to part receipt ofreturns.
IJ Source :- S.R.S. Registrar General, India
9


Table 2.01
Number and Area of Agricultural Operational Holdings : 1990-91
States Number of Holdings Area Operated
Average size of holdings (hect) IPercentage to total '000 Nos '000 (hect) I Percentage to total
'j
(1 ) (2) (3) (4) (5) (6)
Meghalaya 171 0.2 302 0.2 1.76
Arunachal Pradesh 94 0.1 350 0.2 3.72
Assam 2523 2.4 3205 1.9 1.27
Manipur 142 0.1 175 0.1 1.23
Mizoram 61 0.1 84 0.1 1.37
Nagaland . 142 0.1 968 0.6 6.82
'" Sikkim 53 0.1 111 0.1 2.11
Tripura 318 0.3 308 0.2 0.97
All India 106637 100..J0 165507 100.00 1.55
Source :- AI/India Report on Agricultural Census 1990-91.
0
11


Table 2.03
Area and Production of Principal Crops A = Area in thousar.d hectares P = Production in thousand tonnes
States
(1 )
Rice
(2)
Total Cereals
(3)
Total Pulses
(4)
Total Foodgrains
(5)
Potato
(6)
Ginger
(7)
Banana
(8)
Pine- Arecaapple nut
(9) (10)
Meghalaya 2001-02 A P
108 189
130 221
3 3
133 224
18 159
9 47
5 64
9 82
11 14
Arunachal Pradesh 2000-01
A P
119 126
177 197
6 6
183 '203
5 32
6 29
4 13
7 32
Assam 2000-01 A P
2646 3999
2747 4105
111 62
2858 4167
81 677 -
43 590
14 216
73 68
Manipur 2001-02 A P
163 387
168 397
6 ·3
174 400
3 16
2 4
4 57
1 3
Mizoram 2001-02 A P
56 106
3. 4
--
1 9 -
3 15
1 2
Nagaland 2000-01 A P
150 231
203 303
26 21
229 324
5 48
1 13
3 41 .
3 76
Sik kim 2000-01 A P
15 21
70 98
6 5
76 103
6 26
Tripura 2000-01 A P
241 513
244 517
10 6
254 523
6 105
1 2
5 64
3 82
3 7
All India 2000-01 A P
44359 84871
9975 185249
20026 10665
119780 195914
1211 22143
')
Source :- State Statistical Bureaus.
13


States
.) (1 )
Meghalaya
Arunachal Pradesh
Assam
Manipur
Mizoram I
Nagaland
Sikkim
Tripura
All India
Table 2.05
Fertilizers Consumption Per Hectare : 2000-01
1995-95
(2)
11.30
1996-97
(3)
14.10
1997-98
(4 )
13.17
1998-99
(5)
17.37
1999-2000
(6)
14.91
1.56 2.22 2.18 2.40 2.18
12.48 14.02 17.84 18.93 27.94
64.96 64.93 63.71 79.06 86.44
7.06 3.58 9.00 . 8.79 19.48
2.28 3.46 2.23 3.43 2.86
7.39 4.72 5.93 8.82 6.92
19.85 18.84 23.10 24.32 20.07
74.38 75.49 84.98 87.08 93.81
(kgs/hectare)
2000-01
(7)
14.23
2.40
35.68
102.03
10.95
1.51
8.50
20.72
86.34
~
Source ;. Centre for Monitoring Indian Economy.
'J
15


7
Table 3.01
Recorded Forest Area And Actual Forest Cover : 1999 (Sq Kms)
States Geographical Area
Recorded Forest Forest Cover , 'i,'I Percentage to Area Geographical Area
I Percentage 'toArea Geographical Area \l
(1 ) (2) (3) (4) (5) (6)
Meghalaya 22.429 9.496 42.34 15,633 69.69
Arunachal Pradesh 83.743 51,540 61.54 68,847 82.21
Assam 78,438 30,708 39.15 23,688 30.20
Manipur 22,327 15,154 67.87 17,384 77.86
Mizoram 21,081 15,935 75.59 18,338 86.99
Nagaland 16,5,8 8,629 52.04 14,164 85.43
Sikkim 7.096 2,650 37.34 3,118 43.94
Tripura 10,486 6,293 60.00 5,745 54.79
N.E. Region 2,62,179 1,40,405 53.55 1,66,917 63.66
All India 32,87,263 7,65,253 23.28 6,37,293 19.39
Source :- The State of Forest Report, 1999 'j,)
17


Table 3.03
'! National Parks and Wildlife Sanctuaries: 1999
National Parks I Wildlife Sanctuaries -'" States
(1 )
Meghalaya
I Number
(2)
2
Area (Sq Km)
(3)
267.48
I Number
(4)
3
Area (Sq Km)
(5)
34.20
Arunachal Pradesh 2 2,468.23 10 7114.45
Assam 3 7,173.71 13 939.88
.~
Manipur 2 81.80 1 184.85
Mizoram 2 250.00 4 634.00
.. Nagaland 1 202.02 3 24.41
Sikkim 1 1784.00 5 26510
Tripura 4 603.62
N.E.Region 13 6~227.24 43 9800.51
All India 87 40631.64 485 115374.42
(~ Source :- The State ofForest Report, 1999
19


Table 4.02
Number of Veterinary Institutions: 2000-01 ",'
States Hospitals Dispensaries Aid Centres Key Village Stockmen Veterinary Centres Centres Doctors!
'l), Surgeons
(1 ) (2) (3) (4) (5) (6) (7)
Meghalaya 4 64 62 2 76 180
Arunachal 1 93 155 NA NA NA Pradesh
Assam (1999-2000) 29 448 1213 54 465
~ Manipur (2001-02) 55 103 28 NA NA NA
Mizoram
.. Sikkim (2001) 12 23 65
Nagaland (1999-2000) 4 27 70
Tripura 10 55 238 NA 23 NA
NA - Information not available
Source :- State Statistical Bureaus
,~
21


Table 5.01
Inland Fish Production " (in M.T.)
"" States 1997-98 1998-99 1999-2000 2000-01 2001-02
.~
23


- - -
"1
'"
~
..
"
States
(1 )
Meghalaya
Arunachal Pradesh (2000-01)
Assam
,Manipur
Mizoram
Nagaland (1999-2000)
Sikkim
Tripura (1999-2000)
...
Hydro
(2)
185.20
31.83
2.00
3.20
14.00
3.20
32.50
16.00
Table 7.01
Installed Generating Capacity: 2001-02
Thennal Total
Steam Diesel Gas
(3 ) (4 ) (5) (6)
- 27.12
300.00 - 272.40
8.65
- 26.00
1.80 0.16
- 4.00
4.85 64.50
* Pertaining to 1998-99
Source;- (1) Central Electricity Authority
(2) State Statistical Bureaus
25
185.20
58.95
574.40
11.85
40.00
5.16
36.50
85.35
(Mw)
Gross Generation
(MKWH)
(7)
675.59
62.00
840.41
0.67
17.00 *
2.80
29.55
314.18


Table 7.03
Number of Towns and Villages Electrified : 1999-2000 f.,
Villages Per capita
consumption of electricity (Kwh) States No. of Towns
electrified Inhabited * Electrified Percentage of
electrified villages


Table 8.01
~J'
States
(1 )
Proved
(2)
Coal Reserves: 2000-01
Indicated
(3)
Inferred
(4 )
(Million Tonnes)
All Reserves
(5)
Meghalaya 118 41 301 460
Arunachal Pradesh 31 11 48 90
Assam 259 27 34 320
Nagaland 3 1 15 19
Source :- Centre forMonitoring Indian Economy ..
... 'l9


Table 8.03
Number of Liquified Petroleum Gas Distributors, Consumers, etc. " .
States
LPG Distributors (Nos.) LPG Consumers COOO Nos.) Diesei/SKO Dealers (Nos.)
1998-99 1999-2000 1998-99 1999·2000 1998-99 1999-2000 '~
(1 )
Meghalaya
Arunachal Pradesh
Assam
'J Manipur
Mizoram
" Nagaland
Sikkim
Tripura
N.E. Region
(2) (3) (4) (5) (6) (7)
19 22 52 58 35 35
18 23 55 73 34 32
147 156 565 892 357 357
18 22 95 111 35 35
14 15 90 106 19 19
19 20 47 56 19 19
3 3 31 37 12 12
17 19 66 122 39 39
255 280 1001 1455 550 548
Source :- Centre for Monitoring Indian Economy ~
31


Table 10.01
Some Indicators of Industrial Sector: 1999-2000 , ,
(Value in Crore Rs.)
\I.
States No. of Factories No. of Persons engaged ('000 Nos)
Fixed Capital Value of Output Net Value Added
(1 )
Meghalaya
(2)
27
(3 )
1
(4)
23
(5)
69
(6)
8
Assam 1,648 114 2,476 7,776 1,698
,}
Manipur
Nagaland
61
147
1
3
4
22
13
71 7
.~
Tripura 206 8 26 122 27
All India 1,31.558 8,173 4,01,865 8,97,938 1,54,974
Source :- Central Statistical Organisation
,Co
33


Table 11.01
., Number of Enterprises : Economic Census 1998
('00 Nos.)
P>t
States
Own Account Enterprises Establishments Total Enterprises
Agricultural Non-Agricultural Agricultural Non-Agricultural Agricultural t-.bn-AgrbjIuaI
(1 ) (2) (3) (4) (5) (6) (7)
Meghalaya 14 227 7 317 21 544
Arunachal Pradesh 1 101 1 104 2 205
Assam 151 3573 44 2164 195 5737
-" Manipur 56 544 6 199 62 - 743
Mizoram 15 131 3 101 18 232
• Nagaland 2 138 4 153 6 291
Sikkim 1 55 2 72 3 127
Tripura 26 757 2 259 28 1016
N.E. Region 266 5526 69 3369 335 8895
All India 31029 182728 3719 86012 34748 268740
Source:- Economic Census, 1998 (All India Report) lD
35


,':):
Itj
'k
"i
States
(1 )
Meghalaya
Arunachal Pradesh
Assam
Manipur
Mizoram
Nagaland
Sikkim
Tripura
All India
11
Table 11.03
Growth Rate of Enterprises: Economic Census
Growth Rate of Enterprises
(Percentage)
Rural Growth Urban Growth Combined Growth
1980-90 1990-98 1980-90 1990-98 1980-1990 1990-98
(2)
4.44
(3)
1.54
(4 ) ._. 4.43
(5)
1.56
(6)
4.44
(7)
1.55
5.72 -1.14 10.25 2.96 6.61 -0.07
NA 1.72 NA 3.58 NA 2.28
6.01 3.05 5.62 3.97 5.84 3.47
2.23 0.91 8.77 0.98 5.53 0.95
3.91 1.02 4.64 4.51 4.24 2.75
3.40 0.74 1.08 5.89 2.62 2.54
4.41 1.87 5.72 4.05 4.77 2.53
2.69 2.27 3.55 2.50 3.04 2.36
Source :- Economic Census, 1998 ( AI/India Report)
37


Table 12.01
Number of Medical Institutions ~l
.~
States No. of Hospitals (including CHC)
No. of Dispensaries PH.C. Sub-Centres No. of Beds ('000 Nos.)
(1 )
Meghalaya (1998-99)
(2)
22
(3)
38
(4 )
88
(5)
~13
(6)
2
Arunachal Pradesh (2000-01 )
43 18 67 350 2
Assam (2000-01) 161 323 610 5109 13
" Manipur (2001-02) 103 (induding PHC)
440 NA NA 2
oJ
Mizoram (2001-02)
Nagaland (1999-2000)
16
25 18
46
55
13
366
2
2
Sikkim (2000-01) 5 24 147
Tripura (1999-2000) 17 538 68 2
., Source :- State Statistical Bureaus
" 39
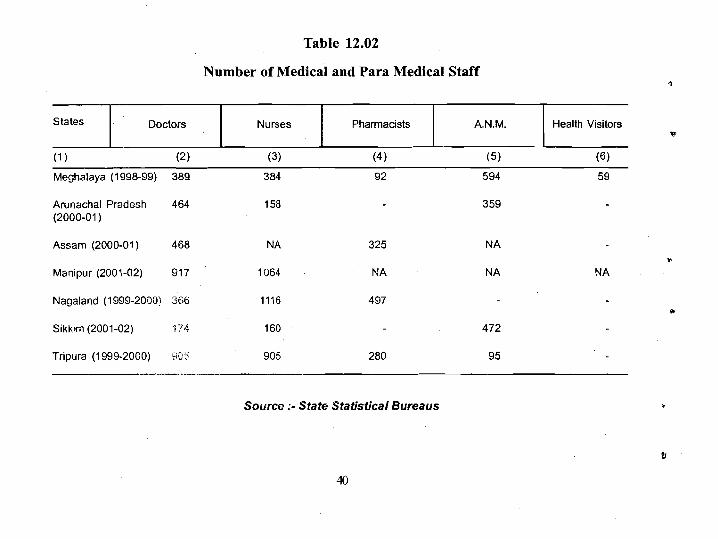
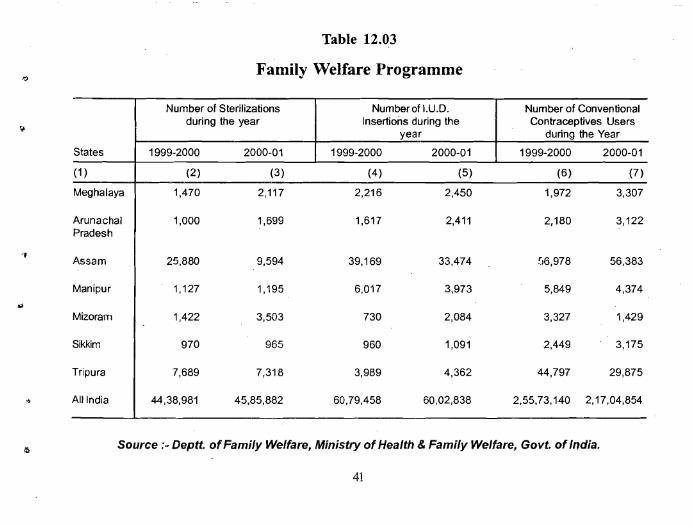
Table 12.03
Family Welfare Programme rJ
Number of Sterilizations Number of I.U.D. Number of Conventional during the year Insertions during the Contraceptives Users
\I year during the Year
States
(1 )
Meghalaya
Arunachal Pradesh
'f Assam
Manipur
'" Mizorarn
Sikkim
Tripura
.. All India
1999-2000 2000-01 1999-2000 2000-01 1999-2000 2000-01
(2) (3) (4) (5) (6) (7)
1,470 2,117 2,216 2,450 1,972 3,307
1,000 1,699 1,617 2,411 2,180 3,122
25,880 9,594 39,169 33,474 [,6,978 56,383
1,127 1,195 6,017 3,973 5,849 4,374
1,422 3,503 730 2,084 3,327 1,429
970 965 960 1,091 2,449 3,175
7,689 7,318 3,989 4,362 44,797 29,875
44,38,981 45,85,882 60,79,458 60,02,838 2,55,73,140 2,17,04,854
Source ;- Deptt. ofFamily Welfare, Ministry of Health &Family Welfare, Govt. of India.It.
41
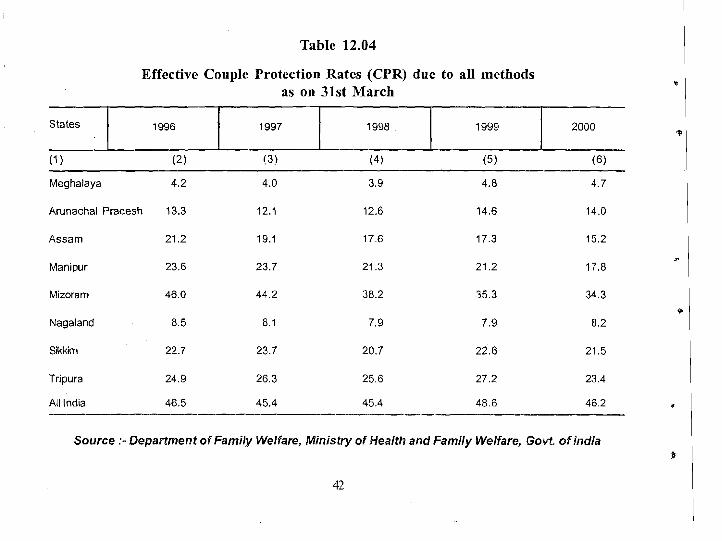

Table 13.01
':;1 Road Length: 1998-99
(Kms)
'~ States Total Road Length Surfaced Roads
Proportion of unsurfaced roads
(percent)
Road Length
per 100 Sq km. of I Per Lakh of area Population


Table 13.03
f:J
Rural Roads Constructed Under Jawahar Rozgar Yojana (JRY)
'.. States I -(1 )
Meghalaya
1990-91
(2)
70.00
r 1995-96
(3)
47.00
I Period
1996-97
(4 )
0.00
I 1997-98
(5)
100.00
I
Arunachal Pradesh 225.12 24.00 93.66 318.00
Assam 2,207.76 995.87· 221.97 1,422.90
" Manipur 2,441.95 246.00 454.00 158.00
Mizoram 1,110.00 201.00 11.69 47.00
"" Nagaland 156.53 73.00 13.81 188.25
Sikkim 525.00 0.00 40.00 0.00
Tripura 870.62 573.23 450.00 193.62
"
N. E. Region
All India
7,606.98
1,48,909.05
2,160.10
29,934.35
1,285.13
39,473.56
2,427.77
36,341.92
'5. Source ;0 Ministry ofRural Areas & Employment, Govt. of India.
45
(Length in Kms)
1998-99
(6)
310.00
410.00
3,337.98
150.00
79.00
196.00
192.00
579.00
5,253.98
49,567.93


Table 13.05
<'
Villages Connected by Roads As on 31-03-1997
>S States
(1 )
Meghalaya
I
I Number of Villages,
1991 Census
(2)
5,484
Number of Villages estimated to have been connected upto 31-03-97
(3)
2486
Percentage of
Connectivity
(4 )
45.33
Arunachal Pradesh 3,649 1480 40.56
Assam 23,208 17304 74.56
~
Manipur
Mizoram
2,180
785
1002
654
45.96
83.31
l>,
Nagaland
Sikkim
1,119
453
994
360
88.83
79.47
All India 5,87,258 3,53,287 60.16
., Source :- Planning Commission, New Delhi
'Ii.
47


,.I' ,~
'" States Two Wheelers
(8)
Meghalaya (2002-03) 21050
$
Arunachal Pradesh (1996-97)
Assam
Mizoram
10,605
2,73,206
15146
.. Sikkim 3493
Nagaland 37237
," Tripura 24,208
."
'X' -Included in Others
Source ;- State Statistical Bureaus
49
Others All Vehicles
(11 ) (12)
772 73382
179 21,144
32,445 5,34,885
103 33830
689 10232
12319 1,69,067
669 45199
Tractors
(9)
441
333
8,339
199
'X'
2485
139
Trailers
(10)
2304
155
8,495
251
'X'
927
1027


I
Table 13.08
Road Accidents '!'J
(Nos.)
States Accidents Persons Killed Persons injured ...
(1 ) (2) (3) (4)
Meghalaya (2001)
Arunachal Pradesh (2000-01 )
III Assam (2001)
Manipur (2001-02)
~ Mizoram (1999)
Nagaland (2000-01)
Tripura (1999-00)
593
466
2,5·16
443
57
79
550
176
175
1,021
94
41
57
152
454
NA
3,744
831
121
126
898
",'j'
NA -Information not avaifable
(f Source :- State Statistical Bureaus.
51


,.,
."
States
(1 )
Meghalaya
Arunachal Pradesh
~ Assam
Manipur
Mizoram
Nagaland
Sikkim
Tripura
It All India
~
Total
(2)
49
42
53
60
82
62
57
60
52
Table 14.01
Percentage of Literate Persons
1991 Census
Male Female Total
Estimated through NSSO Survey
1997-98
Total
(5)
86
58
79
81
94
84
75
83
62
-(3) (4 ) (6)
53 45 63
51 30 55
62 43 64
72 48 69
86 79 88
68 55 67
66 47 70
71 50 74
64 39 65
Source ;. (1) Office of The Registrar General of India
(2) National Sample Survey Organisation
53
2001 Census
Male
(n 66
64
Female
(8)
60
44
72
78
91
72
77
81
76
56
60
86
62
61
65
54


Table 15.01
Job Seekers Registered With Employment Exchanges '"
('000 NOS) No. of live register as at the end of the year ""
2000 2001
States Male Female Persons Male Female PersonsI E -(1 ) (2) (3 ) (4) (5) (6) (7)
-~---, .. _--Meghalaya 20.8 14.6 35.4 23.0 15.3 38.4
Arunachal Pradesh 14.0 7.0 ,:1.0 14.6 7.5 22.1
(l> Assam 1134.8 307.5 1442.3 1166.0 320.6 1486.6
Manipur 286.8 105.1 391.9 300.6 104.9 405.5
''# Mizoram 62.6 26.1 88.7 60.0 24.6 84.6
Nagaland 28.1 9.1 37.2 29.1 8.5 37.6
Tripura 189.3 114.6 303.9 204.6 122.3 326.8
N.E. Region 1736.4 584.0 2320.4 1797.9 603.7 2401.6
$' All India 30886.3 10457.3 41343.6 31111.1 10884.8 41995.9
3· Directorate General of Employment and Training, Ministry of Labour
55


Table 15.03
Estimate4 Employmeat ill the Public & Private Sectors : 1999-2009 '" ('000 NOS)
Ql
'"
,.
Public Sector Private Sector
States
Central Govt.
State Govt.
Quasi Govt. Local Bodies
Large Establish
ments
samH Establish
ments
Grand TotalCentral State
(1 ) (2) (3) (4 ) (5) (6) (7) (8) (9)
Meghalaya 16.6 37.7 7.8 7.7 2.8 7.2 2.1 81.9
Assam 81.8 307.7 76.9 56.1 13.1 539.8 9.1 1084.5
Manipur 4.7 64.0 3.8 3.3 3.6 2.0 0.6 82.1
Mizoram 0.8 33.5 1.3 1.5 3.0 1.4 - 41.5
Nagaland 5.9 62.7 1.9 2.9 0.4 1.4 1.7 76.9
Tripura 2.0 92.6 4.2 2.8 8.9 12.5 0.4 123.3
All India 3273.2 7459.6 3413.2 2912.5 2255.2 7719.2 926.8 27959.7
'J'
Source :- Central Statistical Organisation
\5.
57


Table 15.05
Workforce Participation Rllte According to Sex and Sector, 2001 (P) ,4
States
Rural Urban Combined
Male Female Total Male Female Total Male Female Total'Il<
(1 )
Meghalaya
Arunachal Pradesh
Assam
.;; Manipur
Mizoram
.~ Nagaland
Sikkim
Tripura
All India
'"
~
(2) (3) (4) (5) (6) (7) (8) (9) (10)
50.09 38.92 44.58 38.19 19.15 28.74 47.76 35.02 41.47
51.13 41.33 46.47 48.99 16.69 34.16 50.69 36.45 43.97
49.77 22.28 36.45 51.03 10.29 31.98 49.93 20.80 35.88
50.07 43.20 46.72 45.17 32.28 38.71 48.91 40.51 44.79
59.52 54.73 57.22 55.32 40.50 48.09 57.45 47.63 52.70
47.08 42.92 45.08 45.70 14.87 31.91 46.82 38.25 42.74
57.75 40.67 49.75 56.27 21.42 40.49 57.58 38.59 48.72
50.61 22.86 37.'11 51.78 12.09 32.32 50.81 21.02 36.29
52.36 30.98 41.97 50.85 11.55 32.23 51.93 25.68 39.26
Source :- Population Census 2001: Office of the Registrar General, India.
59


Table 16.04
Incidence of Crimes against Women during 1999 c) . ~
'?
'j
States -(1-)--
Q) n
&.
(2)
OJ6 ·~·n 0.::>g"Uc til :9"0 ::<: c
til
(3)
>'Ul ~r.
~ro o Q)0'0
(4 )
u >.~Ul .0 Q)
~ -¥3 .~ - c-Q) til til2 .Q a; U"'~
::> .c
(5)
c a '-P ~ Ul Q) (5 ~
(6)
-OJ c c - Q).
~ ffi ~ X Ul Q) <l> co -+r' C/)~Q)
<0 > .c~
(7)
u 1Ec ~ .2:::c{3 ~~« o Q)E ~ E 0.
(8)
c: >.,iil ~;Q 13 o.c « 0.2
0..
(9)
-Meghalaya 27 10 - - 17 - -Arunachal Pradesh 39 40 - 5 65 1 1 -Assam 703 1149 40 843 720 21 5 23
Manip\..r 12 38 - 2 13 - - -Mizoram 71 - - - 74 - - -Nagaland 1'j 5 - - 3 - - -Sikkim 7 - - - 21 - - -Tripura 72 27 17 113 71 - - -N.E. Region 942 1269 57 963 984 22 6 23
All India 15468 15962 6699 43823 32311 8858 9363 3064
.. Source :- National Crime Records Bureaues
Ministty of Home Affairs l.J
63


Table 17.02
Aggregate Bank Deposits and Gross Bank Credit ofAll Scheduled Commercial Banks, December 2002 '~
Public Sector Banks
~
States
(1 )
Deposits
(2)
Credits
(3 )
Meghalaya 1840.38 474.50
Arunachal Pradesh
673.46 99.57
l' AsSam
Manipur
10896.58
521.78
3156.43
159.27
..~ Mizoram 383.85 117.33
Nagaland 923.77 150.91
Sikkim 994.98 159.07
Tripura 1413.85 304.30
II N.E. Region
All India
17648.65
1160365.67
4621.38
676023.25
Regional Rural Banks
Deposits
(4)
146.21
36.01
Credits
(5)
38.20
33.90
1334.90
23.97
76.22
10.08
-
434.63
12.10
31.44
4.06
-
528.16
2155.55
46253.98
159.80
714.13
20692.72
(Rs. in Crore)
All Scheduled Credit! Commercial Banks Deposits
Percentage
Deposits Credits
(6) (7) (8)
1986.59 512.70 25.81
709.47 133.47 18.81
12231.48 3591.06 29.36
545.75 171.37 31.40
460.07 148.77 32.34
933.85 154.97 16.59
994.98 159.07 15.99
1942.01 464.10 23.90
19804.20 5335.51 26.94
1206619.65 696715.97 57.74
Source :- Banking Statistics, Reserve Bank of India
65
b


Table 18.01
Consumer Price Index Number for Urban Non-Manual Employees (Base 1984-85=100) .,.
States! ~ Centres
(1 )
Meghalaya - Shillong
Assam - Guwahati
- Siliguri
Manipur-Imphal
? Nagaland - Kohima
Sikkim - Gangtok 'J
Tripura - Agartala
All India
...
tI
2001 2002
July Aug. Sept. Oct. Nov. Dec. Jan. Feb. March
(2) (3) (4) (5) (6) (7) (8) (9) (10)
406 406 406 407 408 410 410 410 409
396 397 396 395 394 397 397 395 395
416 417 418 120 424 420 421 418 420
365 384 383 383 383 379 372 367 368
427 428 427 430 433 433 437 440 441
421 422 4L7 431 436 433 440 436 435
441 439 435 432 444 441 440 441 448
391 393 392 393 395 394 393 392 395
Source :- Centre for Monitoring Indian Economy
67


Table 18.03
Consumer Price Indices for Agricultural Labourers (Base 1986-87=100) "
1.0
States
(1 )
July Aug.
(2) (3)
Sept.
2001
Oct.
(4 ) (5)
Nov.
(6)
Dec.
(7)
Jan.
(8)
2002
Feb.
(9)
March
(10)
Meghalaya 346 348 350 354 359 356 351 350 354
,. Assam
Manipur
321
311
318
312
319
30e
322
305
323
304
324
307
319
300
317
299
319
302
'J
Tripura
All India
317
309
323
312
324
311
328
313
334
313
315
312
313
308
315
308
319
309
Source:- Centre for Monitoring Indian Economy
."
()
(f)


Per Capita Net Domestic Product at Current Prices (New Series)
18000 T------'---~------·-'-·---'--~-----·-,·~·----------'--'-'~-~"--'-"-'~-~._--'._'_.'"---~'.'----~'-'-_.'-_'_-'J
16000
14000
12000
iii 10000
m Co
ri - BODO
6000
4000
2000
Megha/aya Arunachal Pradesh Assam Manipur Nagaland Sikkim Tripura

Table 19.02
Contribution of Agriculture to G.D.P. of North Eastern States ,) (Comparable Estimates at Current Prices based on New Series : 1993-94)
I.,
States~.D.P
i.!.)__ 12\
;v1eglmlaya 249937
Arunachal Pradesh
Assam
'J Manipur
~
Nagaland
Sikkim
Tripura
All India
2280602
224968
232410
65106
329834
1390148
(Rs. In Lakhs)
2001-2002--_. G.S.D.P Agriculture
59S55(R) 293849
152671(R)
65177(H)
41406(R)
0·<'''270
15915C\P)
76389
47206(P)
362695
1/8300(0)
30966((;))
52891(0)
409467 91601
806737
61308
2555791
253095(0)
9;!L~""C ,
73002(U.)
.7.)',~ /8.::<
27403(>\)
969/?,;)O
78614(A)
3000055(0) 968493(0)
50652
20589
106841
387008
238523
75463
381418
1598077
56225
1721CJ
121887
44294
254713 61140
81695 17961
415370(P) 131517(P)
1755638 460547
452442(0)
1895843
142153(0)
471981
:0 Q-Quick Estimate; R- Revised; P- Provisional; A-Advance Estimates
Source:- State Statistical Bureaus
~
71


Table 20.01
NumberoiTourist Spots' ad Tourists.: 2001":2802 '~
Tourist
(I Stales Tourist Spots Indian Foreigners . Total
(1 ) (2) (3) (4) (5)
Meghalaya (2002) 64
Assam NA
'. "
Manipur (2000-01)
Mizoram (2001)
Nagaland
29
35
NA
Tripura 28
2,68,529 3,191 2,71,720
99,73,763 4265 99,78,028 .
1,03,854 409 1,04,263
27417 197 27,614
10,395 438 10,833
2;57,989 2,564 2,60,553.
NA -Information not available \lJ.
Source :- State Statistical Bureaus
~J
73


2001 SI.No. Items Meghalaya All India
t (1 ) (2) (3) (4)
15. Forest area as percentage to total area 42.00 (2060-01) 20.98 (1998-99) ~.
16. Gross irrigated area (000 hectares) 55 (1998-99) 75546 (1998-99)
17. Gross irrigated area per cultivator (hectares) 0.13 (1998-99) 0.68 (1998-99) .
18. Crop yield per hactare (kgs) (a) Rice 1750(2001-02} 1913 (2000-01) (b) Food grains 1684 (2001-02 1636 (2000-01)
19. Per capita availability (gms/day) (a) Cereals 263 (2001-02) 390.4 P (2000-01) (b) Food grains 266 (2001-02) 418..4 P (2000-01)
20. Per capita Income at current prices (Rs.) 15983 (2002-02) AE 16487 (2000-01)
'J. 71. Annual percapita consumption of electricity (Units) 260.2 (2001-02) 360 (1998-99)
2"... Percentage of villages eleCtrified 47.05 (2001-02) 86.32 (1999-2000)
l;l 23. Road density per '00 Sq. kms 40.7 (1998-99) 76.8 (1998-99)
24. Surfaced road length per '00 Sq. kms 20.5 (1998-99) 44.1 (1998-99)
25. No. of Hospitals & Dispensaries per lakh of population 3 (1998-99) 4 (1998)
26. No. of Hospitals & Dipensaries per '000 Sq. kms of area 3 (1998-99) 12 (1998)
27. Employment in public sector as percentage to total employment 88.64 (1999-00) 61.01 (1999-00)
,;, 28. Employment in private sector as percentage to total employment 11.36 (1999-00) 38.99 (1999-00)
29. Credit - Deposit percentage 25.81 (Dec. 2002) 57.74 (Dec. 2002)
30. Bank offices per lakh of population 8 (Dec. 2002) . 6 (Dec. 2002) '('I
p. Provisional, A.E- Advance Estimates
75


Table-23.01 .. .
GENDER related development index of selected Developed and SAARC countries
pi
HOI rank
(1 )
c, J 13
4 (j 18
63
127
139
J; 136
86
143
Gender· related
. Development Index (GDI)
Countries
Rank I Value (2) (3) I (4)
uK 11 0.928
Australia 4 0.938
Germany 15 0.924
Russian 56 0.774
Federation
SAARC countries
India 103 0.574
Bangladesh 112 0.495
Bhutan
Maldives
Nepal 119 0.479
Life expectancy atbirth
(years)
2001
FemaleI Male
(5) I (6)
80.4 75.4
81.9 76.3
81.0 74.9
72.9 60.6
64.0 62.8
60.9 60.1
63.8 61.3
66.3 67.4
58.9 59.4
Adult literacy rate (% age 15
and above)
2001
Female I Male
(7) I (8)
d
EstimatedCombined .'. HOI rank Primary,Second~ ~arned income minus ary and Tertiary PPPU.S. $ GO! rankc
Gross enrolment ratio %
2000-2001" 2001"
Female I Male Female I Male
I (13)(9) (10) (11)T (12)
119ef 105e, 18,180 30,476 2
117ef 112ef 20,830 29,945 o 93' 95' 18,474 32,557 3
99.4d 99.7d 82' 75' 5,6099 8,7959 o
46.4
30.8
69.0
49.9
49th
54
63'h
54
1,531 9
1,1539
4,0709
2,0449
0
0
96.9
25.2
97.1
60.5
79
57
78
70 8679 1,7349 -3 '"r
Cont...
T7


Table 24.01 Promotion of Gender Equality and Empowerment of Women
"
2003
(11 )
21 14
7 ,'J 18 25 32
,,J 8
9 2 9 6
.L~
6
22
.,j'
Ratio of girls to boys a Ratio of Literate Females shares ' Seats in
Name of the country Females to of non -agricul- parliament held
In Primary In In Males (age 15- tural wage by women (as education Second~ Tertiary 24)b employment % % of total)~
ary Educa-Education lion
1990- 2000- 2000-01 2000-01 1990 2001 19~0 2001 1990 91 01
(1 ) (2) (3) (4) (5) (6) (7) (8) (9) (10)
Dev. countries
Canada 0,93 0,95'9 0,96'9 1.27'9 - - 47 49 13
USA 0.94 0.959 0.969 1.279 - - 47 48 7
Japan 0.95 0.959 0.969 0.81 9 - - 38 40 J U.K. 0.96 0.959 1.11 9 1.209 48 50 E:- -Australia 0.95 0.959 0.969 1.199 - - 45 48 6 Germany - 0.949 0.949 0.9009 - - 41 46 -Russian Federation 0.97 0.959 1.039 1.269 1.00 1.00 50 50 -
SAARC countries
India 0.71 0.77'9 0.66'9 0.617'9 0.74 0.82 13 17 5
Bangladesh 0.81 0.96 0.99 0.51 0.65 0.71 18 23d 10
Bhutan - 0.86 0.81 0.52 - - - - 2
Maldives - 0.95 1.05 - 1.00 1.00 - 37d 6
Nepal 0.56 0.79 0.69 0,25 0.41 0.57 - - 6
Pakistan 0.48 0.55 0.63 0.38" 0.49 0.60 7 8 10
Source: (HDR) Human Development Report, 2003
79


\~
'ii"
{
Table 25.01 : Reduce Child Mortality and improvement ofMaternal he.alth :telatingto SAARC Country.
MaternalUnder five mortality Infant mortality rate One year old fully BirthsName of the mortalityrate (per 1000 live (per 1000 live immunised against attended bycountry
(1 )
SAARC Countries
India
Bangladesh
Bhutan
Maldive
Nepal
Pakistan
Sri lanka
World
..
ratio <perbirths)' births)' Measles(%) skilled100,000 live health
births)b Personnel
(%)
19901990 I 2001 I 2001 19951990 I 2001 1995-2001 c
(4 )(2) I (3) I (5) (6) I (7) (8) (9) .
123 93 80 67 56 56 440 43 144 77 96 51 65 76 600 12 166 95 75d 74 93 78 500 15' 115 77 80 58 96 99 390 70 145 91 100 66 57 71 830 11 128 109 96 84 50 54 200 20 23 19 19 17 80 99 60 97 93 81 63 56 72 72 411 60
Source : (HOR) Human Development Report, 2003. . a- The primary agencies responsible .for. these .two Millennium Development goal indicators are the United Nations
Children's Fund (UNICEF) and theWorfd Health Organisation (WHO). The i~ble shows World Bank ~timates, however, because the more recent estimates from UNICEF and the WHO were not ready .for release. The estimates shown are largely consistent with the UNICEF and WHO estimates. (b) Data are estimates based on available national data and adjusted for the well-documented problems of under reporting and misclasSification of maternal deaths or, where national data are are unavailable, model-based estimates. (c) Data refer to the most recent year available during the period specified. (d) Data refer to 1992. (f) Data refer. toa year or period other than that specified, differ from the standard definalion or refer to only part of the country.
81


Table 27.01 : Leading global health ;crises and ~haUenges of few selected developed countries and SAARC countries
-
',11 ~
I
People living with HIV/AIDS Malaria Tuberculosis Cigarette cases (per cases (per Consumption
HDI Adults Women Children 100,000 100,000 per adult· rank Name of the people) people) (annual
country (% age 15- (age 15-49) (age 0-14) 2000d 2001" average) 49) 2001 c 2001 c 2001< 1992-2000'
(1 ) (2) (3) (4) (5) (6) (7) (8)
Developed countries 8 Canada 0,31 14,000 <500 - 3 1,820 7 U,S.A 0,61 180,000 10,000 - 2 2,092 9 Japan <0,10 6,600 110 - 21 2,950 13 UK 0.10 7,400 550 - 5 1,553 4 Australia 0,07 800 140 - 4 1,708 18 Germany 0,10 8,100 550 - 5 1,814 63 Russian Federatic n 0,90 180,000 - 1 93 2,691 SAARC countries 127 India 0.79 1,500,000 170,000 7 199 112 139 Bangladesh <0,10 3,100 310 40 211 234 136 Bhutan <0,10 - - 285 114 -86 Maldives 0,06 - - - 21 -143 Nepal 0.49 14,000 . 1,500 33 135 512 144 Pakistan 0.11 16,000 2,200 58 178 635 99 Sri lanka <0.10 1,400 <100 1,110 50 344
World 1.20 18,500,OOOT 3,OOO,00OT - . 119 -Source : (HDR) Human Development Report 2003
c - Data refer to the end of 2001. Aggregates are rounded estimates, regional totals may not sum to the world total. d - Data ~ refer to malaria case reported to the World Health Organisation (WHO) and may represent only a fraction of the true number
in a country because of incomplete reporting systems, incomplete coverage by health services or both. Because of the diversity of case detection and reporting systems, comparison across countries should be made with caution. e- Data refer to the prevalence of smear-positive cases of tuberculosis. f - Data refer to estimates of apparent consumption based on data on
'.~ cigarette production.
83


Table 29.01 : Ensure Environmental Sustainability : Land and Air
',..'tl~
'....
,t.,.1 ,'j,
Developed countries Canada 26.5 26.5 - 2.5 3.3 15.4 14.4 13,174 (. ) USA 24.3 24.7 0.17 3.0 4.2 19.3 19.7 198,308 2,805 Japan 63.9 64.0 0.07 5.3 6.1 8.7 9.1 97.723 6 Australia 20.5 20.1 - 3.2 4.3 15.6 18.2 7,416 6 UK 10.9 11.6 0.20 4.4 6.0 9.9 9.2 k k Germany 30.7 30.7 0.31 4.0 6.1 11.1g 9.7 k k
!.. J ..J. Russian 50.3 50.4 0.03 1.4" 1.6 13.3" 9.8 98,752 0 °'11 Federation
SAARC countries .6," 'j('.'!1 ~~ India 21.4 21.6 0.05 3.8 5.5 0.8 1.1 4,358d 5,614" Bangladesh 9.0 10.2 0.01 8.1 10.8 0.1 0.2 195 805" Bhutan 64.2 64.2 0.25 0.2 0.5 Maldives 3.3 3.3 0.7 1.7 4 14 Nepal 32.7 27.3 0.09 2.6 3.7 (.) 0.1 209 94"
Name of
the country
Land area covered by forests (%)
Ratio of protected
area to surface
;:\rp';:\b
GOP per unit of energy use (PPPUS$
per kg of oil equivalent)
1990 I 2000 (5) I (6)
Carbondioxide emissions per
capita (Metric tons)
1990 I 1999 (7) I (8)
Consumption of ozone depleting
chlorofluoro carbon (OOP metric tons)C
1990 I 2001 (9) I (10)
1990 I 2000 2003 (1 ) (2) I (3) (4)
t,) ,,..),,
Source : (HDR) Human Development Report, 2003 a) The World Health Organisation is collecting country data for another indicator under this target, the proportion of the population using solid fuels to be published in WHO Report 2003. b) Refers to Ratio of area protected to maintain biological diversity to surface area. Surface area is a country's total area, including areas under inland of water and some coastal water ways but excluding sea areas. Data for some countries including overseas territories. c) Data refers to chlorofluorocarbon controlled under the Montreal protocol on substances that deplete the ozone layer. Measured in metrix tons multipied by a factor of ozone depleting potential. d) Data refer to 1989. e) Data refer to 2000. f) Data refer to 1998. g) Data refer to 1991. h) Data refer to 1992. k) No data are available for individual member countries of the European Union (EU)
85


