Research Review No. 61 December 2006 Price: £5.00 Wheat as a feedstock for alcohol production by T C Smith 1 , D R Kindred 1 , J M Brosnan 2 , R M Weightman 1 , M Shepherd 3 , & R Sylvester-Bradley 1 1 ADAS, Boxworth, Cambridge CB23 4NN 2 Scotch Whisky Research Institute, The Robertson Trust Building, Research Park North, Riccarton, Edinburgh EH14 4AP 3 Green Spirit Fuels Ltd., Henstridge Trading Estate, The Marsh, Henstridge, Templecombe, Somerset, BA8 0TN This is the final report of a twelve month project, which started in July 2004. The project was funded by a contract of £26,000 from HGCA (Project No. 3018), £14,200 from Wessex Grain Ltd., £10,200 from Monsanto UK Ltd and £2,550 from International Centre for Brewing and Distilling, making a total of £63,160. The Home-Grown Cereals Authority (HGCA) has provided funding for this project but has not conducted the research or written this report. While the authors have worked on the best information available to them, neither HGCA nor the authors shall in any event be liable for any loss, damage or injury howsoever suffered directly or indirectly in relation to the report or the research on which it is based. Reference herein to trade names and proprietary products without stating that they are protected does not imply that they may be regarded as unprotected and thus free for general use. No endorsement of named products is intended nor is it any criticism implied of other alternative, but unnamed, products.
Transcript
Research Review No. 61 December 2006 Price: £5.00
Wheat as a feedstock for alcohol production by
T C Smith1, D R Kindred1, J M Brosnan2, R M Weightman1, M Shepherd3, & R Sylvester-Bradley1
1ADAS, Boxworth, Cambridge CB23 4NN 2Scotch Whisky Research Institute, The Robertson Trust Building,
Research Park North, Riccarton, Edinburgh EH14 4AP 3Green Spirit Fuels Ltd., Henstridge Trading Estate, The Marsh, Henstridge,
Templecombe, Somerset, BA8 0TN This is the final report of a twelve month project, which started in July 2004. The project was funded by a contract of £26,000 from HGCA (Project No. 3018), £14,200 from Wessex Grain Ltd., £10,200 from Monsanto UK Ltd and £2,550 from International Centre for Brewing and Distilling, making a total of £63,160. The Home-Grown Cereals Authority (HGCA) has provided funding for this project but has not conducted the research or written this report. While the authors have worked on the best information available to them, neither HGCA nor the authors shall in any event be liable for any loss, damage or injury howsoever suffered directly or indirectly in relation to the report or the research on which it is based. Reference herein to trade names and proprietary products without stating that they are protected does not imply that they may be regarded as unprotected and thus free for general use. No endorsement of named products is intended nor is it any criticism implied of other alternative, but unnamed, products.
1
CONTENTS
Abbreviations........................................................................................................................................3 Acknowledgements ...............................................................................................................................4 Abstract .................................................................................................................................................5 Executive Summary..............................................................................................................................6 List of Figures .......................................................................................................................................9 List of Tables.......................................................................................................................................10 1.0 Introduction ..................................................................................................................................11
1.1 Potable, Industrial and Fuel Markets..........................................................................................11 1.2 Why Biofuels?............................................................................................................................11 1.3 Alternative Fuels ........................................................................................................................12 1.4 World Biofuels ...........................................................................................................................13 1.5 The UK Biofuels Market............................................................................................................13 1.6 Feedstock Types.........................................................................................................................14 1.7 Environmental Impacts and Carbon Assurance of Biofuels ......................................................16 1.8 Conclusion .................................................................................................................................17
2.0 The Alcohol Production Process .................................................................................................18 2.1 Milling........................................................................................................................................19 2.2 Liquefaction/ Gelatinisation.......................................................................................................20 2.3 Saccharification..........................................................................................................................20 2.4 Fermentation ..............................................................................................................................21 2.5 Distillation and Dehydration ......................................................................................................21 2.6 Stillage Separation .....................................................................................................................21 2.7 Co-Products................................................................................................................................21 2.8 Process Integration .....................................................................................................................25 2.9 Conclusion .................................................................................................................................26
3.0 Feedstock Quality .........................................................................................................................27 3.1 Alcohol Processing Yield...........................................................................................................27 3.2 Effect of Feedstock on Alcohol Yield........................................................................................29
3.2.1 Amount of Starch and Sugars .............................................................................................32 3.2.2 Starch Conversion Efficiency..............................................................................................33 3.2.3 Fermentation Efficiency......................................................................................................37 3.2.4 Non-Starch Polysaccharides – Effects on Processing Efficiency .......................................38
3.3 Assessing Feedstock Quality......................................................................................................39 3.3.1 Direct Alcohol Measurements ............................................................................................40 3.3.2 Direct Starch Measurements ..............................................................................................40 3.3.3 Protein Measurements ........................................................................................................44 3.3.4 Indirect Measurements .......................................................................................................45 3.3.5 Tests for Processing Efficiency...........................................................................................46
3.4 Implications of Feedstock on Co-Product Quality .....................................................................46 3.5 Current Wheat Grain Feedstock Specifications .........................................................................47
3.6 Conclusion .................................................................................................................................48 4.0 Agronomic Effects on Variation in Feedstock Quality .............................................................50
4.1 Genetic Differences in Feedstock Quality .................................................................................50 4.1.1 Cereal Species ....................................................................................................................50 4.1.2 Modern Wheat Varieties .....................................................................................................52 4.1.3 Hard vs Soft Wheats............................................................................................................59 4.1.4 The 1BL/1RS Translocation................................................................................................59 4.1.5 Future Breeding and Genetic Improvement .......................................................................59
2
4.1.6 Conclusions on Varietal Effects..........................................................................................60 4.2 Environment and Management Effects ......................................................................................60
4.2.1 Year and Site Variation.......................................................................................................61 4.2.2 Location (North vs South)...................................................................................................63 4.2.3 Soil Type .............................................................................................................................64 4.2.4 Management .......................................................................................................................64 4.2.5 Crop Establishment.............................................................................................................66 4.2.6 Crop Nutrition ....................................................................................................................66 4.2.7 N Timing .............................................................................................................................70 4.2.8 Crop Protection ..................................................................................................................70 4.2.9 Harvesting and Drying .......................................................................................................71 4.2.10 Conclusions on Effects of Environment and Management ...............................................72
5.0 Final Perspective...........................................................................................................................73 6.0 Glossary.........................................................................................................................................77 7.0 References Cited ...........................................................................................................................81
3
Abbreviations CO2 Carbon Dioxide
DDGS Distillers Dried Grains with Solubles (alternatively Distillers Dark Grains with
Solubles)
Defra Department for Environment Food and Rural Affairs
DM Dry Matter
ETBE Ethyl tertiary butyl ether
GHG Greenhouse Gas
GJ Giga Joules
GLC Gas Liquid Chromatography
ha hectare
HCl Hydrochloric Acid
HFN Hagberg Falling Number
HGCA Home Grown Cereals Authority
HPLC High Performance Liquid Chromatography
l litre
N Nitrogen
N2O Nitrous Oxide
NABIM National Association of British and Irish Millers
NIR Near Infrared Reflectance
NL1, NL2 National List 1, National List 2
NSP Non-Starch Polysaccharides
RL Recommended List
RTFO Renewable Transport Fuels Obligation
SEERAD Scottish Executive Environment and Rural Affairs Department
SWRI Scotch Whisky Research Institute
t tonne(s)
4
Acknowledgements
This research review has built on on-going work from the GREEN grain project (HGCA
Project 2979). The GREEN grain project is supported by Defra and SEERAD through the Sustainable
Arable LINK programme, with HGCA, Syngenta, FOSS UK, Scotch Whisky Research Institute,
ADAS, Scottish Crops Research Institute, Grampian Country Foods and Wessex Grain/ Green Spirit
Fuels as project partners.
The authors acknowledge the use of data from the HGCA-funded Recommended Lists
(http://www.hgca.com/varieties) Table 7 and Figure 8.
The authors would like to thank HGCA and the GREEN grain collaborators for their useful
comments on drafts of this report.
5
Abstract
UK fuel-alcohol production from wheat is expected to begin in 2008. If current plans are
realised, this requirement will soon add at least 2.5 million tonnes of grain to the 0.7 million tonnes
already required for potable alcohol. Other fuel-alcohol markets are based on sugar cane or maize, so
wheat-based production methods are not well-developed.
Information is reviewed here to support industry development and to identify R&D
requirements on growing wheat for alcohol production. Initially, growing and processing will be
based on feed wheat standards, but as expertise develops and as carbon accreditation is introduced,
criteria will be applied to maximise alcohol yields and processing efficiency.
‘Benchmarks’ proposed for current production of fuel-alcohol from UK feed wheat (dry
basis) are 7.4 t/ha grain, 11.5% protein, 69% starch, 3% sugar to yield 435 litres alcohol per tonne or
3,220 litres per hectare. Variation in alcohol production per hectare largely arises in the field through
differences in grain yield and starch content; new plant breeding initiatives and better use of N
fertilisers should improve these parameters and reduce variation in alcohol yield. Efficiency of fuel
alcohol processing can also be enhanced. It is expected that best practice will soon exceed 4,000
litres alcohol per hectare, and that this will continue to increase through new R&D.
6
Executive Summary
Rationale
There is an increasing consensus word-wide that biofuels can help to mitigate climate
change, and also improve security of fuel supplies; EU and UK legislation now reflects this. Wheat
has the credentials to become the principal feedstock for the EU’s emerging fuel-alcohol market.
Wheat produces more harvestable starch than any other UK crop and UK wheat yields are amongst
the highest in the world. Just as the UK is an important producer of potable alcohol, the UK could
become a major fuel-alcohol producer, and even an exporter.
Major fuel alcohol markets are not based on wheat: Brazil uses sugar cane and the US uses
maize, so the technologies for fuel alcohol production are not yet well-tailored to wheat. This review
considers evidence from biofuels industries elsewhere and from the potable-alcohol industry in the
UK, and suggests how wheat may best be grown and processed into fuel-alcohol in the UK,
highlighting the key uncertainties for which R&D should prove beneficial.
Alcohol production
More than 90% of the UK’s neutral spirit and grain whisky production is from wheat.
Specific varieties with soft grain are sourced from northern Britain, where conditions maximise grain
starch content. Milled grain is cooked and the gelatinised starch is hydrolysed to sugars by amylases
from barley malt; then the sugars are fermented to alcohol and carbon dioxide, and the alcohol is
distilled. Processing takes about 100 hours and has an apparent efficiency of substrate-alcohol
conversion of about 84% although approximately half of this under-recovery is due to loss of sugars
in yeast growth during fermentation.
The fuel-alcohol market will be larger; cost-efficiency will be more crucial; and
environmental constraints may apply, particularly to maximise greenhouse gas (GHG) savings with
respect to petrol. Thus feedstocks giving higher alcohol yields and increased processing efficiency
are beneficial. Grain processing for bioethanol differs from whisky production in that exogenous
nutrients and fungal enzymes may be used to improve processing efficiency, and the distillate must
be dried further, often by molecular sieves. The remaining material, once dried, forms ‘DDGS’, used
as a high protein feed for ruminants. Current fuel alcohol processes take about 60 hours, but their
efficiency is not known.
7
Feedstock demand and specification
Fuel alcohol production will begin in the UK late in 2007, firstly from sugar beet. It is
anticipated that fuel alcohol production from wheat will begin early in 2008. At present new plants
are planned in Somerset, Northants, Humberside and Teeside to process about 2.5 M tonnes grain
into 0.66 M tonnes bioethanol, so wheat will be sourced throughout the UK. Initially, quality
standards are likely to be similar to feed wheat, but as expertise develops and as carbon accreditation
is introduced, specifications are likely to include criteria that indicate alcohol processing yield and
efficiency. Because methods for starch analysis are unreliable, these specifications are likely to be
based on near-infrared (NIR) spectroscopy, possibly referenced against protein content. NIR
calibrations are currently being developed. Data from the potable-alcohol industry indicate that
protein content accounts for much of the variation in alcohol processing yield. Protein content is
largely associated with variation in growing conditions, alcohol decreasing by about 7 litres per dry
tonne for every 1% increase in grain protein. Taking a ‘benchmark’ UK feed wheat (on a dry basis)
as having 11.5% protein, 69% starch and 3% sugar, the benchmark alcohol yield (at 92% efficiency)
can be taken as 435 litres per tonne. Processing yields from recent laboratory tests (using potable
methodology) vary between 410 and 480 litres ethanol per tonne. Feedstock quality also affects
processing rate and efficiency, particularly by changing the viscosity of intermediaries and residues,
but efficiency is rarely estimated.
Feedstock supply
Wheat grain best suited to biofuel production has large well-filled grains with low protein
content, low residue viscosity, and no fungal contamination. Soft wheats, and varieties without the
1BL/1RS rye translocation, have been preferred for potable alcohol production, but whilst these
varieties are likely to be easier for bioethanol producers to process, the use of chemicals and enzymes
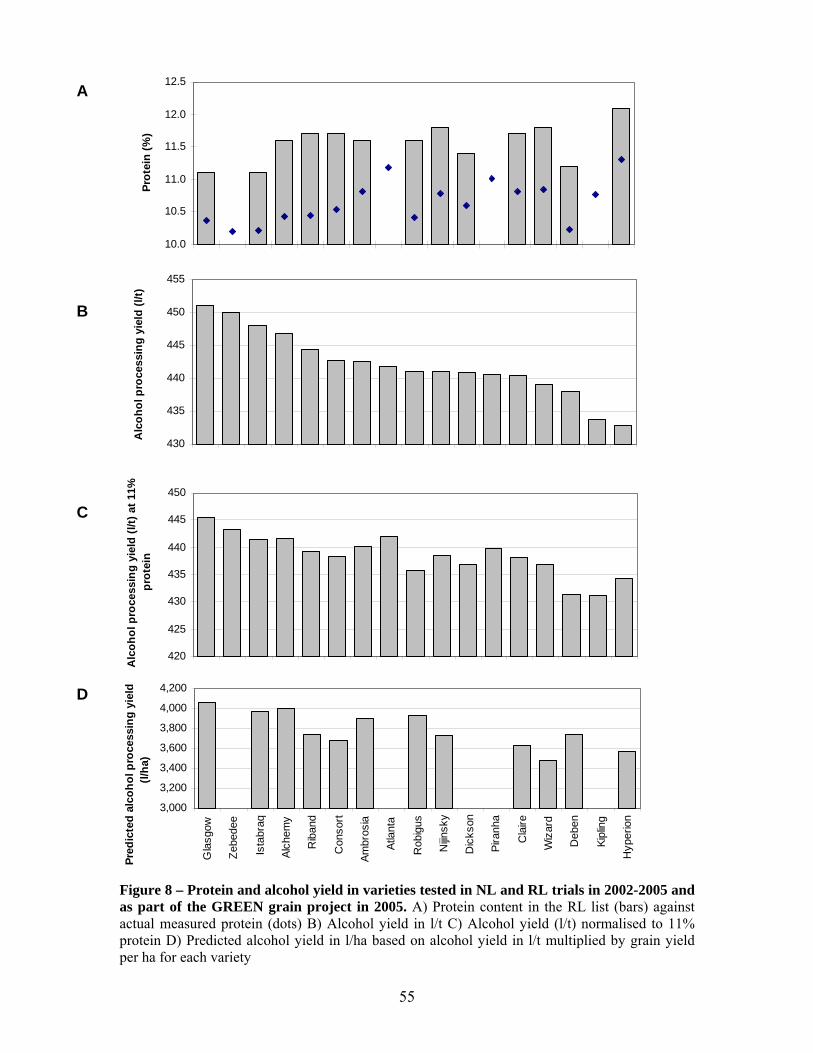
may make this preference less important. Some of the highest yielding varieties also happen to be
best suited to alcohol processing: Glasgow, Alchemy and Istabraq. However, high growing costs (per
tonne) of low yielding varieties such as Riband, despite good suitability to alcohol processing, render
them poorly suited to fuel-alcohol production.
Alcohol production from the best varieties grown in the best UK conditions is likely to
exceed 4,000 litres alcohol per hectare. This compares favourably with other cereal-based biofuel
production systems in other parts of the world. Initially, growing wheat for the UK fuel alcohol
market is likely to be very similar to that for other markets, productivity being crucial. Best
8
conditions will be on moisture-retentive soils, following a break crop. However, as the fuel alcohol
industry develops and as carbon accreditation is applied, premiums and/or other economic
instruments will probably serve to maximise feedstock quality, particularly processing yields, and to
minimise carbon emissions. On farm, the main ways that crop managers can influence feedstock
quality are through variety choice and nitrogen management. Further research is seeking to optimise
production strategies for GHG saving.
Recommendations
The industry urgently needs:
(i) wider testing of recommended and candidate varieties,
(ii) research on crop management, especially rotations and use of N fertilisers,
(iii) laboratory-scale processing facilities that can test feedstocks using fuel-alcohol
methodology,
(iv) research to define the fermentable constituents of wheat grain, and their interactions
with unfermentable constituents (mainly non-starch polysaccharides),
(v) methods to maximise rate and efficiency of processing, especially with regard to
energy use,
(vi) investigation of maximising existing and novel uses for co-products, and
(vii) an economic appraisal of how the supply chain could best be optimised to maximise
alcohol production, financial returns for growers and processors, and GHG emission
savings.
9
List of Figures
Figure 1 Overview of the basic ‘dry grind’ process of fuel alcohol production………………….. 18
Figure 2 Theoretical efficiency of starch conversion to glucose and glucose conversion to
ethanol……………………………………………………………………………………
27
Figure 3 Alcohol yields of grain samples from RL variety trials against protein
content……………………………………………………………………………………
29
Figure 4 Overview of the principle factors affecting alcohol processing yield and the main
stages of processing at which they act…………………………………………………..
31
Figure 5 Relationship of alcohol processing yield to starch and protein content of the grain……. 33
Figure 6 Structure of glucose and amylose and amylopectin in starch…………………………… 34
Figure 7 Overview of the enzymatic and acid hydrolysis methods of quantifying starch………... 41
Figure 8 Protein and alcohol yield in varieties tested in NL and RL trials 2002-2005…………… 55
Figure 9 Residue viscosity and alcohol yield measured by SWRI on RL varieties………………. 57
Figure 10 Response of alcohol yield of different varieties to protein concentrations across
varieties across sites within a year……………………………………………………….
58
Figure 11 Response of alcohol yield to protein content across varieties at different sites within a
year……………………………………………………………………………………….
62
Figure 12 Response of alcohol yield to protein content grouped by growing region……………… 63
Figure 13 Relative costs of growing a crop of wheat yielding 8 t/ha in terms of energy and money 64
Figure 14 Standard yield response of wheat grain to N fertiliser…………………………………... 67
Figure 15 Effect of N fertiliser on grain protein and alcohol processing yield……………………. 68
Figure 16 The effect of N fertiliser on alcohol production per ha…………………………………. 69
10
List of Tables
Table 1 Nutritional composition of wheat grain and wheat DDGS………………………….…... 23
Table 2 Maximum inclusion levels of DDGS as a percentage of total feeds for various
livestock at different growth stages……………………………………………………...
23
Table 3 Approximate energy use in bioethanol sub-processes……………………………… 25
Table 4 Benchmark comparison of UK feed wheat……………………………………………… 28
Table 5 Percentage of amylose and amylopectin in starches from a variety of crops…………… 35
Table 6 Starch content and extrapolated alcohol levels of production for several cereal species
grown in the UK…………………………………………………………………………
51
Table 7 Variety information from the HGCA RL 2006-2007…………………………………… 53
Table 8 Number of sites tested for alcohol yield by SWRI in each year for each variety in the
period 2002-2005………………………………………………………………………...
54
11
1.0 Introduction Wheat is expected to become a major biofuel crop in the UK over the next few years. This
review aims to support the rapid development of expertise that will be required by summarising
information on the production process, best types of grain, and the varieties and agronomic practices
that are likely to provide the best wheats for alcohol production and point to the research and
development that is needed.
1.1 Potable, Industrial and Fuel Markets
Wheat markets have traditionally been those for milling (principally for bread and biscuit
making), and those used for feed and for brewing and distilling. Research effort has been primarily
targeted towards identifying varietal traits and agronomic practices that maximise yield and desirable
characteristics for the bread making industry, such as high grain protein content. Characteristics
desirable for bread making are not necessarily beneficial for the bioalcohol industry where high grain
starch content is advantageous (Loyce and Meynard, 1997).
The potable alcohol industry (which produces whisky, gin and vodka spirits) provides a
stable market for around 700,000 tonnes of UK wheat per annum and is a significant contributor to
UK tax and export revenue. Alcohol production for transport (fuel alcohol) is a growth industry
throughout the world, and UK fuel alcohol production is expected to begin in 2007. Bioalcohol may
also be potentially used in industrial applications as a solvent and in cosmetics and toiletries market,
although the potential size of this market is unclear (Batchelor et al., 1993).
Wheat is expected to be the major feedstock for the UK alcohol industry. It is therefore
important to determine the varietal traits and agronomic practices influencing alcohol production.
This review principally considers wheat as a feedstock from the perspective of fuel alcohol, but make
full use of information developed by the potable alcohol industry and so will also be useful for
growers for the existing industry.
1.2 Why Biofuels?
The world is facing an energy crisis. In the past fossil fuels such as gas, oil and coal were
both cheap and readily available and were the preferred global energy source. Fossil fuels are finite;
taking millions of years to form and, with increasing global energy demands, supplies of fossil fuels,
which made up 80% of global energy usage in 2001, are rapidly declining (World Resources
Institute, 2005). At present, fossil fuel prices and supplies are increasingly unstable. At the time of
12
writing, prices of crude oil are at an all time high and supplies often come from politically unstable
countries, compromising security of supply. On top of this, climate change is now recognised as one
of the most serious issues affecting the world, and mitigation is essential to avoid the worst social,
into the atmosphere the carbon dioxide (CO2) originally sequestered through photosynthesis by
plants. Since CO2 is a greenhouse gas (GHG), this significantly contributes to climate change.
Alternative sources of energy are necessary which do not harm the environment and are renewable. It
is likely that a comprehensive approach, utilising a number of energy sources such as biomass,
nuclear, wind and solar power will be required. Transport currently accounts for more than 30% of
total EU energy expenditure, and 98% of the transport sector is dependent upon oil (EU, 2003).
Biofuels are substances produced from crops that can be used as fuels. Increasing use of liquid
biofuels such as bioethanol and biodiesel is a key measure to reduce the environmental costs of
conventional fuels and to improve security of supply.
1.3 Alternative Fuels
There are several renewable fuels that could potentially replace or be used in addition to
conventional fossil fuels. The most economically viable at present are bioethanol and biodiesel.
Bioethanol is produced by fermentation of sugars by yeast and can be made from any sugar or starch
rich feedstock. Biodiesel is produced from oil-rich crops such as oilseed rape, palm oil and soya oil.
Both bioethanol and biodiesel can be utilised in existing engines without modification as low blends,
typically 5% biofuel to 95% conventional fuel. Specialised cars, known as flexible fuel vehicles, can
utilise blends of up to 85% ethanol to 15% petrol. Because ethanol is hygroscopic care is needed to
prevent water from entering the supply chain. Distribution of petrol-ethanol blends can therefore be
problematic, particularly in the UK where the major oil companies share an integrated supply system.
These issues however are not insurmountable, as evidenced by the use of ethanol blends in other
countries, and their supply by independent fuel companies in the UK.
ETBE (ethyl tertiary butyl ether) is derived from ethanol (47% v/v) by reaction with
isobutylene (a petroleum by-product) (European Fuel Oxygenates Association, 2006a). Because it is
almost half bioethanol, ETBE qualifies for the same tax incentives as other biofuels (European Fuels
Oxygenates Association, 2006b) and it can be blended up to 15% with petrol without modification of
either the supply chain or engines (European Fuels Oxygenates Association, 2006a) NOT IN REFS.
An estimated 2 million tonnes of ETBE were produced in the EU in 2005 (Eur’Observ’ER, 2006).
13
1.4 World Biofuels
Bioethanol has been a major fuel source in Brazil and the USA for decades. The ProAlcool
programme was introduced in Brazil in 1975 in response to the energy crises of the 1970s and as a
market for surplus sugar cane. All fuel in Brazil contains at least 25% biofuel and approximately 2.4
million cars in Brazil are able to utilise pure alcohol (Szwarc, 2004). A similar programme was
initiated in the USA in 1979 (Wheals et al., 1999). In the USA, bioethanol is largely produced from
corn (maize) due to its abundance and low cost (Bothast and Schlicher, 2005). Brazil and the USA
together accounted for nearly 90% of global bioethanol production in 2005, whilst European
production was estimated at 720,927 tonnes (Eur’Observ’ER, 2006) accounting for only 2.8% of
global production (BP, 2006).
The biofuels industry has been developing rapidly in the EU. The EU Biofuel Directive
(2003/30/EC) set a target for 2% by energy of biofuel in transport fuels by 2005, 5.75% by 2010 and
up-to 20% substitution of conventional fuels by biofuels by 2020 and has provided a major driver for
biofuel expansion in the EU (EU, 2003). Tax exemption policies have further encouraged this sector
in many EU states; Sweden and Spain have total exemption and France and the UK have partial
exemption (Eur’Observ’ER, 2006). The bioethanol sector is developing rapidly in Europe; production
grew by 70.5% between 2004 and 2005 (Eur’Observ’ER, 2006). Spain is Europe’s largest bioethanol
producer accounting for 0.9% of global production in 2005, followed by Germany (0.5%), Sweden
(0.5%) and France (0.4%) (BP, 2006).
1.5 The UK Biofuels Market
Biofuels made up only a negligible amount of total fuel sales in the UK until recently and to
date, UK production has centred exclusively on biodiesel production. Growth of the biofuels sector
has been promoted by relatively high crude oil prices, government policy and tax incentives.
A renewable transport fuels obligation (RTFO) has been announced by the UK government
as a method of ensuring the long-term promotion of biofuels supply and usage. The RTFO will place
a legal obligation on transport fuel suppliers to acquire a specified proportion of their fuel from
renewable sources – from 2008 transport fuel should contain a renewable component, 2.5% by 2008,
3.75% by 2009 and by 2010/11 all transport fuels should contain at least a 5% biofuel component by
volume. A 5% biofuel blend is estimated to save 1 million tonnes per annum in CO2 and is
equivalent to taking 1 million cars from the road (Department of Trade and Industry, 2006). Biofuels
are usually more expensive to produce than their fossil fuel counterparts and require support to make
them competitive. Since 2002 a 20p / litre (l) duty exemption has been in place for biodiesel fuels and
14
an equivalent incentive was introduced in December 2005 for bioethanol (Department for Transport,
2005).
The standard EN228 unleaded petrol specification permits up to 5% ethanol inclusion (either
bio or fossil derived) and so, with blends up to this level there are no vehicle warranty issues as it is
still classed as standard petrol. Tesco have been using ethanol at up to 5% blends when profitable to
do so at over 185 forecourts in the UK (Tesco, 2006). Morrisons sell an 85% ethanol blend for flexi-
fuel cars, such as the Ford Focus and Saab 9-5, at a limited number of sites in Somerset and East
Anglia (Morrisons, 2006). Independent fuel blenders such as Greenergy, Futura (now called Harvest
Energy) and Mabenaft tend to rely on imported petrol components (presently all from Brazil) that
they blend within import terminals and then distribute by road.
The major oil companies are less eager to incorporate ethanol into fuel because it would
require alterations to both the supply chain and storage facilities. The fuel used by the major oil
companies is distributed via a shared pipeline to 42 storage terminals across the UK. They then
collect fuel by road tanker for local distribution. The same pipeline is used to carry several oil
products. Because ethanol is a solvent that cleans accumulated residues from the pipes (causing fuel
contamination), as well as picking up any water accumulations, the oil majors are reluctant to use
ethanol in their petrol. Furthermore, when changing over to an ethanol blend it is desirable to clean
out the water from petrol storage tanks. The problem of water build up in petrol tanks is usually
associated with older distribution facilities with low fuel turnover. Therefore supermarkets with
modern storage tanks and very high throughputs are less likely to suffer from water build up
problems.
No bioethanol is presently produced in the UK so it is imported from abroad. However,
several bioethanol plants are at various stages of development and UK bioethanol production is
expected to begin in late 2007. If all of these come to fruition, around least 2.5 million tonnes of
wheat will be needed for bioethanol production and UK production will provide at least 2.6% of
predicted petrol demand by 2010.
1.6 Feedstock Types
Bioethanol is a colourless alcohol produced from the fermentation of sugar substrates to
ethanol by yeast via pyruvate and acetylaldehyde intermediates. Sugars are derived from sugar crops
such as sugar cane and sugar beet and starch crops such as barley, wheat and maize. Cellulose is also
a potential source of glucose for alcohol production. In the future, lignocellulosic materials such as
15
forestry residues, straw or woody perennials such as miscanthus and short rotation coppice (willow or
poplar) may be used in ethanol production. Although technology exists, there are no commercial
plants for ethanol production from lignocellulosic materials at present anywhere in the world because
current processes are uneconomic.
Feedstocks used for alcohol production vary throughout the world depending upon the
climatic conditions and prices. Cereal grains are an attractive feedstock because grains contain a high
proportion of starch and can be stored dry for many months, allowing year round processing. Maize
(corn) is used extensively in the USA with lesser amounts of wheat and sorghum. In 2003, 10% of
the US maize crop was utilised by the bioethanol industry and this provided 2% of US transport fuels.
Rye is used extensively in German and Polish bioethanol plants, while substantial amounts of
triticale, a hybrid of rye and wheat, are used in Sweden (Senn and Pieper, 2000).
Sugar cane is available year round in Brazil, so the Brazilian bioethanol industry almost
exclusively utilises sugar cane. Despite their relatively high starch and sugar contents, crops such as
potatoes and sugar beet are less viable at current prices and growing costs for large-scale alcohol
production in the UK. Potatoes contain 75% water and 25% dry matter comprising 12-21% starch
(Senn and Pieper, 2000). The high water content of potatoes relative to dry matter makes them bulky
and therefore expensive to transport and store. Potatoes would require long storage for year round
supply. Unlike cereals, the starch content of potatoes decreases with storage time, with an 8%
decrease in starch after 6 months and a 16.5% decrease after 8 months (Senn and Pieper, 2000).
Sugar beet contains approximately 16% sugar but as for potatoes, it has a high water content leading
to expense in transportation and storage. Harvested crops must be kept below 10°C or respiration will
utilise some of the sugars. British Sugar plan to utilise sugar beet for bioethanol production from
2007 at their Wissington site in Norfolk (Tony Sidwell, British Sugar, personal communication;
British Sugar, 2006), but production will be seasonal because at present it appears that they do not
plan to augment beet supplies with wheat.
With the exception of the British Sugar plant at Wissington, all of the planned UK bioethanol
production facilities plan to use wheat as their primary feedstock (Table 1). Wheat is the most
economically viable feedstock for UK bioethanol production at present, although alternatives such as
triticale or imported maize may also be used in the future. Wheat made up 1,868 thousand hectare
(ha) out of 4,427 thousand ha (or 42%) of arable crops in 2005 (Department for Environment Food
and Rural Affairs (Defra, 2006). An estimated requirement for 25 million tonnes of petrol in 2010
and the RTFO of 5% renewable component into fuels would require 1.25M tonnes of bioethanol,
16
assuming the obligation is equally split between petrol and diesel. One tonne of wheat produces 0.29
tonnes of bioethanol. Therefore approximately 3 million tonnes of wheat would be needed per annum
to meet the requirements of the RTFO from UK production. The UK currently has an export surplus
of approximately 2 million tonnes of wheat per annum (Home-Grown Cereals Authority (HGCA),
2006a) which therefore could make up much of the requirement. In reality, at least some of the
bioethanol required to meet the RTFO will be imported.
1.7 Environmental Impacts and Carbon Assurance of Biofuels
There has been considerable debate around the issue of environmental impacts of fuel alcohol
production, both in terms of potential GHG savings and broader sustainability issues. The carbon
released from combustion of biofuels is equivalent to that taken up by the plant in its growth and
hence is carbon neutral. However, much energy can be used in the growing of crops, transport of
feedstocks and the processing of the biofuel, with associated GHG emissions. In addition, further
effects on factors such as carbon stocks and nitrous oxide (N2O) emissions from soils can be
important in determining the overall GHG benefits of biofuels, as can the fate of co-products from
growing the crop and processing the feedstock. Life cycle analysis has therefore been used to
quantify the energy costs and GHG emissions associated with biofuels from ‘cradle to grave’. Most
studies have concluded that biofuels can deliver savings in GHG emissions relative to fossil fuels,
though these savings are sometimes found to be small and are obviously dependent on how the crop
is grown, the processing technology used and the fate of co-products (Elsayed et al., 2003; Mortimer
et al., 2004; Punter et al., 2004; Billins et al., 2005; Farrell et al., 2006; Hill et al., 2006) although the
benefits of biofuels have been questioned by some (Patzek, 2006). Studies on wheat for bioethanol
production in the UK have suggested that CO2 emissions could be reduced by more than 77% relative
to petrol, or less than 7% relative to petrol (Punter et al., 2004, Woods et al., 2005). In order to help
quantify the GHG emissions associated with the production of bioethanol from wheat, and to
optimise crop management practices, the HGCA has developed a GHG calculator (www.hgca.com)
and is developing methods for carbon assurance schemes that could work operationally (Billins et al.,
2005; Woods et al., 2005). This work is being continued under the HGCA project “Facilitating
Carbon Accreditation Schemes for Biofuels: Feedstock Production”.
HGCA-funded research has shown that growing wheat for bioethanol is unlikely to have
negative environmental impacts compared to existing food farming systems in the UK, and, if
growing for biofuels is associated with lower inputs of fertiliser, there could be environmental
benefits relative to conventional cropping (Turley et al., 2005).
17
1.8 Conclusion
Bioethanol production in the UK is expected to begin in 2007. The majority of planned
bioethanol plants will utilise wheat as their primary feedstock and this will significantly increase the
market for wheat in the UK. Bioethanol is widely used world wide as a renewable component of
fuels; however, few world regions currently use wheat as a feedstock. Therefore technology needs to
be developed from the potable alcohol expertise and expertise from other feedstocks in other parts of
the world and applied to wheat.
18
2.0 The Alcohol Production Process
Ethanol can be derived from any substance yielding fermentable sugars. The nature of the
feedstock affects how sugars are obtained. Sugars can be obtained directly from crops such as sugar
cane, sugar beet and fruits simply by crushing the material and extracting the juice. Feedstocks
containing starch such as wheat and maize must first be treated with the enzymes α-amylase and
amyloglucosidase to break down the starch to glucose. Lignocellulosic materials such as wood, paper
and straw require extensive pre-treatment using chemicals and / or high pressure and high
temperature treatments; cellulases are then added to break down the cellulose biopolymer to its
constituent sugars.
A schematic overview of the process from grain to fuel alcohol is shown in Figure 1. The
exact production process may vary depending upon individual circumstances; typical modifications
are described in the following sections. The process for potable alcohol is broadly similar to that for
fuel alcohol but differs in additives that can be used. Fuel alcohol can use commercial enzymes and
chemicals, neutral alcohol can use commercial enzymes for saccharification but no chemicals
whereas grain whisky production is constrained to using only grains, yeast and water so no chemicals
and commercial enzymes are used.
Figure 1 - Overview of the basic “dry grind” process of fuel alcohol production. The products ethanol, DDGS and CO2 are produced in approximately equal amounts by weight.
Grain
Milling
Liquefaction
Saccharification
Fermentation
Stillage SeparationDistillation
Dehydration
Ethanol
DDGS
CO2
Heat, Enzyme, Water
Enzyme
Yeast
19
The following subsections briefly describe each step outlined in Figure 1, from the perspective of
possible effects of feedstock on the process. For a detailed description of the process of alcohol
production the reader is referred to “The Alcohol Textbook” edited by Jaques KA, Lyons, TP and
Kelsall, DR (2003). 2.1 Milling
The milling process increases the grain surface area, allowing more effective slurrying,
cooking and liquefaction and more effective enzymatic breakdown of starch. In the USA where
maize is the main feedstock for bioethanol production, milling of grains for bioethanol production
may be carried out by either a “dry grind” or a “wet grind” process. Analogous processes can be
considered for wheat, but the two species process quite differently. With a “dry grind”, the whole
grain is milled without any separation of grain components. This is the cheapest and most common
process found in existing bioethanol production facilities, and is also common in potable alcohol
distilleries. It is most likely that the planned bioethanol plants in the UK will use a simple dry grind
process, starting with whole-wheat grain.
It should be noted that considerable process efficiencies might be achievable when designing
new bioethanol plants, by employing additional dry processing technologies such as abrasive or roller
milling to de-bran grain prior to the liquefaction and fermentation steps (Sosulski and Sosulski, 1994;
Wang et al., 1997). This would remove most of the fibre and protein from the grain (which do not
contribute to fermentation), and would reduce the requirement for drying at the end of the process
(when a significant input of energy is required).
In the case of maize, a “wet grind” process separates the grain into its constituent
components, starch, fibre, protein and germ after a period of soaking (or steeping) in dilute sulphuric
acid prior to milling. With wheat, the wet process is different because wheat contains a unique
combination of proteins which form gluten. Existing wheat starch production plants in the UK use a
wet process whereby wheat flour (either whole or white flour, depending on the factory and location)
is wetted and kneaded to form a dough. The dough is then washed repeatedly to remove the starch
granules from the insoluble gluten. Both gluten and starch are recovered as valuable products.
Depending upon market conditions, the gluten can sometimes be the more valuable product (even
though it is often considered as a co product).
20
Although energy intensive and more expensive, wet processes can theoretically increase the
processing efficiency, as the concentration of starch entering the liquefaction and fermentation steps
is greater, and less DDGS has to be dried. However, the overall economics of the process will rely on
also being able to sell gluten as a high value co-product. To the authors’ knowledge, none of the
planned UK bioethanol plants intend to use this process.
2.2 Liquefaction/ Gelatinisation
A high temperature “cooking” step is commonly used to gelatinise the starch and make it
more accessible to enzymes for degradation. The high temperatures also help to reduce microbial
contamination. The milled grain is mixed with water to form a mash and heated to 120-150ºC. High
temperature and high pressure cause mechanical shearing forces on the starch molecule. Release of
pressure (blowdown) further disrupts the remaining endosperm structure.
The duration and the temperature of the cooking step must be carefully controlled; if the
starch is cooked for too long or at too high temperature, browning (or Malliard) reactions may occur,
resulting in reduced alcohol yields (Bringhurst et al., 2003). Novel enzyme mixtures of α amylases
and glucoamylases are now commercially available which are able to break down starch in vitro with
no need for a high temperature liquefaction step (Genencor, 2005). Wilkin (1989) reviewed ‘cold
cooking’ methods whereby ground grain is either not cooked before enzymatic saccharification or
cooked at a reduced temperature (e.g. 80°C). These gave higher alcohol yields but the energy saved
by cold cooking may be offset or even increased by the need to mill the grain more finely. Also, later
steps may have higher microbial infection than when an initial cooking step is employed and
problems with incomplete release and saccharification of starch could only be resolved by using
exogenous enzymes.
2.3 Saccharification
In fuel alcohol production, after cooling to 90-100°C, a heat stable α-amylase is added to
breakdown starch to smaller subunits. This step significantly reduces the viscosity of the mash and
allows more efficient breakdown by further starch degrading enzymes. The mash is then cooled
further to 80-90˚C and amyloglucosidase (also known as glucoamylase) is added. Amyloglucosidase
removes successive glucose residues at the ends of the starch molecules.
Traditional distilling industries (e.g. Scotch whisky production) cannot use commercial
enzyme preparations. However, germinating barley produces large amounts of enzymes well adapted
to breaking down barley starch into sugars. These enzymes are produced in excess by germinating
21
barley grain and are therefore used to break down starch in unmalted wheat grains. The mashing step
is carried out at 63-64ºC. Breakdown of starch leaves a sugar solution called ‘wort’. The malt
enzymes can only work efficiently on fully dispersed, gelatinized starch, so the cereals are first
cooked under pressure and at high temperature (approximately 140°C).
2.4 Fermentation
Under anaerobic (oxygen limiting) environments, yeasts produce ethanol and carbon dioxide
from sugars in a process called fermentation. In bioalcohol production, the mash from
saccharification is cooled and yeast added. Fermentation typically occurs for 48-72 hours at
approximately 30°C-35°C and results in wort with a typical final alcohol content of 8-12% depending
upon the initial substrate level, amount of yeast added (pitching rate) and the degree of bacterial
contamination. To maximise throughput and minimise costs, a maximal ratio of grain to water is
desirable because water processing is both energy and cost intensive. Problems with viscosity may be
encountered at high concentrations of dry matter and these are discussed below. Conditions for yeast
growth are critical in maximising alcohol yields – where yeasts are stressed, ‘sluggish’ or ‘stuck’
fermentations may occur, significantly reducing yield (Ingledew, 2003).
2.5 Distillation and Dehydration
Distillation allows the concentration of alcohol to be increased by separating ethanol from
water and other impurities in the mash. At sea level, ethanol vapourises at 78°C and water at 100°C,
hence by heating the liquid, the ethanol and water can be separated to leave a 95% ethanol and 5%
water azeotrope. Distillation for potable alcohol stops at this stage but for transport alcohol further
dehydration is necessary. Molecular sieves are used to adsorb water, but not ethanol, so that pure,
anhydrous ethanol is produced.
2.6 Stillage Separation
After fermentation and distillation, the residual mash, termed ‘whole stillage’ is separated by
centrifugation or pressing and extrusion into wet grain (containing heavy particulate matter) and thin
stillage (containing water and small particulate matter). The thin stillage fraction is dried to a syrup,
then mixed with the wet grain fraction and dried further to form Dried Distillers Grains with Solubles
(DDGS).
2.7 Co-Products
Storage carbohydrates (principally starch) and free sugars account for approximately 2/3rds of
the whole grain and are used in the fermentation process to produce alcohol and carbon dioxide. The
22
remaining 1/3rd of the grain consists of non-starch polysaccharides, non-degraded starch, proteins and
lipids and if suitable markets can be found for these components, the revenue generated can
contribute to the profitability of the process. Indeed, Wheals et al. (1999) estimated that in a maize
alcohol facility, approximately 50% of the revenue is derived from co-products, and they suggested
that there is still considerable scope to find uses for co-products other than in animal feeds, such as in
pharmaceutical, nutraceutical and cosmetic products. Wheat has the potential to provide gluten (used
in the baking industry and as an emulsifier or thickener; see earlier discussion on gluten co-
processing), bran (used in cereal foods), germ (used in bakery products and for some high value
cosmetic uses) and flour, in addition to DDGS, the standard co-product of bioethanol production
(Tibelius and Trenholm, 1996). Generation of multiple co-products from a single feedstock does
occur, but is rare at present owing to the costs involved. It is more common in wet grind facilities.
Where DDGS are the co-product of the alcohol production process approximately 305kg are
produced per tonne of wheat. DDGS are used extensively in the UK as a feed for ruminants. Removal
of starch concentrates the remaining components of the grain approximately three-fold, as shown in
Table 2, so DDGS contains higher crude protein and fibre contents than grain, and similar levels of
gross energy. However, utilisable energy, especially for non-ruminants, is much reduced in when
compared to wheat grain. The composition of DDGS can be very variable depending on the source
material, method of processing and processing efficiency. Feeding trials have shown that maximum
inclusion levels of DDGS depend not only on the type of livestock but also the growth stage of the
animal (Table 3). Because of their high fibre content, little DDGS are used in pig and poultry rations.
For non-ruminants it is best suited to sows, but it is primarily thought of as a feed for ruminants.
Some maize based DDGS is imported and produced in the UK, however the majority is wheat based
(Bruce Cottrill, ADAS, personal communication).
23
Table 1 Nutritional composition of wheat grain and wheat DDGS (based on Nyachoti et al., 2005). Data is normalised to 100% dry matter and is based on values for Canadian wheats. Energy composition is given in terms of MJ kg-1 and chemical and amino acid composition is given in terms of g kg-1. Figures do not include available carbohydrates since these are fermented in the bioethanol production process.
Figure 2 Theoretical efficiency of starch conversion to glucose and glucose conversion to ethanol
So far, there is no standard approach to grain analysis for biofuel production in the UK, and so there
is no standard grain specification. In Table 5 we therefore propose a ‘benchmark’ grain analysis to
which all variation can be related. For benchmark wheat grain, containing 69% starch and 3% sugar
on a dry matter basis, the stoichiometric relationship above indicates a potential yield of 518 litres of
28
alcohol per tonne of dry grain. Increasing starch concentration increases potential alcohol yield by
7.2 litres per 1% increase. Typical alcohol yields of UK wheat are in the region of 435 l/t dry grain
(from data in Figure 2, adjusted to 11.5% protein), so it seems that apparent processing efficiency is
currently around 84% of potential. However, yeast growth normally accounts for around 8% of the
sugars available for fermentation, so processing efficiency is probably nearer to 92% of potential
which still indicates appreciable scope for improvement.
Table 4 Benchmark composition of UK feed wheat (dry basis). A variety of sources were used to give values believed to represent wheat produced in the UK. Grain nitrogen (hence other constituents) was adjusted to the level achieved with optimal fertiliser use (as set out in RB209).
Composition (%) Reference Starch 69.0 (By difference) Sugar 3.0 Feed industry standard Non-starch polysaccharides 11.0 Englyst et al., (1999) Crude protein (N x 5.7) 11.5 MAFF (2000) Lipid 2.5 Feed industry standard Ash 2.0 Feed industry standard Lignin 1.0 Aman and Hesselman (1984) Total 100.0
There is considerable uncertainty however in how much starch is really present in typical UK
wheat; starch is notoriously difficult to measure, different measurement techniques giving
substantially different values (see Section 3.3). Alcohol yields, on the other hand, can be measured
directly in the laboratory using a process mimicking commercial potable alcohol production (Brosnan
et al., 1998; see Section 3.3). Results for UK wheat vary between 410 and 480 l/tonne (Figure 3).
Grain nitrogen can be measured most easily, accurately and precisely using either the Kjeldahl or the
Dumas methods. Conversion of nitrogen to protein in cereal grains is conventionally (and reliably)
based on a factor of 5.7 (Jones, 1931) (Note that the factor of 6.25 used for all feeds by the UK feed
trade is less accurate for cereal grains, and can lead to inadvertent over-estimation of protein, hence
under-estimation of starch.)
Due to the inverse relation between starch and protein, increases in alcohol yield are
correlated with decreases in grain protein content (Figure 3). Results from The Scotch Whisky
Research Institute (SWRI) in recent seasons show a relationship that approximates to direct
replacement of starch by protein and 100% efficiency of starch conversion to alcohol (i.e. a decrease
of 7.20 l alcohol per dry tonne for a 1% increase in protein). In this case, 1% protein corresponds to
-7.36 l/t alcohol yield (r2= 0.659). That the slope of this regression is so close to the theoretical
‘replacement’ relation between starch and alcohol is striking. Since efficiency of starch conversion is
unlikely to approach 100%, variation in protein content almost certainly correlates positively with
29
variation in other unfermentable materials. Indeed, Coles et al. (1997) show that starch content of
New Zealand wheat grain relates inversely to arabinoxylan content. The intercept on the y-axis of the
‘replacement’ line shown in Figure 3 indicates a total unfermentable fraction of 28%, equal to the
sum of components that are not starch or sugar in the benchmark grain analysis (Table 5).
There is a need for much fuller investigation of the explanations for variation in alcohol
processing yields and particularly how alcohol yield can be maximised. Current research is being
undertaken in the GREEN grain project (HGCA Project 2979) and an associated HGCA & SWRI
funded PhD Studentship with Heriot-Watt University.
400
420
440
460
480
500
4 6 8 10 12 14 16 18
grain protein (%, dry basis)
Alc
ohol
yie
ld (l
itres
/ to
nne,
dry
bas
is)
Figure 3 - Alcohol yields of grain samples from Recommended List (RL) variety trials against crude protein content. Data were measured by SWRI from many sites, harvests from 2003 to 2005, and from the GREEN grain project in 2005. The slope of the line represents direct replacement of starch by protein and complete conversion of starch to alcohol (see text for details).
3.2 Effect of Feedstock on Alcohol Yield
Figure 3 shows that differences in feedstock can give substantial differences in alcohol yield.
A range of 2% protein (a range commonly seen at grain intake of UK wheats) gives a difference in
alcohol yields of about 15 l/t. Assuming a value of ethanol of 40 pence per litre this difference would
30
be worth around £5/t grain to the bioethanol processor, plus potentially valuable savings in energy
costs resulting from the reduced quantities of residue material. Set against this, production of DDGS
would be lower.
The factors affecting alcohol yield are summarised in Figure 4 and each is discussed in successive
subsections below.
31
Alcohol Yield
Amount offermentable
sugars
Fermentation
Amount of starch(and sugars)
Hydrolysis
Distillation
Grain size shape
Thousand grainweight
Specific weight
Graincharacteristics Protein deposition
Starch synthesis
Grain filling
Amylose toamylopectin ratio
A vs B granules
Mealiness, vitreosity
Hardness
Protein protection
Turbidity
Starch ‘quality’
Fineness of milling
Endogenousamylase activity
Enzyme inhibitors
Non-starchpolysaccharides
Conversionefficiency
Free amino nitrogen
Yeast health &nutrition
Bacterialcontamination
(lactic acid)
Fungal contamination(mycotoxins)
Side reactions& inhibitors
star
ch
ash,
lipi
d
prot
ein
suga
rs
NSP
Grain analysis
Figure 4 - Overview of the principle factors affecting alcohol processing yield and the main stages in processing at which these act.
32
3.2.1 Amount of Starch and Sugars
The most direct and obvious way of increasing alcohol yields is through increasing the
amount of starch and sugar in the grain.
Starch is laid down during grain filling: starch deposition is more susceptible to poor
conditions during grain filling than protein deposition. Factors that favour extended photosynthesis
and grain filling will increase grain starch content, as will factors that reduce protein deposition.
Large well-filled grains will contain more endosperm and therefore starch than poorly-filled
shrivelled grains, as the endosperm will constitute a larger proportion of the grain in relation to the
bran and germ. As such, factors such as grain weight and specific weight have an impact on alcohol
yield. Grain width:length ratio can give an indication of the ‘plumpness’ of grains and this also has
been associated positively with alcohol yield (Taylor and Roscrow, 1990; Swanston et al., 2005a,
Swanston et al., 2006). However, these relationships tend to be fairly weak and do not apply across
all varieties; the good distilling variety Glasgow has small grains but gives good alcohol yields,
whilst Deben has large grains but gives low alcohol yields (Swanston et al., 2005a). Good
relationships between specific weight and alcohol yield have not been found (Taylor and Roscrow,
1990), although it is likely that samples with very low specific weights (<70kg/hl) will give poor
alcohol yields.
The relationship between starch measured directly and alcohol yield is shown in Figure 5.
Whilst the relationship is good (r2= 0.78), the relationship with protein content is more precise (r2=
0.85). A good relationship with protein is expected where differences in protein relate directly to
differences in starch. This is most likely to be the case at low to medium protein where
photosynthesis is ample for grain filling (sink-limited yield). Carbon from photosynthesis can either
form protein or starch; if nitrogen is limiting then the starch content of the grain will be higher,
whereas if nitrogen is abundant then the protein content will be greater and starch content lower.
However, if photosynthesis becomes limited by drought or disease, protein contents will tend to be
high and the relationship between protein and alcohol yield is expected to steeper. The combination
of sink and source limited crops will tend to give curvilinear relationships between alcohol yield and
protein content. Indeed, curvilinear relationships can be fitted to the responses in Figures 3 and 5,
although without significant improvements in the amount of variation explained. Swanston et al.
(2005a) found curvilinear responses of different varieties. Further work on the mechanics of grain
filling is required particularly to elucidate how the partitioning of starch can be increased relative to
33
protein. Genetic and environmental effects on the protein and alcohol yield are explored further in
Section 4.
y = -7.5046x + 524.12R2 = 0.848
410
420
430
440
450
460
470
480
5 7 9 11 13 15
Protein %DM (Kjeldahl N *5.7)
y = 4.9745x + 129.11R2 = 0.784
410
420
430
440
450
460
470
480
55 57 59 61 63 65 67 69 71 73
Starch %DM (Megazyme)
Alc
ohol
yie
ld (l
/t)
Figure 5 - Relationship of alcohol processing yield to starch (A) and protein (B) content of the grain. Starch was measured by the enzymatic method of McCleary et al. (1997). Data from a range of varieties, sites and agronomic treatments in the GREEN grain project (HGCA project 2979).
It is evident from Figures 5A and 5B that there is much variation in alcohol yield not
explained by starch or protein alone. Whilst some of this is undoubtedly due to measurement
difficulties, some at least must be due to differences in efficiency of starch conversion or
fermentation.
3.2.2 Starch Conversion Efficiency
A 100% efficient conversion of starch to sugar by α amylase and amyloglucosidase will
result in a mass of sugar that is 11.1% greater than the amount of starch processed. Modern fuel
alcohol plants typically achieve a 10% increase of mass. Unconverted starch is carried through the
process and ends up in DDGS. In practice, DDGS contain 1-2% starch, so the conversion efficiency
of the starch breakdown is 98-99% (Kenneth Werling, Lantmannen Agroetanol, personal
communication). Potable alcohol producers achieve a similar conversion rate.
Feedstock quality may affect the extent of starch conversion. Accessibility of the starch may
be important, both in terms of physical and chemical structure of the starch itself, and in terms of
protection by protein matrices etc. Also, other grain constituents may inhibit chemical conversion of
starch to glucose. These issues will be explored in the following sections.
A B
34
3.2.2.1 Starch Quality Amylose and Amylopectin
Starch is composed of two polysaccharides; amylose, a linear chain of glucose residues, and
amylopectin, a branched structure made up of a linear glucose backbone with occasional glucose side
branches as shown in Figure 6. The ratio of amylose to amylopectin in starch contributes to its
physical properties and its functionality and varies between species and varieties (Table 6).
Figure 6 - Structure of glucose and amylose and amylopectin in starch. Glucose is a hexose sugar containing 6 carbon atoms 1. Amylose is a linear chain of glucose residues linked by the carbons 1 and 4 of adjacent residues in an α 1-4 linkage while Amylopectin is a linear chain of glucose residues with occasional side branches linked by carbons 1 and 6 in an α 1-6 linkage. After Power (2003).
1 The carbon atoms are numbered clockwise from the oxygen atom in the ring structure shown above
Amylose
Glucose
Amylopectin
35
Table 5 - Percentage of amylose and amylopectin in starches from a variety of crops. Taken from Power (2003). Starch Source Amylose (%) Amylopectin (%) Wheat 25 75 Potato 20 80 Tapioca/cassava/manioc 17 83 Rice 20 80 Waxy rice 2 98 Maize 25 75 Waxy maize 1 99 High amylose maize 50-75 25-50 Sorghum 25 75 Waxy sorghum <1 >99 Heterowaxy sorghum <20 >80
Currently all UK wheats have a similar amylose content (ca 28%). High amylose starch has a
low viscosity at a given temperature, because it requires much more energy to make it gelatinize and
disperse into solution i.e. it will not gelatinize below 100°C, compared to gelatinization temperatures
of ca. 60-70°C for standard starches. Although amylose may be more completely hydrolysed, high
amylose starch is unlikely to be economic as a feedstock for alcohol production because of its high
energy requirements for gelatinization. Conversely, starches with a high amylopectin content (‘waxy
starches’) have a higher swelling power at a given temperature than standard wheat starch and
disperse more readily into solution. Moreover, they do not ‘set back’ or retrograde to the same extent
on cooling. Thus high amylopectin starch is generally advantageous to the alcohol processor. In the
US, Japan and Australia, there are fully waxy (0% amylose) and partially waxy (ca. 21% amylose)
wheats. Some breeders are reported to be developing waxy wheats for the UK. However, for the
foreseeable future, it is unlikely that such varieties will be used for alcohol production, unless their
grain yields become comparable to current feed wheats, and the benefits of a lower gelatinization
temperature can be translated into a cost-advantage during processing.
Starch is packed into granules which, based on size, may be classified into large (A type) and
small (B type) granule starches. The distribution of granule sizes in wheat affects its physical
characteristics and has a small effect on wheat processing efficiency. In a study of 12 soft wheat
cultivars in the United States, Raeker et al., (1998) found significant cultivar-specific differences in
the size distribution of starch grain sizes. These may also show some environmental variation. Large
starch grains are more abundant in soft wheat than hard wheat varieties and they contain slightly
more amylose (Raeker et al., 1998, Capouchova and Maresova, 2003). Research on UK wheats
indicates that total starch content (A+B granules) is more important for alcohol yield than the relative
amounts of large and small granules (Brosnan et al., 1998).
36
Starch Granules
Starch granules are embedded within a protein matrix within the endosperm, and grains can
be classified as either mealy or steely according to their endosperm structure. A mealy grain contains
starch granules loosely packed into a protein matrix providing air spaces within the endosperm, while
a steely (or vitreous) endosperm contains a tightly packed matrix of starch, protein and cell wall
material. Thus alcohol processing is favoured by mealy grains. Kolitsou and Palmer (2003) showed
that barley varieties with a mealy endosperm released starch more readily and had a higher extract
turbidity than steely endosperms. Swanston et al., (2005b) investigated whether extract turbidity
could be used as a predictor of spirit yield. The variety Consort combined high turbidity with high
alcohol yield but turbidity did not accurately predict the alcohol yield of varieties such as Wizard.
However, the results of the turbidity test are also affected by particle size of the flour after milling.
Particle size after milling is influenced by grain hardness (i.e. sedimentation/turbidity tests can
discriminate between hard and soft wheats), and hardness can therefore confound the interpretation of
turbidity results. Genetically, mealiness is controlled independently of hardness (Weightman et al.,
2005). Further work is required to understand the effects of grain texture on alcohol yield.
3.2.2.2 Milling Effects
The fineness of milling can significantly affect alcohol yield; finely ground meal may yield
5-10% more ethanol than a coarser ground meal (Kelsall and Lyons, 2003). The fineness of milling is
also known to affect starch digestibility in the context of poultry feeding. For example, in a study by
Carré et al. (2005), starch digestibility was negatively correlated with hardness and particle size of
flour prior to pelleting. However, as far as the authors are aware, there has been little study of the
effects of fineness of milling on starch digestibility in the alcohol production process. It is generally
assumed that because the flour undergoes a cooking and gelatinization step during processing,
fineness of grinding will be less important than in poultry nutrition, where much of the starch remains
ungelatinized.
3.2.2.3 Amylase Activity in the Grain
Starch reserves may be degraded in vitro by the action of endogenous α amylases. The extent
of starch conversion can be assessed conventionally using the Hagberg (or Falling number) test, with
which the grain trade industry is familiar. High endogenous α amylase activity (and low falling
number) can be associated with pre-harvest sprouting and economic losses of grain dry matter, but
may also result in starch conversion to sugars without any visible sprouting damage. It could be
37
argued that low Hagberg Falling Number (HFN) samples may give more efficient starch conversion
because of higher levels of endogenous amylase, but conversely poor quality, e.g. sprouted samples
may have already lost starch, and therefore alcohol yields might be reduced. Furthermore, a low HFN
may cause browning reactions during the cooking step due an increase in free sugars. We have found
no published data on the relationship between HFN and alcohol yield, but this may be worthy of
further study in UK wheat. Indeed, a Defra-LINK study ‘An integrated approach to stabilising HFN
in wheat: screens, genes and understanding’ is underway and may provide knowledge on whether
HFN and alcohol yield are related. Exogenous starch degrading enzymes can be used in bioethanol
production to overcome the differences in endogenous autoamylolytic activity and although costs are
significant, they are not inhibitory. It is generally considered that endogenous enzymes are denatured
at the cooking step and exogenous enzymes must be relied upon to ensure complete starch
conversion.
3.2.2.4 Amylase Inhibitors in Wheat
The rate (or extent) of starch hydrolysis during processing may be affected by inhibition of
amylase by other proteins naturally present in the wheat. Interestingly, such α amylase inhibitor
levels were noticeably less in wheat (16 mU barley α amylase inhibited per gram of flour) than
triticale (average 73) or rye (113-145) (Flintham et al., 1993). It is not known to what extent amylase
inhibitors in wheat affect the activity of commercial exogenous enzymes. Further work is required to
assess their importance.
Due to the reliability, speed and effectiveness of commercial starch degrading enzymes it is
unlikely that endogenous enzymes will be used for fuel alcohol production in the immediate future,
especially since any endogenous enzymes would be inactivated by the high temperature initial
cooking steps currently used to gelatinize the starch. This situation may change with the advent of
novel enzymes that degrade starch without the need for a cooking step (i.e. Genencor, 2005). In the
USA, Syngenta and Diversa have developed a transgenic maize line, AmylaseT™, which makes high
levels of a thermotolerant α amylase endogenously and thus reduces or eliminates the need for added
α amylases during processing. A similar approach may be feasible for wheats, although this would
not be acceptable for use in the potable alcohol industry.
3.2.3 Fermentation Efficiency
Fermentation is the key step in alcohol production and yeast must be carefully treated to
obtain the maximal conversion of fermentable sugars to alcohol. Management of fermentation is a
38
huge subject which has been well reviewed elsewhere (e.g. Kelsall and Lyons, 2003). Critically the
temperatures, nutrients, sugar and alcohol concentrations should be at levels that do not starve or
poison the yeast or encourage wasteful side reactions. The following sections just deal with the
effects of feedstock on these influences.
3.2.3.1 Nutritional Factors
Yeast fermentation in ethanol production is often limited by a lack of free assimilable
nitrogen. However, this is easily overcome by the addition of exogenous assimilable nitrogen such as
urea or ammonium (Thomas and Ingledew, 1990). Exogenous proteases may also be used to break
down wheat proteins to provide amino acids and can substitute for an exogenous nitrogen source
(Jones and Ingledew, 1994, Genencor, 2006). Phytic acid makes up 60-80% of phosphorous in cereal
grains and can form complexes with nutrients such as minerals and amino acids. This can limit their
availability and have a significant anti-nutritive effect on the yeast (Kelsall and Lyons, 2003). In
Scotch grain whisky production the addition of 10% barley malt for starch saccharification also
provides sufficient free amino nitrogen to sustain fermentation.
3.2.3.2 Side Reactions and Inhibitors
Microbial contamination (particularly from Lactobacillus spp.) has been identified as a
particular problem during the fermentation process in maize bioethanol plants - lactic acid and acetic
acids can inhibit yeast growth and bacteria compete with yeast for sugar substrates (Skinner and
Leathers, 2004; Narendranath et al., 2000). In practice, bioethanol plants accept 5% bacterial
infection. Bacterial contamination can have a significant negative effect on alcohol yield and it is
desirable to reduce bacterial contamination as far as possible. Mycotoxins from fungal contamination
of grain can certainly affect yeast growth – the mycotoxin Zearalenone can inhibit yeast growth at 50
ppm, Deoxynivalenol at 100ppm and Fumonisin at 10ppm, to the extent that they partly account for
slow or stuck fermentations (Kelsall and Lyons, 2003). However, it seems unlikely that bacteria or
mycotoxins in UK wheats would significantly affect alcohol processing yields.
3.2.4 Non-Starch Polysaccharides – Effects on Processing Efficiency
NSPs such as arabinoxylans (also called pentosans), β glucans and fructans can have
significant effects on processing efficiency and yield. Quantitatively, the arabinoxylans are the most
significant of the NSP in the whole wheat grain representing 8% of grain dry matter, out of a total
39
NSP concentration of 11% (Englyst et al., 1992). They make up 70% of the endosperm cell walls
(Sorensen et al., 2006).
Non starch polysaccharides have a high water binding capacity and significantly increase the
viscosity of the mash. Increased mash viscosities can have a number of deleterious effects on
production, and consequently on alcohol yield and throughput. Viscous slurries are difficult to
transport and mix, and may result in plant maintenance and hygiene problems. Viscous mashes also
cause problems with uneven temperatures because they have high heat coefficients. This is
particularly problematic in the processing of co-products such as DDGS after distillation. Viscosity
tends to increase the energy needed to dry the DDGS.
In wheat, the main viscosity promoting polysaccharides are arabinoxylans. In a study of 22
French wheat varieties, Saulnier et al. (1995) found that different cultivars varied in the soluble
arabinoxylan content. Cold water extract viscosity appeared to be largely determined genetically.
Later, Martinant et al. (1998, 1999) identified quantitative trait loci (QTL) for water extractable
arabinoxylans. Similarly, Weightman et al. (2001) showed that cold paste viscosity was influenced
genetically, tending to be high in wheats containing the 1BL/1RS translocation.
Viscosity problems can be overcome by increasing the water content of the mash. However,
as discussed in Section 2.8 producers aim to work with the minimum water content to maximise
throughput and reduce the energy costs of drying. Enzymes that break down the non-starch
polysaccharides, such as xylanases, are commercially available (Sorensen et al., 2006) and have been
included for many years in monogastric animal feed. Specific mixtures have been optimised for rye,
wheat and barley based on the differing nature of their non-starch polysaccharides (Novozymes,
2006a) and so viscosity problems can be overcome at a cost. However, such enzymes cannot be used
in potable alcohol production, except during co-product processing following distillation.
3.3 Assessing Feedstock Quality
Given the importance of feedstock quality to the alcohol processor, it is important that
accurate and rapid methods are available for feedstock analysis. In general direct measurements are
used to provide accurate estimates of quality attributes and indirect methods (calibrated from direct
measurements) have been developed for rapid use at point of trade or in plant breeding.
40
3.3.1 Direct Alcohol Measurements
Alcohol yield is accurately determined by the method of Brosnan et al. (1998) and simulates
the production process conditions in a potable alcohol grain distillery although in actual grain whisky
production only malted barley would be used as the enzyme source. Wheat is milled to a fine grist
and slurried with water. Termamyl™ α amylase is added, the mash is gradually heated to 85ºC before
pressure cooking at 142ºC for 15 minutes in an autoclave. The cooked slurry is cooled to 85ºC and
treated with Termamyl™ again to prevent starch retrogradation. Mashing occurs at 63ºC with high
amylolytic enzyme malted barley for 1 hour. The mash is the cooled to room temperature and pitched
with 0.4% (w/v) yeast and fermented at 68 hours at 30ºC. Distillation is then used to collect the
alcohol. The alcohol yield is determined from the alcohol strength of the distillate measured by a Paar
5000 density meter. The results are quoted on a dry weight basis as litres of alcohol produced per
tonne of cereal.
3.3.2 Direct Starch Measurements
The majority of quantitative starch analysis methods are based on a two-stage procedure with
(i) the hydrolysis of starch into glucose by either acid or enzymatic means, followed by (ii)
quantification of the glucose produced. These methods are summarised in Figure 7. Suitable
analytical methods for determining glucose can include polarimetry, colorimetry, gas-liquid
chromatography (GLC) and high performance liquid chromatography (HPLC). It is not the purpose
of the present review to describe all analytical methods, but rather to comment on the main methods
employed for starch analysis in commercial practice and to comment on their robustness and their
relative costs.
41
Figure 7 - Overview of the enzymatic and acid hydrolysis methods of quantifying starch.
3.3.2.1 Hydrolysis Methods Employed During Starch Analysis Acid Hydrolysis
Dilute mineral acids can be used for starch solubilisation and hydrolysis. Such methods are
relatively straightforward, assuming standardisation of temperature and time of hydrolysis. When
analysing mixtures of glucose-containing polymers in plant samples, dilute sulphuric acid (e.g. 1M)
is fairly selective for starch, leaving any cellulose intact (unless pre-treated with 12M sulphuric acid).
Therefore it can be safely assumed that hydrolysis of cellulose will not interfere with starch
determination at low acid concentrations (1-2N). However, there is always some loss of sugars during
hydrolysis (ca. 10-20% dependent upon time, temperature and concentration of acid). Therefore, a
correction factor (based on the loss during hydrolysis of a reference sample of starch) needs to be
employed when estimating the actual starch concentration.
42
Enzyme Hydrolysis
Modern methods of analysis use enzymes rather than acid to break down the starch. The
advantage is that there should be no loss of glucose through degradation (as in the case with acid
hydrolysis). Three key enzymes are needed to break down the starch fully; α amylase (usually a
thermostable amylase such as Termamyl™), pullulanase (to break down the 1-6 branch points of the
amylopectin), and amyloglucosidase (to breakdown any residual glucans and maltose to glucose). α
amylase can also break down 1-6 branch points of the amylopectin, albeit slowly. Because of this,
and because it is very expensive, pullulanase is not used in industrial alcohol production.
The use of Termamyl™ (Novozymes, 2006b) and other heat stable α amylases (Richardson
et al., 2002) that work at 95°C is very important because the high temperature employed aids
gelatinization and solubilisation of the starch. This is critical in ensuring complete hydrolysis. Some
resistant starches (typically found in processed foods such as breakfast cereals and also in maize)
require a pre-treatment step with an aggressive solvent such as dimethylsuphoxide at 100°C to fully
disperse the starch prior to analysis (Englyst and Cummings, 1998). Insufficient gelatinization and
dispersion is the most common source of inaccuracy in enzyme-based starch determinations, leading
to underestimates of true starch content.
3.3.2.2 Polarimetric Measurement of Glucose for Starch Analysis.
In the polametric (or Ewers’) method (USCL method 11-02), the starch is released from the
milled wheat flour by boiling in dilute hydrochloric acid (HCl). This procedure effectively gelatinizes
the starch granules and simultaneously hydrolyses the starch to glucose in a single step. The acid will
also help break down the endosperm tissue, ensuring complete release of the starch granules from the
protein matrix. Substances which may interfere with the measurement are removed by
filtration/clarification and then glucose concentration is determined by measuring the angle of
polarization or optical rotation (Senn and Pieper, 2000). Due to its simplicity this is a relatively
inexpensive method. However, it has some potential sources of error that must be taken into account
when using complex starting materials (like whole wheat) rather than pure starch. The free sugars
which are present in the wheat grain (ca. 2-3% of dry matter; Lineback and Rasper, 1998) contribute
to the estimate of glucose content. These free sugars are therefore measured separately by extracting
a sample in ethanol solution, and subtracting the free sugars from the total glucose estimated by
polarimetry. Errors can also arise using the Ewers’ method because sugars can be generated by the
acid hydrolysis of the NSP. As discussed earlier, NSP can account for ca. 10% of the dry weight of
the grain. The monosaccharides released are mainly pentose sugars (xylose and arabinose) but these
43
can interfere with the quantification of glucose. While only a proportion of the total NSP will be
hydrolysed by dilute HCl, it is likely that the contribution from breakdown of NSP could be of a
similar order of magnitude to the free sugars. For this reason, the Ewers’ method is stated not to be a
suitable method for samples expected to have high levels of NSP or optically active substances which
do not dissolve in 40% ethanol (Van Eys et al., 2004). If the concentration of NSP is the same in
every sample of wheat, then this can be discounted using a correction factor, but it is known that NSP
levels in wheat are influenced by both genotype and environment. Results from the Ewers’ method
should therefore be treated with caution and will not be directly comparable to the results obtained by
other methods.
3.3.2.3 Enzyme-Based, Colorimetric Measurement of Glucose for Starch Analysis.
Following enzymatic hydrolysis of the starch as described above, it is necessary to quantify
accurately the glucose released. This is possible using GLC and HPLC, but the former requires a
lengthy derivatization step making the technique relatively expensive, and the latter requires a
specialised HPLC system. It is unlikely that these will be used in practice for routine starch
determination. The availability of specific enzymes for the oxidation or phosphorylation of glucose
means that the final step of starch measurement can be carried out accurately by enzymatic methods.
In the glucose oxidase method, the glucose is treated with glucose oxidase-/-peroxidase
(GOPOD) reagent before quantification spectrophotometrically at 540nm. The amount of glucose in a
sample is then determined from a standard curve. Typical of this approach, AACC method 76-11
employs the use of an autoclave to disperse the starch, and amyloglucosidase to hydrolyse the starch
to glucose. Note however, that a single enzyme is employed with α amylase and pullulanase omitted,
therefore this method can underestimate starch content in some processed cereal products and in high
amylose starches.
An alternative enzymatic method of starch determination was described by McCleary et al.,
(1997) and is derived from AACC method 76-11 using the GOPOD reagent, but utilising a
thermostable α amylase to ensure full hydrolysis of the starch. This method can also be modified for
samples with high levels of resistant starch through a pre-treatment step at 100°C in
dimethylsuphoxide. This method has the advantage over method 76-11 in that it gives quantitative
starch results even when the starch is resistant to degradation. Megazyme® supply all of the enzymes
and standards in kit form and the method is fully certified by both AOAC and AACC (AOAC 996.11
and AACC 76-12).
44
3.3.2.4 Comparison of Starch Analysis Methods
Modern enzyme assay kits are of high purity and selectivity, but can be relatively expensive
per sample compared to older (acid hydrolysis) methods. Enzyme–based methods can also be
laborious, which contributes to their cost, and while in principle they are robust, they are more
complex. With a large number of pipetting and transfer steps it is found in practice that they are only
reliable in the hands of a skilled operator who uses them regularly. Therefore, when commissioning
starch analysis using a contract laboratory it is advisable to ask about the performance in the
laboratory e.g. repeatability of the method using a standard sample. In practice, although the Ewers’
method is not selective for glucose and contains a number of correction factors, it has been found
difficult to replace this by other methods (e.g. enzyme assays) in regulatory work (Jurgen Möller,
FOSS, personal communication).
3.3.3 Protein Measurements
Protein measurement may be the most important determinant of wheat quality for alcohol
production given that (A) the precision of protein methods is significantly better than starch methods,
(B) there is a clear inverse relationship between protein and alcohol yield (as discussed above; see
Section 3.1), (C) protein analysis is relatively inexpensive and is understood by growers, and (D)
protein contents can be directly linked to agronomic practice, specifically N fertiliser inputs. Two
main analytical methods for protein determination of wheat grain are used: the Kjeldahl method and
Dumas methods. Both measure grain nitrogen content. Protein content is then estimated by
multiplying nitrogen content by a factor of 5.7 (Jones, 1931; Draper and Stewart, 1979).
3.3.3.1 Kjeldahl Method
The Kjeldahl method is a wet chemistry method using digestion of organic matter with
sulphuric acid and conversion to nitrogen to yield ammonium sulphate. In a separate step, the
ammonium sulphate is refluxed with hydroxide and the ammonia is distilled and quantified by
titration. The amount of nitrogen in the sample is proportional to the amount of acid needed to titrate
the ammonium (Van Eys et al., 2004).
3.3.3.2 Dumas Method
In the Dumas method, the sample is burnt at very high temperature, and the nitrogen in the
exhaust gases is measured directly. There are many variants of the Dumas procedure: typically in
modern instruments (e.g. Leco Corporation, St. Joseph, Michigan, USA) the sample is burnt in a
stream of high purity oxygen, the gases are scrubbed to remove CO2 and water, and are passed over a
heated copper catalyst to reduce the nitrous oxides to nitrogen gas. The concentration of N2 is
45
quantified in the flow cell of an N-specific gas analyser. The Dumas method is faster than Kjeldehl,
can be used on smaller samples and can be automated allowing high throughput. The Dumas method
may give higher readings than the Kjeldahl method because it includes any nitrate, therefore the
Kjeldahl method is the reference method for N and hence protein determination (Van Eys et al.,
2004).
3.3.4 Indirect Measurements 3.3.4.1 Near Infrared Reflectance (NIR)
NIR can measure rapidly a number of grain parameters such as protein, moisture and starch
content. Two main factors influence the robustness of an NIR method, (A) the number and nature of
the reference samples, and (B) the reference method by which they were analysed.
Samples are illuminated with near infrared light and the amount of light absorbed (i.e. not
reflected or transmitted) is proportional to the amount of a particular component in the sample.
Illumination at different wavelengths allows different components to be quantified. NIR is used on
the whole grain so is non-destructive and because samples can be assessed in seconds rather than
hours, is high throughput. NIR therefore has the potential to be useful for quality testing of grain at
the factory gate or point of trade.
The relationship between the reflectance (or transmittance) of a sample and the amount of a
particular substance is not predictable, and is therefore based on a calibration between the amount of
substance determined by traditional laboratory based methods and the NIR reading. Reliable
calibrations require a large number of samples representing the full range of varietal types and
environments from which the NIR machine is likely to receive samples in practice. This limits
precision. The sensitivity of NIR results also dependent on temperature, water content and reflectance
from interfering compounds. These variables can be accommodated for by statistical corrections (Van
Eys et al., 2004).
Current NIR calibrations for starch appear to use Ewers’ method as a reference. Despite its
limitations and the fact that the starch values obtained for different species cannot be compared
directly, Ewers’ method is widely used in regulatory work. Given that Ewers’ method can be affected
by solubilisation and / or breakdown of NSP in a whole wheat sample, the main issue for the UK
industry is whether (A) the reference set contains enough UK wheat varieties, and (B) whether it
contains a wide enough range of starch contents, typical of UK wheats. In conclusion, NIR
measurement of starch appears insufficiently precise or accurate to allow a reliable estimation of
46
alcohol yield. However, NIR calibrations for protein are more precise and robust and hence initially it
is likely that protein content within grains will be used for predicting potential alcohol yields.
Ultimately, the ideal measure would be NIR measures of expected alcohol yield, based on calibration
measurements from samples directly measured for alcohol yield. Indeed, work by FOSS using
samples generated by RL trials and the GREEN grain project, and analysed by SWRI, is aiming to
produce an NIR measure of alcohol yield.
3.3.5 Tests for Processing Efficiency
There is currently no rapid test to determine whether a feedstock will lead to processing
problems. A laboratory method, used by the potable alcohol industry to determine residue viscosity is
the current standard. Residues from alcohol distillation (described in Section 3.3.1) are adjusted to a
fixed volume (250ml) and centrifuged to remove the grain solids. The viscosity of the supernatant is
measured at 20°C using an Ostwald viscometer in a similar fashion to that described by The Analysis
Committee of the Institute of Brewing (IOB) (1997). No test currently exists for quickly determining
NSP content which is a major contributor to viscosity problems.
3.4 Implications of Feedstock on Co-Product Quality
Grain quality (both proximate composition and microbiological quality) is important where
the co-products from alcohol production are to enter the food chain. It is important that grain hygiene
should be given a high priority by both growers and processors, so that microbial and chemical
contamination during growing and storage are avoided wherever possible.
Mycotoxins are produced from fungi and moulds originating in the field (Fusarium species)
or in storage (e.g. Penicillium species). Mycotoxins have detrimental effects on animal health and
well-being and on human health. Legislation now limits the concentrations of mycotoxins allowed in
foods and feeding stuffs and growers must not dispose of contaminated grain in the food chain. For
instance it is not acceptable to mix contaminated grain with uncontaminated grain and the reader is
directed to relevant guidance published by the HGCA (see Topic Sheet 91: Managing the Fusarium
mycotoxin risk in wheat and Topic Sheet 78: Drying and cooling grain: an update). Mycotoxins are
of particular concern for downstream products such as DDGS because mycotoxins are not destroyed
by high temperature treatments. Moreover, because of the near complete fermentation of starch
during bioethanol production, mycotoxins are concentrated approximately three-fold in the DDGS.
Similarly, crops should not be grown where there is a chance of heavy metals accumulating in the
grain. Grain health is therefore an important concern for processors and many ethanol producers
have stringent grain quality guidelines, resulting in rejection of contaminated and damaged grains
47
(i.e. Lantmannen Agroetanol in Sweden). However, it should be noted that mycotoxin and heavy
metal levels in UK wheats are rarely high enough to be problematic today.
The final nutritional profile of DDGS can affect livestock performance. Variations in the
composition of nutrients other than starch are magnified approximately three-fold in DDGS. The
essential amino acid lysine for example, is a key limiting amino acid for animal growth and if
varieties that had increased lysine content were used in processing this would make the DDGS more
nutritionally valuable. Processing may also affect DDGS nutrient composition. Uneven drying of
DDGS because of high viscosity (see earlier discussion on the effects of NSP in wheat) causes
localised overheating and results in sugar binding to amino acids through the Maillard reaction. This
causes the grains to become dark (hence the alternative name Distillers Dark Grains with Solubles)
and makes amino acids unavailable for digestion, thus reducing the nutritional benefits of DDGS.
This is less of a problem in modern alcohol plants where sugar fermentation is more complete and
better heat distribution systems and lower drying temperatures can avoid burning effects. The likely
nutritional value and potential variation in DDGS from UK fuel alcohol plants compared to that from
traditional distilleries has not yet been explored but will be of interest to the livestock industry.
3.5 Current Wheat Grain Feedstock Specifications 3.5.1 Potable Alcohol
The potable alcohol industry uses a relatively simple quality specification for wheat. Aside
from standard parameters such as moisture, the specification is for soft wheat with a specific weight
over 72 Kg/l and as low nitrogen as possible. Hard wheats have proven to process poorly in potable
alcohol distilleries and are therefore unsuitable for distilling. Although single wheat varieties are not
specified, distillers often have a preferred list of varieties that they accept which is based on varieties
rated as acceptable for distilling on the HGCA and SAC Recommended Lists. Varietal effects,
including hardness and the 1B/1R translocation, are discussed in the next chapter.
3.5.2 Fuel Alcohol
The specifications of wheat used for fuel alcohol production may vary between different
producers depending upon the production process employed and the co-products produced. The basic
requirement for European producers Abengoa and Sudzucker (utilising wheat as a feedstock and
producing only ethanol and DDGS) is for standard feed grade. Feed wheat rather than milling wheat
is desirable because of its low protein content (hence high starch content) and low price. In contrast,
the Canadian producer Permolex rejects feed wheat in favour of specified varieties typically used in
bread making (Permolex, 2006). This is because Permolex utilise a “wet grind” procedure where high
48
protein is desirable for production of gluten. A high starch content is not so critical in this process
since ethanol is only one of a number of valuable products, and Canadian feed wheat yields are closer
to those of milling wheats.
Sudzucker and Lantmannen Agroetanol (who use a dry grind) specify the requirements for
high quality standard feed wheat with low mycotoxin levels, freedom from ergot and no heavy metal
contamination (Marie Afors, Lantmannen Agroetanol, personal communication; Bernhardt Dahmen,
Sudzucker, personal communication). Most processors also reject grain with over 15% moisture
content (Permolex, Lantmannen Agroetanol) due to the potential for mould contamination of grain in
storage.
A premium would provide an incentive for growers to select varieties and grow crops that
would maximise desirable grain characteristics. Lantmannen Agroetanol in Sweden for example,
offer a supplement to growers for grains that have a starch content greater than 71% (Marie Afors,
Lantmannen Agroetanol, personal communication) whilst Sudzucker are considering introducing a
premium for low protein contents due to the difficulties in accurately assessing starch content
(Bernhardt Dahmen, Sudzucker, personal communication).
3.6 Conclusion
Current specifications for alcohol production in the UK are based on feed wheat. However,
as shown in this chapter, the suitability of feed wheats for alcohol production can show significant
variation between varieties, sites and growing systems.
The quality factor of primary importance to the alcohol producer will be the amount of starch
present. However, this may not be directly measurable and producers may be better off using protein
content as a more precise guide to predicting alcohol yield. In the future, premiums for specific
varieties or starch contents may be introduced to provide growers with an incentive to grow the
varieties best suited to the processors requirements. In both potable and fuel alcohol industries, a high
starch grain content is desirable because it maximises alcohol yield per tonne of grain processed.
High starch contents also improve processing efficiency as more of the feedstock is converted to
alcohol and consequently less material is left over as a residue, giving considerable savings in energy
costs associated with heating, cooling and drying. Centaur Grain in the UK (Centaur Grain, 2006)
and Lantmannen Agroetanol in Sweden have offered premiums for growers based on starch content,
yet in our opinion, current methods for starch measurement are inaccurate. We suggest that
processors should consider introducing a low protein premium for grains because grain N is inversely
49
related to starch content and can be accurately and easily measured using high throughput devices
such as NIR. Any premium based scheme will have costs to the processor, through increased
feedstock costs and also analysis and logistical costs, and potentially reduced marketing flexibility.
There is a commercial need on the part of the biofuel industry to explore in more detail the economic
consequences that differences in feedstock quality have on profitability of the alcohol plant, and the
potential costs and benefits of operating a premium based system.
As discussed in Section 2, the technology employed in each of the alcohol industries varies
and this may have a significant effect on the feedstock required. Viscosity is potentially a major
processing problem in all alcohol production industries. In the fuel alcohol industry viscosity can be
reduced by using enzyme mixes. In the Scotch whisky industry the use of such enzymes is not
allowed. Therefore, while both industries can benefit from growers supplying grains of varieties that
are known not to have viscosity problems, it is more important for suppliers of the Scotch whisky
industry. If the viscosity issue is a major concern to the processor, the most appropriate course of
action may be to avoid problematic varieties given the lack of appropriate tests for NSP and the
general lack of understanding in this area. It is likely that fuel alcohol processors will use a wider
range of varieties than traditionally used by distillers and therefore there may be a requirement to test
the alcohol production traits of a wider range of varieties using a method which more closely relates
to the fuel alcohol process.
50
4.0 Agronomic Effects on Variation in Feedstock Quality
The significant differences between wheat feedstocks in processing efficiency and alcohol
yield can be associated with species, varieties, environment or management. This Chapter describes
variation caused by these factors in more detail. However, it must be recognised that, unless
premiums are offered for feedstock quality, or unless carbon accreditation schemes are introduced at
the farm level, the primary considerations for growers of wheat for alcohol production will be to
maximise grain yield and minimise costs of production. Since the fuel alcohol market is global and
highly competitive, success for the fledgling fuel alcohol industry in the UK will depend very much
on minimising costs of feedstock production as well as minimising processing costs. The principles
of low cost grain production are well rehearsed in the farming industry, so these need not be repeated
here. Rather, our emphasis will be on accounting for variation in feedstock quality, whilst noting any
interactions that important factors may have with crop productivity or growing costs.
4.1 Genetic Differences in Feedstock Quality
Differences in feedstock quality between species are usually larger than between varieties, so
initially we consider how wheat compares to maize, rye, barley, oats and triticale. Despite a few
studies on genetic effects from Germany (Fleischer and Senn, 2005, Rosenberger, 2005; Aufhammer
et al., 1993; Aufhammer et al., 1994; Aufhammer, 1996) there is currently a dearth of reliable
information in the literature.
4.1.1 Cereal Species
Table 7 shows data from the literature on alcohol yields for different cereal species. Results
tend to be confounded by environmental effects, because grain samples have been collected ad hoc
and so also represent a range of growing conditions. In a comparison of rye, triticale and wheat in
Germany, Rosenberger (2005) found that wheat showed the greatest range in protein concentration,
starch content and consequently alcohol yield. Alcohol yields were found to increase with starch
content (measured by Ewers’ technique) to a similar extent in both wheat and rye (4.7 l / tonne / %
starch), but triticale gave less alcohol per unit of starch and was less responsive to increases in starch
content. This contrasts however with other work where triticale has been found to give higher
alcohol yields at a given protein content than wheat (Fleischer and Senn, 2005; Aufhammer et al.,
1994; Aufhammer, 1996).
51
Table 6 - Starch content and extrapolated alcohol levels of production for several cereal species grown in the UK. Source Literature On-farm statistics Trial statistics Reference
Species Starch content (%) DM
Alcohol yield (l/t)
Yield (t/ha) #
Alcohol yield (l/ha)*
Yield (t/ha) #
Alcohol yield (l/ha)*
Wheat 69 444 7.73 2914 10.0 3770 Rosenberger, 2005 Triticale 69 441 4.37 1636 7.0 2621 Rosenberger, 2005 63 403 4.37 1496 7.0 2396 Sosulski et al., 1997 Rye 65 438 5.78 2152 7.6 2829 Rosenberger, 2005 64 397 5.78 1949 7.6 2563 Ingledew et al., 1999 64 409 5.78 2009 7.6 2642 Sosulski et al., 1997 Barley 59 367 5.71 1781 8.2 2558 Sosulski et al., 1997 Oats (hulled) 51 318 5.88 1587 8.1 2187 Thomas and Ingledew, 1995 Oats (naked) 60 353 5.88 1765 8.1 2432 Thomas and Ingledew, 1995 Maize 72 439 7.1 3117 Putnam et al., 1991 Data from Rosenberger (2005) are based on German varieties of wheat (81 observations), triticale (18 observations) and rye (31 observations) grown in Germany in 2003 and 2004. Starch contents were measured by Ewers’ technique and are the means of observations in 2003/2004. Data from Sosulski (1997) for barley, triticale and rye are based on one Canadian variety per species. The starch measurement method was not reported Data from Ingledew (1999) are means of 7 rye varieties. Starch measured using an enzymatic method similar to that of Stitt et al. (1989). #On farm grain yield in tonnes per ha at 15% moisture averaged for UK 2001-2005 (Defra 2006). Trial grain yields are derived from fungicide treated plots as presented in the HGCA RL 2006/2007 (HGCA 2006) or from NIAB trials in 2003/2004 (Maize Growers Association, 2005). *Alcohol production (l/ha) is estimated from the alcohol processing yield (in l/ t) multiplied by the grain yield (t/ha) corrected to 100% DM. It must be recognised that production estimates will be inaccurate because they are products of data from different sources.
52
In order to indicate likely alcohol production by each of these species, Table 7 also shows
their alcohol processing yields multiplied by grain yields from trials (HGCA RL trials) and by
national average farm yields (Defra, 2006). This comparison shows wheat to have much the
greatest potential alcohol production of all cereal species. However, there is a need to evaluate
more thoroughly how maize, wheat, barley, oats, rye and triticale compare as potential feedstocks
for alcohol production under UK conditions. Triticale also holds promise, not least due to its
perceived low input requirements and lack of (reported) viscosity problems in modern varieties.
Rye is not considered suitable for potable alcohol production in the UK due to its high levels of
pentosans which causes problems with viscosity. Viscosity could be overcome in fuel alcohol
production facilities using enzymes and is not seen as an unsurmountable problem in Germany
where rye is used routinely. However, rye co-products are worthless.
4.1.2 Modern Wheat Varieties
Wheat varieties vary greatly in their suitability for specific end-uses. As well as breeding
for grain yield, wheat has traditionally been bred for the milling and baking industry, where high
protein contents and specific protein qualities are required. Although wheat breeders have aimed
to maintain specific weight, which may benefit alcohol processing, there has been little emphasis
thus far on breeding directly for alcohol yield.
Information on quality and agronomic characters of current UK wheat varieties are
contained in the HGCA RL (for example, HGCA 2006b). Whilst quantitative data on distilling
value are not currently given, a classification on whether a variety is suitable for distilling is
provided, based on information funded by the potable alcohol industry through the Scotch
Whisky Research Institute (see below). In addition, information on protein content, endosperm
texture and specific weight are given and may provide some guide to value for alcohol production
as shown in Table 8.
53
Table 7 -Variety information from the HGCA RL 2006-2007 Variety Yield
(% control, 10.0 t/ha)
NABIM group*
Endosperm texture
Suitability for distilling
Protein content
Specific weight
Robigus 104 3 Soft Y 11.6 76.4 Deben 104 3 Soft (Y) 11.2 76.0 Nijinsky 102 3 Soft Y 11.8 74.8 Wizard 101 3 Soft Y 11.8 76.5 Claire 100 3 Soft Y 11.7 76.1 Consort 99 3 Soft Y 11.7 76.9 Riband 98 3 Soft Y 11.7 74.8 Ambrosia 106 4 Soft - 11.6 77.0 Glasgow 107 4 Soft Y 11.1 75.9 Alchemy 107 4 Soft Y 11.6 77.3 Istabraq 106 4 Soft Y 11.1 78.0 Brompton 106 4 Soft - 11.6 73.6 Gladiator 105 4 Hard - 11.8 77.1 Gatsby 104 4 Hard - 11.8 76.8 Hyperion 104 4 Soft - 12.1 77.9 Napier 104 4 Soft - 11.5 75.4 Access 103 4 Hard - 11.1 75.2 Richmond 103 4 Hard - 11.9 78.3 Welford 103 4 Hard - 11.6 74.4 Savannah 102 4 Hard - 11.3 76.6 * NABIM (National Association of British and Irish Millers)
Experience in the potable alcohol industry has shown that wheat varieties differ both in
alcohol processing yields, and in the ease with which they can be processed. Over the past 15
years the variety Riband has become very well-liked by distillers, and has continued to be grown
in Scotland despite being out-yielded by newer varieties. The soft-milling candidate varieties
from the 1st and 2nd year of National List trials (NL1 and NL2) and RL trials are tested for alcohol
yield and distilling properties each year by SWRI, from about six (predominantly Scottish) sites.
This information, together with experience from the industry, is used to state whether or not
varieties are deemed suitable for distilling.
Up until the present time, the work on distilling value of new varieties has principally
been funded by the potable alcohol industry. Whilst varieties that are good for traditional
distilling are expected to be good for fuel alcohol production also, there may be a case for a more
systematic analysis of the potential alcohol yield of varieties that would not be considered by the
traditional distilling industry, for example, hard varieties and those containing the 1B/1R
54
translocation (see below). Additionally, if differences in the value of varieties for fuel alcohol
production are different to that for the traditional distilling industry, there would be a strong case
for testing the full range of varieties using fuel alcohol methodology.
Alcohol yield measurements by SWRI from HGCA NL and RL trials in the harvest years
2003-2005, together with protein content and residue viscosity in order to ascertain the varieties
best suited to alcohol production. In each year at least six trial sites were assessed, at least four
Scottish sites and two English sites. At each site, at least eleven soft varieties were tested.
Additional varieties have been tested in 2005 as part of the GREEN grain project. Not all
varieties have been tested at all sites or in all years, so Restricted Maximum Likelihood analysis
was used to account for site and year effects and to give a fair basis for comparison of varieties.
Two sites from Aberdeenshire in 2003 were excluded from the analysis due to high incidence of
shrivelled grain in some of the varieties (this unfairly skewed the averages of certain varieties).
Varieties were included where they were represented by more than four analyses from more than
one site. The number of sites for each variety for each year is shown in Table 9 below. Associated
grain yields (t/ha) were taken from RLplus for each individual trial and combined with alcohol
processing yield (l per dry tonne) to give alcohol production (l per ha) for each of the varieties.
Table 8 - Number of sites tested for alcohol yield by SWRI in each year for each variety in the period 2002-2005. This data is made up of varieties in NL and RL trials as well as some data from the GREEN grain project.
It is likely that alcohol production will have been overestimated on a UK basis by this approach
because Scotland is over-represented, and gave protein contents lower than would be expected in
England, and the English trial sites were specifically chosen to give reasonably low protein
contents. It is evident from Figure 8 that protein % for the varieties measured in these trials is
often lower than the averages reported in the RL
55
D
Figure 8 – Protein and alcohol yield in varieties tested in NL and RL trials in 2002-2005 and as part of the GREEN grain project in 2005. A) Protein content in the RL list (bars) against actual measured protein (dots) B) Alcohol yield in l/t C) Alcohol yield (l/t) normalised to 11% protein D) Predicted alcohol yield in l/ha based on alcohol yield in l/t multiplied by grain yield per ha for each variety
A
10.0
10.5
11.0
11.5
12.0
12.5
Prot
ein
(%)
430
435
440
445
450
455
Alc
ohol
pro
cess
ing
yiel
d (l/
t)
420
425
430
435
440
445
450
Alc
ohol
pro
cess
ing
yiel
d (l/
t) a
t 11%
pr
otei
n
3,000
3,200
3,400
3,600
3,800
4,000
4,200
Gla
sgow
Zebe
dee
Ista
braq
Alch
emy
Rib
and
Con
sort
Ambr
osia
Atla
nta
Rob
igus
Nijin
sky
Dic
kson
Pira
nha
Cla
ire
Wiz
ard
Deb
en
Kipl
ing
Hyp
erio
n
Pred
icte
d al
coho
l pro
cess
ing
yiel
d (l/
ha)
C
B
56
Figure 8B shows a wide range in alcohol processing yields of current and candidate
wheat varieties, with Kipling and Hyperion averaging around 430 l / dry tonne and Glasgow and
Zebedee producing around 450 l / dry tonne. To an extent this reflects the difference in protein
contents of these varieties. It seems reasonable to take the view that protein differences in a
variety trial commonly relate inversely to grain yield, whereas on-farm fertiliser use tends to be
adjusted by yield level and so protein levels are more consistent. Thus, using the replacement
slope of 7 litres of alcohol per tonne per 1% decrease in protein, we compare the expected alcohol
yields of different varieties at a constant protein concentration (Figure 8C). Although this shows
less variation between varieties, Glasgow and Zebedee still come out high, whilst Hyperion,
Deben and Kipling come out poorly. This suggests that it is more than just differences in protein
that distinguish these varieties.
In a perfect market (whether economic or environmental), the objective of the UK
agriculture and alcohol industries should be to optimise production of alcohol per ha. Figure 8D
shows potential alcohol yield per ha from the varieties analysed on the RL. Glasgow, Alchemy
and Istabraq combine high grain yields and high alcohol processing yields to give an alcohol
production of around 4,000 l alcohol per ha. Indeed, the well recognised inverse relationship
between grain yield and grain protein in different varieties (Simmonds, 1995), together with the
inverse relationship between alcohol yield and grain protein, suggests that high yielding varieties
will tend to give high alcohol yields. The residue viscosities shown in Figure 9 give an indication
of the likely processing problems that would be associated with these varieties. Very generally,
varieties that give high alcohol yields tend to give low residue viscosities and varieties giving low
alcohol yields tend to give higher residue viscosities. Kipling stands out as a variety that gives
low alcohol yields and very high residue viscosities. This may be indicative of differences in
NSPs, with varieties such as Glasgow having more starch and less NSPs at a given protein
content.
57
Figure 9 - Residue viscosity (mPa.s) (bars) and alcohol processing yield (l/t) (dots) measured by SWRI on varieties tested in NL and RL trials in 2003-2005 and as part of the GREEN grain project in 2005.
To test the importance of protein concentration in explaining differences between
varieties (and sites and seasons) a regression analysis was carried out on a subset of varieties that
were measured in all years and at all sites (the full set of data are shown in Figure 3). The general
form of the relationship in Figure 3 clearly complies with the notion of replacement of starch by
protein. There is some justification for considering the relationship to be curvilinear – the fall-off
in alcohol processing yield increasing at high protein concentrations. However, the curvilinear
effect was generally not significant here, the changes in alcohol processing yield and protein
content that will now be discussed are treated as linear for individual varieties and seasons.
The regressions suggest that all varieties follow the same response to protein. Analysing
the data on a year by year basis allows a wide range of varieties to be assessed (Figure 10).
Despite the number of replicates (=sites) of each variety being limited, there is significant
justification for fitting differing intercepts to the varieties in 2003 and 2005 (in 2004 the lack of
significant differences maybe due to reduced replication – 6 sites rather than 8), but there is no
justification for fitting different slopes. Slopes in 2003, 2004 and 2005 were –9.6, -6.0 and –7.3 l
per tonne per % protein. The differences in intercept indicate that Deben (also Kipling and
Hyperion) consistently gave less alcohol per tonne at a given protein concentration than Glasgow,
Istabraq and Zebedee. A majority of varieties shared an ‘average’ intercept, including Claire,
Consort, Robigus and Nijinsky. In 2005, Glasgow gave considerably higher alcohol yields than
other varieties at a given protein concentration.
1.451.50
1.551.60
1.65
1.701.75
1.801.85
Gla
sgow
Zebe
dee
Ista
braq
Alch
emy
Rib
and
Con
sort
Ambr
osia
Atla
nta
Rob
igus
Nijin
sky
Dic
kson
Pira
nha
Cla
ire
Wiz
ard
Deb
en
Kipl
ing
Hyp
erio
n
Res
idue
vis
cosi
ty (m
PA)
430
435
440
445
450
455
Alc
ohol
pro
cess
ing
yiel
d (l/
t)
58
400
410
420
430
440
450
460
470
480
7 8 9 10 11 12 13 14
ClaireConsortDartDebenDicksonIstabraqNijinskyRobigusSteadfastWizardCl i
Figure 10 - Response of alcohol processing yield of different varieties to protein concentration across sites within a year. In each year all varieties are represented at all sites. Regression analysis shows justification for parallel lines in 2003 and 2005 and a common line in 2004.
59
4.1.3 Hard vs Soft Wheats
Wheat can be classified as either hard or soft. The primary importance of soft wheats is
that they are easier to mill. Puroindolines are present in soft wheats where they interfere with the
adhesion of the starch granule to the protein matrix. Absence of PIN isoforms (PIN-a and PIN-b),
or mutations of PIN-b in the presence of PIN-a can lead to hardness. Traditionally, the alcohol
industry has preferred soft wheats, although this does not preclude use of hard wheats for
bioethanol production. Whilst hard wheats take marginally more energy to mill, effects on overall
production costs are probably negligible. Hard wheats are generally associated with greater
protein contents, and this may be the main reason for distillers’ dislike of them. Hardness has
also been associated with processing problems, the starch perhaps being less accessible and
handling problems occurring (Taylor et al., 1993). However, little work has been done to show
whether hard wheats do actually have lower distilling value than soft wheats. Taylor et al. (1993)
found no effect of grain hardness on alcohol processing yields.
4.1.4 The 1BL/1RS Translocation
The 1BL/1RS chromosome translocation from rye to wheat occurred with certain
varieties (e.g. Slejpner, Hornet) in the late 1980s and provided new disease resistance traits. It
was then found to give yield benefits, so the translocation has been retained in a subset of modern
wheats, even though the disease benefits no longer apply. However, the 1BL/1RS translocation
has been associated with negative qualities for animal feed and it is also associated with increased
residue viscosity. Information about varieties containing the 1BL/1RS translocation is not readily
available to growers and processors. However, as with hard wheats, distillers have identified
varieties with 1BL/1RS that are undesirable. Experience in the feed industry suggests that not all
1BL/1RS varieties have a problem with viscosity, and this is likely to be borne out with alcohol
yield. For example, Ambrosia has the 1BL/1RS translocation but has not shown very high
residue viscosities whereas Kipling (also 1BL/1RS) consistently gives high viscosity and poor
alcohol yields.
4.1.5 Future Breeding and Genetic Improvement
Wheat breeders are now breeding for alcohol as a specific market. Indeed, a Defra and
Scottish Executive Environmental and Rural Affairs Department (SEERAD) sponsored LINK
60
project, in which HGCA is a partner, aims to facilitate the breeding of high energy varieties for
feed and alcohol production (GREEN grain; HGCA Project 2979; www.greengrain.org). In
addition to traits associated with grain processing yield and efficiency, breeding of varieties for
alcohol production is likely to require somewhat different prioritisation of agronomic traits. For
instance, lodging resistance may have increased importance to allow early nitrogen applications,
and earliness may have increased importance to minimise grain-drying costs. Current analogous
research in America by Monsanto and Pioneer is attempting to identify hybrids which maximise
alcohol production in maize (Bryan, 2002). Swanston et al. 2005c (and others) have suggested
that variety mixtures may be suitable for alcohol production, giving greater consistency of yield
and potentially offering sustainability benefits. However, as with cropping for other markets,
grain yield and quality from mixtures tend to under-perform the better variety in a mixture.
4.1.6 Conclusions on Varietal Effects
Current varieties (Groups 3 & 4 in the HGCA RL) show variation in grain yield from
99% (Riband) to 107% (Glasgow & Alchemy) of control and variation in alcohol processing
yield from 432 (Hyperion) to 452 (Glasgow) litres per dry tonne (4.5% difference; Figure 10).
Grain yield is therefore responsible for somewhat more of the variation in alcohol production
(l/ha) than alcohol processing yield. However, this may change in future as breeders turn their
attention to improvement of processing performance and as interactions with growing conditions
(especially N status) are exploited. At present, there is a very useful positive association between
both components of alcohol production, exemplified by Glasgow. However, it remains to be seen
whether this will apply generally in future genetic improvements. In the case of Glasgow,
suitability to alcohol production is not perfect since this variety has relatively poor resistance to
lodging, which may preclude use of early N applications to maximise grain quality.
4.2 Environment and Management Effects
Grain yields from wheat in the UK are amongst the highest in the world (Sylvester-
Bradley et al., 2005). The combination of high yielding varieties giving high alcohol yields may
well provide the UK industry with a competitive advantage over other countries. However, costs
of production are also high in the UK and the prospect of a significant alcohol market only serves
to emphasise the importance of maximising grain productivity (per unit of cost). The following
section examines the potential to locate and manage wheat crops with high value for the biofuel
market, whilst also maximising their productivity.
61
4.2.1 Year and Site Variation
Figure 11 represents the data in Figure 10, but showing the different sites. Alcohol
processing yields were generally higher in 2005 than in 2003 or 2004, and protein contents
generally less. The range in alcohol yields across sites and varieties is sizeable at 40-50 litres per
dry tonne and fairly consistent across years.
62
400
410
420
430
440
450
460
470
480
7 8 9 10 11 12 13 14
2003
400
410
420
430
440
450
460
470
480
7 8 9 10 11 12 13 14
Alc
ohol
yie
ld l/
t
2004
400
410
420
430
440
450
460
470
480
7 8 9 10 11 12 13 14
Protein %DM
2005
Figure 11 - Response of alcohol yield to protein content across varieties at different sites within a year. In each year all varieties are represented at all sites. Regression analysis justifies parallel lines in each of the years, but with no difference in slope between sites and is not shown for clarity.
63
Variation between sites is generally greater than variation between varieties – the sites tend to
cluster markedly, often with a fairly limited range in alcohol yields and protein contents within
each site. Across varieties within a site the protein-alcohol yield relationship does not generally
hold up. Causes of inter-site variation may be numerous, including location, soil types.
management, fertility, yield potential and weather. These will now be discussed.
4.2.2 Location (North vs South)
Comparing alcohol yields from Scotland to those from England (Figure 12) indicates that
trials in Scotland generally give lower grain proteins and higher alcohol yields. This probably
results from a combination of climate and soil characteristics that has been exploited traditionally
by the Scottish distilling industry. Scottish soils generally have greater organic matter contents,
but the organic matter has a high C:N ratio hence releases less N through mineralisation. The
cooler climate also provides less evapo-transpiration and more leaching of nitrogen, and it gives a
longer grain-filling period which increases starch deposition relative to the amount of nitrogen
taken up.
400
410
420
430
440
450
460
470
480
5 6 7 8 9 10 11 12 13 14 15
Protein %DM
Alc
ohol
yie
ld (l
/t)
Scotland
England North
England South
Figure 12 - Response of alcohol processing yield to protein content, grouped by growing region.
64
4.2.3 Soil Type
Other than the comparison between Scotland and England above, there is little empirical
evidence on which to base deductions about soil type. Suffice it to say that soils capable of high
yields and least at risk of drought are likely to give lowest protein contents and therefore highest
alcohol yields. Organic or peaty soils will tend to give high protein levels and low alcohol yields.
4.2.4 Management
The management of crops for biofuels ideally needs to meet a range of objectives; (A)
maximise financial profitability, (B) optimise grain quality for alcohol production (C) minimise
GHG emissions per unit of bioethanol produced and (D) maximise energy balance of the system
and minimise other adverse environmental effects of growing the crop (Loyce et al., 2002).
Generally, these objectives will be achieved by optimising grain yields with judicious use of
mechanical power and agricultural inputs, especially N fertilisers (Rosenberger et al., 2001,
Rosenberger, 2001).
Costs of growing wheat are shown in Figure 13 in both economic and energy terms. It is
clear that if cost considerations change from a solely economic basis to include some measure of
GHG emissions there must be a shift in optimum production practices, particularly with respect to
use of nitrogen fertilisers, but also to minimise drying costs, perhaps by adoption of earlier-
maturing varieties. Such changes are likely to bring other environmental benefits.
Fertilising20%
Harvesting15%
Sowing10%
Cultivation14%
Protecting27%
Drying14%
Fertilising51%
Harvesting6%
Drying17%
Protecting7%
Cultivation9%
Sowing10%
Figure 13 - Relative costs of growing a crop of wheat yielding 8 t/ha grain in terms of energy (left) and money (right). Costs of each operation include materials, labour and machinery (Source: ADAS)
65
If the farming system includes a sequence of cereal crops, it is likely that those grown for
alcohol should be grown first, to capitalise on the high yields and lower grain protein of the ‘first
wheat’ niche (Vaidyanathan, 1987). (Conversely, wheat crops grown for breadmaking will tend
to benefit in terms of grain protein content from being grown following another cereal.) Given
the expected expansion of the oilseed rape area for biodiesel it seems likely that suitable
opportunities for biofuel wheats will increase within UK arable rotations. However, there are
implications for crop nutrition and protection of these expected changes, and further research will
be needed to verify the best ways of maximising profit when both biodiesel and bioethanol
markets are operational.
To maximise GHG benefits through in-season crop management, in broad terms, growers
should seek to minimise the number of passes and minimise agricultural inputs. It is likely that
this approach will only show real benefits when a carbon accreditation scheme emerges. For
example, in circumstances where penalties on weed control are minor, the use of minimum tillage
may reduce the farm diesel input per ha. On the other hand, reducing inputs such as fertilisers
and pesticides to below the economic optimum for yield will result in significant yield losses and
reduced profitability.
Optimum input levels for maximising profitability of inputs such as fertilisers will change
if sufficient economic incentives are introduced. In the case of producing grain for alcohol,
processors may pay premiums for grain of suitable quality, as is done in the milling industry.
Grain that gives 480 l/alcohol per dry tonne is obviously worth more to processors than grain that
only yields 410 l/alcohol per dry tonne, and it makes sense for the processor to pass some of this
added value back to the grower to incentivise the market.
In the case of GHG emissions, it is likely that there will be some form of ‘carbon
assurance’ for biofuels that are used to meet the RTFO requirement of 5% by 2010. Whilst in the
first instance this is likely to be a relatively straightforward reporting procedure, it is conceivable
that in future growers could be rewarded financially for producing grain for alcohol with reduced
associated GHG emissions. Work surrounding this issue is currently being undertaken through the
HGCA Research Project “Facilitating Carbon Accreditation Schemes for Biofuels: Feedstock
Production”.
66
Management strategies for wheat for alcohol will be explored in the following sections.
Recognising that the market is in its early development, we shall assume no financial or
regulatory incentives for quality or GHG reductions, but will show how growers should be
seeking to optimise alcohol yields per ha.
4.2.5 Crop Establishment
In terms of profitability and quality for alcohol production the most important decision at
drilling is variety choice (see Section 4.1). This must represent a compromise between grain
yield, grain quality and agronomic characteristics.
Establishment can be very important for yield (Blake et al., 2003). In general,
cultivations, seed rates and sowing dates for biofuel wheat should be no different than for
conventional markets. However, grain quality considerations may dictate choice of a variety with
high lodging risk (e.g. Glasgow). Also the rotation and fertiliser strategies to enhance alcohol
yield may increase lodging risk. Thus later sowings and/or lower seed rates than normal may be
preferable.
4.2.6 Crop Nutrition
Requirements for potassium, phosphate and minor nutrients will be the same with wheat
for alcohol as for conventional markets, and nutrients should be applied as appropriate for the
rotation (see RB209, (MAFF, 2000)). N fertiliser is the single most important management factor
to be considered when growing wheat for bioethanol, due to its large effects on grain yield,
alcohol yield as well as GHG emissions and energy balance.
67
Figure 14 shows a response curve to N fertiliser developed over many sites and seasons
from experiments on feed wheats on clay soils. Initial increases in N fertiliser give substantial
increases in yield, but as the quantity of N applied increases the increments in yield reduce, until a
plateau is reached. Larger N applications may result in reduced yields. Individual N response
curves vary due to available soil N, soil type and achievable yield, but the shape of the response is
generally consistent and can definitely be used to explore effects of N fertiliser on alcohol
production.
0
1
2
3
4
5
6
7
8
9
10
0 100 200 300N applied (kg/ha)
grai
n yi
eld
(t/ha
)
Figure 14 - Standard yield response of wheat grain to N fertiliser. The vertical line shows the economic optimum assuming a grain price of £75/t and a fertiliser price of £150/t ammonium nitrate (34.5% N).
When growing feed wheat, growers should apply the quantity of nitrogen fertiliser that
provides the largest financial return per ha, i.e. the economic optimum. This optimum is
dependent on the price of wheat relative to nitrogen (the break-even ratio). Using the response
curve in Figure 14 and current prices of £75 per t for grain and £150 per t ammonium nitrate
(breakeven ratio of about 6:1) the optimum N rate is about 165 kg/ha. Historically, higher grain
prices and lower fertiliser prices have given a break-even ratio of about 3:1, and optimum N rates
of about 190 kg/ha. Modern volatile markets mean that N rate decisions should be linked to
pricing strategies on the farm.
68
When growing for a milling market, growers need to meet minimum specifications for
protein content (usually 13%) and therefore generally apply more N than the optimum for yield.
In the case of alcohol, the value of the grain to the processor, in terms of alcohol yield, decreases
as protein concentration increases. Figure 15 shows the typical response of grain protein to N
fertiliser, taken from the same experiments as in Figure 14, and the effect of N on alcohol
processing yield can be inferred using the replacement relationship of 7.2 l alcohol per tonne per
% decrease in protein (see Figure 3). Increasing fertiliser N from zero to 300 kg/ha increases
protein content from 8.5% to 12.5% and is expected to reduce alcohol processing yield from 455
l/t to less than 430 l/t. At the optimum N application for grain yield (165 kg/ha) the expected
alcohol processing yield is 439 l/t, considerably below its maximum of 457 l/t.
Figure 15 - Effect of N fertiliser on grain protein and alcohol processing yield.
Whilst the grower will be interested in optimising grain yields, and processors in
optimising processing yields, the ultimate objective of the industry as a whole should be to
optimise alcohol yields per ha. The effect of N fertiliser on alcohol production per ha can be seen
by multiplying grain yield per ha by alcohol yield per tonne (Figure 16). This suggests that
maximum alcohol yields per ha are achieved at 200 kg/ha N, a greater N rate than the current
optimum for grain yield. Thus the effect of N on grain yield is more important in determining
alcohol production per ha than the effect on alcohol processing yield.
7
8
9
10
11
12
13
0 100 200 300N applied (kg/ha)
Gra
in p
rote
in %
DM
420
430
440
450
460
Alc
ohol
pro
cess
ing
yiel
d(li
tres
/dry
tonn
e)
69
Figure 16 The effect of N fertiliser on alcohol production per ha. The economic optimum for grain yield (open diamonds) is 35kg/ha less than the N rate giving maximum alcohol production (closed diamonds).
Given the effect of N application on alcohol processing yield, and the potential value of
increased alcohol processing yield to the processor, it may prove worthwhile for processors to
offer premiums for high alcohol yields (as discussed in Section 3.5). This would have the effect
of reducing optimum N rates, which would have additional benefits of reducing GHG emissions.
If premiums are not offered for alcohol yield, then the economic optimum N rate for a farmer
growing wheat for bioethanol will be exactly the same as for growing feed wheat; the N rate
which gives the optimal grain yield/ha. If, for arguments sake, the bioethanol producer was
growing the wheat crop, the economic optimum N rate would be that which gives the optimal
alcohol yield/ha; this would depend on the relationships between grain yield, protein content,
alcohol processing yield and N fertiliser previously described, and the price of alcohol relative to
nitrogen fertiliser. Further analysis is required, exploring various economic and accreditation
scenarios, so as to maximise the economic benefits to all in the supply chain, and hence optimise
nitrogen nutrition for bioethanol production.
The responses of alcohol production to N fertiliser (in Figures 15 and 16) have yet to be
validated in full, but they are supported by alcohol yield measurements on samples from one site-
0
1,000
2,000
3,000
4,000
0 100 200 300N applied (kg/ha)
Alc
ohol
pro
duct
ion
(litr
es/h
a)
.
70
season within project “Genetic Reduction of Energy Use and Emissions of Nitrogen through
Cereal Production” (GREEN grain) (HGCA Project 2979) where grain from N response
experiments using the varieties Riband and Option had been tested with N rates from zero to 240
kg/ha N (Verhoeven et al., in preparation).
In the context of alcohol production, there may be further considerations affecting
processing efficiency; N application has been shown to decrease the auto-amylolytic rate
significantly (Aufhammer et al. 1996), and this is consistent with effects found on amylase
activity or Hagberg falling number in the context of breadmaking (MacDonald and Vaidyanathan
1987; Kindred et al., 2005). This effect is best explained through the differences in grain ripeness
at harvest caused by N. It is unlikely to be sufficient to influence N applications, but it may
indicate potential to manipulate harvesting strategies to optimise alcohol processing.
4.2.7 N Timing
Timing of N application is known to affect grain protein content of wheat (Dampney,
1987). The effect of applications of nitrogen during stem extension and grain filling on the quality
of wheat grain used for breadmaking (Bhandari et al., 2006) and of barley (Lord and Vaughan,
1987). Taylor and Roscrow (1990) have shown that N timings can also affect alcohol yields.
Whilst late applications of N improve grain protein for milling markets (Dampney et al., 2006),
applying N fertiliser early is likely to result in lower grain proteins, hence benefiting alcohol
processing yield. However, there may be subsidiary effects of earlier N application on early
growth, tillering and lodging risk which are detrimental, particularly for relatively fast
developing, lodging prone varieties such as Glasgow. There is the possibility also that earlier N
applications are less efficiently taken up by the crop and may result in greater N losses due to
leaching or denitrification to nitrous oxide. Recently funded work is looking at the effects of N
timing on potential alcohol yield through field experiments (Extension to HGCA Project 3084;
Optimising fertiliser nitrogen levels for modern cereal crops).
4.2.8 Crop Protection
Maximising grain yield and grain filling by ensuring the crop is weed, disease, pest and
lodging free is likely to increase grain yields as well as starch contents and alcohol processing
yields. In addition to choosing resistant varieties, fungicides can be especially important in
protecting grain filling; samples from HGCA RL untreated plots analysed as part of the GREEN
grain project had shrivelled grain with high protein contents and very low alcohol yields.
71
Fusarium ear blight may result in high levels of Fusarium mycotoxins, which should be avoided
because these can enter the food chain through the DDGS. However, given normal Fusarium
mycotoxin levels in the UK it is unlikely that wheat crops for biofuel would warrant a specific
fungicide ear spray. Latest advice on this is given in Topic Sheet 91 “Managing the Fusarium
mycotoxin risk in wheat”.
4.2.9 Harvesting and Drying
Whilst growers should seek to harvest grain in a timely fashion to minimise drying costs
and risks of sprouting in the ear, perhaps by preferring early-maturing varieties, harvesting early
to avoid low Hagberg Falling Numbers will be less critical than for milling wheats. Indeed, low
HFN may even be beneficial if endogenous enzymes are relied upon to breakdown starch (see
Section 3.2.2.3), and delays in harvest have been shown to increase endogenous starch degrading
activity in some varieties (Aufhammer, 1996). However, advanced sprouting will be associated
with losses of starch and sugars by respiration and germination, and this is likely to reduce
alcohol processing yields if the process advances too far.
Whilst it is important that grain is adequately dry to avoid fungal and mould
contamination, and to avoid storage problems, it is possible that grain with moisture contents
greater than 15% may be accepted by fuel alcohol producers at lower penalties than in other
markets. As moisture contents increase the proportion of the traded grain which is starch will
obviously decrease, so some discount for high moisture grain is inevitable. Very high moisture
grain can cause problems with processing, and is unsuitable for long term storage, but, depending
on the set-up of the plant, moisture contents of up to, say, 16-17% are unlikely to cause the
processor significant extra costs provided intake is immediate.
Drying wet grain presents a substantial economic cost to growers, and can also make up a
very large proportion of the total energy balance and GHG emissions from bioethanol production
(Table 4). From these perspectives it may prove advantageous to avoid drying grain for
bioethanol as far as is possible. Because of the storage problems associated with high moisture
content, the scope for accepting high moisture content grain would be most around harvest,
though it should be possible to store grain of 16% moisture for periods of up to a month (see
HGCA Safe Storage Time Calculator; www.hgca.com).
72
4.2.10 Conclusions on Effects of Environment and Management
At this stage, grain yield will remain the dominant driver of crop management for alcohol
production. Only small changes to management for the feed market are envisaged. The most
important consideration at present is variety choice. However, with the introduction of premiums
for grain quality and of accreditation schemes for GHG emissions changes to crop manangement
may be larger. Given the large contribution that N fertiliser can make to the GHG balance, and its
importance in determining grain yield and alcohol yields, it is envisaged that significant
adjustments to N management may be required. Eventually, carbon accreditation may also
encourage changes in cultivations, harvesting, drying and storage strategies to reduce GHG
emissions on-farm. The major implications of all agronomic practices on GHG emissions are
being investigated more thoroughly in HGCA project MD-0607-0003 (Facilitating carbon
accreditation schemes for biofuels - feedstock production).
Much of the variation in alcohol processing yield is associated with variation in grain
protein content. There is little evidence that the response of alcohol yield to protein is much
affected by agronomic factors. Thus, of all management factors, fertiliser N has the greatest effect
on alcohol yields. However, alcohol yield at a given protein concentration can also be much
affected by year, site, management and variety, with somewhat greater variation between sites
and years than between varieties. It will therefore be important to explore effects on components
of the grain other than protein and starch; principally non-starch polysaccharides.
Current knowledge suggests that the key points to consider when growing wheat for biofuel
or alcohol production may be summarised as:
1. Grow a soft-milling, high yielding variety (see HGCA RL)
2. Select a high yielding situation
3. Avoid over application of fertiliser N
4. Avoid late application of fertiliser N
5. Manage grain production and drying to avoid mycotoxin development.
73
5.0 Final Perspective
It seems inappropriate at this early stage in development of the UK bioethanol industry to
draw final conclusions. Rather, we offer here our perspective on the important considerations,
going forward.
The principal stakeholders in alcohol production from wheat are the growers and
processors, who seek financial returns, and the consumers who seek GHG savings. We believe
that full stakeholder satisfaction is feasible, but that it will arise most quickly through some
concerted industry integration.
The processors primarily look to their feedstock for a good alcohol yield. Good
feedstocks give increased saleable product, and also reduced energy costs in heating and drying
residual materials. The primary driver for increasing alcohol yields is the amount of starch.
While saccharification and fermentation efficiencies are undoubtedly of concern, they are less
important than starch content per se. It is evident that starch content is increased with reduced
protein. Whilst the potential for reducing protein contents genetically, hence increasing alcohol
yields, is being investigated by the GREEN grain project (HGCA 2979), there is also a need to
investigate how alcohol yields can be increased through crop management, particularly N
fertiliser strategies.
Differences in protein content do not fully explain differences in starch content or alcohol
yield. Aside from protein and starch the only other significant constituent of the grain is non-
starch polysaccharide (NSP). It seems highly probable that much of the variation in alcohol yield
not accounted for by protein content must be due to differences in NSPs. We deduce from
comparisons of varieties reported here that genetic variation in NSPs can be large and, since ash
and oil contents are small, this variation must cause differences in starch at a given protein
content, as well as influencing residue viscosity. There is therefore a major need to address
NSPs, when researching how grain constituents affect alcohol yield. Given that 80% of NSPs are
found in the bran, another promising approach should be to consider grain components
histologically (i.e. germ, bran and endosperm), to explain effects of grain size and shape. HGCA,
with SWRI, are funding a studentship at Heriot-Watt University on this. An inverse relationship
between starch and NSP may explain why viscosity is generally inversely related to alcohol yield.
Certainly, the variation in NSPs amongst current varieties, and variation in NSPs caused by
environment and management, are worthy of new research.
74
In terms of measuring feedstock quality at intake, the ideal test would be a rapid
prediction of potential alcohol yield from an individual grain sample. This may indeed be
possible if work by FOSS UK Ltd., SWRI and others (in the GREEN grain project) fulfils its
promise of an accurate and reliable NIR calibration for alcohol yield. NIR has the significant
advantage that it is familiar to the grain and alcohol industries. However, direct prediction of
alcohol processing yield may still be some years from commercialisation. In its absence,
assessment of other grain constituents may be the best alternative. Since starch is so difficult to
measure, protein provides the best alternative. (NSPs and viscosity cannot currently be measured
on a sufficiently rapid or cost effective basis to be used in a grain intake test.) Protein has a
number of advantages as an intake test; it is linked to alcohol yield by a well recognised
relationship, its measurement is understood and accepted by the grain trade, it is reasonably well
defined for different varieties, it is directly linked to N fertiliser strategies, and it is understood by
growers as being so.
To help account for scatter in the protein-alcohol relationship, it may be best to include
variety differences in alcohol yield in prediction approaches. Within a variety, the protein: alcohol
yield relationship seems to be reasonably consistent across sites and N nutrition levels, though
this is less true across varieties. It is possible that these reasonably consistent variety effects may
be due to differences in NSP contents. We suggest that the response of alcohol yield to protein of
-7.2 l/t per % protein could be used with specific base values for different varieties, to give a
workable method of predicting alcohol yield. The analyses of distilling value of certain RL
varieties by SWRI allow this to easily be achieved for varieties of interest to the potable distilling
industry (i.e. by extrapolation from Figure 8C). However, because fuel alcohol producers are
likely to use a wider range of varieties than have previously been considered by the distilling
industry, there is a need to test the distilling value of all varieties on the HGCA Recommended
List. The deviation in alcohol yield from the –7.2 l/t per % protein response could be quantified
for all varieties likely to be used for fuel or potable alcohol production, allowing processors to
predict the likely alcohol yield of the feedstock at grain intake with reasonable accuracy.
In practice, growers are unlikely to grow and produce grain of perfect distilling value
without an economic incentive. Premiums based on both protein and variety would help to
incentivise the market, maximise financial returns to the processor and the grower and provide
appropriate price signals to breeders and others in the agricultural supply industry. Because of the
strong associations between grain protein and alcohol yield, and because of the large energy and
75
GHG costs associated with N fertiliser use, the issues surrounding N fertilisers are potentially of
great importance to the bioethanol industry. Economic instruments to reward reductions in GHG
emissions could have large impacts on how N fertilisers are used. Without a market mechanism to
reward lower proteins it is unlikely that the market will work as effectively as it could: in striving
for high grain yields growers may use unsuitable varieties and over-generous N rates that
compromise alcohol processing yields and processing efficiency, giving reduced economic
returns and increased energy costs to the processor. In particular, GHG emissions could be higher
than necessary. Further work is required to explore the size of premiums and potential market
mechanisms required to optimise the supply chain for each of its objectives: maximising financial
return to growers and processors and minimising GHG emissions.
Other parameters used in standard feed contracts (e.g. specific weight, moisture content,
freedom from ergot, mycotoxins, heavy metals etc.) are probably suitable for alcohol distilling.
Whilst it may be possible for bioethanol producers to accept lower quality grain than traditional
markets this would have to be at a price discount. If DDGS are to be sold for animal feed then
grain ‘health’ is of importance, but if DDGS are used for non-food uses then contracts may be
less restrictive.
In conclusion, the generally high yields and starch contents of UK wheats mean that UK
growers are well placed to produce suitable feedstocks for bioalcohol. If the progress with
varietal improvement and crop management for bread-making markets over the past thirty years
is anything to go by, and adequate investment is made, then it should be possible to maximise
alcohol production, maximise financial returns to growers and processors and minimise GHG
emissions.
Future Research Needs
The most urgent areas for future research are as follows:
• Optimising crop management, especially with respect to rotations and N fertilisers
• Wider testing of varietal effects on alcohol yield
• Development of a rapid and accurate test for assessing alcohol yield in the laboratory, using
fuel alcohol methodology
• Investigation into new and novel uses of co-products from alcohol production
76
• Investigation into novel processes which can minimise energy usage and maximise rate and
efficiency of processing in fuel alcohol processing.
• Investigation into the fermentable constituents of the wheat grain and their interactions with
non-fermentable constituents.
• Economic consideration of how the supply chain could best be optimised to deliver maximal
alcohol production, maximal financial returns for growers and processors, and maximal GHG
emission savings.
77
6.0 Glossary
Biodiesel - A renewable fuel produced from oil rich crops such as rape or waste fats such as
tallow and used cooking oil. Biodiesel can be added to conventional diesel in a 5% biodiesel,
95% diesel blend without major engine modifications and can be used in some engines as straight
biodiesel.
Bioethanol - An alcohol produced from starch rich crops such as wheat and maize and sugar rich
crops such as sugar beet and sugar cane which can be used in industrial, fuel and potable
industries. Fermentation of the sugars produces ethanol that is distilled to 95% volume for the
potable alcohol industry and dehydrated to over 95% volume for the fuel industry.
Biofuel - A fuel made from recently living biomass (compare with fossil fuel). Biofuels are
renewable as they are derived from recently living plant material. Biodiesel and Bioethanol are
examples of biofuels.
Carbon Dioxide (CO2) - An atmospheric gas that is produced by combustion of carbon rich
materials and through respiration and used in photosynthesis by plants to form sugars, storage
compounds such as starch and biomass. Carbon dioxide is a yeast fermentation product and can
be captured as a co-product of the fermentation process and sold for carbonation of drinks or as a
gas for industry.
Cold Cooking - Milled grain is either enzymatically saccharified without a cooking step or
cooked at a low temperature (80°C) prior to enzymatic saccharification.
Distillation - Process where different components of a liquid are separated on the basis of their
boiling point by heat.
Dried Distillers Grains with Solubles (DDGS) - A co-product from the production of bioethanol
from starch rich crops that is used as a protein and fibre rich food for livestock markets.
Dry Grind - Process in which the whole grain is milled and processed for bioalcohol production.
Fermentation - The production of ethanol from sugars by yeast species in anaerobic conditions
with the production of CO2.
78
Fossil Fuels - Fuels formed from the remains of ancient animals and plants. Rich in carbon and
have taken millions of years to form under extreme pressure and heat. Coal, gas, peat and oil are
fossil fuels, petroleum and diesel are derived from oil. Fossil fuels are non-renewable and are
limited in supply, once they are used up they are gone forever.
Flexible Fuel Vehicle - A vehicle which can run on any blend of ethanol and petroleum up to
85% ethanol 15% petrol. Sensors in the engine automatically detect the ratio of ethanol to petrol
and adjust the fuel injection to suit the fuel.
Greenhouse Gas - A gas such as carbon dioxide, carbon monoxide, water and methane which
absorbs some of the longer wavelength infrared radiation (heat) that the Earth radiates back and
therefore traps heat in the atmosphere.
HCGA Recommended List (RL) - Booklet containing information on the suitability of UK
cereals and oilseed varieties which for a variety of end uses, farming systems and location.
Lignocellulosics - Materials containing a high proportion of cellulose, hemicellulose and lignin
cell wall components. The composition each component varies significantly depending upon the
feedstock; and determines its processing efficiency. Typical feedstocks are wood materials, straw,
stover and paper.
Malliard Reaction - Where sugars and amino acids form a complex under heat treatment caused
by the reactive carbonyl group of the sugar interacting with the nucleophilic amino group of the
amino acid. Can also be known as a “browning reaction”
Malt Whisky - Whisky produced entirely from barley malt as the cereal source.
Mycotoxin - A class of toxins such as aflatoxin, aflatoxins, ochratoxin A, fumonisins,
zearalenone, trichothecenes and deoxynivalenol (DON) which are toxic to man and animals and
produced by moulds such as Fusarium species in the field or Penicillum species in storage.
Near Infrared Spectroscopy (NIR) - A technique for rapidly assessing the amount of a specific
component of a biological material. Near infrared light is passed through a sample. Illumination
results in changes in the sample so that the amount of light absorbed is proportional to the amount
79
of a particular component in the sample. Illumination at different wavelengths allows different
components to be quantified.
Neutral Alcohol - Ethanol containing 95.5% alcohol and 4.5% water which has no colour, taste
or aroma. Neutral alcohol is used as a basis for the production of vodka, gin and liqueurs.
Potable Alcohol - An alcohol which is fit for human consumption (includes neutral alcohol and
Scotch whisky). Also called ‘beverage alcohol’.
HCGA Recommended List (RL) - Booklet published by the HGCA containing information on
the suitability of UK cereals and oilseed varieties for a variety of end uses, farming systems and
location.
Retrogradation (‘set back’) - The change from a dispersed amorphous state to an insoluble
crystalline state that occurs when gelatinised starch begins to re-associate upon cooling. Starch in
this state is resistant to degradation and causes processing problems due to high viscosity and
results in low alcohol yield.
Renewable Transport Fuels Obligation (RTFO) - UK government target for the amount of
biofuel to be included in conventional fuel supplies from 2008. A way to ensure long term
confidence in the biofuels market in the UK and reduce emissions of greenhouse gases. Targets
set is a 2.5% biofuel component by 2008, 3.75% biofuel component by 2009 and 5% biofuel
component by 2010/11.
Saccharification - The conversion of starch and dextrins to fermentable sugars such as glucose
and maltose by enzymatic hydrolysis.
Scotch Grain Whisky - Whisky made from approximately 90% unmalted cereals (typically
wheat) and 10% high enzyme malted barley for saccharification, whose products conforms to the
Scotch Whisky Order (1990). Grain whisky is mixed with malt whisky to produce blended
whisky which accounts for 90% of Scotch whisky sales.
Stillage - Whole stillage is made up of dissolved solids, dead yeast, proteins and water after the
fermentation step. This is separated into the liquid components “thin stillage” and solid
components “whole stillage”. The whole stillage may be dried to form Dried Distillers Grains.
80
The water component of thin stillage is evaporated to leave a syrup which can be added to the
whole stillage component and dried further to form Distillers Dried Grains with Solubles
(DDGS).
Viscosity - The thickness or the resistance to flow or stirring by a liquid.
Wet Grind - Grain is soaked (or steeped) in sulphuric acid for 24 hours and grain components
such as germ, gluten and bran removed before the starch component is milled and used in alcohol
production. Separation of grain components at wet grain facilities allows the production of a
number of economically valuable co-products as well as ethanol.
81
7.0 References Cited
AACC Method 76-11 Starch-glucoamylase method with subsequent measurement of glucose
with glucose oxidase. American Association of Cereal Chemists Aman MR, Hesselman K (1984) Analysis of starch and other main constituents of cereal grains.
Swedish Journal of Agricultural Research 14: 135-139 Aufhammer W (1998) Bioethanol yield of different varieties and variety mixtures of winter
wheat and triticale. BioBase European Energy Crops InterNetwork. http://www.eeci.net/archive/biobase/B10381.html
Aufhammer W, Pieper HJ, Kasser J, Schafer V, Senn T, Kubler E (1996) The suitability of
grains from cereal crops with different N supply for bioethanol production. Journal of Agronomy and Crop Science-Zeitschrift fur Acker und Pflanzenbau 177: 185-196
Aufhammer W, Pieper HJ, Kubler E, Schafer V (1994) Eignung des korngutes von weizen
und triticale fur die bioethanolproducktion in abhangigkeit vom verarbeitungszeitpunkt nach der reife Bodenkultur 45: 177-187
Aufhammer W, Pieper HJ, Stutzel H, Schafer V (1993) Suitability of the Grain of Different
Cereal Species for Bioethanol Production Dependent on Cultivars and Growing Conditions. Bodenkultur 44: 183-194
Batchelor S, Booth EJ, Walker KC, Cook P (1993) The potential for bioethanol production
from wheat in the U.K. Research Review No. 29, Home-Grown Cereals Authority, London
Bhandari DG, Millar S, Weightman R, Verhoeven T, Shewry PR, Georget D, Belton P (2006) Managing late N applications to meet wheat protein market requirements using pre-harvest near infrared (NIR) sensing (LK0927). Project Report No. 401. HGCA, London
Billins P, Woods J, Tipper R (2005) Developing Carbon and Greenhouse Gas Assurance for
Bioethanol Production in the UK. Home-Grown Cereals Authority, London Blake JJ, Spink JH, Dyer C (2003) Factors affecting cereal establishment and its prediction.
Research Review No. 51. Home-Grown Cereals Authority, London Bothast RJ, Schlicher MA (2005) Biotechnological processes for conversion of corn into
ethanol. Applied Microbiology and Biotechnology 67: 19-25 BP (2006) Renewable Energy. In Quantifying energy - BP statistical review of world energy
Bringhurst TA, Fotheringham AL, Brosnan J (2003) Grain whisky: raw materials and processing. In I Russel, Bamforth, C.W., Stewart, G., ed, Whisky: technology, production and marketing. Academic Press, London
Brosnan JM, Makari S, L P, Cochrane MP (1998) What makes a good distilling wheat? In I Campbell, ed, Proceedings of the fifth Aviemore conference on malting, brewing and distilling. Institute of Brewing, London
Bryan T (2002) The search for a perfect ethanol corn. Ethanol Producer Magazine. September
2002 Capouchova I, Maresova JPD (2003) Evaluation of size distribution of stach granules in
selected wheat varieties by the low angle laser light scattering method. Plant Soil and Environment 49: 12-17
Carré B, Muley N, Gomez J, Oury F-X, Laffitte E, Guillou D, Signoret C (2005) Soft wheat
instead of hard wheat in pelletted diets results in high starch digestibility in broiler chickens. British Poultry Science 46: 66-74
Centaur Grain (2006) The members guide to the CGML wheat for ethanol contract. Coles GD, Hartunian-Sowa SM, Jamieson PD, Hay AJ (1997) Environmentally-induced
variation in starch and non-starch polysaccharide content in wheat. Journal of Cereal Science 26: 47-54
Dampney P, Edwards A, Dyer C (2006) Managing nitrogen applications to new Group 1 and 2
wheat varieties. Project Report No. 400. HGCA, London Dampney PMR (1987) The effect of application of nitrogen during stem extension and grain
filling on the quality of wheat grain used for breadmaking. Aspects of Applied Biology 15: 239-248
Defra (2006) United Kingdom Cereal Yields 1885 onwards. Update 27/02/2006.
http://statistics.defra.gov.uk/esg/datasets/cyield_c.xls Department of Trade and Industry (2006) Second generation transport biofuels 2006 A
mission to the Netherlands, Germany and Finland. Department of Transport (2005) UK report to the commission on biofuels.
http://www.dft.gov.uk/stellent/groups/dft_roads/documents/page/dft_roads_038897.hcsp Draper SR, Stewart BA (1979) Procedures for the comparative assessment of quality in crop
varieties. III. Methods used in assessing grain protein content, Hagberg falling number, ease of milling and the bakery quality of wheat varieties. Journal of the National Institute for Agricultural Botany 15: 194-197
Elsayed M, Matthews R, Mortimer D (2003) Carbon and energy balances for a range of
biofuels options. Department of Trade and Industry Englyst HN, Cummings JH (1988) Improved method for measurement of dietary fibre as non-
starch polysaccharides in plant foods. Journal of the Association of Official Analytical Chemists 71 808-814
83
Englyst HN, Quigley ME, Hudson GJ, Cummings JH (1992) Determination of dietary fibre as non starch polysaccharides by gas-liquid chromatography. Analyst 117 1707-1714
Englyst K, Englyst H, Hudson G, Cole T, Cummings J (1999) Rapidly available glucose in
foods: an in vitro measurement that reflects the glycemic response. American Journal of Clinical Nutrition 69: 448-454
EU (2003) Directive 2003/30/EC of the European Parliment and of the Council of 8 May 2003 on
the promotion of the use of biofuels or other renewable fuels for transport. Official Journal of the European Union
er/stat_baro/observ/baro173b.pdf European Fuels Oxygenates Association (2006a) Technical Product Bulletin ETBE
http://www.efoa.org/docs/ETBE_PRODUCT_BULLETIN_JUN_2006.PDF European Fuels Oxygenates Association (2006b) Fuel ethers: regional differences.
http://www.efoa.org/EFOA_Pages/06_Q&A/06d_RegionTXT.html Ewing W (1997) The FEEDS directory Context Publications, Ashby De La Zouch, England Farrell AE, Plevin RJ, Turner BT, Jones AD, O'Hare M, Kammen DM (2006) Ethanol can
contribute to energy and environmental goals. Science 311: 506-508 Fleischer S, Senn T (2005) Regional plants - their potential for sustainable ethanol production,
their ecobalance and the effects of cereal properties on ethanol yields. Zuckerindustrie 130: 773-777
Flintham J, Evers AD, Kratochvil J (1993) Genetical and physiological studies on sprouting in
Wheat. Project Report 77. HGCA, London Genencor International (2005) Genencor launches industry transforming technology for ethanol
production. Genencor Press Release http://www.genencor.com/wt/gcor/pr_1120661186 Genencor International (2006) Genencor launches improved acid fungal protease for use in the
HGCA (2006b) Recommended List of Cereals and Oilseeds 2006/07. Home Grown Cereals
Authority, London Hill J, Nelson E, Tilman D, Polasky S, Tiffany D (2006) Environmental, economic, and
energetic costs and benefits of biodiesel and ethanol biofuels. Proceedings of the National Academy of Sciences of the United States of America
HM Government (2006) Climate change. The UK programme 2006. Today's climate,
tomorrow's challenge.
84
Ingledew WM (2003) Water re-use in fuel alcohol plants: effect on fermentation. In KA Jaques, TP Lyons, DR Kelsall, eds, The Alcohol Textbook. Nottingham University Press, Nottingham UK
Ingledew WM, Jones AM, Bhatty RS, Rossnagel BG (1995) Fuel Alcohol Production from
Hull-less Barley. Cereal Chemistry 72: 147-150 Ingledew WM, Thomas KC, Hynes SH, McLeod JG (1999) Viscosity concerns with rye
mashes used for ethanol production. Cereal Chemistry 76: 459-464 Jaques KA (2003) Ethanol production and the modern livestock feed industry. In KA Jaques, TP
Lyons, DR Kelsall, eds, The Alcohol Textbook. Nottingham University Press, Nottingham, UK
Jones AM, Ingledew WM (1994) Fuel Alcohol Production - Assessment of Selected
Commercial Proteases for Very High Gravity Wheat Mash Fermentation. Enzyme and Microbial Technology 16: 683-687
Jones DB (1931) Factors for converting percentage of N in foods and feeds into a percentage of
proteins. USDA circular 183: 21 Kelsall DR, Lyons TP (2003) Practical management of yeast: conversion of sugars to ethanol. In
KA Jaques, TP Lyons, DR Kelsall, eds, The Alcohol Textbook. Nottingham University Press, Nottingham, UK
Kindred DR, Gooding MJ, Ellis RH (2005) Nitrogen fertiliser and seed rate effects on Hagberg
falling number of wheat hybrids and their parents are associated with alpha-amylase activity, grain cavity size and dormancy. Journal of the Science of Food and Agriculture 85: 727-742
Koliatsou M, Palmer GH (2003) A new method to assess mealiness and steeliness of barley
varieties and relationship of mealiness with malting parameters. Journal of American Society of Brewing Chemists 61: 114-118
Lineback DR, Rasper VF (1998) Wheat carbohydrates. In Y Pomeranz, ed, Wheat Chemistry
and Technology, Volume 1 American Association of Cereal Chemists, Minnesota, USA, p pp 281
Lord EI, Vaughan J (1987) Optimising nitrogen applications for the production of malting
barley. Aspects of Applied Biology 15: 319-335 Loyce C, Meynard JM (1997) Low input wheat management techniques are more efficient in
ethanol production. Industrial Crops and Products 6: 271-283 Loyce C, Rellier JP, Meynard JM (2002) Management planning for winter wheat with multiple
objectives (2): ethanol-wheat production. Agricultural Systems 72: 33-57 MacDonald HG, Vaidyanathan LV (1987) Effects of nitrogen fertiliser on the Hagberg falling
number of winter wheat. Aspects of Applied Biology 15: 359-369 MAFF (2000) Fertiliser recommendations for agricultural and horticultural crops (RB209).
85
Maize Growers Association (2005) Agronomy Technical Note - October 2005 Grain maize- what’s it all about then!?
Martinant J-P, Billot A, Bouguennec A, Charmet G, Saulnier L, G. B (1999) Genetic and
environmental variations in water extractable arabinoxylans content and flour extract viscosity. Journal of Cereal Science 30: 45-48
Martinant J-P, Cadalen T, Billot A, Chartier S, Leroy P, Bernard M, Saulnier L, G. B
(1998) Genetic analysis of water-extractable arabinoxylans in bread wheat endosperm. Theoretical and Applied Genetics 97: 1069-1075
McCleary BV, Gibson TS, Mugford DC (1997) Measurement of total starch in cereal products
by amyloglucosidase – α-amylase method: Collaborative study. Journal of the Association of Official Analytical Chemists 80: 571-579
MacDonald H, Vaidyanathan L (1987) Effects of nitrogen fertiliser on the Hagberg falling
number of winter wheat. Aspects of Applied Biology 15: 359-364 Megazyme Total starch assay procedure (amyloglucosidase/alpha amylase method AOAC
Method 996.11, AACC Method 76.13, ICC Standard Method No. 168. Megazyme International Limited
Meredith J (2003) Understanding energy use and energy users in contemporary ethanol plants.
In The Alcohol Textbook. Nottingham University Press, Nottingham Morey RV, Tiffany DG, Hatfield DL (2005) Biomass for electricity and process heat at ethanol
plants. In ASAE Annual International Meeting, Tampa Convention Center, Tampa, Florida
Morrisons (2006) Morrisons opens the UK's first bioethanol E85 fuel pump- as SAAB GB
launches its 9-5 biopower for consumers that care. http://www.morrisons.co.uk/1424.asp Mortimer ND, Elsayed M, Horne R (2004) Energy and greenhouse gas emissions for
bioethanol production from wheat grain and sugar beet. A report for British Sugar. Report number 23. www.nnfcc.co.uk/nnfcclibrary/productreport/download.cfm?id=44
Narendranath NV, Thomas KC, Ingledew WM (2000) Urea hydrogen peroxide reduces the
numbers of Lactobacilli, nourishes yeast, and leaves no residues in the ethanol fermentation. Applied and Environmental Microbiology 66: 4187-4192
Nyachoti CM, House JD, Slominski BA, Seddon IR (2005) Energy and nutrient digestibilies in
wheat dried distillers' grains with solubles fed to growing pigs. Journal of Science of Food and Agriculture 85: 2581-2586
Patzek T (2006) The Real Biofuel Cycles. www.oilcrisis.com/ethanol/RealBiofuelCycles.pdf
86
Permolex (2006) http://www.permolex.com/red1.asp Power R (2003) Enzymatic conversion of starch to fermentable sugars. In KA Jaques, TP Lyons,
DR Kelsall, eds, The Alcohol Textbook. Nottingham University Press, Nottingham UK Punter G, Rickeard D, Larive J, Edwards R, Mortimer N, Horne R, Bauen A, Woods J
(2004) WTW Evaluation for production of ethanol from wheat. In Report FWG-P-04-024. Low Carbon Vehicle Partnership
Putnam D, Lueschen W, Kanne B, Hoverstad T (1991) A comparison of sweet sorghum
cultivars and maize for ethanol production. Journal of Production Agriculture 4: 377-381 Raeker MO, Gaines CS, Finney PL, Donelson T (1998) Granule size distribution and chemical
composition of starches from 12 soft wheat cultivars. Cereal Chemistry 75: 721-728 Richardson TH, Tan XQ, Frey G, Callen W, Cabell M, Lam D, Macomber J, Short JM,
Robertson DE, Miller C (2002) A novel, high performance enzyme for starch liquefaction - Discovery and optimization of a low pH, thermostable alpha-amylase. Journal of Biological Chemistry 277: 26501-26507
Rosenberger A (2001) Optimierung und bewertung der producktion von getreide korngut als
rohstoff fur die bioethanolzeugung. Universitat Hohenheim, Stuttgart Rosenberger A (2005) Identification of top-performing cereal cultivars for grain-to-ethanol
operations. Zuckerindustrie 130: 697-701 Rosenberger A, Kaul HP, Senn T, Aufhammer W (2001) Improving the energy balance of
bioethanol production from winter cereals: the effect of crop production intensity. Applied Energy 68: 51-67
Saulnier L, Peneau N, Thibault JF (1995) Variability in grain extract viscosity and water-
soluble arabinoxylan content in wheat. Journal of Cereal Science 22: 259-264 Schulze T, Krenn W, Potschacher P (2005) Basic considerations and concepts in the planning
and construction of grain-based bioethanol plants. Zuckerindustrie 130: 707-711 Senn T, Pieper HJ (2000) Classical Methods. In M Roehr, ed, The Biotechnology of Ethanol.
Wiley-VCH, Weinheim, Germany Simmonds NW (1995) The relation between yield and protein in cereal grain. Journal of the
Science of Food and Agriculture 67: 309-315 Skinner KA, Leathers TD (2004) Bacterial contaminants of fuel ethanol production. Journal of
Industrial Microbiology & Biotechnology 31: 401-408 Sorensen HR, Pedersen S, Meyer AS (2006) Optimization of reaction conditions for enzymatic
viscosity reduction and hydrolysis of wheat arabinoxylan in an industrial ethanol fermentation residue. Biotechnology Progress 22: 505-513
Sosulski K, Sosulski F (1994) Wheat as a Feedstock for Fuel Ethanol. Applied Biochemistry and
Biotechnology 45-6: 169-180
87
Sosulski K, Wang SM, Ingledew WM, Sosulski FW, Tang JM (1997) Preprocessed barley, rye, and triticale as a feedstock for an integrated fuel ethanol feedlot plant. Applied Biochemistry and Biotechnology 63-5: 59-70
Stitt M, Lilley RM, Gerhardt R, Heldt HW (1989) Metabolic levels in specific cells and
subcellular compartments of plant leaves. Methods in Enzymology 32: 518-564 Swanston J, Newton A, Brosnan J, Fotheringham A, Glasgow E (2005a) Determining the
spirit yield of wheat varieties and variety mixtures. Journal of Cereal Science (2005) 42: 127-134
Swanston JS, Smith PL (2005b) A Turbidity Test for a Genetic Component of Spirit Yield in
Wheat. In Worldwide Distilled Spirits Conference, Edinburgh Swanston JS, Newton AC (2005c) Mixtures of UK wheat as an efficient and environmentally
friendly source for bioethanol. Journal of Industrial Ecology 9: 109-126 Swanston JS, Smith PL, Gillespie TJ, Brosnan JM, Bringhurst TA, Agu RC (2006)
Associations between grain characteristics and alcohol yields among soft wheat varieties. Unpublished
Sylvester-Bradley R, Foulkes J, Reynolds M (2005) Future wheat yields: evidence, theory and
conjecture. In R Sylvester-Bradley, J Wiseman, eds, Yields of farmed species: constraints and opportunities in the 21st century. Nottingham University Press, Nottingham, UK
Szwarc A (2004) The use of bio-fuels in Brazil. In United Nations Framework Convention on
Climate Change - In session workshop on mitigation SBSTA21/COP10, Buenos Aires Taylor BR, Cranstoun DAS, Roscrow JC (1993) The quality of winter wheat varieties for
distilling from Scottish sites. Aspects of Applied Biology 36: 481-484 Taylor BR, Roscrow JC (1990) Factors affecting the quality of wheat grain for distilling in
northern Scotland. Aspects of Applied Biology 25: 183-191 Tesco plc (2006) Biofuels. http://www.tescocorporate.com/biofuels.htm The Analysis Committee of the Institute of Brewing (IOB) (1997) Recommended Methods of
the Institute of Brewing, Method 9.2, Viscosity of Beer. London. Thomas KC, Ingledew WM (1990) Fuel Alcohol Production - Effects of Free Amino Nitrogen
on Fermentation of Very-High-Gravity Wheat Mashes. Applied and Environmental Microbiology 56: 2046-2050
Thomas KC, Ingledew WM (1995) Production of fuel alcohol from oats by fermentation.
Journal of Industrial Microbiology 15: 125-130 Tibelius C, Trenholm H (1996) Coproducts and near coproducts of fuel ethanol fermentation
from grain. Final report Contract number 01531-5-7157. http://res2.agr.ca/publications/cfar/index-e.htm
Turley D, McKay H, Boatman N (2005) Environmental impacts of cereal and oilseed rape
cropping in the UK and assessment of the potential impacts arising from cultivation for liquid biofuel production. Research Review 54. HGCA, London
88
USCL Method 11-02 Starch determination in cereal products using the modified Ewers'
polarimetric method Vaidyanathan L (1987) Precision and reliability of measuring Hagberg falling number of wheat
including variability associated with crop husbandry and grain handling. Aspects of Applied Biology 15, Cereal Quality. Association of Applied Biologists, Warwick, pp 495-513
van Eys JE, Offner A, Bach A (2004) Chemical Analysis. In Manual of quality analyses for
soybean products in the feed industry http://www.asa-europe.org/Library/library_e.htm American Soybean Association Europe
Wang S, Sosulski K, Sosulski F, Ingledew M (1997) Effect of sequential abrasion on starch
composition of five cereals for ethanol fermentation. Food Research International 30: 603-609
Weightman R, Forge C, Quandalle C (2001) A rapid viscometric screening tool for measuring
feed wheat quality and the relationship between the quality of hybrid wheats and their parental lines. Aspects of Applied Biology 64: 79-84
influencing hardness and vitreosity in wheat grain. Final report on project AR0908 for the Department for Environment, Food and Rural Affairs
Wheals AE, Basso LC, Alves DMG, Amorim HV (1999) Fuel ethanol after 25 years. Trends in
Biotechnology 17: 482-487 Widyaratne GP, Zijlstra RT (2004) Nutritional value of corn and wheat distillers dried grain
and growth performance. Prairie Swine Centre, Annual Research Report Wilkin G (1989) Milling, cooking and mashing. In J Piggott, R Sharp, R Duncan, eds, The
Science and Technology of Whiskies. Longman Scientific and Technical, pp 64-88 Woods J, Brown G, Estrin A (2005) Bioethanol Greenhouse Gas calculator - User's Guide.
Home-Grown Cereals Authority, London World Resources Institute (2005) Energy 2005.