42
“Wheat Deregulation: Three Harvests On, What have We Learnt?” University of Western Australia 2011 Industry Forum Perth 22 July 2011 Ron Storey Storey Marketing Services
“Wheat Deregulation: Three Harvests On, What have We
Learnt?”
University of Western Australia2011 Industry Forum
Perth22 July 2011Ron Storey
Storey Marketing Services

To start with.....
When you change something which has been regulated for 60+ years...
And when the change occurs with some fighting to the bitter end...
And when the change is precipitated by a highly emotive event (Cole Inquiry)
-- you are not going to please everyone!
BUT...............
Overall theme ....
� Deregulation is working� I’d give it 7/10 – a fair pass mark� Can we improve? – Absolutely, and we
must
� Not here to argue the pro or anti case.... That debate is over, and there is no turning back
� It’s a health check on what we’ve got

Deregulation of the wheat industry is working
� Export program a record in 10/11 (without WA!!)� Container trade has flourished� More buyers of Australian wheat� More marketing choices for growers� Growers have been paid� Expansion in grower advisory services� Starting to see innovation and investment in the
supply chain� New entrants to the Australian industry
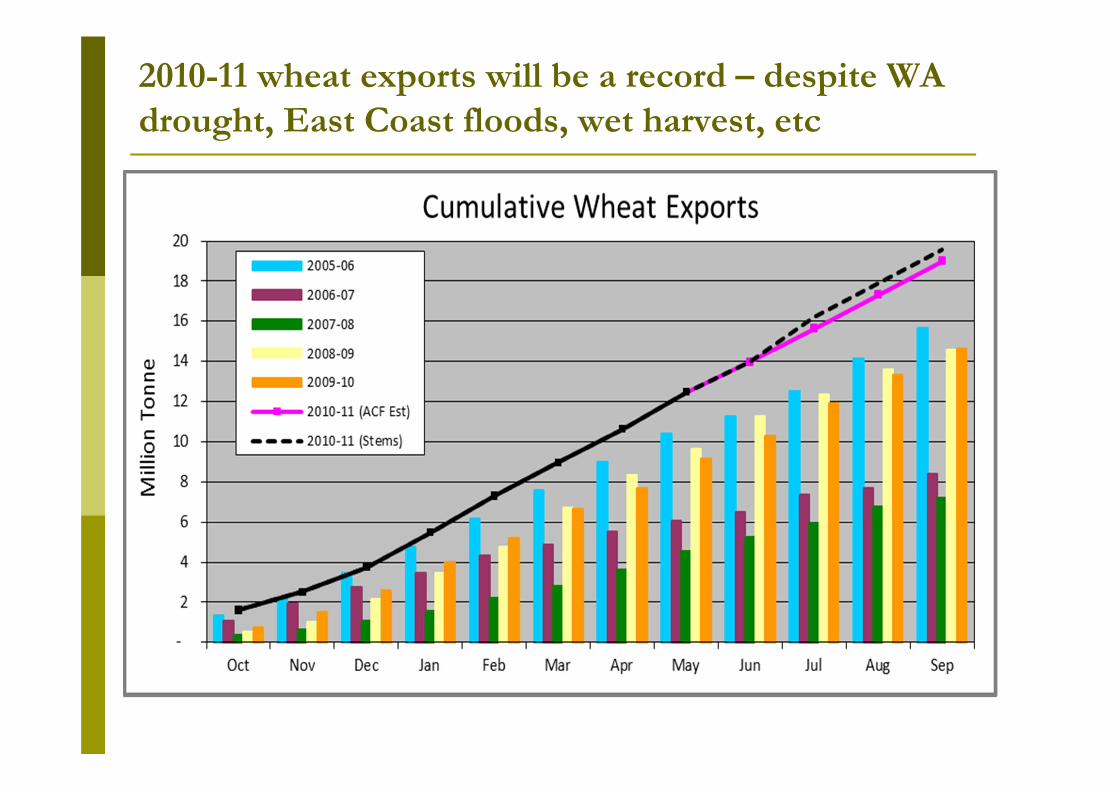
2010-11 wheat exports will be a record – despite WA drought, East Coast floods, wet harvest, etc

To paint today’s picture....
� The grain & food background we live in
WHEAT DEREGULATION --� Impact on growers?� Impact on customers?� Impact on supply chain?
� But first, a declaration of interests!!

NZX in Australia
� On-line Grain Exchange
� Direct, real time access
� Fast Secure Payment
� Immediate Control
� Integrated with Graincorp
• Grain market insight & strategy
• Price data• Pre-farm & Post Farm• Full S&D by zone• Independent, unbiased
GRAINS INFORMATION UNIT

NZX Grains Information Unit
PRE-FARM GATE� Targets Growers
� Unbiased� Weekly Newsletter� Daily SMS & Email� Strategy
POST- FARM GATE � Targets agribusiness
� Independence� Crop Forecast,
Weather� S&D Analysis� Port Zone Analysis

Grain Outlook for 2011-15
� Fundamentals of S&D are good! (in 2011 and longer term)
� Impact of MACROS – oil, energy, financials, hedge funds
� Globalisation on our doorstep; changing of the guard
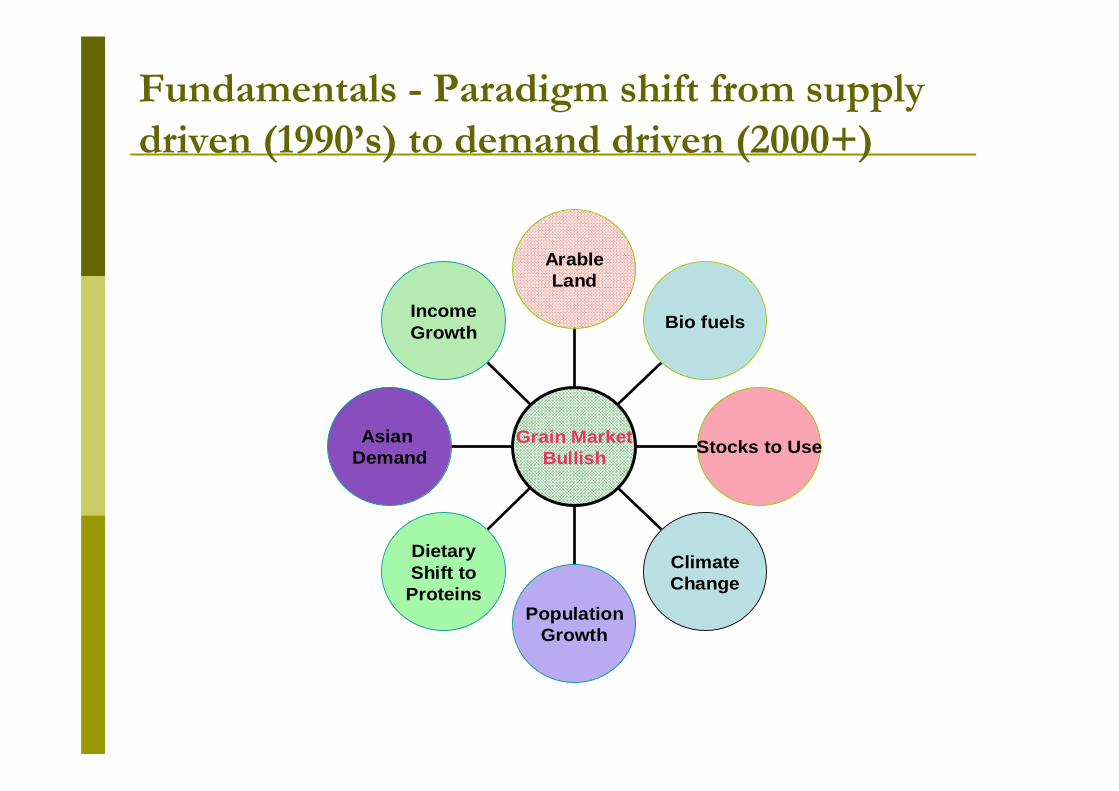
IncomeGrowth
Asian Demand
DietaryShift toProteins
PopulationGrowth
ClimateChange
Stocks to Use
Bio fuels
ArableLand
Grain MarketBullish
Fundamentals - Paradigm shift from supply driven (1990’s) to demand driven (2000+)

Eating > Growing –– 5 of last 8 yrs
540
560
580
600
620
640
660
680
700
2003/04 2004/05 2005/06 2006/07 2007/08 2008/09 2009/10 2010/11*
IGC World Wheat Production V Consumption
Production
Consumption

US Stocks to Use Ratio
06/07 07/08 08/09 09/10 10/11 11/12
Wheat 20% 11% 27% 48% 31% 27%
Corn 12% 13% 14% 13% 5% 5%
Soybean 19% 7% 5% 5% 4% 5%
10% = 36 days supply

Crude oil – grains and oilseeds – 2007-2011
Black line = crude oil

Price Volatility – on the move...1996 - 2011
‐$40.00
‐$20.00
$0.00
$20.00
$40.00
$60.00
$80.00
$100.0002
/01/96
02/08/96
02/03/97
02/10/97
02/05/98
02/12/98
02/07/99
02/02/00
02/09/00
02/04/01
02/11/01
02/06/02
02/01/03
02/08/03
02/03/04
02/10/04
02/05/05
02/12/05
02/07/06
02/02/07
02/09/07
02/04/08
02/11/08
02/06/09
02/01/10
02/08/10
Move in Weekly APW Cash Prices
1996-2007$0-10 range
02-03 06-07
2008-2011$10-20 range

Q:What happened from Oct 08 to Jun 11?A: We followed Chicago futures just like we always did!
$150.00
$170.00
$190.00
$210.00
$230.00
$250.00
$270.00
$290.00
$310.00
$330.00
$350.0027
/10/08
01/12/08
05/01/09
09/02/09
16/03/09
21/04/09
26/05/09
30/06/09
04/08/09
08/09/09
13/10/09
17/11/09
22/12/09
28/01/10
04/03/10
09/04/10
14/05/10
18/06/10
23/07/10
27/08/10
01/10/10
05/11/10
10/12/10
17/01/11
21/02/11
28/03/11
03/05/11
A$ Spot Futures and APW Cash Prices Pt Adelaide – Oct 08‐May 11
A$ Futures
APW
Correlation 89.5%
‐$100
+$100
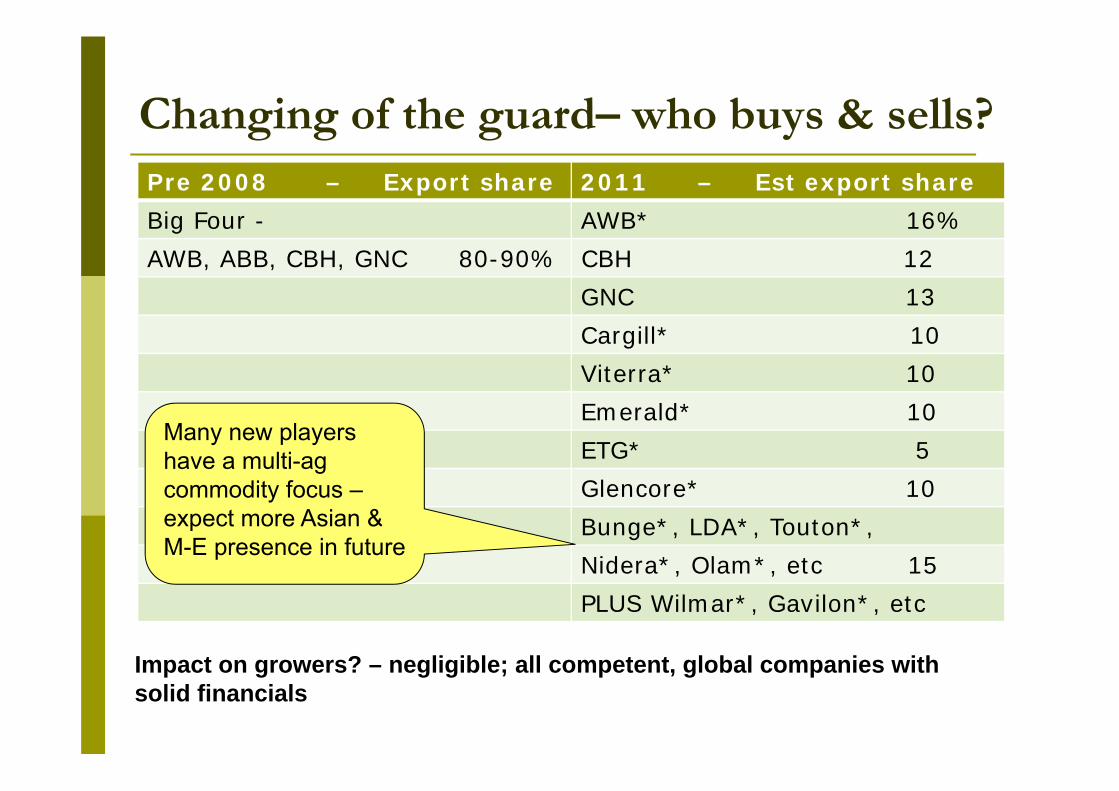
Changing of the guard– who buys & sells?Pre 2008 – Export share 2011 – Est export shareBig Four - AWB* 16%AWB, ABB, CBH, GNC 80-90% CBH 12
GNC 13Cargill* 10Viterra* 10Emerald* 10ETG* 5Glencore* 10Bunge*, LDA*, Touton*,Nidera*, Olam*, etc 15PLUS Wilmar*, Gavilon*, etc
Many new players have a multi-agcommodity focus –expect more Asian & M-E presence in future
Impact on growers? – negligible; all competent, global companies with solid financials

The point of this is...
� The wheat industry’s health is MUCH more determined by these (very positive) global factors, outside our control, than whether Australia has a single desk or not
� The signs look good� The question? – How to maximise our
opportunity in these times?

Impact on growers?
� Score – 7-8/10 : have performed well
� Proven to be savvy sellers (08/9, 09/10, 10/11)
� Can compare, have choices� 20-30 exporters, 50+ packers, 5+ pool
operators� Expanded broker, advisory services� Warehousing first choice – 80-90% of
deliveries – a good thing
Grower Marketing Behaviour?
� Sentiment - “Marketing is time consuming, confusing and difficult”
� In practice, growers are generally doing a good job – they probably underestimate their capability

Selling Patterns – indicative 08/09/10 harvests
� Shift to warehousing on the weighbridge; perhaps 80-90%
� Around 50% sold/transferred w/i 30 days� Pools approx 10% at delivery, higher in lower
price years� Maybe 10% cash-at-silo (evidence that C-A-S
prices < direct negotiation price)

Price Volatility
� Direct grower exposure to daily global moves –commodity and currency
� Increase in use of advisors/brokers� Increase in on-line volumes for cash flow and
quick access to price spikes� Use of daily SMS, email services

546k mt traded online (Clear)and settled in 5 business days
2008-09
2009-10
2010-11
120m AU$ traded onlinesince deregulation
2008-09
2009-10
2010-11

On-Farm Storage
� Are we reaching a limit?� Issue of quality risk becoming better understood
(beware 2011 harvest!!)� Market access – physical access, pricing spikes,
quality certification� Challenging the popular mythology
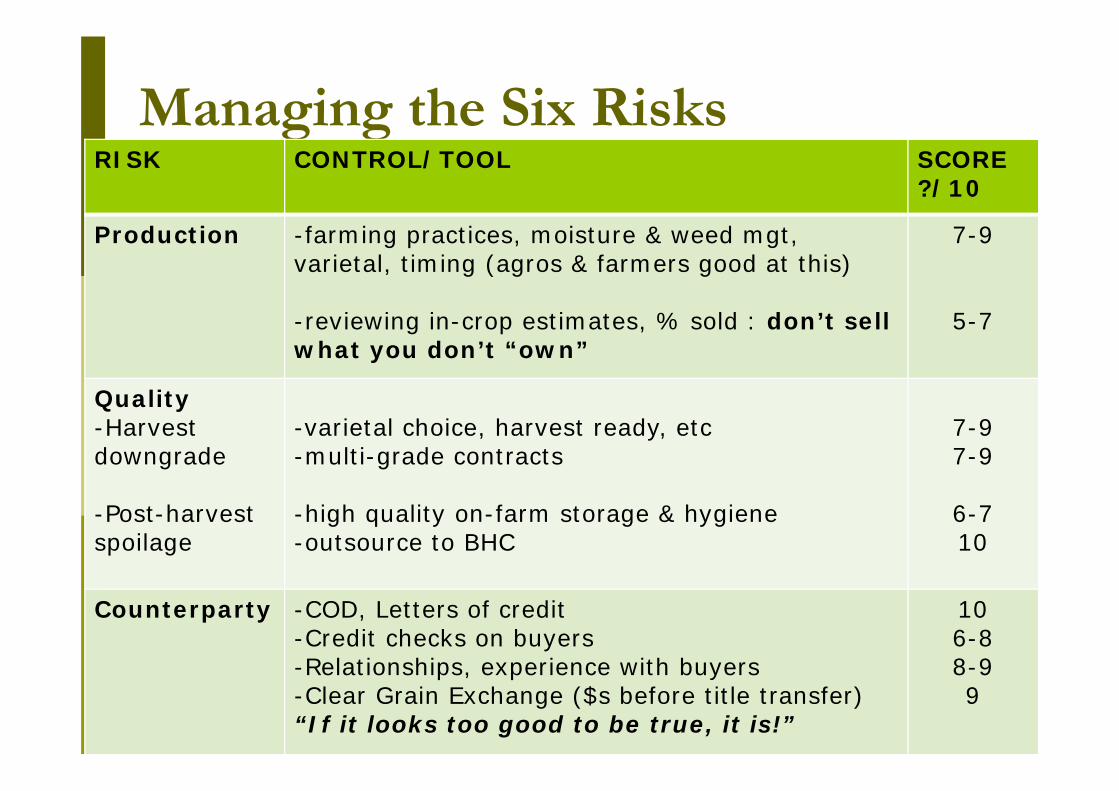
Managing the Six RisksRISK CONTROL/TOOL SCORE
?/10
Production -farming practices, moisture & weed mgt, varietal, timing (agros & farmers good at this)
-reviewing in-crop estimates, % sold : don’t sell what you don’t “own”
7-9
5-7
Quality-Harvest downgrade
-Post-harvest spoilage
-varietal choice, harvest ready, etc-multi-grade contracts
-high quality on-farm storage & hygiene-outsource to BHC
7-97-9
6-710
Counterparty -COD, Letters of credit-Credit checks on buyers-Relationships, experience with buyers-Clear Grain Exchange ($s before title transfer)“If it looks too good to be true, it is!”
106-88-99

Managing the Six RisksRISK CONTROL/TOOL SCORE
Execution(disputes)
-write it down, day book-GTA Terms and Conditions-maintain contact with buyer-sense of urgency: time is of the essence-do a GTA course; use a broker
5555
8-9
Price -cash (spot and forward)-pools-derivatives (esp swaps)-keep “mark to market” report
7-95-75-95-6
Stress -don’t understand : don’t touch!-use an advisor (but not to pick the top!)-price target = success : not picking the top-HOW DO YOU PRICE SLEEP AT NIGHT FACTOR?-SOLVENCY = SUCCESS
??
???

Growers cont ... BUT..
� National grain grower representation is a shambles: it is a needed voice
� Individuals and state bodies are trying their best, but the reality is that several parties are vying for the right to say they are the “national grower representative group”. To outsiders and government, the industry looks divided and fragmented.

Growers - Summary
� Doing a good job: better than they give themselves credit
� Marketing does take time & effort� Some will outsource, some DIY� Greater self-confidence will evolve
� National grower representation needs an overhaul; it has gone missing since deregulation

Impact on Customers?
� Score 7/10 (but lack good data, anecdotal)� Reality is we have taken away some SD services
PLUS MINUS
More choice, range of suppliers Variability in cargoes
Lower premium, competition Specs at minimum levels, impact of blending
More customers, diversity Lack of crop info, tech support
Expansion in containers No independent quality info

Supply Chain
� Hard assets: trains, trucks, ports, ships –for physical movement through chain
� Soft assets: access to and sharing of info to monitor what is happening in the chain, improve its performance

Impact on Supply Chain?
� Overall – 6/10� Physical performance – 7/10� Information & Industry Services – 5-6/10
� This is where we need the most work ... and there are some serious commercial issues to resolve at BHC-exporter level

First: Credit where credit is due --2010-11 wheat exports will be a record

Buyers are liking the flexibilityand diversity of containers…

BUT, information capture of grain receival data is costing the industry dearly
� It is only visible to BHCs� The myths of keeping it a secret� Should not the grain owners have the
loudest say in how this data is managed and disclosed?

Who owns the data on the weighbridge ticket?
Grower NGR123456
Site –XYZ
Bin No.-abc
Tonnes-123456
Commodity-Wheat
Grade-AH1
Variety-Mace
Bin Grade-???
Test Weight-79
Protein-12.2%
Screenings-2.5%
Falling No.-320 secs

So, who owns the data on the weighbridge ticket?
� Being claimed by BHCs as “proprietary information”
� An uncontested claim� Where are the owners of the grain?� Has deep and insidious impacts on market� Three examples:-- Lower bidding power by independent
exporters- Dumbing down of quality specs- No consolidated view of Aust crop profile

Capture Cost No. 1 – Lower bids to farmers
� Bidding power quarantined to party who has visibility of quality profile, by site, by zone – both proprietary stocks and growers’ warehouse stocks.
� The power and incentive to buy and blend comes from visibility of stock quality data at a site level
Capture Cost No. 1 – Lower prices
� Lower prices to farmers because of stifled competition for grades most suitable, adaptable for blending
� The playing field is uneven
� When we look at supply chain information transparency, we run a real risk of repeating the AWB(I) – AWB (Ltd) “blind spot”

Capture Cost No. 2 – Dumbing downof quality specs
� Exporters don’t get back what they put in� BHC obligation is receival stds only� Result?- Customers get min specs- Increased risk/cost to exporters- Receival std “fix” is wrong medicine- Low incentive to pay farmer for quality
(will be good to see how re-intro of Golden Rewards goes!)
Capture Cost No. 3 – No consolidated view of Aust crop quality profile
� Data showing consist of crop by variety, specs, and importantly, its trend?
� How to make varietal classification decisions and crop shaping decisions in absence of data on what the current crop is?
� Reportedly, WQA does not have access to the “proprietary information”???
� Breeding direction is at risk
Supply Chain Summary
� Hard assets – ports, trains, etc – need investment
� BHC-Exporter commercial arrangements do not maximise grower or customer value
� Soft Asset of information access – capture costing money and long term direction
� Despite this – the grain has gone out at record levels!
Summary
� Working pretty well, room for improvement
� Industry is and will be stronger for it� The outlook is bright for grains� Supply chain is biggest challenge (hard &
soft assets)� If I could change ONE THING?.....� In the end, the customer is always right!!


