Wheat grain quality under increasing atmospheric CO 2 concentrations in a semi-arid cropping system Nimesha Fernando a , Joe Panozzo b , Michael Tausz c , Robert M. Norton a, d , Glenn J. Fitzgerald b , Samuel Myers e , Cassandra Walker b , James Stangoulis f , Saman Seneweera a, * a Department of Agriculture and Food Systems, Melbourne School of Land and Environment, The University of Melbourne, Natimuk Road, Private Box 260, Horsham, Victoria 3401, Australia b Department of Primary Industries, Natimuk Road, Private Box 260, Horsham, Victoria 3401, Australia c Department of Forest and Ecosystem Science, Melbourne School of Land and Environment, The University of Melbourne, Water Street, Creswick, Victoria 3363, Australia d International Plant Nutrition Institute, 54 Florence Street, Horsham, Victoria 3400, Australia e Harvard Medical School, Harvard School of Public Health, Department of Environmental Health, Landmark Center, 401 Park Drive, Boston, MA 02215, USA f School of Biological Sciences, Flinders University, GPO Box 2100, Adelaide 5001, Australia article info Article history: Received 15 April 2012 Received in revised form 19 July 2012 Accepted 20 July 2012 Keywords: Free-Air Carbon dioxide Enrichment (FACE) Grain quality Nutrient and anti-nutrient factors Bread quality abstract We investigated wheat (Triticum aestivum) grain quality under Free Air CO 2 Enrichment (FACE) of 550 10% CO 2 mmol mol 1 . In each of two full growing seasons (2008 and 2009), two times of sowing were compared, with late sowing designed to mimic high temperature during grain filling. Grain samples were subjected to a range of physical, nutritional and rheological quality assessments. Elevated CO 2 increased thousand grain weight (8%) and grain diameter (5%). Flour protein concentration was reduced by 11% at e[CO 2 ], with the highest reduction being observed at the late time of sowing in 2009, (15%). Most of the grain mineral concentrations decreased under e[CO 2 ] - Ca (11%), Mg (7%), P (11%) and S (7%), Fe (10%), Zn (17%), Na (19%), while total uptake of these nutrients per unit ground area increased. Rheological properties of the flour were altered by e[CO 2 ] and bread volume reduced by 7%. Phytate concentration in grains tended to decrease (17%) at e[CO 2 ] while grain fructan concentration remained unchanged. The data suggest that rising atmospheric [CO 2 ] will reduce the nutritional and rheological quality of wheat grain, but at high temperature, e[CO 2 ] effects may be moderated. Reduced phytate concentrations at e[CO 2 ] may improve bioavailability of Fe and Zn in wheat grain. Ó 2012 Elsevier Ltd. All rights reserved. 1. Introduction Atmospheric carbon dioxide concentration ([CO 2 ]) is steadily increasing and is expected to rise from the current w384 mmol mol 1 to w550 mmol mol 1 by 2050 (Carter et al., 2007). It is predicted that global temperature will also increase by an average of 1.5e4.5 C with more frequent occurrences of extreme climatic events such as heat waves and/or drought (Carter et al., 2007). Increasing [CO 2 ] directly influences the growth and development of all C 3 plants by increasing substrate availability for photosynthesis. For cereals, elevated carbon dioxide concentration (e[CO 2 ]) promotes grain yield (Ainsworth et al., 2008) but is likely to reduce grain quality (Högy et al., 2009; Kimball et al., 2001; Seneweera et al., 1996; Taub et al., 2008). Despite the great emphasis placed on wheat grain quality for nutritional and industrial uses, there is limited understanding on the interaction of rising [CO 2 ] and higher temperatures on impor- tant grain quality parameters. For wheat, several aspects of grain quality have been found to change under e[CO 2 ] including grain physical, nutritional and baking quality traits. For thousand grain weight (TGW), some reports have shown increases (Högy and Fangmeier, 2008; Li et al., 2001), no change (Kimball et al., 2001) or a reduction (Högy et al., 2009) under e[CO 2 ]. More uniformly, grain protein concentration reportedly decreased under e[CO 2 ] (Fernando et al., 2012; Högy et al., 2009; Taub et al., 2008) and protein quality was shown to change (Högy et al., 2009). It has also been demonstrated that gluten protein concentration decreases when wheat is grown at e[CO 2 ](Högy et al., 2009; Kimball et al., 2001; Wieser et al., 2008), and these changes are likely to modify dough rheology and bread-making quality. In addition, negative impacts of high temperature on grain physical qualities have been documented (Balla et al., 2011). * Corresponding author. Tel.: þ61 3 5362 2164, þ61 40187 9853 (mobile); fax: þ61 3 5362 0782. E-mail address: [email protected](S. Seneweera). Contents lists available at SciVerse ScienceDirect Journal of Cereal Science journal homepage: www.elsevier.com/locate/jcs 0733-5210/$ e see front matter Ó 2012 Elsevier Ltd. All rights reserved. http://dx.doi.org/10.1016/j.jcs.2012.07.010 Journal of Cereal Science 56 (2012) 684e690
Transcript
at SciVerse ScienceDirect
Journal of Cereal Science 56 (2012) 684e690
Contents lists available
Journal of Cereal Science
journal homepage: www.elsevier .com/locate/ jcs
Wheat grain quality under increasing atmospheric CO2 concentrationsin a semi-arid cropping system
Nimesha Fernando a, Joe Panozzo b, Michael Tausz c, Robert M. Norton a,d, Glenn J. Fitzgerald b,Samuel Myers e, Cassandra Walker b, James Stangoulis f, Saman Seneweera a,*
aDepartment of Agriculture and Food Systems, Melbourne School of Land and Environment, The University of Melbourne, Natimuk Road, Private Box 260, Horsham,Victoria 3401, AustraliabDepartment of Primary Industries, Natimuk Road, Private Box 260, Horsham, Victoria 3401, AustraliacDepartment of Forest and Ecosystem Science, Melbourne School of Land and Environment, The University of Melbourne, Water Street, Creswick, Victoria 3363, Australiad International Plant Nutrition Institute, 54 Florence Street, Horsham, Victoria 3400, AustraliaeHarvard Medical School, Harvard School of Public Health, Department of Environmental Health, Landmark Center, 401 Park Drive, Boston, MA 02215, USAf School of Biological Sciences, Flinders University, GPO Box 2100, Adelaide 5001, Australia
a r t i c l e i n f o
Article history:Received 15 April 2012Received in revised form19 July 2012Accepted 20 July 2012
Keywords:Free-Air Carbon dioxide Enrichment (FACE)Grain qualityNutrient and anti-nutrient factorsBread quality
0733-5210/$ e see front matter � 2012 Elsevier Ltd.http://dx.doi.org/10.1016/j.jcs.2012.07.010
a b s t r a c t
We investigated wheat (Triticum aestivum) grain quality under Free Air CO2 Enrichment (FACE) of550 � 10% CO2 mmol mol�1. In each of two full growing seasons (2008 and 2009), two times of sowingwere compared, with late sowing designed to mimic high temperature during grain filling. Grain sampleswere subjected to a range of physical, nutritional and rheological quality assessments. Elevated CO2
increased thousand grain weight (8%) and grain diameter (5%). Flour protein concentration was reducedby 11% at e[CO2], with the highest reduction being observed at the late time of sowing in 2009, (15%).Most of the grain mineral concentrations decreased under e[CO2] - Ca (11%), Mg (7%), P (11%) and S (7%),Fe (10%), Zn (17%), Na (19%), while total uptake of these nutrients per unit ground area increased.Rheological properties of the flour were altered by e[CO2] and bread volume reduced by 7%. Phytateconcentration in grains tended to decrease (17%) at e[CO2] while grain fructan concentration remainedunchanged. The data suggest that rising atmospheric [CO2] will reduce the nutritional and rheologicalquality of wheat grain, but at high temperature, e[CO2] effects may be moderated. Reduced phytateconcentrations at e[CO2] may improve bioavailability of Fe and Zn in wheat grain.
� 2012 Elsevier Ltd. All rights reserved.
1. Introduction
Atmospheric carbon dioxide concentration ([CO2]) is steadilyincreasing and is expected to rise from the currentw384 mmol mol�1 to w550 mmol mol�1 by 2050 (Carter et al.,2007). It is predicted that global temperature will also increase byan average of 1.5e4.5 �C with more frequent occurrences ofextreme climatic events such as heat waves and/or drought (Carteret al., 2007). Increasing [CO2] directly influences the growth anddevelopment of all C3 plants by increasing substrate availability forphotosynthesis. For cereals, elevated carbon dioxide concentration(e[CO2]) promotes grain yield (Ainsworth et al., 2008) but is likelyto reduce grain quality (Högy et al., 2009; Kimball et al., 2001;Seneweera et al., 1996; Taub et al., 2008).
þ61 40187 9853 (mobile);
eera).
All rights reserved.
Despite the great emphasis placed on wheat grain quality fornutritional and industrial uses, there is limited understanding onthe interaction of rising [CO2] and higher temperatures on impor-tant grain quality parameters. For wheat, several aspects of grainquality have been found to change under e[CO2] including grainphysical, nutritional and baking quality traits. For thousand grainweight (TGW), some reports have shown increases (Högy andFangmeier, 2008; Li et al., 2001), no change (Kimball et al., 2001)or a reduction (Högy et al., 2009) under e[CO2]. More uniformly,grain protein concentration reportedly decreased under e[CO2](Fernando et al., 2012; Högy et al., 2009; Taub et al., 2008) andprotein quality was shown to change (Högy et al., 2009). It has alsobeen demonstrated that gluten protein concentration decreaseswhen wheat is grown at e[CO2] (Högy et al., 2009; Kimball et al.,2001; Wieser et al., 2008), and these changes are likely to modifydough rheology and bread-making quality. In addition, negativeimpacts of high temperature on grain physical qualities have beendocumented (Balla et al., 2011).
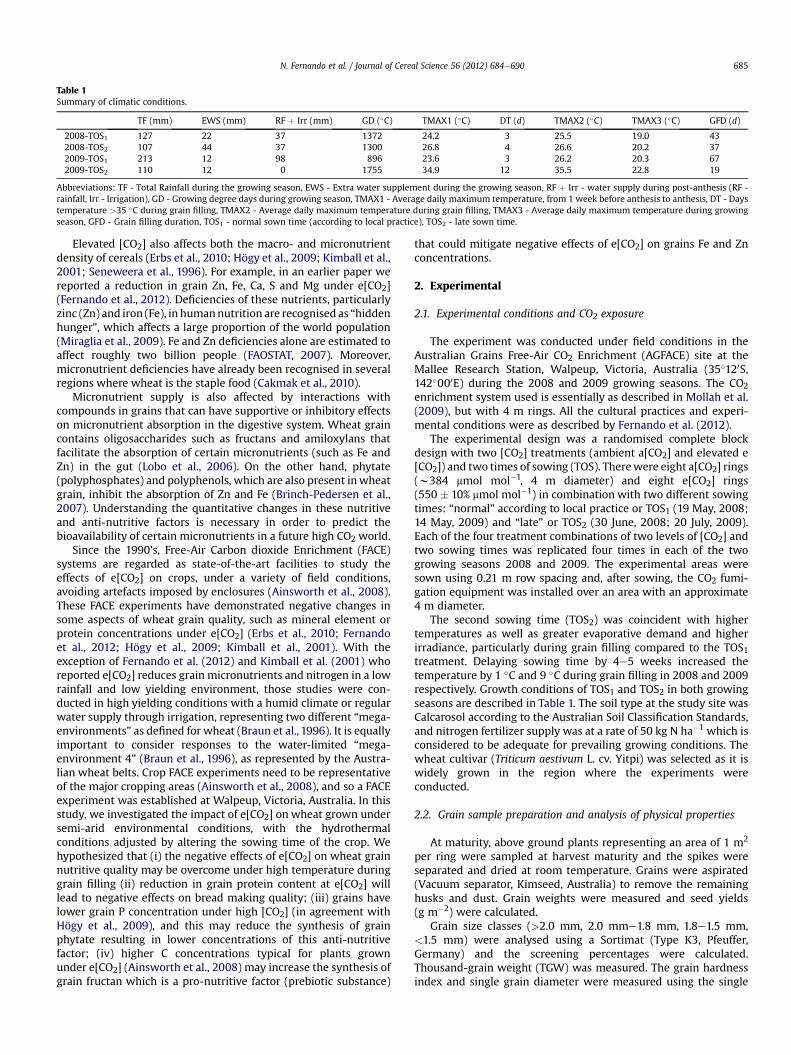
Abbreviations: TF - Total Rainfall during the growing season, EWS - Extra water supplement during the growing season, RF þ Irr - water supply during post-anthesis (RF -rainfall, Irr - Irrigation), GD - Growing degree days during growing season, TMAX1 - Average daily maximum temperature, from 1 week before anthesis to anthesis, DT - Daystemperature >35 �C during grain filling, TMAX2 - Average daily maximum temperature during grain filling, TMAX3 - Average daily maximum temperature during growingseason, GFD - Grain filling duration, TOS1 - normal sown time (according to local practice), TOS2 - late sown time.
N. Fernando et al. / Journal of Cereal Science 56 (2012) 684e690 685
Elevated [CO2] also affects both the macro- and micronutrientdensity of cereals (Erbs et al., 2010; Högy et al., 2009; Kimball et al.,2001; Seneweera et al., 1996). For example, in an earlier paper wereported a reduction in grain Zn, Fe, Ca, S and Mg under e[CO2](Fernando et al., 2012). Deficiencies of these nutrients, particularlyzinc (Zn) and iron (Fe), in humannutrition are recognised as “hiddenhunger”, which affects a large proportion of the world population(Miraglia et al., 2009). Fe and Zn deficiencies alone are estimated toaffect roughly two billion people (FAOSTAT, 2007). Moreover,micronutrient deficiencies have already been recognised in severalregions where wheat is the staple food (Cakmak et al., 2010).
Micronutrient supply is also affected by interactions withcompounds in grains that can have supportive or inhibitory effectson micronutrient absorption in the digestive system. Wheat graincontains oligosaccharides such as fructans and amiloxylans thatfacilitate the absorption of certain micronutrients (such as Fe andZn) in the gut (Lobo et al., 2006). On the other hand, phytate(polyphosphates) and polyphenols, which are also present inwheatgrain, inhibit the absorption of Zn and Fe (Brinch-Pedersen et al.,2007). Understanding the quantitative changes in these nutritiveand anti-nutritive factors is necessary in order to predict thebioavailability of certain micronutrients in a future high CO2 world.
Since the 1990’s, Free-Air Carbon dioxide Enrichment (FACE)systems are regarded as state-of-the-art facilities to study theeffects of e[CO2] on crops, under a variety of field conditions,avoiding artefacts imposed by enclosures (Ainsworth et al., 2008).These FACE experiments have demonstrated negative changes insome aspects of wheat grain quality, such as mineral element orprotein concentrations under e[CO2] (Erbs et al., 2010; Fernandoet al., 2012; Högy et al., 2009; Kimball et al., 2001). With theexception of Fernando et al. (2012) and Kimball et al. (2001) whoreported e[CO2] reduces grain micronutrients and nitrogen in a lowrainfall and low yielding environment, those studies were con-ducted in high yielding conditions with a humid climate or regularwater supply through irrigation, representing two different “mega-environments” as defined for wheat (Braun et al., 1996). It is equallyimportant to consider responses to the water-limited “mega-environment 4” (Braun et al., 1996), as represented by the Austra-lian wheat belts. Crop FACE experiments need to be representativeof the major cropping areas (Ainsworth et al., 2008), and so a FACEexperiment was established at Walpeup, Victoria, Australia. In thisstudy, we investigated the impact of e[CO2] on wheat grown undersemi-arid environmental conditions, with the hydrothermalconditions adjusted by altering the sowing time of the crop. Wehypothesized that (i) the negative effects of e[CO2] on wheat grainnutritive quality may be overcome under high temperature duringgrain filling (ii) reduction in grain protein content at e[CO2] willlead to negative effects on bread making quality; (iii) grains havelower grain P concentration under high [CO2] (in agreement withHögy et al., 2009), and this may reduce the synthesis of grainphytate resulting in lower concentrations of this anti-nutritivefactor; (iv) higher C concentrations typical for plants grownunder e[CO2] (Ainsworth et al., 2008) may increase the synthesis ofgrain fructan which is a pro-nutritive factor (prebiotic substance)
that could mitigate negative effects of e[CO2] on grains Fe and Znconcentrations.
2. Experimental
2.1. Experimental conditions and CO2 exposure
The experiment was conducted under field conditions in theAustralian Grains Free-Air CO2 Enrichment (AGFACE) site at theMallee Research Station, Walpeup, Victoria, Australia (35�120S,142�000E) during the 2008 and 2009 growing seasons. The CO2enrichment system used is essentially as described in Mollah et al.(2009), but with 4 m rings. All the cultural practices and experi-mental conditions were as described by Fernando et al. (2012).
The experimental design was a randomised complete blockdesign with two [CO2] treatments (ambient a[CO2] and elevated e[CO2]) and two times of sowing (TOS). Therewere eight a[CO2] rings(w384 mmol mol�1, 4 m diameter) and eight e[CO2] rings(550 � 10% mmol mol�1) in combination with two different sowingtimes: “normal” according to local practice or TOS1 (19 May, 2008;14 May, 2009) and “late” or TOS2 (30 June, 2008; 20 July, 2009).Each of the four treatment combinations of two levels of [CO2] andtwo sowing times was replicated four times in each of the twogrowing seasons 2008 and 2009. The experimental areas weresown using 0.21 m row spacing and, after sowing, the CO2 fumi-gation equipment was installed over an area with an approximate4 m diameter.
The second sowing time (TOS2) was coincident with highertemperatures as well as greater evaporative demand and higherirradiance, particularly during grain filling compared to the TOS1treatment. Delaying sowing time by 4e5 weeks increased thetemperature by 1 �C and 9 �C during grain filling in 2008 and 2009respectively. Growth conditions of TOS1 and TOS2 in both growingseasons are described in Table 1. The soil type at the study site wasCalcarosol according to the Australian Soil Classification Standards,and nitrogen fertilizer supply was at a rate of 50 kg N ha�1 which isconsidered to be adequate for prevailing growing conditions. Thewheat cultivar (Triticum aestivum L. cv. Yitpi) was selected as it iswidely grown in the region where the experiments wereconducted.
2.2. Grain sample preparation and analysis of physical properties
At maturity, above ground plants representing an area of 1 m2
per ring were sampled at harvest maturity and the spikes wereseparated and dried at room temperature. Grains were aspirated(Vacuum separator, Kimseed, Australia) to remove the remaininghusks and dust. Grain weights were measured and seed yields(g m�2) were calculated.
Grain size classes (>2.0 mm, 2.0 mme1.8 mm, 1.8e1.5 mm,<1.5 mm) were analysed using a Sortimat (Type K3, Pfeuffer,Germany) and the screening percentages were calculated.Thousand-grain weight (TGW) was measured. The grain hardnessindex and single grain diameter were measured using the single
N. Fernando et al. / Journal of Cereal Science 56 (2012) 684e690686
kernel characterization system (Perten Instruments North America,Springfield, IL, USA).
2.3. Measurement of grain and flour protein content
Total protein content in whole-grain was determined asdescribed in Fernando et al. (2012) and grain protein concentrationwas converted into grain N concentration by dividing grain proteinby a conversion factor of 5.7. Flour protein content was determinedby Near Infrared Reflectance Spectroscopy (NIR, Foss, Sweden) andexpressed on a dry weight basis according to approved method39e110 (AACC International, 2000).
2.4. Sample preparation and grain macro and micronutrientanalysis
Grain samples were analysed for macro and micronutrientconcentration by inductively-coupled plasma atomic emissionspectrometry (ICP-AES) (Applied Research Laboratories, 3580B,Switzerland) after digestion in concentrated nitric acid (HNO3)following the procedure of Zarcinas et al. (1987). Mineral concen-tration (g kg�1 or mg kg�1) was expressed on a grain dry weightbasis. Grain N/S ratio was calculated on a mass basis. Grain mineraluptake was calculated from the yield per m2 plot surface area(g m�2) and grain mineral concentration.
2.5. Grain milling and flour mixing properties
Grain samples (30 g) were tempered for 24 h at 13.5% moistureand milled on a Quadrumat Junior Mill (Brabender, OHG Duisburg,Germany). Flour was separated from the bran through a 0.2 mmsize sieve and flour yield was calculated [flour (g)/total grain (g)*100]. Mixograph analysis was conducted on a 10 g reomixer(Reologica Instruments, Sweden) and mixing properties were ob-tained. Some of these reomixer parameters are directly related tothe basic rheological aspects of the mixing properties. For example,“peak time” describes the mixing requirements, “peak height” isa measure of dough strength, “breakdown” reflects dough stability,and “peak width” measures extensibility (Bohlin, 2007). Reomixermixing parameters were shown to be useful for estimating breadvolume; using multivariate analysis they can be used to predictbread volume to 91% explained variance (Bohlin, 2007). Therefore,calculated bread volume from mixographs was used in the inter-pretation of the results. Mixograph absorption was expressed ona 12.5% moisture basis.
2.6. Grain phytate content
Phytic acid phosphorus was determined using a modification ofthe method of Haug and Lantzsch (1983) on samples milled to passthrough a 0.4 mm mesh. In this method, extracts containing phyticacid were incubated in solutions with a known iron concentration.Following precipitation of iron phytate, the iron remaining insolution was quantified. To determine phytic acid in tissue, phyticacid standards were used. Phytic acid is expressed as its phos-phorus content (phytic acid phosphorus). Eight tissue standardswith greatly varying levels of endogenous phytic acid were used ascontrols to indicate accuracy and reliability of the methods used(Raboy et al., 2000).
2.7. Grain fructan
Grain fructan concentration was measured by enzymatichydrolysis followed by high-performance liquid chromatography(HPLC) using procedures described by Huynh et al. (2008). After
extraction of wheat flour, the hydrolysates (glucose, fructose andsucrose) were separated as anions with KOH eluent through a Car-boPac PA20 guard column (3� 30 mm) coupled to a CarboPac PA20analytical column (3 � 150 mm) and detected by pulsed amper-ometry on a disposable gold working electrode. The eluent flowrate was 0.42 mL min�1, and the column temperature was 30 �C.Chromatographic signals were analysed by the computer softwareChromeleon (version 6.70) with glucose, fructose and sucrosedetermined, based on their standards with reference to the internalstandard and the blank samples.
2.8. Statistical analysis
Data were analysed with MINITAB 16 statistical package usinga General Linear Model analysis of variance with fixed factors [CO2](2 levels) and combined TOS and year as “environment” (4 levels).For each variable, an analysis of variance (ANOVA) was performedand significant differences in the grain quality parameters between[CO2] for each “environment” were determined using the leastsignificant difference (LSD) at p � 0.05. The expression “trend”denotes differences between p > 0.05 and p � 0.10.
3. Results
3.1. Grain physical properties
TGW and grain diameter were significantly increased by 8% and5%, respectively, at e[CO2] compared to a[CO2] grown plants whilegrain size distribution shifted towards larger grains (Table 2, Fig. 2).Both TGW and grain diameter were significantly affected by“environment” (Table 2, Fig. 2). At TOS2 of the 2009 season, TGWand grain diameter were smaller than in all other environments(Fig. 2). In 2009, TGW (57%), grain diameter (39%) and the weight of>2 mm size grain class (17%) were reduced under TOS2 treatmentcompared to TOS1. However, relative effects of CO2 were similaracross environments (no interaction, Table 2, Fig. 2).
3.2. Flour protein concentration
Flour protein concentration was (on dry weight basis)144 g kg�1 at [aCO2] and 128 g kg�1 at e[CO2] showing a 11%reduction at e[CO2] (Fig. 2) across all environments. Flour proteinconcentration varied significantly among growing environmentsbut was always higher for the late sowing (Fig. 2). The highest flourprotein concentrationwas observed at 2009-TOS2 and the lowest at2008-TOS1 (Fig. 2).
3.3. Grain mineral concentration
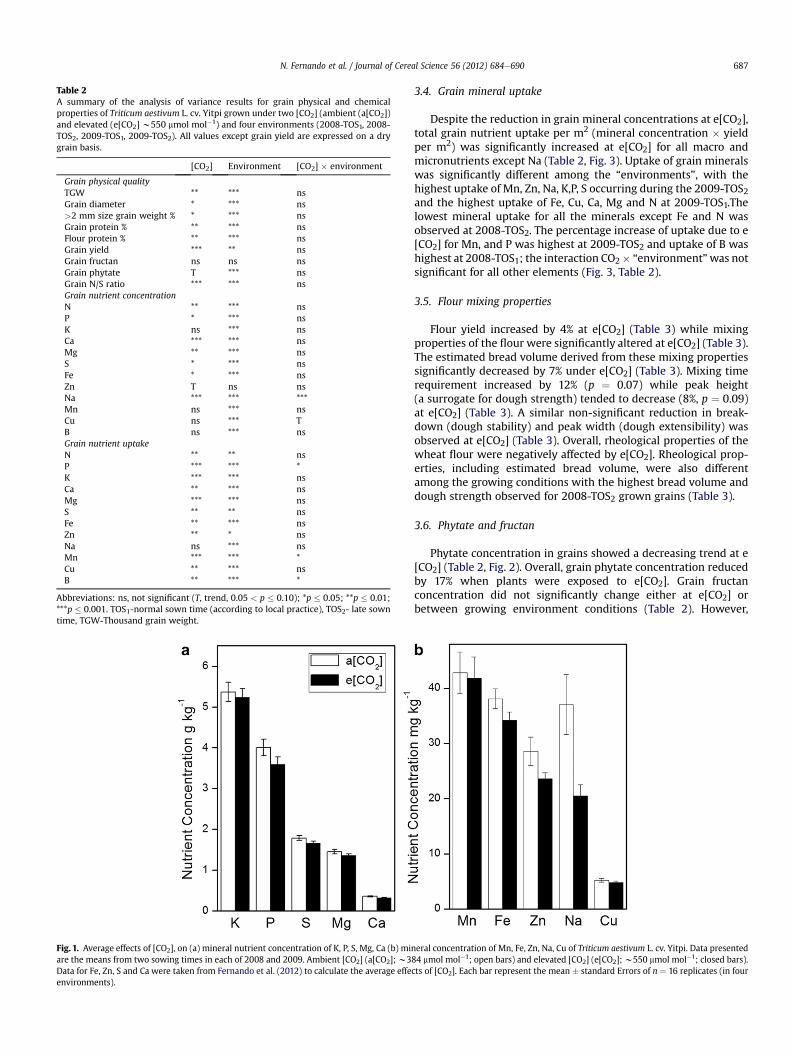
Selective changes in grain mineral nutrient concentration inresponse to e[CO2] were observed: K, Cu andMn concentrations didnot differ between the CO2 treatments (Table 2, Fig. 1), but othernutrients were significantly decreased at e[CO2] (Mg by 7%, Na by19%, Fe by 10%, Ca by 11%, S by 7%, and P by 11%). The concentrationof Zn was reduced by (17%) at e[CO2] and was significant only atp ¼ 0.07.
Growing “environment” had a significant effect on the grainminerals except for Zn (Table 2). The highest concentrations of Fe,Mn, Cu, Mg, Na, K, P were observed at 2009-TOS2 and highestconcentration of S observed at 2008-TOS2. For all the analysed grainminerals, except Ca (and Zn where the “environment” effect wasnot significant), the lowest concentrations were observed at 2008-TOS1 “environment” conditions. Grain N/S ratio significantlydeclined by 6% at e[CO2] compared to a[CO2] (Table 2).
Fig. 1. Average effects of [CO2], on (a) mineral nutrient concentration of K, P, S, Mg, Ca (b) minare the means from two sowing times in each of 2008 and 2009. Ambient [CO2] (a[CO2]; w3Data for Fe, Zn, S and Ca were taken from Fernando et al. (2012) to calculate the average effeenvironments).
Table 2A summary of the analysis of variance results for grain physical and chemicalproperties of Triticum aestivum L. cv. Yitpi grown under two [CO2] (ambient (a[CO2])and elevated (e[CO2] w550 mmol mol�1) and four environments (2008-TOS1, 2008-TOS2, 2009-TOS1, 2009-TOS2). All values except grain yield are expressed on a drygrain basis.
Abbreviations: ns, not significant (T, trend, 0.05 < p � 0.10); *p � 0.05; **p � 0.01;***p � 0.001. TOS1-normal sown time (according to local practice), TOS2- late sowntime, TGW-Thousand grain weight.
N. Fernando et al. / Journal of Cereal Science 56 (2012) 684e690 687
3.4. Grain mineral uptake
Despite the reduction in grain mineral concentrations at e[CO2],total grain nutrient uptake per m2 (mineral concentration � yieldper m2) was significantly increased at e[CO2] for all macro andmicronutrients except Na (Table 2, Fig. 3). Uptake of grain mineralswas significantly different among the “environments”, with thehighest uptake of Mn, Zn, Na, K,P, S occurring during the 2009-TOS2and the highest uptake of Fe, Cu, Ca, Mg and N at 2009-TOS1.Thelowest mineral uptake for all the minerals except Fe and N wasobserved at 2008-TOS2. The percentage increase of uptake due to e[CO2] for Mn, and P was highest at 2009-TOS2 and uptake of B washighest at 2008-TOS1; the interaction CO2� “environment”was notsignificant for all other elements (Fig. 3, Table 2).
3.5. Flour mixing properties
Flour yield increased by 4% at e[CO2] (Table 3) while mixingproperties of the flour were significantly altered at e[CO2] (Table 3).The estimated bread volume derived from these mixing propertiessignificantly decreased by 7% under e[CO2] (Table 3). Mixing timerequirement increased by 12% (p ¼ 0.07) while peak height(a surrogate for dough strength) tended to decrease (8%, p ¼ 0.09)at e[CO2] (Table 3). A similar non-significant reduction in break-down (dough stability) and peak width (dough extensibility) wasobserved at e[CO2] (Table 3). Overall, rheological properties of thewheat flour were negatively affected by e[CO2]. Rheological prop-erties, including estimated bread volume, were also differentamong the growing conditions with the highest bread volume anddough strength observed for 2008-TOS2 grown grains (Table 3).
3.6. Phytate and fructan
Phytate concentration in grains showed a decreasing trend at e[CO2] (Table 2, Fig. 2). Overall, grain phytate concentration reducedby 17% when plants were exposed to e[CO2]. Grain fructanconcentration did not significantly change either at e[CO2] orbetween growing environment conditions (Table 2). However,
eral concentration of Mn, Fe, Zn, Na, Cu of Triticum aestivum L. cv. Yitpi. Data presented84 mmol mol�1; open bars) and elevated [CO2] (e[CO2]; w550 mmol mol�1; closed bars).cts of [CO2]. Each bar represent the mean � standard Errors of n ¼ 16 replicates (in four
Fig. 2. Effects of [CO2] on (a) TGW (thousand grainweight) (b) grain diameter (c) grain yield (d) grain protein (e) flour protein (f) grain phytate of Triticum aestivum L. cv. Yitpi grownin four environments. Ambient [CO2] (a[CO2]; w384 mmol mol�1; open bars) and elevated [CO2] (e[CO2]; w550 mmol mol�1; closed bars). Each bar represent the mean � standardErrors of n ¼ 4 replicates. TOS1 - normal sown time (according to local practice), TOS2 - late sown time.
Fig. 3. Percentage change of grain mineral nutrient uptake of Triticum aestivum L. cv.Yitpi relative to current ambient [CO2] at elevated [CO2] (w550 mmol mol�1) in 2009-TOS2 (black bars), in 2008-TOS2 (dense square bars), in 2009-TOS1 (white bars), in2008-TOS1 (gray bars). Each bar represent the mean � standard Errors of n ¼ 4replicates. TOS1 - normal sown time (according to local practice), TOS2 - late sowntime.
N. Fernando et al. / Journal of Cereal Science 56 (2012) 684e690688
fructan concentration increased by 7.6% and 1.3% at e[CO2] for the2009 and 2008 seasons respectively.
4. Discussion
Results from this study show that increases in atmospheric[CO2] have significant impacts on wheat grain quality under water-limited, semi-arid environmental conditions. This experimental atWalpeup, Victoria, is in semi-arid cropping area, and the 50 yearannual average rainfall is 335 mm and with 245 mm receivedduring growing season (MayeNovember). This makes the sitea good case study for a low rainfall wheat cropping systems. Theenvironmental conditions used in the present study are consistentwith predicted future climates in themid-latitudewheat producingregions. Such water-limited wheat cropping systems are globallysignificant (Braun et al., 1996), and may potentially be stronglyimpacted by climate change. Other studies using FACE systems inhigher yielding conditions have also shown changes in wheat grainquality when plants were exposed to long term CO2 enrichment(Erbs et al., 2010; Högy et al., 2009; Kimball et al., 2001). Theseresults, investigate effects of rising [CO2] with warmer and drierconditions on the physical, chemical and rheological properties ofwheat grain in a low-yielding, dry land wheat cropping system.
4.1. Grain physical quality parameters
Thousand grain weight was significantly increased at e[CO2](Table 2, Fig. 2) which is in agreement with some previous studies(Högy and Fangmeier, 2008; Li et al., 2001). However, others re-ported no changes (Kimball et al., 2001) or even decrease (Högyet al., 2009). Such differences could be partly due to prevailingenvironment conditions that plants experience during develop-ment and also due to differences in genetic background (cultivarspecific). In this study, average grain size was larger at e[CO2] andgrain size distribution was shifted towards larger grains (Fig. 2).
Table 3A summary of results for flour yield and rheological properties of Triticum aestivum L. cv. Yitpi grown under ambient (a[CO2]) and elevated (e[CO2]w550 mmol mol�1) and fourenvironments (2008-TOS1, 2008-TOS2, 2009-TOS1, 2009-TOS2). Main ANOVA effect values are the mean of eight replicates and interactive effect values are the mean of fourreplicates.
Abbreviations: ns, not significant (T, trend, 0.05 < p � 0.10); *p � 0.05; **p � 0.01; ***p � 0.001. TOS1 - normal sown time (according to local practice), TOS2 - late sown time,au - arbitrary units.
N. Fernando et al. / Journal of Cereal Science 56 (2012) 684e690 689
Wheat grain weight and size are two of the most important phys-ical quality traits for evaluation of milling characteristics (Ohmet al., 1998). Our results confirmed that increased grain size at e[CO2] leads to increased milling yield (Table 3), which on its ownwould suggest potential economic benefits for the grain industry.
TGW and grain diameter decreased by almost half in the hottestand driest “environment” tested (2009-TOS2, Fig. 2) compared to‘normal’ growing conditions. Smaller changes in environmentalconditions (mainly temperature) had no such effects on TGW, graindiameter and grain size distribution. For example, TGW, graindiameter and grain sizewere similar betweenTOS1 andTOS2 in 2008(Fig. 2). Discrepancies in these results may relate to both watersupply and temperature variation during grain filling. Total watersupply during 2008-TOS1 and 2008-TOS2 wasmore or less similar to2009. However, 2009-TOS2 experienced temperatures above 35 �Cfor 12 days during grain filling compared to only 3 or 4 days for theother sowing time and year combinations (Table 1). It has beensuggested that high temperature stress reduces the storage capacityof the grain through a decrease in the endosperm cell number andstarch granule size in the endosperm (Stone andNicolas,1998), thus,the effects seen under these environmental conditions were notunexpected. These responses could be mitigated by e[CO2], whichhad a positive effect onTGWregardless of environmental conditions.
4.2. Grain chemical composition
Even though e[CO2] improved most of the physical quality char-acteristics of the grains, nutritive value of the grain including proteinconcentration, flour protein concentration and most of the macroand micronutrients were substantially decreased (Figs. 1 and 2). Asreported earlier (Fernando et al., 2012), the average grain proteinconcentrationwas reduced by 12.5% under e[CO2], and this was alsoreflected in flour protein measured in this study. This reductionwasgreater than reported from previous FACE studies, which wereconducted under higher yielding conditions (Erbs et al., 2010; Högyet al., 2009; Kimball et al., 2001). In this present experiment, delayedsowing (TOS2) improved the grain protein concentration but grainyield substantially decreased. An inverse relationship between grainyield and protein content is reported when wheat grown undervarious environmental conditions included delayed sowing (Floodet al., 1996). The increase in grain protein concentration at the latersowing treatmentmayhave arisen fromreduced grainyield togetherwith an induction of rapid protein synthesis.
The concentrations of Cu, Mg, Na and P in grain were lowerunder e[CO2] (Table 2, Fig. 1), confirming similar results for Fe, Znand Ca reported earlier (Fernando et al., 2012). The reductions of Fe,
Mg, Na and S were larger for 2009-TOS2. Similarly, reductions ingrain S, Fe, P, Mg and Zn were reported from FACE experimentsunder high yielding conditions (Erbs et al., 2010; Högy et al., 2009).In this experiment, reductions in most of the mineral nutrientsincluding Zn and Fe were larger (Fig. 1) suggesting that impact of e[CO2] on grain mineral nutrient concentration is larger in lowrainfall Mediterranean cropping systems.
N/S ratio was reduced by 6% at e[CO2] where the optimum valueis considered to be 15/1. Reduction in N/S ratio at e[CO2] was due togreater reduction of N concentration relative to the reduction in Sconcentration. Approximately 80% of N and S are invested inprotein in many cereals and thus the maintenance of N/S ratio at anoptimum level is central to maintaining a correct balance of proteinsynthesis (Zhao et al., 1999). Our data suggest that N is morelimiting for the protein synthesis in the plants than S at e[CO2].
Low concentrations of grain protein and micronutrients, such asZn and Fe, in grainwill have a negative impact on a large proportionof the world’s population, particularly in the developing world(Loladze, 2002; Miraglia et al., 2009), especially where wheat is thestaple food (Cakmak et al., 2010). These deficiencies are related toinadequate daily intake and lower bioavailability of plant originmicronutrients (Cakmak et al., 2010). Currently, Fe deficiencyaffects more than 3.5 billion people and is one of the major publichealth problems in more than 130 countries, including developednations. In addition, nearly 50% of the world’s population is at riskof inadequate Zn intake, with deficiencies of other essential nutri-ents also being widespread (FAOSTAT, 2007). One of the majorcauses for Zn and Fe deficiencies is that these nutrients have anaffinity to bind with various organic and inorganic compounds,particularly phytic acid and certain non-digestible fibres in thedigestive tract, whichmakes them less available for uptake (Brinch-Pedersen et al., 2007). In this paper, we report for the first time thatthere is a tendency of reduced phytate concentrations in wheatgrains at e[CO2], by an average 17%. This may to some extentmitigate the impact of e[CO2] on lower grain micro nutrients suchas Zn and Fe by improving its bioavailability of human diet, becauselower abundance of phytate is associated with increased bioavail-ability of most essential micronutrients such as Zn and Fe (Brinch-Pedersen et al., 2007). Phytate is the main storage form of P inseeds/grains and it accounts for more than 1% of the dry weight and50e80% of the total P (Loewus and Murthy, 2000). A correspondingdecline in grain P concentration at e[CO2] was observed.
Wheat flour contained fructans (fructo-oligosaccharides) whichranged from 1 to 4% of the total dry mass. Fructans are non-digestible carbohydrates that are thought to selectively promotethe growth of colonic bifidobacteria, thereby improving human gut
N. Fernando et al. / Journal of Cereal Science 56 (2012) 684e690690
health (Lobo et al., 2006). It has been shown that e[CO2] increasedthe concentration of a number of soluble and insoluble sugars inwheat grain (Högy et al., 2009). However, e[CO2] had no significanteffect on grain fructan concentration in this experiment (Table 1).Fructans also facilitate the absorption of nutrients such as Ca, Zn,Mg and Fe in the human digestive tract (Lobo et al., 2006). The neteffect of fructans and phytate concentrations in grain may improvethe bioavailability of significant micronutrients like Fe and Zn.
Despite the reduction in the concentration of most of themacro-and micronutrients in grains at e[CO2], total grain uptake of Fe, Mn,B, Cu, Zn, Ca, Mg, K, P and S on an area basis was significantlyincreased (Fig. 3). This is mainly due to grain yield increase at e[CO2]. Most of the micronutrient uptake into the grain increased bymore than 30% at e[CO2] (Fig. 3), suggesting that rising CO2concentrations will accelerate depletion of these nutrients from thesoil. This underlines the urgent need to develop crop nutrientmanagement strategies adapted to future e[CO2] conditions.
4.3. Flour rheological properties
Wheat flour processing quality is mainly determined by thebalance ofmixingproperties, especiallymixing requirements, doughstrength, dough extensibility, and dough stability (Uthayakumaranet al., 1999). In this experiment, bread volume and dough strengthdecreasedate[CO2],whilemixing requirementwas likely to increase.These findings suggest that e[CO2] will have negative impacts onwheat flour based industries, possibly leading to a higher cost ofbread making. The balance of gluten protein fractions, which formviscoelastic networks during doughmixing, largely determine breadquality (Shewry and Halford, 2002). Changes in mixing propertiessuggest that there may be compositional changes in grain glutenprotein fractions at e[CO2] (Wieser et al., 2008). Inprevious studies, ithas been demonstrated that increasing mixing time (Kimball et al.,2001), decreased dough strength (Högy et al., 2009) and decreasedbread volumeundere[CO2] (Högyet al., 2009;Kimball et al., 2001). Incontrast, Högy et al. (2009) reported a significant increase in doughextensibility. However, our studies showed no differences in doughextensibility between [CO2] treatments. This discrepancy in doughextensibility could be related to the magnitude of protein modifica-tion,whichmay possibly link to the geneticmakeupof the plant and/or environmental interaction.
Acknowledgements
Research at the AGFACE facility is jointly run by the VictorianState Government Department of Primary Industries and theUniversity of Melbourne, with crucial additional funding by theGrains Research and Development Corporation and the AustralianCommonwealth Department of Agriculture, Fisheries and Forestry.Additional support by the International Plant Nutrition Institute isgratefully acknowledged. We thank Mahabubur Mollah, RusselArgall, Peter Howie, Nathan Neumann and Dileepa Jayaweera fortheir support in various stages of the experiment. We also thankVictor Raboy, United States Department of Agriculture for assis-tance with the phytate measurements.
References
AACC International, 2000. Approved Methods of the American Association of CerealChemists. Method 39e110, tenth ed. The Association, St. Paul, MN.
Ainsworth, E.A., Beier, C., Calfapietra, C., Ceulemans, R., Durand-Tardif, M.,Farquhar, G.D., Godbold, D.L., Hendrey, G.R., Hickler, T., Kaduk, J., et al., 2008.Next generation of elevated [CO2] experiments with crops: a critical investmentfor feeding the future world. Plant. Cell and Environment 31, 1317e1324.
Balla, K., Rakszegi, M., Li, Z.G., Bekes, F., Bencze, S., Veisz, O., 2011. Quality of winterwheat in relation to heat and drought shock after anthesis. Czech Journal ofFood Sciences 29, 117e128.
Braun, H.J., Rajaram, S., Ginkel, M., 1996. CIMMYT’s approach to breeding for wideadaptation. Euphytica 92, 175e183.
Brinch-Pedersen, H., Borg, S., Tauris, B., Holm, P.B., 2007. Molecular geneticapproaches to increasing mineral availability and vitamin content of cereals.Journal of Cereal Science 46, 308e326.
Cakmak, I., Pfeiffer, W.H., McClafferty, B., 2010. Biofortification of durumwheat withzinc and iron. Cereal Chemistry 87, 10e20.
Carter, T.R., Jones, R.N., Lu, X.L., 2007. New assessment methods and the charac-terisation of future conditions. In: ‘Climate Change 2007: Impacts, Adaptationand Vulnerability’. Contribution of Working Group II to the Fourth AssessmentReport of the Intergovernmental Panel on Climate Change. IPCC, CambridgeUniversity Press, Cambridge, UK, pp. 1s33e171.
Erbs, M., Manderscheid, R., Jansen, G., Seddig, S., Pacholski, A., Weigel, H.J., 2010.Effects of free-air CO2 enrichment and nitrogen supply on grain qualityparameters and elemental composition of wheat and barley grown in a croprotation. Agriculture, Ecosystems and Environment 136, 59e68.
FAOSTAT, 2007. FAO, Rome. http://faostat.fao.org.Fernando, N., Panozzo, J., Tausz, M., Norton, R., Fitzgerald, G., Seneweera, S., 2012.
Rising atmospheric CO2 concentration affects mineral nutrient and proteinconcentration of wheat grain. Food Chemistry 133, 1307e1311.
Flood, R., Martin, P., Panozzo, J., 1996. Influence of sowing time on grain qualitycharacters of wheat grown in north-western Victoria. Australian Journal ofExperimental Agriculture 36, 831e837.
Haug, W., Lantzsch, H., 1983. Sensitive method for the rapid determination ofphytate in cereals and cereal products. Journal of the Science of Food andAgriculture 34, 1423e1426.
Högy, P., Fangmeier, A., 2008. Effects of elevated atmospheric CO2 on grain quality ofwheat. Journal of Cereal Science 48, 580e591.
Högy, P., Wieser, H., Koehler, P., Schwadorf, K., Breuer, J., Franzaring, J.,Muntifering, R., Fangmeier, A., 2009. Effects of elevated CO2 on grain yield andquality of wheat: results from a 3-year free-air CO2 enrichment experiment.Plant Biology 11, 60e69.
Huynh, B., Palmer, L., Mather, D.E., Wallwork, H., Graham, R.D., Welch, R.M.,Stangoulis, J.C.R., 2008. Genotypic variation in wheat grain fructan contentrevealed by a simplified HPLC method. Journal of Cereal Science 48, 369e378.
Li, A.G., Hou, Y.S., Trent, A., 2001. Effects of elevated atmospheric CO2 and droughtstress on individual grain filling rates and durations of the main stem in springwheat. Agricultural and Forest Meteorology 106, 289e301.
Lobo, A.R., Colli, C., Filisetti, T.M.C.C., 2006. Fructooligosaccharides improve bonemass and biomechanical properties in rats. Nutrition Research CCCP 8, 413e420.
Loladze, I., 2002. Rising atmospheric CO2 and human nutrition: toward globallyimbalanced plant stoichiometry? Trends in Ecology & Evolution 17, 457e461.
Miraglia, M., Marvin, H.J.P., Kleter, G.A., Battilani, P., Brera, C., Coni, E., Cubadda, F.,Croci, L., et al., 2009. Climate change and food safety: an emerging issue withspecial focus on Europe. Food and Chemical Toxicology 47, 1009e1021.
Mollah, M., Norton, R., Huzzey, J., 2009. Australian grains free-air carbon dioxideenrichment (AGFACE) facility: design and performance. Crop & Pasture Science60, 697e707.
Ohm, J.B., Chung, O.K., Deyoe, C.W., 1998. Single-kernel characteristics of hardwinter wheats in relation to milling and baking quality. Cereal Chemistry 75,156e161.
Seneweera, S., Blakeney, A., Milham, P., Basra, A.S., Barlow, E.W.R., Conoroy, J., 1996.Influence of rising atmospheric CO2 and phosphorus nutrition on the grain yieldand quality of rice (Oryza sativa cv. Jarrah). Cereal Chemistry 73, 239e243.
Shewry, P.R., Halford, N.G., 2002. Cereal seed storage proteins: structures, propertiesand role in grain utilization. Journal of Experimental Botany 53, 947e958.
Stone, P., Nicolas, M., 1998. The effect of duration of heat stress during grain fillingon two wheat varieties differing in heat tolerance: grain growth and fractionalprotein accumulation. Australian Journal of Plant Physiology 25, 13e20.
Taub, D.R., Miller, B., Allen, H., 2008. Effects of elevated CO2 on the proteinconcentration of food crops: a meta-analysis. Global Change Biology 14,565e575.
Uthayakumaran, S., Gras, P.W., Stoddard, F.L., Bekes, F., 1999. Effect of varyingprotein content and glutenin-to-gliadin ratio on the functional properties ofwheat dough. Cereal Chemistry 76, 389e394.
Wieser, H., Manderscheid, R., Erbs, M., Weigel, H.J., 2008. Effects of elevatedatmospheric CO2 concentrations on the quantitative protein composition ofwheat grain. Journal of Agricultural and Food Chemistry 76, 6531e6535.
Zarcinas, B.A., Cartwright, L.B., Spencer, L.R., 1987. Nitric acid digestion and multi-element analysis of plant materials by inductively coupled plasma spectrom-etry. Communications in Soil Science and Plant Analysis 18, 131e146.
Zhao, F.J., Hawkesford, M.J., McGrath, S.P., 1999. Sulphur assimilation and effects onyield and quality of wheat. Journal of Cereal Science 30, 1e17.