24
When banks pick lemons: The reputational impact of borrower bankruptcy on other borrowers Reputation Symposium 16 th September 2011 University of Oxford Ken Okamura

When banks pick lemons: The
reputational impact of borrower
bankruptcy on other borrowersbankruptcy on other borrowers
Reputation Symposium 16th September 2011University of Oxford
Ken Okamura

Aim
� To measure the value of a bank’s reputation for its borrowers
� Bank reputation is valuable to its borrowers as a form of validation, signalling borrower quality
� What happens when the bank’s reputation suffers when another of its portfolio of borrowers enters bankruptcy – becomes a “lemon”
� The reputation is that of the bank measured by the change in the value of equity of its borrowers value of equity of its borrowers
� (The bank is known for screening/monitoring borrowers amongst other lending institutions/ buyers of bonds/equity. Measured via the abnormal share price movement: A form of “reputational capital”)

Why is this important?
� The consequences of a lemon failure is sufficient to reduce the market capitalization of all borrowers from the median bank by $3.8 billion
� Understanding the percentage of this that accrues due to the loss of reputational capital is important as it is possible that these can be mitigated in different ways to increasing capital at the bankthe bank
� It is possible that reputational capital varies across different classes of bank, understanding this and the process of reputational capital creation could be valuable

Method
� Event study based on borrower bankruptcy events� Decomposition of borrower losses into reduced loan capacity of main bank and reputational losses

Prior literature I
� When banks extend loans the borrowers see positive abnormal returns:
� James (1987) finds that a loan announcement has a positive 1.93% abnormal return
� Billery et al. (1995) find that a AAA rated bank making a loan results in a one day positive abnormal return of 0.6%
Ross (2010) finds that the impact of loan syndication led by one of � Ross (2010) finds that the impact of loan syndication led by one of the top three “dominant” lenders results in a positive 2.8% abnormal returns

Prior Literature II
� When a borrower fails:
� Saunders et al. (2003) finds that the announcement of a bond default (bankruptcy) leads to a negative abnormal return of 3.8% (1.8%) for the lending bank
� Gopalan et al. (2011) examine the impact of borrower bankruptcy on lead banks in loan syndications and find that future syndications within two years of the borrower failure require that the lead bank is within two years of the borrower failure require that the lead bank is forced to retain a higher proportion of loans and are less able to attract syndicate members

Prior Literature III
� Determinants of bank reputation:� Chemmanur and Fulghieri (1994 a and b) show that there is endogenous matching between borrower and investment bank in reputation
� Booth and Smith (1986) show that it is the reputation of the lender that forces the lender to engage in the effort of becoming an insider and monitoring and that it is this process that adds value
� Fang (2005) find that “reputable” banks based on ranking as investment bank issue bonds more cheaply for clientsbank issue bonds more cheaply for clients
� Ross (2010) finds that “reputable” banks based on being “dominant” (top three) result in borrower share price reaction being more positive when a loan is announced and that the terms of the loan are better for the borrower
� Gopalan et al. (2011) find that “reputable” banks based on being “dominant lead” (in an industry or area) see less of a negative impact on their borrowers share prices when another borrower enters bankruptcy

Sample size
� 34 listed Japanese firms declare bankruptcy between 1980-2000
� Share price reactions of 2,853 borrowers from banks which were top lenders to bankrupt firms (sample size falls to 2,302 after firms missing data are dropped for RoA analysis)
Japanese banks – stylised facts
� Japan Inc. is more dependent on banks for funding than America Inc.
� Japanese banks are the subject of a great deal of literature, seen as the archetypal relationship bank – what is known as the “main bank”, as in the main bank system
� However, Japanese banks actually engage in diversified lending, with the mean share of loans to listed borrowers of the lending, with the mean share of loans to listed borrowers of the main bank being 29%, and firms having multiple banking relationships
� The structure of bank borrowings is quite similar to the structure of loan syndications, with the main bank acting as the lead syndicate organiser
Comparing US and Japan
� US syndicated loan market concentrated in top three lenders (J.P.
Morgan Chase, Bank of America and Citibank) – accounting for 55% and
66% between 2001-2008, according to Ross (2010)
� Top 3 dominant US banks account for approximately 28% of total US
Commercial loans and leases in 2006
� Top 8 national “City” banks account for 27.1% of total loans to listed
Japanese firms, but a far higher percentage of main bank positions
Japanese borrower failures far less common than in the US: Gopalan et � Japanese borrower failures far less common than in the US: Gopalan et
al. (2011) identify 1,048 listed borrower failures between 1990 and 2005,
but their sample of bank-borrower relationships is limited to 4,843
(available data is limited as LPC data only has percentage of loan
syndication data for about 60% of its total universe of loans) and also
excludes firms that choose not to borrow or syndications led by others
� Japanese data is more complete as each firm details all outstanding bank
loans in their 10K equivalent

Aggregated event day returns for borrowers

Japan’s “dominant”(?) lenders
� Following the practice of Fang (2005), Ross (2010), Gopalan et al. (2011), we define a group of banks as “major” and thus having a better reputation than other banks
� Japanese major banks are the top 8 national “city” banks, which have large branch networks and operate nationally, unlike trust banks and long term credit banks, which operate nationally but have small branch networks and lend primarily on nationally but have small branch networks and lend primarily on a long term basis, or regional banks, which operate only locally
� We take the top 8 by asset size, they make only 27% of loans in 1993, but they account for 63% of listed firms’ main banks (top lenders), which is analogous to the percentage of lead positions of the top three dominant banks in the Ross sample

What is driving the loss?
� The loss is caused by the inability of the firm to fund future positive NPV projects
� Loss-makers probably fall also because of the perceived poor monitoring/screening of the bank, meaning failure is perceived to be more possible
� Loss-makers also do badly because they are far less likely to be able to find new bank relationshipsbe able to find new bank relationships
� One interesting point is that more profitable firms should suffer higher abnormal losses because their unfunded future positive NPV projects are more valuable

Impact of lemons on other borrowers of the lemon’s main bank
All Loss-makers Profitable
Major (“High reputation”) banks -0.0152 -0.026 -0.013***
Table 3. Impact of borrower failure by bank size and borrower profitability Major banks are defined as one of the top eight national “City” banks and their major pre-cursor banks. Loss-makers are firms
that have negative operating profits in the year prior to the distress events.
N 1942 283 1659
Non-major (“Low reputation”) banks -0.0417 -0.133 -0.033***
N 360 32 328
Difference (Major – non-major) 0.0265*** 0.107*** 0.02***
T statistic 9 13.71 6.29
*** Significant at the 1% level, ** significant at the 5% level and * significant at the 10% level

Loss makers do poorly, but so do the very profitable
All Loss-makers Profitable Moderately profitable Very profitable
Major (“High reputation”) banks -0.0152 -0.026 -0.013*** -0.013 -0.017***
N 1942 283 1659 1451 208
Non-major (“Low reputation”) banks -0.0417 -0.133 -0.033*** -0.031 -0.044***
Table 3. Impact of borrower failure by bank size and borrower profitability Major banks are defined as one of the top eight national “City” banks and their major pre-cursor banks. Loss-makers are firms
that have negative operating profits in the year prior to the distress events. Moderately profitable firms are those with RoA
(operating profits divided by total assets) of between 0% and 7%. Very profitable firms are those with RoAs of more than 7%.
Significance within bank samples compares loss-makers with profitable firms and moderately profitable and very profitable
firms.
N 360 32 328 278 50
Difference (Major – non-major) 0.0265*** 0.107*** 0.02*** 0.018*** 0.027***
T statistic 9 13.71 6.29 5.4 3.13
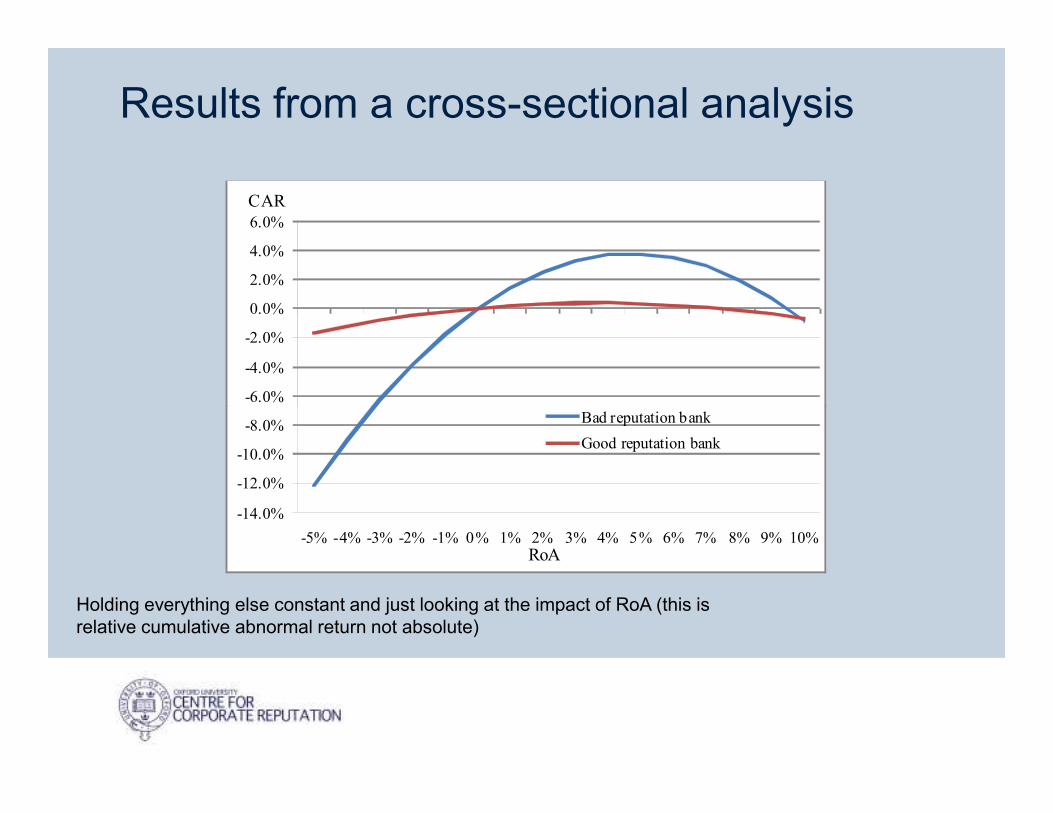
Results from a cross-sectional analysis
-6.0%
-4.0%
-2.0%
0.0%
2.0%
4.0%
6.0%
CAR
-14.0%
-12.0%
-10.0%
-8.0%
-5% -4% -3% -2% -1% 0% 1% 2% 3% 4% 5% 6% 7% 8% 9% 10%
Bad reputation bank
Good reputation bank
RoA
Holding everything else constant and just looking at the impact of RoA (this is relative cumulative abnormal return not absolute)

Capital loss vs. Reputational loss
� The lack of funding can be divided into two parts� The lemon’s main bank will suffer a reduction in capital due to the bankruptcy of the lemon. This reduces the capital available for other borrowers
� Calculating the abnormal return associated with the capital loss of the main bank allows us to deduce the reputational element, the extent to which loans from other banks (or other sources of the extent to which loans from other banks (or other sources of funding) are curtailed due to the reduction in the bank’s own reputation
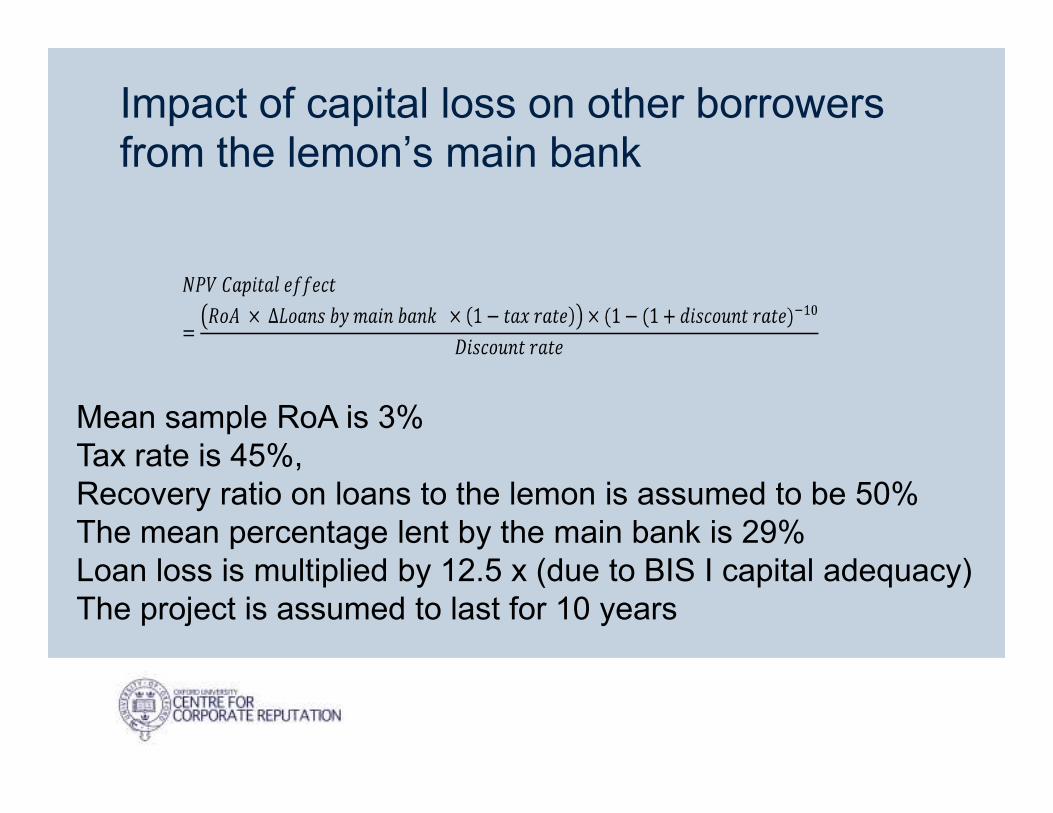
Impact of capital loss on other borrowers from the lemon’s main bank
Mean sample RoA is 3%Mean sample RoA is 3%Tax rate is 45%, Recovery ratio on loans to the lemon is assumed to be 50%The mean percentage lent by the main bank is 29%Loan loss is multiplied by 12.5 x (due to BIS I capital adequacy)The project is assumed to last for 10 years

Table of estimates of borrower share price impact of capital losses on bank capital
Percentage reduction in m
ain bank Discount rate
3.50% 4% 4.50% 5% 5.50%
0.50% -0.23% -0.23% -0.22% -0.21% -0.21%
0.75% -0.35% -0.34% -0.33% -0.32% -0.31%
Table 5: Estimates of abnormal return due to capital reduction at main bank Capital reduction is based on the main bank’s share of total loans to the bankrupt borrower with a 50% loss on
loans. The loan loss is calculated as a proportion of total main bank capital (shareholders’ equity and reserves)
and multiplied by 12.5x to reflect the impact on capital adequacy. This percentage loan reduction is applied to the
total loans extended to listed borrowers and multiplied by the RoA adjusted by the tax rate. The life of the
foregone investment is assumed to be 10 years.
Median loan loss estimate = median capital reduction
Percentage reduction in m
ain bank
capital
0.75% -0.35% -0.34% -0.33% -0.32% -0.31%
1% -0.46% -0.45% -0.44% -0.43% -0.42%
1.25% -0.58% -0.56% -0.55% -0.54% -0.52%
1.50% -0.69% -0.68% -0.66% -0.64% -0.63%
2% -0.81% -0.79% -0.77% -0.75% -0.73%
2.00% -0.92% -0.90% -0.88% -0.86% -0.84%
2.25% -1.04% -1.01% -0.99% -0.97% -0.94%
3% -1.16% -1.13% -1.10% -1.07% -1.05%
Favoured discount rate
reduction
Mean loan loss estimate = mean capital reduction

What is the reputational loss?
� The mean sample abnormal return is 1.9% and the median is 1.5% (note higher loss because sample is smaller for RoAanalysis)
� Taking the estimated effects of 0.77% and 0.33% for the mean capital loss and the median capital loss, we find that the NPV of the direct capital loss on borrowers is equivalent to 40% of the mean and 22% of the medianmean and 22% of the median
� The reputational impact is therefore estimated to be between 60% and 78% of the total abnormal return
� In order for the NPV of the direct capital loss to be 100% of the total abnormal return, project life must be 45 years or banks must lose 100% of the their loan and take on losses for other lenders equivalent to another 30% of their loans outstanding at time of lemon failure

Question� If bank size is a proxy for reputation because the bank is better able to monitor or screen...
� There is evidence for this in Fang (2005), Ross (2010)
� …Why is there not a greater reputational cost when one of their borrowers fails?
� Gopalan et al. (2011) finds dominant banks do better as we do
� Is it because the failure rate per bank is lower?Is it because the failure rate per bank is lower?
� A small bank with only 10 listed borrowers for whom it is a main bank sends a far more negative signal if 1 (10%) of its borrowers turns out to be a lemon, while a major bank with 200 listed borrowers for whom it is a main bank sees its reputation suffer little if one 1 (0.5%) of its borrowers turns out to be a lemon?
� Or is it because major banks are far more reciprocal in their lending relationships?

Reciprocity
� Japanese main bank theory has suggested the existence of delegated reciprocal loan relationships
� Each bank delegates the monitoring of its loans to the main bank of a particular borrower
� It is reciprocal because all the banks participate in lending to each other’ clients
� Reciprocity is strongest for the large national “city” banks� Reciprocity is strongest for the large national “city” banks

Reciprocity higher for major banks
10%
15%
20%
25%
Recirpocity measure
Major banks
Non-major banks
0%
5%
10%
0 10000 20000 30000 40000 50000 60000 70000
Recirpocity measure
Bank size: loans in 100 millions of yen
Non-major banks
Reciprocity measure = number of main bank lending relationships / total lending relationships

Conclusion
� Lending to lemons has an economically and statistically significant impact on other borrowers of 1.8%
� Confirms the results of Gopalan et al. (2011) using Japanese data – new loan syndications more difficult and costly for lender
� More complete sample due to the fact that LPC loan syndication data only covers loan syndications, is incomplete and sample is censored by firms that choose not to borrow via the old syndicate leaderby firms that choose not to borrow via the old syndicate leader
� Disaggregates abnormal return for the borrowers into direct loss due to bank capital reduction and the reputational cost
� Reputational cost estimated to be larger than the capital loss effect in the ratio 60:40


![How the Internet, the Sharing Economy, and Reputational ... · 2016] HOW THE INTERNET, THE SHARING ECONOMY, AND REPUTATIONAL FEEDBACK MECHANISMS SOLVE THE "LEMONS PROBLEM" 835 number](https://static.documents.pub/doc/80x56/5e4b9e74d376bc17781811a0/how-the-internet-the-sharing-economy-and-reputational-2016-how-the-internet.jpg)


