49
CEE DP 119 When do Better Schools Raise Housing Prices? Evidence from Paris Public and Private Schools Gabrielle Fack Julien Grenet October 2010 ISSN 2045-6557

CEE DP 119
When do Better Schools Raise Housing Prices?
Evidence from Paris Public and Private Schools
Gabrielle Fack
Julien Grenet
October 2010
ISSN 2045-6557

Published by
Centre for the Economics of Education
London School of Economics
Houghton Street
London WC2A 2AE
© G. Fack and J. Grenet, submitted October 2010
All rights reserved. No part of this publication may be reproduced, stored in a retrieval
system or transmitted in any form or by any means without the prior permission in writing of
the publisher nor be issued to the public or circulated in any form other than that in which it
is published.
Requests for permission to reproduce any article or part of the Working Paper should be
sent to the editor at the above address.
The Centre for the Economics of Education is an independent multidisciplinary research
centre. All errors and omissions remain the authors.

When do Better Schools Raise Housing Prices? Evidence
from Paris Public and Private Schools
Gabrielle Fack
Julien Grenet
1. Introduction 1
2. Estimating the Impact of Public School Performance on
Housing Prices 3
3. Public and Private Middle Schooling in Paris 7 The French educational system 7
Public and private school admission rules 8
4. Data and Summary Statistics 9 Schools 10 Housing prices and neighbourhood characteristics 13
5. The Impact of Public Middle School Performance on
Housing Prices 14 Naïve estimates 14 Matching sales across school attendance boundaries 15 How large is the effect? 16 Robustness checks 17
6. The Mitigating Effect of Private Schools 18 Theoretical predictions of school choice models 18 Estimation strategy 20 Results 22 Robustness of findings to alternative interpretations 23
7. Conclusion 26
References 27
Appendix 30
Figures 32
Tables 35

Acknowledgments
Gabrielle Fack is an Assistant Professor at the Department of Economics and Business,
Universitat Pompeu Fabra and a Research Affiliate at CEPREMAP, Barcelona GSE, CEPR and
Cesifo. Julien Grenet is an ESRC Postdoctoral Fellow at the Centre for Economic
Performance, London School of Economics, a Research Affiliate at CEPREMAP and an
Associate of the Centre for the Economics of Education.

1 Introduction
In France, as in many other countries, there is an ongoing debate on how residence-
based assignment to schools affects both educational and residential segregation.
Theoretical models (including Benabou, 1993; Fernandez and Rogerson, 1996; Epple
and Romano, 2003; Rothstein, 2006) have shown that the existence of peer effects in
education yields income and residential sorting in equilibrium. One of these models’
key parameters is the willingness of parents to pay for school performance. The
higher the value of this parameter, the higher the level of sorting when admission to
schools is tied to residence. However, this sorting process can be reversed once school
choice is introduced (Epple and Romano, 2003; Rothstein, 2006). In particular,
private schools, which operate under different admission rules, expand educational
choices and might mitigate sorting effects. In this paper, we test the theoretical
predictions of models of housing markets in which public and private schools coexist
(Nechyba, 1999, 2000, 2003). We estimate the impact of school performance on
housing prices and investigate how this effect varies with the availability of private
schools in the neighborhood.
Several empirical papers have sought to test the empirical prediction that hous-
ing prices should be higher in areas where schools perform better. The estimation
is complicated by the endogeneity of school performance in the housing price equa-
tion, since better schools tend to be located in wealthier neighborhoods and pupils
drawn from privileged socio-economic backgrounds generally have higher academic
achievement. Traditional hedonic regressions in which housing prices are regressed
on school performance, controlling for housing and neighborhood characteristics,
are therefore likely to be biased1. In her 1999 paper, Black proposed a method to
solve this problem by comparing the price of houses located near primary school
attendance boundaries and sufficiently close to share the same neighborhood char-
acteristics. Across these boundaries, mean differences in housing prices are assumed
to reflect differences in school test scores only. Restricting the sample to sales lo-
cated within 0.15 mile of a boundary, Black finds that a 5% increase in primary
schools’ test scores (approximately one standard deviation) raises housing prices by
2.1%. On UK data and using an alternative estimation strategy to correct for spatial
fixed effects2, Gibbons and Machin (2003, 2006) find an effect of the same order of
magnitude for primary schools. A study by Bayer et al. (2007) yields similar results
using a discrete choice model instead of the usual hedonic approach. Furthermore,
1In the French context, Gravel et al. (2006) implemented this hedonic approach using data froma Parisian suburb. For a review of other earlier papers, see Black (1999).
2In the UK, the estimation strategy cannot rely on school boundary fixed effects because schoolcatchment areas are not strictly defined. Proximity to primary schools is only one criterion amongothers for admission to schools and Cheshire and Sheppard (2004) point out that living in a houselocated near a boundary might render admission to a school more uncertain than living in a houselocated in the immediate vicinity of a school.
1

these authors provide evidence of significant heterogeneity in the marginal willing-
ness of households to pay for school performance. A few papers have also exploited
changes in school boundaries over time (Bogart and Cromwell, 2000; Reback, 2005)
and show that housing prices responded to these reforms. In the longer run, how-
ever, Kane et al. (2006) stress the difficulty of separately identifying the effect of
school performance from the effect of household sorting along school attendance
boundaries.
In order to better understand the policy implications of such findings, several
papers (including Downes and Zabel, 2002; Kane et al., 2003; Figlio and Lucas, 2004;
Brasington and Haurin, 2006; Clapp et al., 2008; Gibbons et al., 2009) have sought
to identify more precisely the kind of educational inputs and the type of informa-
tion on schools which are most valued by parents. Empirical findings suggest that
parents are more sensitive to student peer quality than to the quantity of school
ressources. The evidence is more mixed as to whether information on school effec-
tiveness (essentially in the form of valued added measured of school performance)
affects school markets(Kane and Staiger, 2002; Hastings et al., 2007; Mizala and
Urquiola, 2008).
If parents strongly value the peer quality of their children’s classmates, then
school admission rules can serve as an important policy tool to influence educational
inequalities. However, a proper evaluation of the potential effects of alternative
school allocation schemes requires the inclusion of both public and private schools
in the analysis. While most authors acknowledge the possibility that private schools
are likely to affect residential and educational choices, almost all existing studies
have restricted their analysis to sorting into public schools. To the best of our
knowledge, our paper is the first to investigate the effect of private schools on the
housing price premium attached to public school performance.
With respect to this existing literature, our paper innovates in two main direc-
tions. First, we improve the estimation strategy originally proposed by Black (1999)
to deal with the endogeneity of school performance in the housing price equation.
We do so by developing a matching framework which consists in the careful com-
parison of sales across public middle school attendance boundaries. We also test the
validity of this identification strategy by checking precisely if other neighborhood
characteristics vary discontinuously across boundaries.
Second, we investigate whether private school choice reduces the capitalization
of public school performance in housing prices. We use comprehensive data on both
schools and real estate transactions in the city of Paris over the period 1997-2004
to study how the local availability of private schools affects the willingness to pay
for better public schools. The organization of middle schooling in the city of Paris,
which combines residence-based assignment to public schools with a well-developed
and almost entirely publicly funded private school system, offers a valuable empirical
2
context for analyzing this issue.
Using different measures of school performance, we find that a standard deviation
increase in school performance raises housing prices by 1.4 to 2.4%. The size of this
effect is similar to existing US and UK estimates and can explain roughly 5% of
observed differences in housing prices between adjacent school zones. We also find
that the price premium attached to better performing public schools exhibits spatial
heterogeneity and varies with the availability of private schools in the neighborhood.
In line with the theoretical predictions of general equilibrium models of school choice,
the presence of good private schools in certain neighborhoods tends to attenuate
the capitalization of public school performance in housing prices, by providing an
advantageous outside option to parents.
The remainder of this paper is as follows: section 2 describes the estimation
strategy used to measure the impact of public school performance on housing prices;
section 3 briefly presents the French educational system and school admission rules;
section 4 gives a description of the data; section 5 presents the basic results regarding
the capitalization of public school performance in housing prices while section 6
evaluates how this capitalization varies with the local density of private schools.
2 Estimating the impact of public school perfor-
mance on housing prices
Economists have traditionally relied on hedonic models to estimate the impact of
school performance on housing prices. The standard hedonic housing price func-
tion describes the price of a particular sale as a function of the flat’s observable
characteristics, which include its intrinsic features (size, floor, etc.) as well as its
neighborhood characteristics. The corresponding coefficients are interpreted as mea-
suring the marginal purchaser’s willingness to pay for each specific characteristic.
The typical hedonic function for housing prices takes the following form:
ln pi,c,s,t = a+ b.zs +X ′i,c,s,tc+N ′
i,c,sd+ L′te+ ui,c,s,t (1)
where pi,c,s,t is the price of sale i, located in census block c, in school attendance
zone s during school year t; zs is the performance index of school s, Xi,c,s,t the
vector of the flat’s features, Ni,c,s the vector of neighborhood socio-demographic
characteristics (at the census block level), Lt a vector of time dummies and ui,c,s,tis the error term. The OLS estimate of parameter b is supposed to measure the
marginal willingness to pay for a better performing school.
As pointed out by Black (1999), this methodology will produce upwardly biased
estimates if the error term ui,c,s,t includes unobservable neighborhood characteristics
that are correlated with school performance zs and have an independent effect on
3
housing prices. To circumvent this problem, Black’s estimation strategy consists in
focusing exclusively on the set of sales that take place in the vicinity of a school
attendance boundary. Under the assumption that unobservable determinants of
housing prices vary continuously through space, the causal impact of school perfor-
mance on housing prices can be estimated by comparing sales across common school
attendance boundaries, which create spatial discontinuities in school performance.
Although Black’s solution solves the endogeneity problem that undermines the
traditional hedonic approach, her school attendance boundary fixed effects speci-
fications embody three relatively strong restrictions. First, characteristics of flats
are assumed to have the same impact on prices in all neighborhoods and school
attendance boundary fixed effects are assumed to be constant across years. The
problem here is that the valuation of features such as the age of the building, the
number of rooms or the presence of a parking space is likely to differ noticeably
across the different parts of a city3. Second, the comparison of sales located on both
sides of a common attendance boundary does not take into account the distance
between these sales. In particular, this methodology assumes that whatever the
length of a particular border, flats located on both sides but at opposite ends of
this boundary share on average the same unobservable characteristics. This may
not be true in the case of very long boundaries passing through relatively dissimilar
neighborhoods. Finally, in Black’s estimations, standard errors are clustered at the
school attendance level to account for the fact that unobservable shocks affecting
housing prices may exhibit spatial and serial correlation within a given school catch-
ment area. Hence it is implicitly assumed that unobservable shocks are uncorrelated
across common school attendance boundaries, which seems a fairly restrictive as-
sumption since sales located on both sides of a common boundary typically belong
to the same neighborhood.
In order to circumvent the limitations of the boundary fixed effect estimation
strategy, we adopt a matching framework that enables us to correct housing prices
for local-specific flat features effects, restrict a transaction’s comparison group to
sales located in its immediate vicinity and cluster the standard errors at the school
boundary rather than at the school attendance level.
To account for the fact that the price premium attached to observable flat charac-
teristics may vary throughout the area under study, we compute regression-adjusted
residuals obtained from specifications that include the full vector of flat features4,
school year and quarter fixed effects, which are estimated separately for each of
3For instance, the presence of a parking space may increase the price of a flat by a larger amountin the city center (where parking spaces are scarce) than in the periphery (where they are morecommon).
4Flat features include a set of dummy variables for the age of the building (before 1850, 1850-1913, 1914-1947, 1948-1969, 1970-1980, after 1981), the number of bathrooms (1, 2 or more), thepresence of a parking space, of a maid’s room, the floor (first to fourth or more with and without alift), the number of rooms (from 1 to 5 or more) and the average room size (small, medium, large).
4

Paris’s 20 municipal arrondissements, which are the city’s main administrative units.
The matching approach described below is performed using these residuals rather
of the raw housing prices5.
The second step of our estimation strategy involves matching sales across com-
mon school attendance boundaries. The basic principles of this approach are il-
lustrated in the graphical example displayed in figure 1. This map represents the
immediate vicinity of a particular school attendance boundary which located in the
16th arrondissement of Paris. This boundary separates the catchment areas of two
public middle schools: Janson de Sailly and Eugene Delacroix. All sales that took
place in a given school year and within a particular radius of that boundary are
selected. To ensure that our results are not too sensitive to a particular value of the
chosen bandwidth, we use three distinct values to set the maximum distance between
the included sales and the school attendance boundaries (250, 300 and 350 meters).
These values are chosen to reach sufficient statistical power and to provide wide
enough intervals (50 meters) to test the stability of our results. Each sale located
on one side of the boundary, which we call a “reference sale”, is matched with all
transactions that took place in the same school year, on the other side of the bound-
ary and within a given radius (250, 300 or 350 meters) from the reference sale. In
the particular example depicted in figure 1, the reference sale is located on the even
side of the rue des Sablons street (number 38), which is assigned to the Janson de
Sailly middle school. This reference sale is matched with three sales located on the
opposite side of the same street (numbers 23, 27 and 33) and assigned to the Eugene
Delacroix middle school. We use these three sales to construct a “counterfactual”
sale whose price per square meter is computed as the weighted geometric mean of
their prices, with weights equal to the inverse of the distance between each of these
sales and the reference sale, in order to give more importance to the sales that are
located nearby relatively to the more distant ones. The impact of public school
performance on housing prices is then estimated by regressing the price differen-
tial between the reference and the counterfactual sale on the corresponding school
performance differential.
More formally, we suppose that the price per square meter (taken in log) of a
transaction i, assigned to public middle school s, located in the vicinity of a school
attendance boundary b and completed during school year t is determined by the
following equation:
ln pi,b,s,t = α + β.zs +Xi,b,s,tγ + θb,t + εi,b,s,t (2)
5While this correction is not essential to yield unbiased estimates of the impact of school per-formance on housing prices (since flats located on both sides of common attendance boundariesshould share similar features on average), it nevertheless increases the precision of our estimatesby reducing the noise associated with the heterogeneity of flats’ observable characteristics.
5

“Reference” sales are all housing transactions located within a certain distance d
of a school attendance boundary b. For each reference sale i, we construct a fictive
“counterfactual” sale i′ which is located on the other side of the common school
attendance boundary (s, s′). The price of this counterfactual is supposed to mea-
sure the amount for which the reference transaction would have been sold, had it
been located in school attendance area s′ rather than in school attendance area s,
everything else being equal6.
The price of the counterfactual transaction i′ cannot be observed and has to be
estimated. We do so by calculating the weighted geometric mean of the prices of all
transactions j that took place within a radius d (250, 300 or 350 meters) and in the
same school year t as the reference sale i, but were assigned to school s′ rather than
to school s. The transactions used to construct the counterfactual sale are weighted
by the inverse of their distance di,j to the reference sale i. Hence, the counterfactual
sale’s estimated price per square meter pi′,b,s′,t is calculated as:
ln pi′,b,s′,t =J∑
j=1
1di,j∑Jj=1
1di,j
ln pj,b,s′,t
The identification of the “public middle school effect” relies on the crucial as-
sumption that the counterfactual sale i′ and the reference sale i share the same unob-
servable time-varying neighborhood effect θb,t. Under this assumption, the housing
price differential between the reference sale and the constructed counterfactual is
written7:
ln pi,b,s,t − ln pi′,b,s′,t = β(zs − zs′) + εi′,b,s′,t − εi,b,s,t (3)
Parameter β can be estimated by running an OLS regression of the price differ-
ential between the reference and the counterfactual sale on the corresponding school
performance differential. Since the identifying assumption is more likely to hold for
matches that are geographically close8, we perform weighted OLS regressions, the
weight given to a particular match being equal to the inverse of the distance between
6Note that a given reference sale could potentially be matched with different counterfactualsales located along distinct school attendance boundaries. This would be the case in particularfor sales located in the “corners” of school attendance zones. To avoid using the same referencessales in different matches (a feature that would induce serial correlation in housing prices acrossdifferent boundaries), we decided to assign each sale to its closest boundary. Hence as long as theybelong to distinct boundaries, our matches are constructed using different sales.
7By definition, the price of each counterfactual sale i′ can be written asln pi,b,s′,t = α+ β.zs′ + θb,t + εi′,b,s′,t, where the disturbance term εi′,b,s′,t is a weighted av-erage of the disturbance terms of the sales that are used to construct the counterfactual.
8For each match, the distance between the reference and the counterfactual sale is computedusing their respective geographic coordinates. The geographic coordinates of the reference saleare known. The counterfactual’s geographic coordinates are computed as the weighted averagecoordinates of the sales that were used to construct it, with weights equal to the inverse of theirdistance to the reference sale.
6

its components.
The final step of our estimation strategy involves clustering the standard er-
rors at the school attendance boundary levels. Indeed, an important feature of the
housing price differential equation (3) is that by construction, the composite error
term (εi′,b,s′,t − εi,b,s,t) exhibits serial correlation along common attendance bound-
aries9. Standard errors need therefore to be clustered at the school attendance
boundary level.
3 Public and private middle schooling in Paris
3.1 The French educational system
The French educational system is highly centralized an fairly homogenous until
pupils reach the age of 14. Children spend five years in primary school (age 6 to
10), four years in middle school or College (age 11 to 14) and three years in high
school or Lycee (age 15 to 17). The minimum school leaving age is 16 years.
Education in France is predominantly public10, centrally financed and supervised
at the local level by 35 Local Education Authorities (LEAs) called Academies. They
are in charge of managing human and financial resources and of implementing the
official educational programs produced by the Ministry of Education. Importantly
for our study, the city of Paris is under the supervision of one unique Academie, which
decides how to assign pupils and resources to schools. Human and financial resources
are for the most part allocated on the basis of school enrollment, so spending per
pupil and teacher characteristics are fairly similar across schools.
As in the US or UK , private education in France is predominantly religious, but
several institutional features of French schools make them very different from their
foreign counterparts and should be kept in mind when interpreting our results.
A first specificity of French private schools is that most of them are publicly
funded, especially at the primary and middle school levels. Publicly funded private
schools are subject to State supervision: they follow the national curriculum and
appoint qualified teachers who are paid by the State11. These schools can charge
fees provided that they do not exceed the amount needed to cover the costs which
9Serial correlation arises for two reasons. First, the unobservable housing price component ofthe reference sales εi,b,s,t may exhibit spatial and time correlation. Second, the counterfactualerror term εi′,b,s′,t is itself a weighted average of the unobservable housing price components of thedifferent sales that are used to construct it. The error terms εi′,b,s′,t will therefore exhibit spatialcorrelation along a given boundary because the same sales are used in the construction of severalcounterfactuals. Note, however, that serial correlation in the error term only exists for sales thatare assigned to the same school attendance boundary.
10Public schools account for 79% of secondary school enrollment at the national level (de Monre-don, 2008; Jaspar, 2008).
11Unfunded private schools are not subject to State supervision and usually offer alternativeteaching methods for specific groups of children, in particular those with learning difficulties.
7
are not publicly funded, such as religious education classes. As a result, the fees
charged by private educational instituions are usually modest, in the range of 500
to 2,000 euros per annum.
A second specificity of private education in France is that the State exerts a direct
control over the size of the subsidized private sector, through two main channels.
First, the opening of new private schools is subject to very tight restrictions. New
private institutions cannot be publicly financed without the approval of an ad hoc
board (composed of members of the Ministry of Education, representatives of local
communities and representatives of private schools) and must meet a “recognized
educational need” (“besoin scolaire reconnu”). Second, the Ministry of Education
can decide to keep the size of the private sector within certain limits by imposing
a cap on the number of positions that are offered every year in the competitive
examination for the recruitment of private school teachers. Anecdotal evidence
suggests that the actual size of the private sector is kept smaller than needed to
satisfy the demand for private education, especially in large cities.
3.2 Public and private school admission rules
The rules governing school admission are probably the most important feature that
distinguishes public and private middle schools in France.
During the period under study (1997-2004), primary and middle school assign-
ment was purely residence-based12. It was also “strict” in the sense that each school
catchment area contained one school only, which means that in principle parents
had no control over the choice of their child’s public school. However rigid this sys-
tem may appear, it allowed some exceptions. There were basically two ways parents
could get round school catchment areas without actually changing residence. First,
they could ask the LEA for a dispensation that entitled them to send their children
to a school located outside their attendance zone. These dispensations could be
granted on several grounds: if specific options were not taught in the local school, if
a child’s sibling was enrolled in a different school or exceptionally if the local school
was located much further away from home than a school belonging to an adjacent
zone. Every year, dispensations were granted to about 8% of Parisian pupils entering
middle schooling, the rate of rejection being around 40%. While a substantial frac-
tion of these dispensations had true practical justifications, some parents may have
used them to avoid what they perceived as low-performing local middle schools13.
The second way of getting round the zoning system was to use the outside option
provided by the extensive network of highly subsidized private middle schools14.
12This system came to an end in 2007 through a series of reforms that were aimed at givingparents more freedom to choose their child’s public school.
13If anything, the existence of these dispensations would tend to slightly mitigate the capitaliza-tion of public middle school performance in housing prices.
14Besides these two “legitimate” ways of getting round school catchment areas, there is anecdotal
8

Private schools in France are not subject to any zoning scheme. Because they
can freely select their pupils from anywhere in the city, publicly funded private
schools offer a relatively cheap (but subject to rationing) outside option to parents
who are willing to avoid the constraints of strict school zoning. This particular
feature explains that although private schools are predominantly Catholic, the choice
of private education is now driven by educational rather than by purely religious
motives15 (Langouet and Leger, 1997). The rules for admission in private schools
are not always explicitly stated and vary from school to school. The most commonly
used criteria are academic excellence, presence of an older sibling in the school, good
behavior and commitment to the school’s values16.
While most existing empirical studies of the impact of school performance on
housing prices have focused on primary schools, we investigate what happens during
the first part of secondary education. The main reason for taking this approach is
that in the French school system, middle schooling is the educational stage that is
most likely to have the largest influence on housing markets. A number of empirical
studies by sociologists suggest that parents living in the Paris region care a lot
about educational performance at the middle school level (Oberti, 2007). This
is a direct consequence of the strong competition that arises in the final year of
middle schooling to enter the best high schools, a process over which parents have
some degree of choice since they can send applications to any particular high school
located within one of four large attendance areas.
4 Data and summary statistics
To estimate the impact of school performance on housing sales in Paris, we collected
data on school zones, school characteristics, individual property sales and local socio-
demographic characteristics during school years 1997-2004.
evidence that some parents would choose to cheat the system by providing a wrong home addressto the Local Education Authority (typically using that of a relative sharing the same family name).However, we understood from informal discussions with Paris LEA officials that only a very smallfraction of well-connected parents actually used this kind of strategy. We therefore have goodreasons to believe that this form of non-compliance is unlikely to strongly mitigate the impact ofschool performance on housing prices.
15As an indication of this, families do not hesitate to switch between public and private sectors,especially when their children reach the middle or high school level. For example, during schoolyear 2004, about a quarter of pupils enrolled in Parisian private middle schools came from publicParisian primary schools (and 3% of pupils enrolled in public middle schools came from a privateprimary school).
16Note that applicants to Catholic middle schools are usually not required to be baptized nor tohave been previously enrolled in a religious primary school.
9

4.1 Schools
The Paris LEA administered 108 public middle school during the period of study,
which account for two-thirds of total enrollment. Among the third of pupils enrolled
in private schools, the vast majority attended publicly funded institutions since only
3% were enrolled in non-publicly funded schools. This latter type of institutions
being targeted to very specific groups of pupils, we decided to exclude them from
the analysis17. We therefore only considered in our analysis the 63 publicly funded
private schools that were operating in the city of Paris between 1997 and 2004.
4.1.1 School catchment areas in Paris
Data on school zones was provided by the Paris LEA, which was in charge of delim-
iting the catchment areas of primary and middle schools during the period under
study. Because of their central role in our estimation strategy, school catchment
areas are worth examining in some detail.
School catchment areas are released every school year in the form of booklets
that indicate, for each street section, the assigned public middle school. Using the
complete set of geolocalized addresses of the city of Paris, we were able to map each
of the 108 public middle school catchment areas for every school year between 1997
and 2004. Figure 2 displays the particular layout of school catchment areas that
prevailed in 2003-2004 in the 19th arrondissement of Paris. This map shows that in
most cases, middle school zones are contiguous although they are sometimes split
into two or three parts (see for example the catchment area of the Henri Bergson
middle school). A closer look reveals that that many school zone boundaries are
not straight, but rather have a zigzag shape. Given our estimation strategy, middle
school boundaries thus seem to share two highly desirable properties: first, they
tend to split otherwise similar neighborhoods, a feature that is needed for credible
identification; second, they are numerous enough to yield precise estimates.
A serious concern that has been raised about using school zone boundaries as an
exogenous source of variation in public school performance is that they are likely to
coincide with other administrative divisions, which might be associated with other
discontinuities than school performance. In the Parisian context, school catchment
areas can be clearly distinguished from other administrative divisions. The first
thing to note is that the Paris LEA covers a single municipality: local tax rates are
therefore equal throughout the covered area. Moreover, each of the 20 arrondisse-
ments, which may differ at the margin in terms of public goods provision, comprises
several school attendance zones. To ensure that these administrative subdivisions
do no contaminate our estimations, we decided to exclude from the data all school
17Moreover, there is currently little statistical information on the characteristics and performanceof non-publicly funded private schools.
10

attendance boundaries that coincide with arrondissements boundaries. We also
checked that the set of middle school boundaries included in the analysis were not
confounded with primary or high school attendance boundaries18.
A final important issue raised by school zone boundaries is their degree of sta-
bility over time. The information that we gathered through informal talks with
the LEA officials in charge of school catchment areas in Paris revealed that the
reassignment process is essentially driven by demographic reasons and is highly un-
predictable by parents. However, they cannot be considered as exogenous events,
since they usually coincide with underlying demographic trends that may affect the
housing market independently from school performance. Moreover, reassignments
often take place in the same neighborhoods and some streets constantly experience
school zone changes. Because current school boundaries in these areas are often
modified, parents might not take them into account. Hence we decided not to use
these reassignments and to restrict our estimations to non-reassigned areas. Our
data show that over the period 1997-2004, school catchment areas in Paris remained
largely unchanged, since less than 10% of all Parisian addresses were reassigned over
this period of seven years. It seems therefore unlikely that the instability of school
attendance boundaries would invalidate our identification strategy.
4.1.2 School performance and school characteristics
Our empirical analysis requires information on the performance of public and private
schools. The exact characteristics that parents use to rank schools are subject to an
extensive debate in the literature. A number of studies have produced evidence that
parents’ school choices react to test-based school rankings (Black, 1999; Figlio and
Lucas, 2004; Hastings et al., 2007). However, as pointed out by Mizala and Urquiola
(2008) the problem with this evidence is that test scores are highly correlated both
with peer group composition and, to a lesser extent, with school effectiveness (or
“value-added”). While disentangling these two components is a difficult task, recent
research suggests that peer quality could well be the dominant factor (Rothstein,
2006; Mizala and Urquiola, 2008).
The institutional features of the French educational system outlined in section 3,
as well as anecdotal evidence, suggest that parental perception of middle school
performance relies heavily on peer quality. There are two main reasons for that.
First, as previously noted, the highly centralized organization of middle schooling
18Although we do not have data on the precise layout of primary schools’ catchment areas, ourdata shows that in most cases, pupils from a particular primary school are not assigned to a singlemiddle school but at least to two different ones, which suggests that primary school boundariesseldom follow middle school boundaries. In the case of high schools, excluding arrondissementsboundaries from the analysis mechanically eliminates middle school attendance boundaries thatmatch those of high schools, since the limits of the four Parisian high school catchment areashappen to follow exactly those of the arrondissements.
11

and teacher allocation is unlikely to produce large differences in school effective-
ness. Second, value-added measures of school performance have never been publicly
released for middle schools. The information that parents can use to rank middle
schools thus relies exclusively of exam scores and peer composition. Official league
tables showing the average exam scores at the middle school level were only recently
introduced in France and are now widely accessible19. It must be noted however
that to satisfy parents’ demand for information about middle school performance,
rankings of Paris middle schools were regularly published in the local press as from
the beginning of the 1990s. For the period under study (1997-2004), parents living
in the city of Paris can thus be considered to have a relatively good knowledge of
how middle schools compare to each other in terms of pupil performance.
The French Ministry of Education provided us with statistical information on
schools20. In our empirical analysis, we use three distinct indexes to measure school
performance: the average scores at the school level of a national exam (Diplome
National du Brevet) taken at the end of middle school (DNB SCORE), the fraction
of middle school pupils who are admitted into the high school general curriculum
as opposed to vocational studies (GENERAL CURRICULUM) and the proportion
of middle school pupils coming from privileged socio-economic backgrounds (PRIV-
ILEGED BACKGROUND)(a detailed description of the construction of our school
performance indicators is provided in the appendix). The first measure is avail-
able only for school year 2003-2004, whereas the other two measures are averaged
over school years 1997-2004. These three indexes are standardized by dividing each
school’s value by the corresponding standard deviation of school averages (including
both public and private schools). Unsurprisingly, the three indexes are very highly
correlated, with correlation coefficients ranging from 0.84 to 0.90.
4.1.3 Summary statistics
Table 1 compares the characteristics of Parisian public and private schools during
school year 2003-2004. Columns 2 and 3 show that private school pupils enjoy much
more favorable characteristics than their public school counterparts, which translates
into better pupil performance: the DNB score gap between private and public school
pupils amounts to almost a standard deviation of the DNB score averaged at the
school level.
The last four columns of table 1 reveal that public schools are very heterogenous
in their pupils’ characteristics. Their performance is very highly correlated with
peer quality: pupils enrolled in schools belonging to the top quartile of the average
19Examination results at the school level are consultable via the Internet (See for instancehttp://www.france-examen.com).
20We used three datasets that were provided by the Direction de l’Evaluation, de la Prospective etde la Performance du Ministere de l’Education nationale (MEN-DEPP): SCOLARITE for studentscharacteristics, OCEAN for exam results, and IPES for school characteristics.
12

DNB exam score come in majority from privileged socio-economic backgrounds, are
much less likely to be of foreign nationality and almost systematically enter general
curriculum high schools. The comparison of school size and teachers’ characteristics
in the bottom and top quartiles of school performance shows much less variation,
which is consistent with the idea that school peer group composition is the primary
factor behind the unequal performance of Parisian middle schools. If teachers work-
ing in the bottom quartile schools are younger than their colleagues working in the
top quartile schools, they are only slightly less qualified and enjoy a somewhat lower
pupil-to-teacher ratio.
Figure 3 displays the spatial distribution of public middle school performance
(as measured by the average 2004 DNB exam score) across the different school
catchment areas in Paris. This map reveals that the best public middle schools tend
to be located in the central and western parts of the city while the lowest-performing
schools are usually found in the north-eastern quarter21. It also indicates that the
transition between different levels of school performance is not smooth and that
many adjacent schools perform very unequally (especially in the eastern part of the
city). Given our identification strategy, this is a desirable feature because large
school performance differentials yield more precise estimates.
4.2 Housing prices and neighborhood characteristics
Data on property sales come from the BIEN 22 dataset which is managed by the
Notary Chamber of Paris and the Ile-de-France. The dataset is almost comprehen-
sive and contains between 80 and 90% of all the transactions that took place since
1997. For each transaction, we have information on the price for which the prop-
erty was sold, along with its detailed characteristics (size, number of bedrooms and
bathrooms, date of construction, etc.) and its precise spatial location (Lambert II
grid coordinates) with a precision of the order of 5 meters. Our sample is restricted
to all arm’s-length sales of second hand Parisian flats23 that took place between
September 1997 and August 2004.
By combining the precise geographic coordinates of each sale in Paris and the
mapping of school catchment areas, we were able to identify each transaction’s
assigned public middle school between 1997 and 2004. Figure 4 shows how the
21The maps corresponding to the other two indexes of public middle school performance (frac-tion entering general curriculum high schools and fraction of pupils coming from privileged socio-economic backgrounds) show a very similar pattern.
22Base d’Informations Economiques Notariales.23We dropped newly-built property sales as well as the few houses that were present in the sample.
We also dropped transactions when the price or the number of rooms was missing. Finally, wedecided to exclude the Ile Saint-Louis and Ile de la Cite islands, because of their very specificlocation and pattern of housing prices. We further excluded sales belonging to the top and bottompercentiles of housing prices per square meter each year. We are left with a sample of about 200,000transactions.
13

price per square meter (in 2004 euros) of sales that took place during school year
2003-2004 varies across the 108 corresponding public middle school catchment areas.
The spatial distribution of housing prices is fairly close to the spatial distribution
of school performance displayed in figure 3. It is however much more continuous,
the price per square meter decreasing gradually as we move away from the central
and western parts of the city. This feature suggests that housing prices and school
performance are highly correlated, although no causal interpretation can yet be
given to this phenomenon.
We use the 1999 French National Census24 at the block level (Iris) to control for
the socio-demographic characteristics of Parisian neighborhoods. Summary statis-
tics on housing and socio-demographic characteristics are reported in the first two
columns of table 2. These figures indicate that the population living in the city
of Paris is rather socially privileged but that its socio-demographic characteristics
exhibit a great degree of variation across neighborhoods.
5 The impact of public middle school performance
on housing prices
In this section, we use the matching framework presented in the section 2 to estimate
the extent to which the performance of Parisian public middle schools is capitalized
in housing prices.
5.1 Naive estimates
As a preliminary step in the analysis, we performed traditional hedonic regressions
to evaluate the severity of the bias induced by the endogenity of school performance
in the housing price equation.
The first two columns of table 3 show the results of estimating the hedonic
housing price equation (1), with and without controlling for the socio-demographic
characteristics of the census block, using our three alternative indexes of public mid-
dle school performance. Column 1 indicates that when no controls are added except
for year and quarter of the transaction, the naive estimation of the impact of school
performance on housing prices yields a strong apparent positive impact: for every
standard deviation increase in the local public middle school’s DNB score, the hous-
ing price per square meter goes up by 21.8%. While the coefficient is not particularly
affected when one adds controls for flats’ characteristics, it drops dramatically once
we control for detailed neighborhood characteristics at the block level, as better per-
forming schools tend to be located in more privileged neighborhoods. In column 3, a
24Recensement de la Population francaise 1999.
14

standard deviation increase in the DNB score is now associated with a 2.7% increase
in housing prices. Similar results are obtained when using the other two indexes of
school performance.
Although the set of controls included in the right hand side of the hedonic re-
gression equation is large, it is not necessarily adequate to solve the endogeneity
problem. To isolate precisely the causal impact of school performance on housing
prices, we need to restrict our sample to sales located in the vicinity of a school at-
tendance boundary (either 250, 300 or 350 meters). Columns 3 to 8 of table 2 show
how the features of the flats included in our three samples and the associated neigh-
borhood characteristics compare with those of the full sample of sales. Reassuringly,
these figures indicate that along both these dimensions, the sales included in our
restricted samples are hardly different from those of the full sample. The last three
columns of table 3 show that the naive estimates obtained when running the simple
hedonic regression (controlling for time trends, flat features and neighborhood char-
acteristics) on these sales located within 250 to 350 meters are in the same order
of magnitude as the full sample estimates (column 4), even if they appear slightly
larger.
5.2 Matching sales across school attendance boundaries
The results obtained when using our matching strategy are displayed in the three
columns of table 4, for each of the three indexes of school performance. Average
cross-boundary school performance differentials are reported at the bottom of the
table and confirm, in line with the pattern observed in figure 3, that public middle
school attendance boundaries induce substantial discontinuous variations in school
performance25.
Using the DNB exam score as a measure of school performance, we find a signifi-
cant impact of school performance on housing prices. Our estimates are remarkably
stable across the different choices of the maximum distance to boundary and show
that a standard deviation increase in the average exam score raises the price per
square meter by about 1.4%, which is roughly half the size of the naive estimate af-
ter controlling for flat features and neighborhood socio-demographic characteristics
(see column 3 of table 3).
The estimates obtained using the two other indexes of school performance are
fairly similar across the different values chosen for the maximum distance to school
attendance boundary and are larger in magnitude than the coefficient on the DNB
exam score. A standard deviation increase in the fraction of middle school pupils
who are admitted into general curriculum high schools is estimated to raise housing
prices by 1.6-1.9%, whereas the coefficient on the proportion of pupils coming from
25For instance, the average cross-boundary DNB score differential is equal to 0.6 of a standarddeviation (of schools’ averages).
15

privileged socio-economic backgrounds is around 2-2.5%. Hence, our results appear
robust to different definitions of school performance and are in the range of 2.1 to
2.4%26.
5.3 How large is the effect?
Our estimates of the impact of middle school performance on housing prices in
Paris are of the same order of magnitude as existing estimates for primary schools
in other countries: similar to the 2.1% effect found by Black (1999) for Boston
suburbs primary schools; slightly smaller than the 3.7% effect estimated by Gibbons
and Machin (2003) for British primary schools.
Two simple computations can help us get some sense of the size of the measured
effect. First, we calculate that other things being equal, moving from the worst to
the best public middle school (which corresponds to 4.8 times the standard error of
the average DNB exam score at the school level) would imply a price premium of
roughly 7% (around 13,000 euros for the average flat price). Second, we estimate the
fraction of the housing price differential between school zones that can be explained
by differences in school performance. In order to do so, we calculate the observed
difference in the average flat price (taken in logs) between each adjacent pair of
school zones and relate it to the flat price differential predicted by the corresponding
difference in school performance. We find that school performance explains roughly
5% of the observed difference in housing prices between adjacent school zones.
These calculations indicate that although school performance plays a non-negligible
role in the formation of housing prices, it is certainly not the main driving force in
the real estate market. However, our results do not imply that the way school
performance determines parents’ residential location should be neglected when de-
signing school enrollment policies. What is estimated is indeed an average effect
of school performance on housing prices over the entire population of households,
which might be lower than the effect for the subpopulation of parents living with
school-age children.
26To see how our results compare with those obtained using the boundary fixed effects approachof Black (1999), we performed a series of regressions in which we replaced the vector of neighbor-hood characteristics in the basic hedonic equation (1) by a full set of school attendance boundarydummies. Reassuringly, the results (available upon request) are very similar in magnitude to ourprevious matching estimates. The estimates are slightly larger (1.9% versus 1.4% for the DNBscore, 2.2% versus 1.8% for the fraction of pupils entering general curriculum high schools and2.9% versus 2.3% for the proportion of pupils coming from privileged socio-economic backgroundsat 300 meters), but are not significantly different. However, our results also show that cluster-ing the standard errors at the school level rather than at the school attendance boundary levelartificially inflates the estimates’ t-statistics by about 20%.
16

5.4 Robustness checks
To assess the reliability of our results, we perform two series of robustness checks.
First, we ensure that flats located on either side of common school attendance
boundaries share similar observable features; second, we address the issue of socio-
demographic sorting across school attendance boundaries to determine whether ob-
servable patterns can be credibly explained by school performance differentials.
Our estimation strategy relies on the assumption that on average, sales located
on either side of a common attendance boundary share the same flat features and
neighborhood characteristics so that price differentials are purely attributable to
school performance differentials. Yet this hypothesis might be violated if apart-
ments located on the “good” side of school attendance boundaries tend to display
certain features (e.g. more housing units with a parking space) that are valued
by buyers independently from school performance. If such characteristics tend to
attract wealthier households, whose children’s educational attainment will mechan-
ically drive up the performance of the local school, then one might worry that our
approach could produce upwardly biased estimates.
First, we test whether the observable characteristics of flats such as the age of
building, the number and size of rooms, the number of bathrooms, the presence of a
parking space or a maid’s room, are similarly distributed on either sides of common
attendance boundaries. Table 5 compares the features of apartments located on
either side of common school attendance boundaries, within a distance of 250, 300
and 350 meters to these boundaries. The “good” side of a particular boundary
corresponds to where the school’s average DNB exam score is the largest and the
“bad” side where it is the smallest. Within each sample considered separately, the
characteristics on the “good” side and the “bad” side of boundaries appear almost
exactly similar. Moreover, the numbers show no obvious pattern implying that flats
located on the “good” side of the boundary are more desirable on average than
those located on the “bad” side. Hence our findings do not seem to be driven by
differences in observable flat features27.
A more serious issue is that household sorting might occur at boundaries, even if
apartments share the same features on average. Several papers using US data (Bayer
et al., 2005, 2007; Kane et al., 2006) have shown that not only school performance,
but also several socio-demographic characteristics (such as household income) could
vary discontinuously between adjacent school catchment areas. In this case, com-
paring sales across boundaries would lead to overestimate the causal effect of school
performance on housing prices. To investigate the existence of sorting effects across
school attendance boundaries, we compare the observable socio-demographic char-
27One might still argue that some unobservable flat features (e.g. one side gets more sun than theother) might bias the results, but there is no particular reason to believe that such characteristicsare distributed differently across school zones.
17

acteristics of neighborhoods (at the census block level) located on the “good” versus
the “bad” side of school boundaries. Table 5 shows that for each of our three samples
of sales (250, 300 and 350 meters), neighborhoods socio-demographic characteris-
tics are remarkably similar on both sides of boundaries and that households living
on the “good” side of a boundary do not appear more privileged on average than
households living on the “bad” side. This simple exercise does not support the view
that in the case of Paris, school attendance boundaries mirror other preexisting
lines of separation between distinct neighborhoods. Given the very irregular trace
of school catchment areas (see figure 2), it seems rather plausible to consider that
in our particular empirical context, school boundaries run through otherwise similar
neighborhoods.
So far, we have established that parents care about public school performance
when they make their residential choices. In the next section, we investigate whether
the availability of private schools influences the housing price premium attached to
public school performance.
6 The mitigating effect of private schools
Previous studies have mainly focused on public schools, ignoring the other options
provided by private schools in their analysis28. Yet Epple and Romano (1998) show
that it is crucial to take into account both public and private schools when studying
sorting into schools. Recent papers on school vouchers (Nechyba, 2003; Ferreyra,
2007) argue that private schools act as an outside option when parents decide in
which area to buy a house or a flat. In this section, we exploit the combination
of strict public school residence-based assignment and private school choice in the
Parisian context to test whether private school availability influences residential
choices by lowering the price premium that parents are ready to pay for a flat
located in the catchment area of a better-performing public middle school.
6.1 Theoretical predictions of school choice models
The way housing markets react to school performance when public and private
schools coexist has been extensively analyzed by Nechyba in a series of theoretical
papers (1999; 2000; 2003). A number of testable predictions can be derived from his
general equilibrium models of school finance, which include multiple school districts
(either state of locally financed), multiple neighborhoods within school districts and
different housing qualities. In the set-up defined by Nechyba, local public schools
are subject to zoning and coexist with private schools that can freely select their
28Gibbons and Machin (2003) include religious schools in their analysis, since they are publiclyfunded, but do not investigate whether these school have a specific impact and do not includeother types of private schools in their analysis.
18

pupils. The author’s numerical simulations suggest that private schools tend to
increase peer stratification in schools while reducing residential stratification29, a
feature which is reflected in housing prices. In this section, we test whether in line
with these predictions, the presence of private schools in a particular neighborhood
mitigates the effect of local public school performance on housing prices.
As explained in section 3, private schools offer an attractive outside option to
parents who wish to avoid sending their children to a low-performing local public
school. In Paris, about a third of middle school pupils were enrolled in a private
school during the period under study (see table 1). Contrary to public middle
schools, the spatial distribution of private institutions is not even throughout the
city. Therefore, under the assumption that parents don’t usually want to enroll
their children in a school that is located too far away from home, the impact of
public school performance on housing prices should depend on the availability of
local private schools in the neighborhood.
The assumption that distance to school matters to parents who consider sending
their children to a private institution can be indirectly tested by looking at how
far away private middle school pupils reside from their school. Although we cannot
calculate this distance precisely because we lack information on the precise home
address of pupils, we know in which of the 20 Parisian arrondissements they reside.
According to our computations, 53% of Parisian pupils enrolled in a private school
in 2003-2004 attended a school located in their arrondissement of residence and
28% a school located in an adjacent arrondissement, so 81% of private school pupils
can be considered as living reasonably close to their school. Other things being
equal, the availability of private schools in a given area should therefore raise the
probability that parents enroll their children in the private sector and should lower
the capitalization of public school performance in local housing prices.
In terms of our housing price model, the impact of private school availability
on the capitalization of public school performance in housing prices can be viewed
as changing the magnitude of parameter β which we now consider as a function of
private school availability in the neighborhood (denoted ab):
ln pi,n,s,t = α + β(ab).zs +Xi,n,s,tγ + θn,t + εi,n,s,t (4)
Under the assumption that both sales of a common match are sufficiently close
to enjoy the same private school availability, the housing price differential equation
can be rewritten:
ln pi,b,s,t − ln pi′,b,s′,t = β(ab)(zs − zs′) + µi,i′,b,s,s′,t
29The overall effect on the performance of public schools varies with the type of school financeand on whether per public spending increases enough to compensate for the decrease in peerquality.
19

where µi,i′,b,s,s′,t is an error term which is clustered at the public school attendance
boundary level30.
With respect to the previous model, the impact of public school performance on
housing prices is no longer spatially homogenous but is allowed to vary with the level
of private school availability. Within this framework, the estimated parameter β is
the average impact of school performance on housing prices within the area covered
by the sample. If private schools tend to mitigate the impact of public school
performance on housing prices, we would expect the estimated coefficient to be
higher in areas with few private schools than in areas where they are numerous.
In addition, the analysis of the mitigating effect of private schools provides us
with an indirect way of testing the validity of our identification strategy. If our
estimation of the price premium paid for flats located on the “good” side of a
boundary was solely due to unobservable differences in neighborhood characteristics
and was not driven by public school quality, this premium should remain significant
in all areas, irrespective of the local density of private schools. On the contrary,
if we find that this premium is lowered by the availability of private schools, we
have good reasons to believe that the price premium is not driven by unobservable
differences across schools boundaries.
6.2 Estimation strategy
To test the hypothesis that private school availability influences the capitalization of
public school quality in housing prices, we construct an index of local private school
availability. For each transaction i, this index (denoted PRIVi) is computed as the
inverse of the distance between a sale and its closest private middle school:
PRIVi =1
minj
(di,j)∀i
where di,j denotes the distance between transaction i and private school j. The
higher the value of PRIVi, the closer the private middle school is to transaction i.
Our samples of sales located in the vicinity of a school attendance boundary
are then divided into four groups of equal size. Each sale is allocated to one of
the four quartiles depending on the value of its private school availability index31.
Figure 5 shows how corresponding areas are distributed in the city of Paris for the
full set of existing Parisian adresses32. Reassuringly, our index is well distributed
30In terms of our previous notation, µi,i′,b,s,s′,t = εi,b,s,t − εi′,b,s′,t.31Note that choosing the inverse of the distance between the transaction and the private school
rather than a monotonic transformation of that distance (e.g. distance squared) has no incidenceon the distribution of sales in each of the four quartiles, since it leaves the rank ordering of salesunchanged.
32Since sales were not necessarily completed in all Parisian adresses during the period under
20

across neighborhoods and does not cut Paris into four geographically distinct zones,
a feature that could bias our estimates.
To measure the mitigating effect of private schools, we allow the index of pub-
lic middle school performance to vary with the quartile of private middle school
availability. The regression of the log price differential between sale i and its coun-
terfactual i′ in time t on the corresponding school performance differential thus takes
the following form:
log pi,b,s,t − log pi′,b,s′,t = β1Q1.∆z + β2Q2.∆z + β3Q3.∆z + β4Q4.∆z + µi,i′b,s,s′t
where ∆z is the school performance differential between sale i and sale i′’s assigned
public schools s and s′, Qj (j ∈ {1, 2, 3, 4}) are dummy variables that indicate to
which quartile of private school availability the reference sale belongs and µi,i′b,s,s′t
is the error term clustered at the school attendance boundary level.
Although simple and intuitive, our index of private school availability depends
only on the distance between a sale and its closest private school and is not the only
way to measure the extent to which the network of private schools is developed in a
particular area. Another possibility would be to use an index of density of private
schools, which takes into account not only the distance to the closest private school,
but also the distance to all other private schools operating in the city33. For that
purpose, we constructed an alternative index of private school availability which is
computed as the average value of a sales distance (squared) to every private middle
school in Paris34:
PRIV 2i =
Nj∑j=1
1
d2i,j
∀i
where Nj denotes the total number of publicly funded private middle schools that
operate in the city of Paris (63) and di,j is the distance between transaction i and
private school j. The higher the value of this index, the higher the density of pri-
vate schools in a transaction’s neighborhood. Despite their different definitions, the
PRIVi and PRIV 2i indexes produce almost identical quartiles of private school
availability (Spearman’s rank correlation coefficient between both measures of pri-
vate school availability is in the range of 0.8 to 0.9 depending on the sample of
included sales). The estimations obtained using both measures of private school
availability are therefore very similar and, for the sake of brevity, we report only
study, the full set of existing adresses in larger the set of sales included in the BIEN dataset.33The presence of a private institution in a given neighborhood does not indeed guarantee to
prospective owners that they will be able to enroll their children in this particular private school,especially if it is oversubscribed. In this situation, it may seem reasonable to consider that theoutside option provided by the private sector is more attractive in neighborhood where a largenumber of schools operate than in neighborhoods where they are scarce.
34Using the inverse of the distance squared allows us to give much more weight to the closestprivate schools relatively to the more distant ones.
21

those based on the first index35.
6.3 Results
The regression results are reported in table 6. Column 1 displays the baseline co-
efficients on school performance in the housing price equation which were already
presented in table 4. The coefficients on the interaction terms between school per-
formance and each of the four quartiles of private school availability are displayed
in columns 2 to 5. Each panel corresponds to a particular choice of the maximum
distance to public school attendance boundary: 250 meters (panel A), 300 meters
(panel B) and 350 meters (panel C). Within each panel, results are shown separately
for the three indexes of public middle school performance.
The coefficients show a very distinctive pattern and are remarkably consistent
across the different choices of school performance indexes and maximum distance to
boundary. Columns 2 to 5 indicate that as private school availability increases, the
impact of public school performance on housing prices becomes smaller. While for
the bottom quartile of private school availability, the coefficient on the DNB exam
score is about 2.7%, it falls to about 1.7% for the middle lower quartile and becomes
small and insignificant (0.6-1.0%) for the upper quartiles (columns 4 and 5).
The results are very similar when we use the other two indexes of school perfor-
mance. A standard deviation increase in the fraction of public middle school pupils
who are admitted into general curriculum high schools raises housing prices by about
2.5% in areas belonging to the bottom quartile of private school availability and only
0.8-1.2% in areas belonging to the top quartile. The difference is even larger when
the fraction of pupils coming from privileged socio-economic backgrounds is used to
measure school performance: the coefficient falls from 3.8-4.3% to 0.6-1.2% when
we move from the bottom to the top quartile of private school availability.
On the whole, these results support the theoretical prediction that the impact
public school performance on housing prices varies with the availability of private
schools. When parents have the opportunity to send their children to local private
schools, then housing prices do not seem to depend on the performance of the local
public middle school; on the contrary, when there are few private schools available
in the neighborhood, then local public middle school performance appears to be
capitalized into housing prices.
These results are also interesting as they suggest that our previous estimates of
the impact of public school performance on housing prices are unlikely to be driven
by differences in neighborhood characteristics that are unrelated to school quality.
The finding that the housing price premium shrinks and becomes insignificant in
areas with a dense network of private schools is rather reassuring, as it shows that
35Estimates obtained using the second index of private school availability are available uponrequest.
22

the housing price differential disappears when we do not expect to find a price
premium attached to public school quality.
Given these estimates, one can perform the simple exercise that consists in com-
paring the cost of attending a private school with the cost of moving into the catch-
ment area of a better-performing public school. For an average private school tuition
fee of 1,000 euros per year in Paris, four years of private middle schooling cost about
4,000 euros to parents. In areas belonging to the top quartile of private school den-
sity, the average DNB exam score is 9.61 for public schools and 11.07 for private
schools (see table 7). This difference of 1.46 point is equal to three quarters of a
standard deviation in the school average DNB exam score. According to our esti-
mates, the housing price premium to be paid for a similar increase in public school
performance in areas belonging to the bottom quartile of private school density
would be equal to about 2.1%, which is about 3,800 euros at the average flat price.
The housing price premium attached to public school performance in neighborhoods
where private schools are scarce is therefore in the same order of magnitude as the
individual cost of a private school four-year tuition fee in areas where they are nu-
merous. These figures indicate that the valuation of public school performance is
roughly comparable to the cost of the outside option provided by private education.
6.4 Robustness of findings to alternative interpretations
For our estimation strategy to credibly identify the mitigating effect of private
schools on the capitalization of public school performance in housing prices, we
need to show that our results are not driven by other confounding factors.
One first obvious concern is that the presence private schools in specific areas
may be endogenous. This would happen in particular if private schools responded
to changes in neighborhood characteristics and public school performance by strate-
gically opening or closing some establishments. We argue, however, that the spatial
pattern of private school location has been extremely stable over the last decades,
mainly because of the very tight control exercised by the state over the creation of
publicly private schools. Our data confirm that the flow of creation of private schools
during the period under study was very limited, since only one publicly funded es-
tablishments was created between 1997 and 2004 while another one started to receive
public funding after changing status36. In fact, the vast majority (83%) of Parisian
private schools were created before 198037. Data on the closure of private schools is
less reliable but our investigations show no evidence of such events during the pe-
36Since both these publicly funded schools started to operate towards the end of the periodunder study, we decided to exclude them from the analysis.
37Available information on the date of creation of private schools comes from the BCE dataset(Base Centrale des Etablissements). Dates of creation are censored at 1980 although most Parisianprivate schools were created several decades earlier.
23

riod under study. The corollary of this very stable geographical location of private
schools in Paris is that parents are most likely to take the presence of private school
as given when choosing their place of residence.
The second concern is that despite their very stable location, the availability of
private schools may be correlated with a number of variables that lower the taste for
public school performance in a given area. Below, we show that for a wide range of
observable characteristics, our data does not support the view that areas with more
private schools differ from those where they are scarce.
A first possibility is that high private school density areas exhibit flat features
or neighborhood characteristics that could induce a lower capitalization of public
school performance in housing prices. For instance, if private schools tend to be
concentrated in poorer areas, the apparent insignificant impact of public school
performance on housing prices could well derive from the weaker willingness of eco-
nomically disadvantaged households to pay for better schools. To investigate this
issue, we compared flat features and neighborhood socio-demographic characteris-
tics across the four quartiles of private school availability. The figures, displayed
in table 7 for the sample of sales located within 250 meters of a school attendance
boundary38 show no noticeable difference in flat characteristics across areas with
different private school availability. In particular, housing prices show no particular
monotonic pattern across the four quartiles of private school availability. The size
of flats in high private school density areas does however appear to be slightly larger
than in low density areas but the difference seems too small to explain our results.
Moreover, the comparison of flat sizes across the four quartiles of our second index of
private school availability, PRIV 2i (not reported here) does not show this particular
pattern. Furthermore, housing prices show no particular monotonic pattern across
the four quartiles of private school availability. The comparison of census charac-
teristics across quartiles suggests that private school availability is also uncorrelated
with the socio-demographic profile of Parisian neighborhoods. Most variables, in-
cluding the distribution of occupations, have almost the exact same values across
the different quartiles.
Another possibility is that the location of private schools might be correlated with
political or religious views that would themselves influence the parental valuation
of public school performance. For instance, if the choice of private education was
primarily based on political or religious motives with little concern for the relative
performance of public schools, then are results could be explained by neighborhood
sorting along these preferences. We investigated this issue by relying on two proxies
for political views and religious practice. Our political index is computed as the
fraction of right-wing voters in each of the city’s 80 administrative subdivisions
38The tables corresponding to the other samples of sales yield similar results and are availableupon request.
24

during the national parliamentary elections that took place in June 2002. In the
absence of any direct statistics on religious practice in Parisian neighborhoods, we
decided to use as a proxy the number of places of worship within a radius of 1
kilometer of each sale39. The results, reported in table 7, show that the quartiles
of private school availability are very similar in terms of political views and do not
seem to differ greatly in terms of religious activity.
A third possibility is that the mitigating effect of private schools could be driven
by local variations in the average cross-boundary public school performance differ-
ential. This would be the case in particular if public school differentials are lower in
areas where a large number of private schools operate and if small differentials tend
to have no impact on housing prices. We examine this issue by comparing aver-
age cross-boundary performance differentials across the different quartiles of private
school availability. To do so, we compute the average DNB score percentage pre-
mium of the public school located on the “good” side of the boundary over the the
DNB score of the school located on the “bad” side.40. The results are reported in
table 7. Average cross-boundary school performance premiums show no particular
association with private school availability: the average premium is very close to
11% for all quartiles. Taken together, these results do not support the idea that our
results could be capturing an effect of local variations in the average cross-boundary
public school performance differential.
The final possibility that we explore is that our estimates could in fact reflect the
impact of local public-private performance differentials rather than the availability
of private schools per se. This would be the case if areas where a large number
of private schools operate are also those that experience the largest performance
premiums of private schools over public schools. To test this alternative explanation,
we compare the average performance premium of local private schools in each of our
four quartiles of private school availability. The premium is computed as follows:
PRIVATE PREMIUM =DNBP − 0.5(DNB1 + DNB2)
0.5(DNB1 + DNB2)
where DNBP , DNB1 and DNB2 denote the DNB exam scores of respectively the
closest private middle school, the public middle school assigned to the “reference”
sale and the public middle school assigned to the “counterfactual” sale. The re-
sults are reported at the bottom of table 7. The average DNB premium of local
39Our results are robust to the size of the area within which places of worship are counted.40For a particular school attendance boundary, the performance premium of the best of the two
public middle schools is computed as:
PUBLIC PREMIUM =DNBg −DNBb
DNBb
where DNBg is the DNB exam score of the school located on the “good” side of the boundary andDNBb is the DNB score of the school located on the “bad” side of the boundary.
25

private schools over local public schools appears remarkably stable (around 15%)
across quartiles and shows no particular association with the level of private school
availability. Thus, these results tend to rule out the idea that the mitigating effect
of private schools could be essentially driven by local variations in the performance
premium of private schools over public schools rather than by the availability of
these private schools.
Overall, the location of private school does not seem to be correlated with vari-
ables that could potentially bias our results, including flat features, socio-demographic
neighborhood characteristics, political views and religious practice as well as pub-
lic school performance or the average performance premium of private schools over
public schools. Our investigations thus suggest that the outside option provided by
private education is be the main reason why public middle school cross-boundary
price differentials tend to disappear when the number of private schools operating
in a particular area increases.
7 Conclusion
Using comprehensive data on middle schools and housing sales in Paris over the
period 1997 to 2004, we find that the performance of public schools has a significant
impact on housing prices by comparing price and school performance differentials
across school attendance boundaries. A standard deviation increase in the average
exam score at the school level raises housing prices by 1.4 to 2.4% depending on
the chosen index of school performance. The size of this effect is similar to existing
estimates in the US and UK contexts and can explain roughly 5% of the observed
in housing prices differences between adjacent school zones.
We also find evidence that, following the predictions of theoretical models of
school choice, private schools tend to attenuate the capitalization of public school
performance in housing prices by providing an advantageous outside option to par-
ents. The estimated impact of school performance in neighborhoods belonging to
the top quartile of private school availability is twice the size of the average effect
whereas the coefficient is close to zero in areas belonging to the bottom quartile.
Finally, our results suggest that the coexistence of public and private schools
is an important dimension to take into account when designing school assignment
policies. In particular, the effect of alternative public school admission rules (strict
residence-based assignment, relaxed school zoning, school choice, etc.) on school
and residential segregation, pupil performance and educational inequalities will cru-
cially depend on how the housing market incorporates public and private school
performance.
26

References
Bayer, P., Ferreira, F., and McMillan, R. (2005). “Tiebout Sorting, Social Multipli-
ers and the Demand for School Quality”. NBER Working Paper No 10871.
Bayer, P., Ferreira, F., and McMillan, R. (2007). “A Unified Framework for Measur-
ing Preferences for Schools and Neighborhoods”. Journal of Political Economy,
115(4):588–638.
Black, S. (1999). “Do Better Schools Matter? Parental Valuation of Elementary
Education”. Quarterly Journal of Economics, 114(2):577–599.
Benabou, R. (1993). “Workings of a City: Location, Education and Production”.
Quarterly Journal of Economics, 108(3):619–652.
Bogart, W. T. and Cromwell, B. A. (2000). “How Much is a Neighborhood School
Worth?”. Journal of Urban Economics, 47(2):280–305.
Brasington, D. and Haurin, D. (2006). “Educational Outcomes and House Values: a
Test of the Value Added Approach ”. Journal of Regional Science, 56(2):245–268.
Chay, K. Y., McEwan, P. J., and Urquiola, M. (2007). “The Central Role of Noise
in Evaluating Interventions That Use Test Scores to Rank Schools”. American
Economic Review, 95(4):1237–1258.
Cheshire, P. and Sheppard, S. (2004). “Capitalising the Value of Free Schools:
the Impact of Supply Characteristics and Uncertainty”. Economic Journal,
114(499):F397–F424.
Clapp, J. M., Nanda, A., and Ross, S. L. (2008). “Which School Attributes Matter?
The Influence of School District Performance and Demographic Composition on
Property Values”. Journal of Urban Economics, 63(2):451–466.
de Monredon, S. (2008). “Les eleves du premier degre a la rentree 2007 dans les ecoles
publiques et privees”. Note d’information du Ministere de l’Education nationale.
Downes, T. and Zabel, J. (2002). “The Impact of School Characteristics on House
Prices: Chicago 1987-1991”. Journal of Urban Economics, 52(1):1–25.
Epple, D. and Romano, R. (1998). “Competition between Private and Pub-
lic Schools, Vouchers, and Peer-Group Effects”. American Economic Review,
88(1):33–62.
Epple, D. and Romano, R. (2003). “Neighborhood Schools, Choice, and the Distri-
bution of Education Benefits”. In Hoxby, C. M., editor, The Economics of School
Choice. University of Chicago Press.
27
Fernandez, R. and Rogerson, R. (1996). “Income Distribution, Communities and the
Quality of Public Education”. Quarterly Journal of Economics, 111(1):135–164.
Ferreyra, M. (2007). “Estimating the Effects of Private School Vouchers in Multi-
District Economies”. American Economic Review, 97(3):789–817.
Figlio, D. and Lucas, M. (2004). “What’s in a Grade? School Report Cards and
House Prices”. American Economic Review, 93(3):591–604.
Gibbons, S. and Machin, S. (2003). “Valuing English Primary Schools”. Journal of
Urban Economics, 53(2):197–219.
Gibbons, S. and Machin, S. (2006). “Paying for Primary Schools: Supply Con-
straints, School Popularity or Congestion”. The Economic Journal, 116(510):C77–
C92.
Gibbons, S., Machin, S., and Silva, O. (2009). “Valuing School Quality Using Bound-
ary Discontinuites”. SERC DISCUSSION PAPER 18.
Gravel, N., Michelangeli, A., and Trannoy, A. (2006). “Measuring the Social Value
of Local Public Goods: an Empirical Analysis Within Paris Metropolitan Area ”.
Applied Economics, 38(16):1945–1961.
Hastings, J., Van Weelden, R., and Weinstein, J. (2007). “Preferences, Information
and Parental Choice Behavior in Public School Choice”. NBER Working Paper
No. 12995.
Jaspar, M.-L. (2008). “Les eleves du second degre a la rentree 2007 dans les
etablissements publics et prives”. Note d’information du Ministere de l’Education
nationale.
Kane, T. J., Riegg, S. K., and Staiger, D. O. (2006). “School Quality, Neighborhoods
and Housing Prices”. American Law and Economic Review, 8(3):183–212.
Kane, T. J. and Staiger, D. O. (2002). “The Promise and Pitfalls of Using Imprecise
School Accountability Measures”. Journal of Economic Perspectives, 16(4):91–
114.
Kane, T. J., Staiger, D. O., and Samms, G. (2003). “School Accountability Ratings
and Housing Values”. Brookings-Wharton Papers on Urban Affairs, pages 83–137.
Langouet, G. and Leger, A. (1997). Le choix des familles: ecole publique ou ecole
privee. Paris, Editions Fabert.
Mizala, A., Romaguera, P., and Urquiola, M. (2007). “Socioeconomic Status or
Noise? Tradeoffs in the Generation of School Quality Information”. Journal of
Development Economics, 84(1):61–75.
28

Mizala, A. and Urquiola, M. (2008). “School markets: The impact of Information
Approximating Schools’ Effectiveness”. NBER Working Paper No 13676.
Nechyba, T. (1999). “School Finance Induced Migration and Stratification Patterns:
The Impact of Private School Vouchers”. Journal of Public Economic Theory,
1(1):5–50.
Nechyba, T. (2000). “Mobility, Targeting and Private School Vouchers”. American
Economic Review, 90(1):130–146.
Nechyba, T. (2003). “Introducing School Choice into Multi-District Public School
Systems”. In Hoxby, C. M., editor, The Economics of School Choice, pages 145–
194. University of Chicago Press.
Oberti, M. (2007). L’ecole dans la ville. Segregation – Mixite – Carte Scolaire. Paris,
Presses de Sciences Po.
Reback, R. (2005). “House Prices and the Provision of Local Public Services:
Capitalization Under School Choice Programs”. Journal of Urban Economics,
57(2):275–301.
Rothstein, J. (2006). “Good Principals or Good Peers? Parental Valuation of School
Characteristics, Tiebout Equilibrium, and the Incentive Effects of Competition
Among Jurisdictions”. American Economic Review, 96(4):1333–1350.
29

Appendix: computation of school performance in-
dexes
We used several datasets provided by the Statistical Department of the French Min-
istry of education to construct three measures school performance: the average exam
scores at the school level (DNB SCORE), the fraction of middle school pupils who
are admitted into the high school general curriculum as opposed to vocational stud-
ies (GENERAL CURRICULUM) and the proportion of middle school pupils coming
from privileged socio-economic backgrounds (PRIVILEGED BACKGROUND).
Individual exam score data could be retrieved for the entire Paris Local Educa-
tion Authority from the OCEAN 41 national exam results database. Unfortunately,
we could only use information for school year 2003-2004 since the exam results of
previous years were not available. The OCEAN dataset records the individual score
obtained by every pupil enrolled in the Paris LEA at the Diplome National du Brevet
(DNB). This exam is taken by all French pupils in their final year of middle school
(Troisieme). Individual scores are an equally weighted combination of a continuous
assessment and a final national examination, which is graded anonymously at the
LEA level and consists in three parts: Math, French and History & Geography. Each
section is scored out of 20. To ensure that our measure of performance is comparable
across schools, we use only the national exam component of the DNB score. The
performance of any particular school is therefore computed as the average Math,
French and History & Geography score obtained by pupils at the DNB exam.
Because our exam score based index is computed using a single year of data, one
cannot exclude that it acts a noisy measure of the medium-run school performance,
which arguably determines parents’ school choices. While the pitfalls associated
with the use of short-run measures of school performance have been extensively
discussed in the literature (Kane and Staiger, 2002; Chay et al., 2007; Mizala et al.,
2007), we believe that they are likely to be less severe for middle schools, because
their enrollment is typically larger than that of primary schools, a feature that
mechanically reduces year-to-year variation in a school’s average score. The median
number of pupils taking the DNB exam in each middle school belonging to the Paris
LEA in 2004 was 125, which is three to four times larger than the median enrollment
used in studies that have called into question the reliability of school accountability
measures. In any case, we decided to use an alternative index of school performance
that would better reflect the medium-run performance of schools over the period
1997-2004. Using the SCOLARITE dataset42, we were able to calculate for each
41Organisation des Concours et Examens Academiques et Nationaux.42The SCOLARITE dataset is available every year over the period 1997-2004. It contains
individual information on all French pupils enrolled in public or private middle and high schools.The datasets contains information on each pupil’s age, gender, citizenship, occupation of thehousehold head, arrondissement of residence, school attended in the current (t) and previous (t−1)
30

school in each year the percentage of pupils in their final year of middle school who
are admitted into general curriculum high schools the following year, as opposed to
those who start vocational studies. These annual figures are then averaged at the
school level over the period 1997-2004. In the French context, this variable can be
considered as a good indirect measure of school performance, since it is closely linked
to educational attainment and varies greatly across schools. It should nonetheless
be noted that admission into general curriculum high schools is not tied to any
particular threshold in the DNB exam score, but rather to a global assessment of
individual performance by the teachers.
Our final and third index of school performance is a direct measure of peer qual-
ity. As explained earlier, there are many reasons to believe that in the French con-
text, parents are highly concerned about peer group composition in their valuation
of middle schools43. Using the SCOLARITE dataset, we computed the fraction of
pupils in each middle school that come from privileged socio-economic backgrounds,
averaged over school years 1997 to 2004.
Unsurprisingly, our three indexes of school performance are highly correlated,
the correlation coefficients ranging from 0.84 to 0.90.
year as well as current and previous school educational level. However, this very rich dataset suffersfrom two limitations. First, the panel dimension of the data cannot be exploited because accessto the pupil identifier is restricted. Second, this dataset does not contain the pupils’ results toexaminations and cannot be individually matched with the previously mentioned OCEAN nationalexam results database.
43A rather striking symptom of this parental concern for peer quality, especially in the Parisiancontext, is that maps showing how middle schools compare in their socio-economic compositionhave been regularly published in the local press.
31

Figure 1: Matching sales across boundaries: illustrative example.
Figure 2: School catchment areas in the 19th arrondissement of Paris. School year2003-2004.
VALMY
CLAUDE CHAPPE
CHARLES PEGUY
LEON GAMBETTA
GUILLAUME BUDE
FRANCOISE DOLTO
LOUISE MICHEL
HENRI BERGSON
EDOUARD PAILLERON
VOLTAIRE
GEORGES ROUAULT
LA FONTAINE AU ROI
BEAUMARCHAIS
JEAN BAPTISTE CLEMENT
GEORGES BRASSENS
AMANDIERS ROBERT DOISNEAUMAURICE RAVEL
MARX DORMOY
LA GRANGE AUX BELLES
CANAL
SONIA DELAUNAYGEORGES MELIES
PIERRE JEAN DE BERANGER
TURGOT MONTGOLFIER PIERRE MENDES FRANCE
GEORGES CLEMENCEAU
0 600 1 200 1 800 2 400 3 000300 meters
32

Figure 3: Spatial distribution of the quartiles of public middle school performanceas measured by the average Diplome National du Brevet exam score in 2004. Source:OCEAN national examinations database (2004).
0 1 000 2 000 3 000 4 000 5 000500 meters
AVERAGE DNB EXAM SCORE (2004)5.7 - 8.4 / 208.4 - 9.5 / 209.5 - 10.4 / 2010.4 - 13.2 / 20
Figure 4: Spatial distribution of the quartiles of average price per square meter (in2004 euros) within each public middle school catchment area in school year 2003-2004.
0 1 000 2 000 3 000 4 000 5 000500 meters
PRICE PER SQUARE METER IN 20042664 - 3532 euros3532 - 4063 euros4063 - 4700 euros4700 - 6564 euros
33

Figure 5: Map of local private middle school availability in Paris.
Notes: The index of private school proximity is constructed as follows: for each “reference” sale, we calculate the
inverse of its distance to the closest private middle school; we then split this indicator into four quartiles; sales in
the bottom quartile are far away from the closest private school while sales in the top quartile are in the vicinity of
the closest private school.
34

Table 1: Summary statistics. Public and private middle schools in Paris in 2003-2004. Sources: IPES dataset (2004) and OCEANnational examinations database (2004).
Variables All schools Public schools Private schools Public schoolsQuartiles of mean DNB exam score
Q1 Q2 Q3 Q4(1) (2) (3) (4) (5) (6) (7)
School sizeTotal enrolment 84,738 57,716 27,022 13,042 14,040 13,784 16,850Average enrolment 496 534 429 483 520 511 624
(193) (142) (245) (131) (113) (121) (163)Pupil-to-teacher ratio 14.5 12.1 13.6 14.6 17.6
(7.1) (3.5) (6.6) (5.3) (10.2)
Pupils’ characteristics% female 0.49 0.49 0.50 0.48 0.48 0.49 0.49
(0.10) (0.03) (0.17) (0.03) (0.03) (0.02) (0.03)% from privileged socio-economic backgrounds 0.41 0.31 0.58 0.11 0.24 0.35 0.55
(0.24) (0.20) (0.21) (0.07) (0.12) (0.14) (0.11)% foreign 0.13 0.18 0.04 0.27 0.20 0.15 0.10
(0.11) (0.10) (0.06) (0.11) (0.09) (0.07) (0.05)% grade repetition in first year 0.07 0.06 0.09 0.09 0.06 0.06 0.05
(0.09) (0.04) (0.14) (0.04) (0.04) (0.04) (0.03)% going into general curriculum 0.71 0.67 0.78 0.49 0.64 0.72 0.83
(0.17) (0.15) (0.18) (0.09) (0.08) (0.06) (0.09)Mean DNB exam score (out of 20) 9.99 9.40 10.99 7.28 8.94 10.01 11.38
(1.90) (1.62) (1.95) (0.83) (0.31) (0.30) (0.72)
Teachers’ characteristics% female 0.70 0.62 0.70 0.73 0.72
(0.08) (0.08) (0.08) (0.06) (0.07)% aged under 40 0.36 0.50 0.36 0.29 0.29
(0.12) (0.10) (0.10) (0.09) (0.08)% with high qualification 0.12 0.10 0.10 0.12 0.16
(0.06) (0.05) (0.05) (0.05) (0.08)% with intermediary qualification 0.70 0.69 0.70 0.70 0.69
(0.08) (0.08) (0.08) (0.09) (0.08)% with low qualification 0.18 0.21 0.20 0.18 0.15
(0.08) (0.08) (0.08) (0.08) (0.05)
Number of schools 171 108 63 27 27 27 27
Notes: The average 2004 Diplome national du Brevet (DNB) score at the school level is computed from the Organisation des Concours et Examens Academiques et Nationaux (OCEAN )
national examinations database. School size, pupils’ and teachers’ characteristics are computed from the Indicateurs pour le Pilotage des Etablissements Secondaires (IPES) dataset (2004).
Standard deviations are in parentheses.
35

Table 2: Summary statistics. Features of flats, census characteristics and averagepublic middle school performance for all sales located within 250, 300 and 350 metersof a school attendance boundary and sold in school years 1997 to 2003. Sources:BIEN dataset and 1999 National Census.
Distance to school boundary All sales < 250 m < 300 m < 350 mMean s.d. Mean s.d. Mean s.d. Mean s.d.
(1) (2) (3) (4) (5) (6) (7) (8)
Flat characteristicsPrice (in 2004 Euros) 183,041 (180,828) 181,916 (168,998) 183,518 (171,867) 184,804 (175,152)Flat size (in m2) 52 (35) 51 (34) 52 (34) 52 (35)Price per m2 (in 2004) 3,284 (1,287) 3,320 (1,242) 3,325 (1,255) 3,330 (1,263)Age of building (percent)
Unknown 0.11 0.11 0.11 0.11Before 1914 0.47 0.47 0.46 0.46After 1914 0.42 0.43 0.43 0.43
Number of rooms (percent)One 0.24 0.24 0.24 0.24Two 0.37 0.36 0.36 0.36Three 0.22 0.22 0.22 0.22Four 0.10 0.10 0.10 0.10Five or more 0.07 0.07 0.07 0.07
% with lift 0.90 0.90 0.90 0.90% with parking lot 0.13 0.12 0.12 0.12
Census characteristicsNb of census blocks 898 726 761 785Nb of individuals per census block 2,509 (681) 2,499 (659) 2,498 (664) 2,491 (665)Nb of households per census block 1,362 (370) 1,365 (362) 1,361 (364) 1,357 (366)Nb of persons per flat 1.82 (0.19) 1.81 (0.18) 1.82 (0.18) 1.82 (0.18)% families with children under 25 0.21 (0.06) 0.20 (0.05) 0.20 (0.05) 0.20 (0.05)% female-headed households 0.05 (0.02) 0.05 (0.02) 0.05 (0.02) 0.05 (0.02)% owners 0.33 (0.08) 0.33 (0.08) 0.33 (0.08) 0.33 (0.08)% public housing 0.09 (0.14) 0.09 (0.13) 0.09 (0.13) 0.09 (0.13)% with graduate degree 0.40 (0.08) 0.41 (0.08) 0.41 (0.08) 0.41 (0.08)% foreigners 0.23 (0.06) 0.22 (0.05) 0.22 (0.05) 0.22 (0.05)% unemployed 0.12 (0.04) 0.12 (0.04) 0.12 (0.03) 0.12 (0.04)Occupation:
% managers 0.23 (0.06) 0.24 (0.05) 0.24 (0.05) 0.23 (0.05)% self-employed workers 0.04 (0.01) 0.04 (0.01) 0.04 (0.01) 0.04 (0.01)% intermediary occupation 0.14 (0.04) 0.14 (0.04) 0.14 (0.04) 0.14 (0.04)% employees 0.14 (0.03) 0.14 (0.03) 0.14 (0.03) 0.14 (0.03)% manual workers 0.06 (0.04) 0.06 (0.03) 0.06 (0.03) 0.06 (0.03)% retired 0.18 (0.04) 0.18 (0.04) 0.18 (0.04) 0.18 (0.04)% economically inactive 0.21 (0.05) 0.21 (0.04) 0.21 (0.04) 0.21 (0.04)
Public school performanceAverage 2004 DNB exam score 9.59 (1.44) 9.73 (1.38) 9.73 (1.38) 9.73 (1.38)% entering gen. curric. high schools 0.67 (0.11) 0.68 (0.11) 0.68 (0.11) 0.68 (0.11)% from privileged socio-economic backgrounds 0.46 (0.19) 0.48 (0.18) 0.48 (0.18) 0.48 (0.18)Number of public schools 108 105 105 105
Number of sales 196,799 99,915 113,530 124,608
Notes: The sample of housing transactions comes from the BIEN dataset and is restricted to arm’s-length sales of second hand Parisian flats that took place between September 1997 and August
2004 and were not reassigned to different public middle school catchment areas. Flat prices are expressed in 2004 euros. Census characteristics are computed at the block level from the French 1999
National Census. Distance to school attendance boundaries is computed by combining the Lambert II geocoding of sales with the mapping of school catchment areas. The average school performance
indexes within each school are computed from the OCEAN national examination database (2004) and the SCOLARITE pupil database (1997-2004) (see appendix).
36
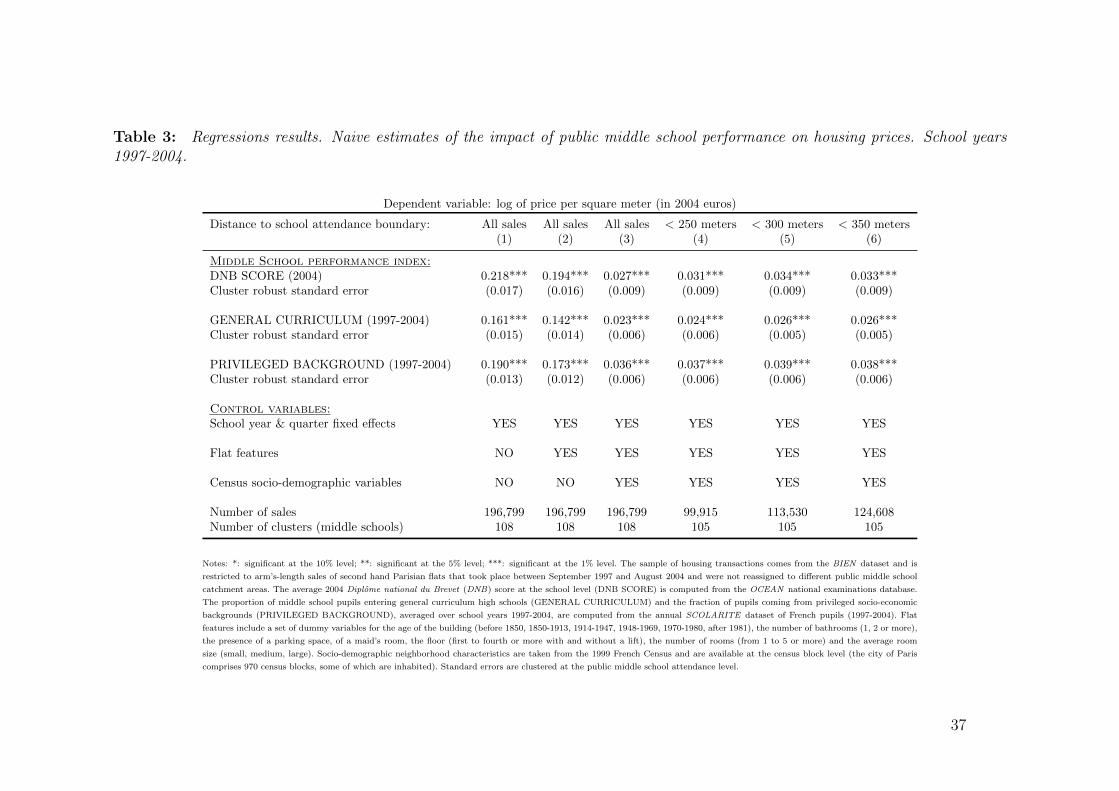
Table 3: Regressions results. Naive estimates of the impact of public middle school performance on housing prices. School years1997-2004.
Dependent variable: log of price per square meter (in 2004 euros)
Distance to school attendance boundary: All sales All sales All sales < 250 meters < 300 meters < 350 meters(1) (2) (3) (4) (5) (6)
Middle School performance index:DNB SCORE (2004) 0.218*** 0.194*** 0.027*** 0.031*** 0.034*** 0.033***Cluster robust standard error (0.017) (0.016) (0.009) (0.009) (0.009) (0.009)
GENERAL CURRICULUM (1997-2004) 0.161*** 0.142*** 0.023*** 0.024*** 0.026*** 0.026***Cluster robust standard error (0.015) (0.014) (0.006) (0.006) (0.005) (0.005)
PRIVILEGED BACKGROUND (1997-2004) 0.190*** 0.173*** 0.036*** 0.037*** 0.039*** 0.038***Cluster robust standard error (0.013) (0.012) (0.006) (0.006) (0.006) (0.006)
Control variables:School year & quarter fixed effects YES YES YES YES YES YES
Flat features NO YES YES YES YES YES
Census socio-demographic variables NO NO YES YES YES YES
Number of sales 196,799 196,799 196,799 99,915 113,530 124,608Number of clusters (middle schools) 108 108 108 105 105 105
Notes: *: significant at the 10% level; **: significant at the 5% level; ***: significant at the 1% level. The sample of housing transactions comes from the BIEN dataset and is
restricted to arm’s-length sales of second hand Parisian flats that took place between September 1997 and August 2004 and were not reassigned to different public middle school
catchment areas. The average 2004 Diplome national du Brevet (DNB) score at the school level (DNB SCORE) is computed from the OCEAN national examinations database.
The proportion of middle school pupils entering general curriculum high schools (GENERAL CURRICULUM) and the fraction of pupils coming from privileged socio-economic
backgrounds (PRIVILEGED BACKGROUND), averaged over school years 1997-2004, are computed from the annual SCOLARITE dataset of French pupils (1997-2004). Flat
features include a set of dummy variables for the age of the building (before 1850, 1850-1913, 1914-1947, 1948-1969, 1970-1980, after 1981), the number of bathrooms (1, 2 or more),
the presence of a parking space, of a maid’s room, the floor (first to fourth or more with and without a lift), the number of rooms (from 1 to 5 or more) and the average room
size (small, medium, large). Socio-demographic neighborhood characteristics are taken from the 1999 French Census and are available at the census block level (the city of Paris
comprises 970 census blocks, some of which are inhabited). Standard errors are clustered at the public middle school attendance level.
37

Table 4: Regression of cross-boundary housing price differentials on correspond-ing public middle school performance differentials. Sales are matched across publicmiddle school attendance boundaries. School years 1997-2004.
Dependent variable: Cross-boundary differential in the log of housing price (in 2004 euros)
Distance to school attendance boundary: < 250 meters < 300 meters < 350 meters(1) (2) (3)
Middle School performance index:∆ DNB SCORE (2004) 0.014** 0.014** 0.014**Cluster robust standard error (0.007) (0.007) (0.007)
∆ GENERAL CURRICULUM (1997-2004) 0.016*** 0.018*** 0.019***Cluster robust standard error (0.004) (0.004) (0.004)
∆ PRIVILEGED BACKGROUND (1997-2004) 0.021*** 0.023*** 0.024***Cluster robust standard error (0.008) (0.008) (0.007)
Average ∆ DNB SCORE 0.60 0.60 0.61(s.d.) (0.48) (0.48) (0.48)Average ∆ GENERAL CURRICULUM 0.86 0.86 0.86(s.d.) (0.64) (0.63) (0.63)Average ∆ PRIVILEGED BACKGROUND 0.72 0.72 0.72(s.d.) (0.56) (0.56) (0.56)
Average distance between matched sales (in meters) 155 182 207(s.d.) (54) (65) (75)
Number of sales 99,915 113,530 124,608Number of clusters (school attendance boundaries) 169 171 172
Notes: *: significant at the 10% level; **: significant at the 5% level; ***: significant at the 1% level. The sample of housing transactions comes
from the BIEN dataset and is restricted to arm’s-length sales of second hand Parisian flats that took place between September 1997 and August
2004 and were not reassigned to different public middle school catchment areas. To account for the fact that the price premium attached to specific
flat features may vary throughout the city of Paris, we compute regression-adjusted residuals obtained from specifications that include the full
vector of flat features (age of building, number of bathrooms, presence of a parking space, of a maid’s room, floor, number of rooms and average
room size), school year and quarter fixed effects, which are estimated separately for each of Paris’s 20 municipal arrondissements. The average
2004 Diplome national du Brevet (DNB) score at the school level (DNB SCORE) is computed from the OCEAN national examinations database.
The proportion of middle school pupils entering general curriculum high schools (GENERAL CURRICULUM) and the fraction of pupils coming
from privileged socio-economic backgrounds (PRIVILEGED BACKGROUND), averaged over school years 1997-2004, are computed from the
annual SCOLARITE dataset of French pupils (1997-2004). Details on the matching of sales across public middle school attendance boundaries
are given in section 2. The regressions are weighted by the inverse of the distance between each match’s components (i.e. the reference sale
and the constructed counterfactual sale). The average distance between matched sales is the average distance between the reference sale and its
constructed counterfactual. The geographic coordinates of the counterfactual are given by the average coordinates of the sales that are used to
construct it, weighted by the inverse of their distance to the reference sale. Standard errors are clustered at the public middle school attendance
boundary level.
38

Table 5: Comparison of flat features and census characteristics of neighborhoodslocated on the “good” and “bad” side of school attendance boundaries (in terms ofthe school’s average DNB exam score in 2004). School years 1997-2004.
Distance to boundary < 250 meters < 300 meters < 350 meters“Bad” side “Good” side “Bad” side “Good” side “Bad” side “Good” side
Flat characteristicsFlat size (in m2) 51 52 51 52 51 52(s.d.) (34) (34) (34) (34) (34) (35)Price per m2 (in 2004) 3,305 3,338 3,306 3,346 3,313 3,350(s.d.) (1,247) (1,236) (1,262) (1,246) (1,271) (1,253)Age of building (percent)
Unknown 0.11 0.11 0.11 0.11 0.11 0.11Before WWI 0.47 0.46 0.47 0.46 0.47 0.46After WWI 0.42 0.43 0.42 0.43 0.42 0.43
Number of rooms (percent)One 0.24 0.24 0.24 0.24 0.24 0.24Two 0.37 0.36 0.37 0.36 0.37 0.36Three 0.22 0.23 0.22 0.23 0.22 0.23Four 0.10 0.10 0.10 0.10 0.10 0.10Five or more 0.07 0.07 0.07 0.07 0.07 0.07
% with lift 0.90 0.90 0.90 0.90 0.90 0.90% with parking lot 0.12 0.12 0.12 0.13 0.12 0.13
Census characteristicsNb of census blocks 554 548 584 570 602 584Nb of individuals per census block 2,484 2,517 2,485 2,513 2,479 2,505Nb of households per census block 1,362 1,368 1,360 1,364 1,355 1,358Nb of persons per flat 1.81 1.82 1.81 1.83 1.81 1.83% families with children under 25 0.20 0.21 0.20 0.21 0.20 0.21% female-headed households 0.05 0.05 0.05 0.05 0.05 0.05% owners 0.33 0.33 0.33 0.33 0.33 0.33% public housing 0.09 0.08 0.09 0.09 0.09 0.09% with graduate degree 0.41 0.42 0.41 0.42 0.41 0.42% foreigners 0.22 0.22 0.22 0.22 0.22 0.22% unemployed 0.12 0.11 0.12 0.11 0.12 0.11Occupation:
% managers 0.23 0.24 0.23 0.24 0.23 0.24% self-employed workers 0.04 0.04 0.04 0.04 0.04 0.04% intermediary occupation 0.14 0.14 0.14 0.14 0.14 0.14% employees 0.14 0.15 0.14 0.15 0.14 0.14% manual workers 0.06 0.05 0.06 0.05 0.06 0.05% retired 0.18 0.18 0.18 0.18 0.18 0.18% economically inactive 0.20 0.21 0.21 0.21 0.21 0.21
Public school performanceAverage DNB exam score 9.22 10.31 9.23 10.30 9.23 10.31(s.d.) (1.20) (1.33) (1.21) (1.33) (1.21) (1.34)% entering general high schools 0.64 0.72 0.64 0.72 0.64 0.72(s.d.) (0.10) (0.11) (0.10) (0.11) (0.10) (0.11)% from privileged backgrounds 0.43 0.54 0.43 0.53 0.43 0.53(s.d.) (0.17) (0.18) (0.17) (0.18) (0.17) (0.18)
Number of sales 53,181 46,734 60,672 52,858 67,014 57,594
Notes: The sample of housing transactions comes from the BIEN dataset and is restricted to arm’s-length sales of second hand Parisian flats that took place between September
1997 and August 2004 and were not reassigned to different public middle school catchment areas. Flat prices are expressed in 2004 euros. Socio-demographic neighborhood
characteristics are taken from the 1999 French Census and are available at the census block level (the city of Paris comprises 970 census blocks, some of which are inhabited).
The average 2004 Diplome national du Brevet (DNB) score at the school level (DNB SCORE) is computed from the OCEAN national examinations database. The proportion
of middle school pupils entering general curriculum high schools (GENERAL CURRICULUM) and the fraction of pupils coming from privileged socio-economic backgrounds
(PRIVILEGED BACKGROUND), averaged over school years 1997-2004, are computed from the annual SCOLARITE dataset of French pupils (1997-2004). For each boundary
separating two public middle schools, the “bad” side corresponds to the school with the lowest average DNB exam score whereas the “good” side corresponds to the school with
the highest average DNB exam score.
39

Table 6: Regression of cross-boundary housing price differentials on correspondingpublic middle school performance differentials by quartile of proximity to the closestprivate middle school. Sales are matched across public middle school attendanceboundaries. School years 1997-2004.
Dependent variable: Cross-boundary differential in the log of housing price (in 2004 euros)
Quartiles of proximity to the closest private middle schoolAll sales Lower Middle Lower Middle Upper Upper
Quartile Quartile Quartile Quartile(1) (2) (3) (4) (5)
Panel A: Sales <250 meters of boundary
∆ DNB SCORE (2004) 0.014** 0.027* 0.017** 0.007 0.006Cluster robust standard error (0.007) (0.017) (0.007) (0.007) (0.012)
∆ GENERAL CURRICULUM (1997-2004) 0.016*** 0.025** 0.021*** 0.009** 0.008Cluster robust standard error (0.004) (0.010) (0.007) (0.004) (0.008)
∆ PRIVILEGED (1997-2004) 0.021*** 0.038** 0.025*** 0.010 0.006Cluster robust standard error (0.008) (0.018) (0.009) (0.006) (0.009)
Number of observations 99,915 24,977 24,978 24,976 24,984
Panel B: Sales <300 meters of boundary
∆ DNB SCORE (2004) 0.014** 0.026* 0.017** 0.005 0.010Cluster robust standard error (0.007) (0.016) (0.008) (0.007) (0.010)
∆ GENERAL CURRICULUM (1997-2004) 0.018*** 0.026** 0.024*** 0.010** 0.012*Cluster robust standard error (0.004) (0.011) (0.007) (0.004) (0.007)
∆ PRIVILEGED (1997-2004) 0.023*** 0.039** 0.029*** 0.010* 0.012Cluster robust standard error (0.008) (0.018) (0.009) (0.006) (0.008)
Number of observations 113,530 28,380 28,378 28,283 28,489
Panel C: Sales <350 meters of boundary
∆ DNB SCORE (2004) 0.014** 0.031** 0.019** 0.002 0.006Cluster robust standard error (0.007) (0.015) (0.008) (0.007) (0.010)
∆ GENERAL CURRICULUM (1997-2004) 0.019*** 0.028*** 0.025*** 0.009** 0.012*Cluster robust standard error (0.004) (0.010) (0.007) (0.004) (0.006)
∆ PRIVILEGED (1997-2004) 0.024*** 0.043** 0.029*** 0.010* 0.012*Cluster robust standard error (0.007) (0.018) (0.009) (0.006) (0.008)
Number of observations 124,608 31,152 31,149 31,155 31,152
Notes: *: significant at the 10% level; **: significant at the 5% level; ***: significant at the 1% level. The sample of housing transactions comes from the BIEN dataset and is
restricted to arm’s-length sales of second hand Parisian flats that took place between September 1997 and August 2004 and were not reassigned to different public middle school
catchment areas. The average 2004 Diplome national du Brevet (DNB) score at the school level (DNB SCORE) is computed from the OCEAN national examinations database.
The proportion of middle school pupils entering general curriculum high schools (GENERAL CURRICULUM) and the fraction of pupils coming from privileged socio-economic
backgrounds (PRIVILEGED BACKGROUND), averaged over school years 1997-2004, are computed from the annual SCOLARITE dataset of French pupils (1997-2004). The
index of private school proximity is constructed as follows: for each “reference” sale, we calculate the inverse of its distance to the closest private middle school; we then split this
indicator into four quartiles; sales in the bottom quartile are far away from the closest private school while sales in the top quartile are in the vicinity of the closest private school.
Details on the matching of sales across public middle school attendance boundaries are given in section 2. The regressions are weighted by the inverse of the distance between
each match’s components (i.e. the reference sale and the constructed counterfactual sale). Standard errors are clustered at the public middle school attendance boundary level.
40

CEE DP 119
When do Better Schools Raise Housing Prices?
Evidence from Paris Public and Private Schools
Gabrielle Fack
Julien Grenet
October 2010

Published by
Centre for the Economics of Education
London School of Economics
Houghton Street
London WC2A 2AE
© G. Fack and J. Grenet, submitted October 2010
All rights reserved. No part of this publication may be reproduced, stored in a retrieval
system or transmitted in any form or by any means without the prior permission in writing of
the publisher nor be issued to the public or circulated in any form other than that in which it
is published.
Requests for permission to reproduce any article or part of the Working Paper should be
sent to the editor at the above address.
The Centre for the Economics of Education is an independent multidisciplinary research
centre. All errors and omissions remain the authors.

CEE DP 119
When do Better Schools Raise Housing Prices? Evidence
from Paris Public and Private Schools
Gabrielle Fack
Julien Grenet
1. Introduction 1
2. Estimating the Impact of Public School Performance on
Housing Prices 3
3. Public and Private Middle Schooling in Paris 7 The French educational system 7
Public and private school admission rules 8
4. Data and Summary Statistics 9 Schools 10 Housing prices and neighbourhood characteristics 13
5. The Impact of Public Middle School Performance on
Housing Prices 14 Naïve estimates 14 Matching sales across school attendance boundaries 15 How large is the effect? 16 Robustness checks 17
6. The Mitigating Effect of Private Schools 18 Theoretical predictions of school choice models 18 Estimation strategy 20 Results 22 Robustness of findings to alternative interpretations 23
7. Conclusion 26
References 27
Appendix 30
Figures 32
Tables 35

Acknowledgments
Gabrielle Fack is an Assistant Professor at the Department of Economics and Business,
Universitat Pompeu Fabra and a Research Affiliate at CEPREMAP, Barcelona GSE, CEPR and
Cesifo. Julien Grenet is an ESRC Postdoctoral Fellow at the Centre for Economic
Performance, London School of Economics, a Research Affiliate at CEPREMAP and an
Associate of the Centre for the Economics of Education.

Table 7: Observable characteristics of the four quartiles of private school proximityfor sales located within 250 meters of a public middle school attendance boundary.School years 1997-2004.
Variables Quartiles of proximity to the closest private middle schoolLower Middle Lower Middle Upper Upper
Quartile Quartile Quartile Quartile
Flat featuresFlat size (in m2) 49 50 52 54(s.d.) (30) (33) (34) (37)Price per m2 (in 2004) 3,257 3,348 3,319 3,358(s.d.) (1,218) (1,242) (1,239) (1,265)Age of building (percent)
Unknown 0.11 0.11 0.10 0.12Before WWI 0.49 0.48 0.45 0.43After WWI 0.39 0.41 0.45 0.45
Number of rooms (percent)One 0.24 0.25 0.24 0.23Two 0.38 0.36 0.36 0.35Three 0.22 0.22 0.23 0.22Four 0.09 0.10 0.10 0.11Five or more 0.06 0.06 0.07 0.09
Census characteristics% families with children under 25 0.19 0.20 0.21 0.21% female-headed households 0.05 0.05 0.05 0.05% owners 0.33 0.33 0.33 0.35% public housing 0.08 0.09 0.10 0.07% with graduate degree 0.41 0.41 0.41 0.42% foreigners 0.23 0.22 0.22 0.22% unemployed 0.12 0.12 0.11 0.11Occupation:
% managers 0.23 0.24 0.24 0.24% self-employed workers 0.04 0.04 0.04 0.04% intermediary occupation 0.14 0.14 0.14 0.14% employees 0.15 0.15 0.14 0.14% manual workers 0.06 0.06 0.06 0.05% retired 0.17 0.17 0.18 0.18% economically inactive 0.20 0.20 0.21 0.21
Political views & Religious practice% voted right-wing in the 2002 parliamentary election 0.55 0.56 0.56 0.57(s.d.) (0.14) (0.13) (0.13) (0.14)Average number of places of worship within a 1 km radius 7.5 7.8 7.3 6.7(s.d.) (3.3) (3.3) (3.0) (2.6)
Public School PerformanceAverage 2004 DNB exam score 9.61 9.76 9.84 9.73(s.d.) (1.20) (1.46) (1.45) (1.37)% entering general curriculum high schools 0.67 0.68 0.69 0.68(s.d.) (0.10) (0.11) (0.12) (0.12)% from privileged backgrounds 0.46 0.49 0.50 0.48(s.d.) (0.17) (0.19) (0.19) (0.18)Public premium: Average cross-boundary DNB % premiumof the “good” over the “bad” public middle school 0.10 0.11 0.12 0.10(s.d.) (0.08) (0.08) (0.09) (0.08)
Closest Private School PerformanceAverage DNB exam score of the closest private school 11.07 11.10 10.85 11.00(s.d.) (1.70) (1.95) (2.29) (2.22)Private premium: Average DNB % premiumof the closest private school over local public schools 0.15 0.15 0.13 0.14(s.d.) (0.20) (0.23) (0.27) (0.27)
Number of sales 24,977 24,978 24,976 24,984
Notes: Census characteristics are taken from the 1999 French Census and are available at the census block level. Public middle school performance indexes are computed from
the 2004 OCEAN national examinations database and the annual SCOLARITE dataset of French pupils (1997-2004). The index of private school proximity is constructed as
follows: for each “reference” sale, we calculate the inverse of its distance to the closest private middle school; we then split this indicator into four quartiles; sales in the bottom
quartile are far away from the closest private school while sales in the top quartile are in the vicinity of the closest private school. The average DNB score of the local private
school is the score of the private school which is closest to the “reference” sale. For details on the computation of the DNB percentage premium of the closest private school over
local public schools, see section 6.4.
41


