WORKING PAPER SERIES FEDERAL RESERVE BANK o f ATLANTA When Target CEOs Contract with Acquirers: Evidence from Bank Mergers and Acquisitions Elijah Brewer III, William E. Jackson III, and Larry D. Wall Working Paper 2006-28 December 2006
Transcript
WORKING PAPER SERIESFED
ERAL
RES
ERVE
BAN
K of A
TLAN
TA
When Target CEOs Contract with Acquirers: Evidence from Bank Mergers and Acquisitions Elijah Brewer III, William E. Jackson III, and Larry D. Wall Working Paper 2006-28 December 2006
The authors thank Oscar Cerda, Lee Cohen, Nisreen Darwish, Mennatallah Eltaki, Syed Hussain, and Jeffrey Rasmussen for excellent research assistance. They also thank George Benston, Robert Brooks, Douglas Cook, Benton Gup, Gary Hoover, Javier Suarez, and seminar participants at the Center for Monetary and Financial Studies, the University of North Carolina Law School, the Culverhouse College of Commerce at the University of Alabama, and the Federal Reserve Banks of Atlanta and Chicago for helpful comments. The views expressed here are the authors’ and not necessarily those of the Federal Reserve Banks of Atlanta or Chicago or the Federal Reserve System. Any remaining errors are the authors’ responsibility.
Please address questions regarding content to Elijah Brewer III, Finance Department, Suite 6100, DePaul University, 1 East Jackson Blvd., Chicago, IL 60604-1413, 312-362-5151, and the Federal Reserve Bank of Chicago, 230 South LaSalle Street, Chicago, IL 60604-1413, [email protected]; William E. Jackson III, Research Department, Federal Reserve Bank of Atlanta, 1000 Peachtree Street, N.E., GA 303090-4470, 404-498-8937, [email protected]; or Larry D. Wall, Research Department, Federal Reserve Bank of Atlanta, 1000 Peachtree Street, N.E., Atlanta, GA 303090-4470, 404-498-8937, [email protected].
Federal Reserve Bank of Atlanta working papers, including revised versions, are available on the Atlanta Fed’s Web site at www.frbatlanta.org. Click “Publications” and then “Working Papers.” Use the WebScriber Service (at www.frbatlanta.org) to receive e-mail notifications about new papers.
FEDERAL RESERVE BANK of ATLANTA WORKING PAPER SERIES
When Target CEOs Contract with Acquirers: Evidence from Bank Mergers and Acquisitions Elijah Brewer III, William E. Jackson III, and Larry D. Wall Working Paper 2006-28 December 2006 Abstract: This paper investigates the impact of the target chief executive officer’s (CEO) postmerger position on the purchase premium and target shareholders’ abnormal returns around the announcement of the deal in a sample of bank mergers during the period 1990–2004. We find evidence that the target shareholders’ returns are negatively related to the postmerger position of their CEO. However, these lower returns are not matched by higher returns to the acquirer’s shareholders, suggesting little or no wealth transfers. Additionally, our evidence suggests that the target CEO becoming a senior officer of the combined firm does not boost the overall value of the merger transaction. JEL classification: G34, K22, J33 Key words: merger, acquisition, target CEO, corporate governance
When Target CEOs Contract with Acquirers: Evidence from Bank M&A
The importance of the post-merger status of the target chief executive officer (CEO) is
illustrated by reports of a humorous exchange between two CEOs discussing the possible merger
of their firms in 2003. The CEO of Bank One, Jamie Dimon, called the CEO of JPMorgan
Chase, William Harrison, with an offer to sell shortly after the Bank of America’s acquisition of
FleetBoston at a 41 percent purchase premium was announced.1 Mr. Dimon’s offer to Mr.
Harrison was: “Bill, at 40%, I'll drive your car.” Mr. Harrison responded that “At 15%, you
could be president.” In the end, JPMorgan Chase acquired Bank One at a 14.5 percent purchase
premium and Mr. Dimon became president of the combined firms with an understanding that he
would become CEO two years after the merger completion date.
Given that the contracting is voluntary, target CEOs that contract with the acquirer are
clearly benefiting from their post-merger deal. While it is unlikely that any CEO of a public
company would need to become a chauffer after the merger, target CEOs have a legitimate
concern about the loss of their firm-specific human capital as a result of their company being
acquired.
Similarly, acquiring firms benefit from voluntarily contracting with the target CEO. The
benefit may merely take the form of inducing the target CEO to acquiesce to the merger but it
could provide even greater value to the acquirer. As the exchange between Dimon and Harrison
suggests, the target CEO could obtain a post-merger position at the expense of agreeing to a
lower purchase premium. The contract could also boost the value of the combined firms. In the
JP Morgan Chase case, some analysts specifically pointed to JP Morgan’s acquisition of
Dimon’s talents as one of the benefits of the merger. Over the five-day period (two days before
to two days after the merger announcement date) surrounding the merger announcement date, the
2
cumulative abnormal returns were negative 1.26%, positive 12.69%, and positive 4.28% for
JPMorgan Chase, Bank One, and the combined firms, respectively.2
While the target’s CEO and the acquirer clearly benefit from the contracting, what impact
do these deals have on target shareholders returns? Conditional on a merger occurring, a lower
purchase premium obviously reduces their wealth. Alternatively, if target CEO contracting is
necessary for a takeover to occur then the contract might boost target shareholder wealth.
Finally, if the contracting increases the post-merger value of the combined firms, the contracts
should have a nonnegative impact on their wealth.
The focus of this study is on the impact of the target CEO’s post-merger position on the
purchase premium and target shareholder abnormal returns around the announcement of the deal
in a sample of bank mergers during the period 1990-2004. Was the above exchange between
Dimon and Harrison merely a humorous way to start a serious conversation? Or does it convey
an important insight as to the way that target and acquiring CEOs view the importance of the
target CEO’s post-merger position? In addition to examining the impact of contracting between
the target CEO and the acquirer, this paper also examines the announcement period returns of the
acquirer and the combined firms to look for evidence that the contracting boosts overall value of
the merger or results in wealth transfers to the acquirer’s shareholders or both.
The two studies most directly relevant for our study are Hartzell, Ofek and Yermack
(2004) and Wulf (2004). Hartzell, Ofek and Yermack (2004) ask the question, “what is the
benefit to the target CEO from consenting to the takeover?”3 Their study analyzes 311
transactions completed in the U.S. between January 1, 1995 and December 31, 1997. They find
that the target CEOs in their sample obtain a mean increase in wealth of $8 million to $11
million. While a large fraction of the target CEOs do not remain with the combined entity, the
3
target CEOs that become executives of the acquirer obtain smaller benefits. Those remaining
also experience unusually high turnover rates for several years. The results from Hartzell, Ofek
and Yermack (2004) provide marginally significant evidence that, in general, the gains to target
shareholders are reduced when the target CEO obtains additional benefits from the merger
(beyond those specified in his pre-merger employment contract with the target) but stronger
evidence that target shareholders lose when the target CEO has below median ownership interest
in the target.
Wulf (2004) focuses on the issue of whether target CEOs accept lower returns for target
shareholders in order to obtain power in the post-merger firm. In particular, she focuses on the
abnormal returns associated with “mergers of equals” (MOEs) in which the two firms have
approximately equal representation on the post-merger board over the period from January 1,
1991 to December 31, 1999. On average, the total gains as measured by abnormal returns are
insignificantly different for her MOE and control samples. However, the target shareholders
obtain a smaller proportion of these gains when governance is shared with the target and when
the target CEO obtains greater post-merger control rights (that is, when the target board of
directors has an equal or controlling interest on the post-merger board of directors of the
combined firms and the merger agreement stipulates that the target CEO will assume the CEO or
Chairman position in the combined firms within some specified period after the merger
completion date).
A possible limitation of these two studies that limits their ability to obtain stronger results
is their use of data across a variety of industries. The relationship between target returns and the
post-merger role of the CEO may be obscured by a variety of factors including: differences in
average purchase premiums across industries, differences in the roles that target CEOs might
4
reasonably expect to take with acquirers across industries (including cases where the target and
acquirer come from different industries) and cross-industry differences in governance structures.
This paper addresses the problems of the prior studies by focusing on a single industry,
insured depositories (hereafter, banks). The banking industry has several special features that
make it of special interest in evaluating the impact of target CEO contracting. First, it is one of
the few industries with sufficient intra-industry mergers to provide a reasonable sample size.
The relaxation of legal restrictions on bank mergers during the 1980s and 1990s, especially
restrictions on mergers across state borders, produced a wave of takeovers within the industry.4
Second, it is likely to be easier to detect in banking if target CEOs accept lower purchase
premiums in return for a role in the post-merger firm. Target CEOs’ ability to threaten to
obstruct a takeover is limited by the potential acquirer’s ability to go directly to the target
shareholders in a hostile takeover. However, hostile takeovers are rarely undertaken and almost
never successful in banking, in part because bank mergers are required to obtain prior approval
from bank regulators. Bank regulators are not necessarily opposed to hostile takeovers per se,
but the regulatory approval process may take months, especially when the merger involves larger
banks, which gives the target additional time to develop its defenses.
Third, if participation by the target CEO can boost the value of the combined firms this
may also be easier to detect in bank mergers. Banking is widely thought to be a “relationship”
business. If the target CEO can help in maintaining these relationships then his continued
presence after the merger should be recognized by investors as boosting the overall value of the
combined firms.
5
The remainder of this paper is organized as follows. In Section 1 we discuss our
empirical model. In Section 2 we describe our data. In Section 3 we present our main results.
The paper concludes with summary remarks in Section 4.
1. Empirical model
A takeover can result in gains to the shareholders of the two firms to the extent the value
of the target to the acquirer exceeds its value as an independent firm. The target’s incentive to
require a larger share of these gains depends in part on the CEO’s power in the corporate
governance structure and in part on the target CEO’s incentives to agree to the acquisition. The
CEO incentive to approve the deal arises both from factors outside and factors within the control
of the acquirer. This section discusses the empirical proxies for the value of target to the
acquirer, target governance structure, and target CEO incentives used in the analysis.
1.1 Shareholder returns
We proxy the return to the target shareholders using three different measures: (1) the
purchase premium at announcement over the target’s stock price 40 trading days before the
announcement, (2) the premium over the target’s stock price 20 trading days before the
announcement, and (3) the cumulative abnormal returns during the window from two days
before the announcement date to two days after the announcement date. We also measure the
returns to the acquirer and to the combination of the two firms with the cumulative abnormal
returns during the window from two days before the announcement date to two days after the
announcement date.
Our measure of the abnormal returns associated with the merger announcement follows
the event study based methodology used by Bradley, Desai, and Kim (1988). Specifically, we
calculate the cumulative abnormal returns (CARs) over the event window [-2, +2] for targets,
6
acquirers, and the portfolio of targets and acquirers around the merger announcement date for
our sample of firms. For each firm i, under the assumption of multivariate normality, the market
model is used to calculate abnormal return (ARi,t) for event day t as:
,ˆˆ ,,, tmiititi RRAR βα −−=
where Ri,t = return to firm i on day t; iα̂ , iβ̂ = market model parameter estimates, and Rm,t =
return to the value-weighted NYSE market portfolio on day t. The market model parameter
estimates for each firm are obtained using a maximum of 240 trading days of daily returns data
beginning 300 days before the first event. The cumulative abnormal return (CARi,t) from event
day T1 to event day T2 is computed as:
∑=
=2
1,2,1
T
TttiTT ARCAR
The z-statistic is used to determine whether the abnormal returns are statistically significant.
Daily and cumulative abnormal returns of the combined firms are computed using the procedure
in Houston and Ryngaert (1994).
1.2 Value of the Target to Acquirer
The premium paid by the acquirer for a target depends on the difference between the
value the acquirer places on control of the target versus the value the market places on owning a
non-controlling interest in the firm. The literature analyzing bank mergers uses a variety of
variables to control for the difference in the value. Most of the control variables used in the
analysis are drawn from previous studies of bank mergers such as Benston, Hunter, and Wall
(1995); Hadlock, Houston, and Ryngaert (1999); and Houston, James, and Ryngaert (2001).
The starting point for measuring the value of the target both as a stand-alone firm and in
an acquisition are its current profitability and variability of profitability. These are then
7
augmented with measures of the level and variability of the profitability of the acquirer as
proxies for potential changes in the level and variability of target’s profitability. Further, the
covariability of the acquirer’s and target’s earnings is included to proxy for the extent to which
the acquisition would increase or reduce the variability of the acquirer’s earnings. Five variables
representing the level, variance and covariance of the acquirers’ and targets’ return on assets are
included as proxies as in Benston, Hunter and Wall (1995). The targets’ and acquirers’ return on
assets over the 13 quarters prior to the merger announcement date are represented by ROAt and
ROAa, respectively. The variances of return on assets for the target and acquirer over the 13
quarters prior to the quarter of the merger announcement date are represented by VROAt and
VROAa, respectively. The covariance of the returns on their assets is represented by COVt,a.
Another important determinant of the value of the target is its likely growth rate after the
merger. A proxy for the expected growth in the target’s market is GTAt and a proxy for the
influence of the acquirer on the growth rate is GTAa. Both measures are calculated as the growth
in the respective firm’s total assets over the 13 quarters prior to the merger announcement.
The post-merger value of the combined firms also depends on the difficulty of merging
the firms and the potential for cost savings. The measure of the relative difficulty of absorbing
the target into the acquirer is given by the variable Rel_asset. Rel_asset measures the relative
size of the two banks’ total assets and increases in its value are generally associated with smaller
purchase premium to the target. Bank mergers are more likely to generate cost savings when the
two banks existing markets overlap. The extent of overlap is proxied by the variable Instate, a
binary variable that takes the value of one if the two banks are headquartered in the same state
and zero otherwise.
8
Finally, year fixed effects are added to the equation. Floegel, Gebken and Johanning
(2005) find evidence across industries that abnormal returns around the announcements of
mergers depends in part on whether the mergers are announced at the beginning or end of a
merger wave. The inclusion of annual fixed effects provides a control for any such merger wave
dynamics as well as controlling any other effects due to the timing of the announcements.
1.3 Target Governance
Whether higher shareholder control increases or decreases takeover premiums depends
on the strength of the firm’s takeover defenses and whether target CEOs negotiate for private
benefits with the acquirer according to Moeller (2005).5 If a firm’s takeover defenses are weak,
as he argues was true in the 1980s, then lower shareholder control increases premium. The
reason is that shareholders could overcome management opposition to the takeover if they
exerted sufficient effort but they must be incented to make such costly efforts by a high takeover
premium. The size of the premium required depended on the cost of overcoming management.
Greater shareholder control implied a lower cost of overcoming management, and hence a lower
premium. On the other hand, Moeller (2005) argues that if a firm has strong takeover controls
that allow the manager to block the transaction then acquirers must induce the CEO to approve
the deal by offering private benefits to the CEO. In this case, a strong board limits these private
benefits, with the result that the acquirer must pay more to complete the deal.
Given that the requirement for prior supervisory approval of bank mergers acts as a
merger defense and that most of the CEOs in our sample receive some benefit (as discussed in
section 3.1 below), Moeller’s analysis would suggest that lower shareholder control should be
associated with higher premiums for our sample.
9
Moeller includes both block shareholders and independent directors as measures of
shareholder control. Our measure for block shareholder effects is Blockholder, a binary variable
that is equal to one if there is not a large independent block shareholder (share ownership of at
least 5% by non-affiliated shareholders), and zero if such a blockholder exists.6 The impact of
independent directors is incorporated with the variable Indepdirectors, which is the percentage of
directors who are not current or past employees of the bank, do not have substantial business or
family ties with management (as indicated in the proxy statement), nor have business ties with
the bank.
1.4 CEO incentives outside the acquirer’s control
The target CEO’s personal reservation price for accepting a takeover depends on both his
perceived costs and benefits of losing his position. One cost to the CEO of losing his position is
the loss of his firm specific human capital. Our proxy for the potential loss in firm-specific
human capital is Years-To-Retire, where the potential loss is taken to be an increasing function of
the remaining years until the CEO reaches retirement age. As in Hartzell, Ofek and Yermack
(2004), we define Years-To-Retire as 65 minus the CEO’s age if the CEO is less than 65 or zero
if the CEO is 65 or older.
On the other hand, the CEO may benefit from a takeover to the extent that he was given a
change of control (or golden parachute) by the target prior to the takeover. The indicator
variable for a change of control provision, or golden parachutes, is HGolden.7
1.5 CEO incentives from the acquirer
The acquirer may incent the target’s CEO to support the merger in two ways: offer a
higher price which increases the value of the CEO’s ownership and contract with the CEO for a
position in the combined firms after the merger. To account for the managerial ownership effect,
10
we include the percent of the target’s shares owned by the CEO in our empirical specification as
CEO Shares.
The target CEO may obtain a variety of positions with the acquiring firm, albeit we did
not find any examples where the target CEO became a chauffer. After the merger, the target
CEO may obtain: (1) an operating position, (2) a position on the combined firm’s board of
directors, (3) a consulting position, and (4) no position at the combined firm. We further
subdivide the operating positions into three categories: (1) the CEO of the combined firms, (2)
the president or chief operating officer of the combined firms, or (3) another officer (typically the
CEO of a subsidiary of the combined firms). The positions on the combined firm’s board of
directors were divided into another three categories: (1) the chairman of the board of directors,
(2) the vice-chairman of the board, or (3) a director of the combined firms. Our binary variables
for the positions are labeled: CEO, President, Other Officer, Chairman, Vice-Chair, Director,
Consultant, and None. 8 Our coding only assigns a value of one to the highest position obtained
by the target CEO, the other positions take a value of zero. We rank operating positions as
higher than board positions and board positions as higher than consulting. Thus, if the target
CEO becomes CEO and chairman of the combined firm, only the variable CEO takes a value of
1. Similarly we only recognize the highest operating position so that if the target CEO becomes
CEO and president of the combined firm, only the variable CEO takes a value of 1.
2. Data
Our initial sample consists of the pair of target and acquirers identified from SNL’s
database covering the period 1990-2004. We match this sample of firms against a banking
organization mergers and acquisitions sample obtained from Securities Data Corporation (SDC)
database. The SDC data includes offer prices for targets, announcement dates, and other
11
characteristics of the deal. In several cases the announcement date reported in the SNL database
was different from that reported in the SDC database. Because the SDC database is most
commonly used, we base the announcement dates in our article on those reported in the SDC
database.9 Following Hartzell, Ofek and Yermack (2004) we then reduced the sample to only
those transactions where the market value of the target is at least 10 percent of the market value
of the acquirer.10 We also limit our sample to those targets whose total assets, as reported by
SNL, prior to the merger announcement date exceed $1 billion. While the former criteria
eliminates transactions that would unlikely have a material effect on the acquirer, the latter
criteria excludes transactions involving targets who book of business would unlikely be
substantial relative to other targets, avoiding extreme size disparities among targets that could
generate results that have little, if anything, to do with the focus of our study.11 We require that
both the target and acquirer be publicly traded and listed on the Center for Research in Securities
Prices (CRSP) database. We also eliminated transactions in which the target or acquirer was a
foreign banking organization. We are interested in the acquiring, the target, and a portfolio of
both firms after the deal is completed. For each of our merger transactions, we use Proxy
Statements, Form 10-K or a similar document to obtain share ownership, compensation, CEO
age, board composition, and golden parachute (GP) information of the targets before the
acquisition announcement date. We use Security Exchange Commission Form S-4 to obtain
post-merger employment contracts (the appendix provides a summary of the key elements in the
post-merger employment contracts between the target CEO and the acquiring firm for three of
the transactions in our sample). Imposing our selection criteria on the SNL-matched-SDC
samples resulted in a sample of 162 completed transactions covering the period 1990-2004.
12
Daily share prices for both target and acquirers are obtained from the CRSP file. The
stock market index employed in our event study is the value-weighted portfolio (NYSE and
AMEX) obtained from the CRSP database. Accounting data is obtained from the FR-Y9C
reports of income and condition filed by bank holding companies with the Federal Reserve and
the Thrift Financial Report reports filed by thrifts with the Office of Thrift Supervision.
3. Empirical Results
3.1 Descriptive Statistics
Table 1 provides descriptive statistics for our sample of 162 mergers. The median market
capitalization of the acquirer is $2.0 billion and that of the target is $0.5 billion. The median
ratio of target assets to the acquirer’s assets is 0.355. Acquirers reported higher return on asset
(ROA) and asset growth rates than the targets.12 Target shareholders received a mean purchase
premium of over 30 percent above the target’s stock price measured over both 20 and 40 trading
days prior to the announcement of the deal.
The CEO characteristics given in Table 2 show that median share ownership by the target
CEO prior to the merger is 1.03 percent. The median CEO is about 56 years old. Almost 70
percent of the target CEOs are also the chairman of their boards of directors but over 70 percent
of their boards consist of independent directors. Slightly less than one-half of the firms in the
sample had no independent blockholder.
Table 3 documents the ways in which the typical CEO in our sample gained from the
takeover. Over 95 percent of the CEOs had a change of control agreement with the target firm
and we could confirm that the CEO received this change of control in over one-half of the cases.
The golden parachute frequency in our paper is substantially higher than that found in other
13
studies (Cotter and Zenner, 1994; Subramaniam and Daley, 2000; and Lefanowicz, Robinson,
and Smith, 2000).
Panel B of Table 3 shows the personal benefits obtained by the CEO from the acquiring
firm. The top part of panel B gives the highest position obtained by the CEO in the combined
firms. The CEO obtained an operating position with the post-merger firm in over one-third of
the mergers, with little over 3 percent of the target CEO’s becoming CEO of the new firm. The
CEO did not have a relationship with the post-merger firm in about 17 percent of the mergers.
We could confirm that about 45 percent remained as officers at the time of the first proxy after
the merger and over 60 percent remained as directors. These figures contrast with substantially
higher attrition rates in the Hartzell, Ofek and Yermack (2004) where only 34 percent remained
as officers and only 43 percent remained as directors. The CEO also obtained a golden
parachute for a change in control of the post-merger firm in over 50 percent of our sample
transactions.
The abnormal returns around the merger announcement date are provided in Table 4.
The announcement period abnormal returns to target shareholders are a highly significant 13.44
percent over the event window [-2, +2]. Acquirer returns are a significantly negative 3.39
percent. However, a value weighted combination of the two firms produced positive and
significant abnormal returns of 0.50 percent.
3.2 CEO Contracting and Target Shareholder Returns
The impact of CEO contracting on target shareholder returns is analyzed in Table 5.
Most of the coefficients on the control variables are statistically insignificant. The only
coefficients on the return variables that are significant are the coefficients on the covariance of
the two firm’s return on assets, COVt,a in the purchase premium equations and the coefficient on
14
the variance of the acquirers’ return on assets, VROAa, in the target abnormal return equation.
The two coefficients on the covariance term are significantly negative at the 10 percent level or
better, while that on the variance term is positive and significant at the 5 percent level. The
covariance results are consistent with acquirers paying more for mergers that diversify the
combined firm’s risk. The coefficient on the variance term in the target abnormal return
equation suggests that there is a greater stock market reaction to those mergers in which the
acquirer is, on average, relatively more risky. The above two results are consistent with risky
acquirers being willing to pay more because they anticipate being able to integrate the target’s
franchise into their operations to diversify the combined firms book of assets.
All three of the coefficients on the CEO having a golden parachute, HGolden, are
negative and two are significantly negative at the 1 percent level. All three of the coefficients
on the binary variable indicating the absence of an independent blockholder, Blockholder, are
positive and highly significantly (better than 5 percent). These findings are inconsistent with
Moeller’s (2005) results.13 Instead, these results are consistent with target CEOs demanding
excessively high purchase premiums in the absence of outside blockholders that are able to force
acceptance of the takeover despite CEO opposition or the CEO receiving a golden parachute that
at least partially compensates him for the loss of his position.
The coefficients on the position obtained by the CEO in the post-merger firm is negative
for 18 of the 21 coefficients (3 measures of returns times 7 different positions), including 8 of 9
coefficients on the operating position variables, CEO, President, Other Officer. The three
coefficients on CEO, the target CEO becoming the CEO of the combined firms, and the three
coefficients on Other officer, the target CEO becoming a non-top executive officer of the
combined firms, are individually significant (at the 10 percent level or better). So is the
15
coefficient on Director for the equation estimating purchase price premium measured over 20
trading days. An F-test for the three operating positions rejects the hypothesis that the
coefficients on the three operating positions variables are equal to zero at the 10 percent level or
better in the two purchase price premium equations. The F-test for the three board positions
(Chairman, Vice-Chair, and Director) are all insignificant at conventional levels.
Thus, our analysis of the returns to target shareholders suggests that, conditional on a
takeover offer being made, that target shareholders receive a smaller premium when their CEO
obtains an operating position with the acquiring firm. Not only is this reduction in target
shareholder return statistically significant in most cases, the differences are also economically
large.14
3.3 Impact of Contracting On the Distribution and Amount of Gains
The acquirer may contract with the target CEO to transfer wealth or to boost the overall
value of the transaction or both. The evidence from target returns is that the contracting serves to
reduce the purchase premium obtained by target shareholders in completed takeovers. This
subsection analyzes acquirer returns to determine whether the contracting increases the overall
value of the deal and whether it results in significant gains to acquirer shareholders.
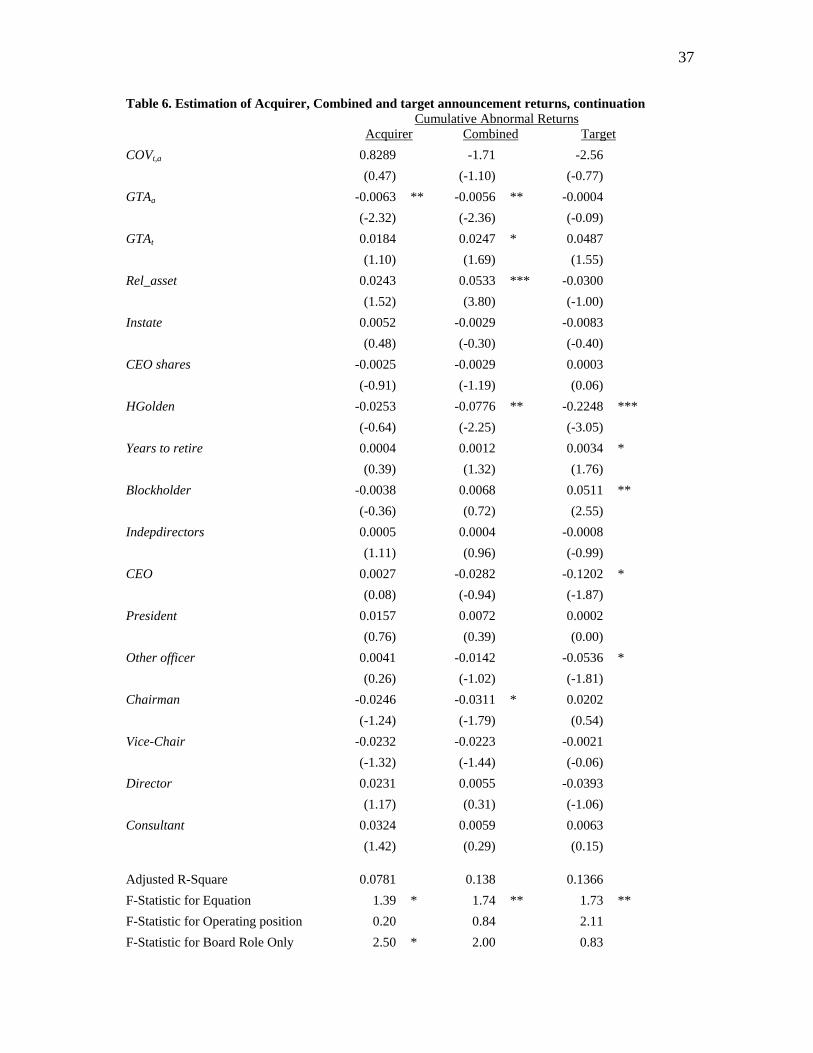
The analysis of the abnormal returns associated with the acquirer and combined firm are
presented in Table 6, as is a copy of the analysis of the abnormal returns for the target from
Table 5 for comparison purposes. None of the coefficients on the return variables are significant
in either the acquirer or combined abnormal returns. The acquirer’s abnormal returns and the
combined abnormal returns are significantly negatively related to the acquirer’s growth rate,
GTAa, while the premiums paid to targets are unaffected by how fast the acquirer is growing.
The significantly negative coefficient in the acquirers’ abnormal return equation is consistent
16
with faster growing acquirers either overpaying for targets or not being as efficient in post-
merger operations. The significantly negative coefficient in the combined returns equation
combined with the insignificance of the coefficient on the targets both suggest that the negative
acquirer’s returns are due to problems with post-merger operations and not with overpaying for
the target. The coefficient on the target’s growth rate, GTAt, is significantly positive. The
coefficient on the relative asset sizes of the two firms is significantly positive (at the 1 percent
level) in explaining the combined abnormal returns, suggesting that relatively larger targets
generally produce higher total wealth changes. This finding is not consistent with practitioner
discussions suggesting that relatively larger firms are more difficult to integrate.
None of the coefficients on the target governance variables are significant in the
equations for the acquirer’s and combined abnormal returns. This stands in contrast to the
consistently significantly positive coefficients on the blockholder variable in the target premiums
and abnormal returns equations. The lack of significance of the coefficient on the blockholder
variable in the acquirer’s equation is consistent with blockholders inducing targets to accept fair
offers from acquirers even if the offers do not meet the target CEO’s reservation price.
One of the coefficients on CEO incentives outside the acquirer’s control are significant at
the 10 percent level: the coefficient on the CEO having a golden parachute, HGolden, in the
combined returns equation is significantly negative. These results suggest that there are smaller
wealth effects for both target and acquirer shareholders in those transactions where the target
CEO had a golden parachute relative to those transactions where the CEO does not have a golden
parachute prior to the announcement date.
Only one of the coefficients on the post-merger position variables is significant, the
variable Chairman is significant at the 10 percent level in the combined abnormal returns
17
equation. The only significant F-test is that of the board roles in the acquirer’s return equation,
which is significant at the 10 percent level. One interpretation of these results is that acquirers
that offer target CEOs the positions of Chair or Vice-Chair tend to overpay in these acquisitions.
However, if this interpretation were correct the coefficients on Chairman and Vice-Chair in the
premium and target’s returns equation should be significantly positive but they are insignificant
and generally negative. Another interpretation is that acquirers that are willing to give the
position of board Chairman or Vice-Chair are sending an adverse signal about the extent to
which their board actually monitors their CEO.
Overall, the results from the estimation of the post-merger position variables in the
various premium and abnormal return equations is most consistent with the hypothesis that the
primary benefit of the target CEO receiving a post-merger position is that it offsets the incentives
he would otherwise have to oppose a takeover bid.
3.4 Robustness tests
In addition to our primary results, we performed a variety of robustness tests. We (1)
added a binary variable equal to one if the target CEO was also the chairman of the target’s
board, (2) added two binary variables to distinguish whether the target or the acquirer were
commercial banks (or bank holding companies) versus thrifts (or thrift holding companies, (3)
substituted the dollar amount of the target CEO’s share ownership for his percentage ownership,
and (4) included a binary variable equal to one if SNL coded the deal as a stock transaction.15
Finally we used the SNL announcement dates rather than the SDC announcement dates. The
difference in the two is that SNL dates correspond to the actual announcement whereas some of
the SDC dates reflect earlier strong rumors of a deal.
18
Although the details vary based on the exact specification, the overall results are
generally similar to those presented in Tables 5 and 6. Significantly, the most important results
are essentially unchanged, albeit some coefficients that are borderline significant in Tables 5 and
6 become borderline insignificant in some alternative specifications. The only consistently
significant variable on the target CEO’s post-merger role is for the target CEO becoming CEO of
the post-merger firm, CEO. The variable CEO is significantly negative for all three measures of
target shareholder returns, but insignificant for the acquirer’s announcement abnormal returns,
and the combined returns of the target and the acquirer. Further, the coefficients on the variables
for the target CEO also being chair of the target’s board, the binary variables for commercial
bank versus thrift status, the variable for the dollar value of shares and for a stock takeover are
consistently insignificant.
When we use SNL announcement dates rather than the SDC announcement dates, the
results are slightly weaker, although the direction of impact is similar. In particular, the variable
CEO is negative in all three of the target shareholders’ return equations, but only significant in
the two premium equations. All three of the coefficients on the binary variable indicating the
absence of an independent blockholder, Blockholder, are positive and statistically significant
(two of the coefficients at better than 1 percent and the third at the 10 percent level). As before,
none of the coefficients on the post-merger position variables are significant in either the
acquirer’s abnormal returns or the combined firms’ abnormal returns equations.
4. Conclusion
Mr. Dimon’s and Mr. Harrison’s joking about the tradeoff between the target CEO’s
post-merger position and the returns to the target shareholders in completed mergers appears to
have some basis in reality. We find evidence that target shareholders receive a lower rate of
19
return when their CEO takes a position with the acquirer, especially if that position is that of
CEO of the combined firms. The lower returns received by target shareholders could be due to
their CEO agreeing to sell the firm at a lowball price that transfers wealth to the acquirer’s
shareholders. Alternatively, the positions may merely compensating target CEOs for any loss of
firm specific human capital and control rents they would have received had the target remained
independent. In terms of the Mr. Dimon and Mr. Harrison story, is the 40 percent asked by Mr.
Dimon too high a price for JPMorgan Chase to offer? Or is the 15 percent offered by Mr.
Harrison a lowball offer that would take wealth from the target’s shareholders? Our evidence
from a sample of bank mergers suggests the problem is that the 40 percent asked by Mr. Dimon
is too high.
The most direct evidence on the question of too high an ask price or too low of a bid
comes from the insignificant impact of these positions on acquirer’s announcement returns. If
the target CEO obtaining a post-merger position were permitting acquirers to make lowball bids
then we should observe significantly positive announcement returns for the acquirer. However,
these returns are insignificant.
Two additional pieces of evidence are consistent with target CEOs sometimes demanding
excessive takeover premiums to compensate them for the loss of their human capital and control
rents. First, the target CEO’s support for a takeover may be less important if the target has a
blockholder, who has both the incentive to monitor the firm and, likely, an important say in the
firm’s governance. We find that banks that have a significant blockholder also have lower
takeover premiums and lower event returns. Second, another way to at least partially
compensate the CEO for the loss of his position is to give him a golden parachute. We find that
20
target shareholder abnormal returns are significantly lower if the target CEO has a golden
parachute.
Finally, it is possible that target CEOs were offered positions because they add value to
the overall deal. However, we find no evidence in support of this hypothesis. The only
significant coefficient on a CEO’s post-merger position is a negative coefficient on the CEO
becoming chairman of the combined organization.
21
APPENDIX – Description of three post-merger employment agreements
Target: Keystone Financial, Inc.
Acquirer: M&T Bank Corp
Announcement Date: May 17, 2000.
Target CEO: Carl L. Campbell
Source: M&T Bank Corp S-4 filed with SEC on Jun 30, 2000.
The term of Mr. Campbell's employment agreement begins on the effective date of the merger
and expires on the third anniversary of that date. Pursuant to Mr. Campbell's employment agreement, Mr.
Campbell will serve as Vice Chairman of M&T and as Chairman of M&T's Pennsylvania operations.
During the employment period, Mr. Campbell will serve as a member of M&T's board of directors.
Following the termination of this three-year period and until his 65th birthday, Mr. Campbell will
continue employment on a part-time basis on terms to be agreed to between him and M&T.
Under Mr. Campbell's employment agreement, for each year during the initial three-year
employment period, he will receive (1) an annual base salary no less than $460,000, and (2) an annual
cash bonus of no less than $168,505. During the part-time employment period, he will receive an annual
base salary of $400,000. If Mr. Campbell dies before his 65th birthday, 50% of the annual base salary he
would have otherwise received during the remainder of the part-time employment period will be paid to
his current spouse, if she survives him.
Upon completion of the merger, M&T will grant Mr. Campbell an option to acquire 50,000
shares of M&T's common stock (on a post-split basis) which will vest in three equal installments on each
of the first, second and third anniversaries of the completion of the merger (or, if earlier, upon the
occurrence of a change of control of M&T) and will have a term of ten years from the date of grant
22
without regard to Mr. Campbell's earlier termination of employment. Mr. Campbell will also receive upon
completion of the merger a lump sum payment of $1,250,000 (provided he is employed on such date).
Mr. Campbell's employment agreement provides for a lifetime annual retirement benefit of
$350,000, less any amounts payable under qualified and non-qualified defined benefit retirement plans,
commencing upon his 65th birthday. Upon the death of Mr. Campbell, his current spouse, if she survives
him, will receive an annual benefit for the rest of her life in an amount equal to 50% of this retirement
benefit. During the initial three-year employment period, Mr. Campbell will be entitled to participate in
all employee benefit, welfare and other plans, practices, policies and programs that apply generally to
senior executives of M&T on a basis no less favorable than that provided to those executives, except that
if Mr. Campbell's employment is terminated for any reason other than for cause by M&T, M&T will
continue to provide him and his current spouse with medical and dental benefits for the remainder of their
lives on a basis no less favorable than that on which those benefits were provided immediately before the
termination. The employment agreement contains confidentiality, non-competition and non-solicitation
provisions that apply while Mr. Campbell is employed and for specified periods thereafter.
In the event that Mr. Campbell's employment is terminated prior to the end of the initial three-
year employment period by M&T other than for "cause" or "disability" or by Mr. Campbell for "good
reason" (each as defined in Mr. Campbell's employment agreement), Mr. Campbell will be entitled to
receive the following payments and benefits:
- Annual base salary through the date of termination and a pro-rata annual bonus through the date of
termination (based on the minimum annual bonus under the employment agreement);
- A lump sum payment equal to the product of (1) the number of months and portions thereof from the
date of termination until the end of the initial three-year employment period, divided by 12, and (2) the
sum of Mr. Campbell's annual base salary and the minimum annual bonus;
- The retirement benefit described above, payable in accordance with the terms of the employment
agreement;
- A lump sum payment of $2 million; and
23
- The stock options granted to Mr. Campbell, as described above, will vest immediately.
Target: CoreStates Financial Corp
Acquirer: First Union Corp (FUNC)
Announcement Date: Nov. 18, 1997
Target CEO: Terrence A. Larsen
Source: First Union Corp S-4 filed with SEC on Jan. 1, 1998.
In connection with the execution of the Merger Agreement, FUNC entered into a five-year
Employment Agreement with Terrence A. Larsen, Chairman and Chief Executive Officer of CFC, which
will become effective as of the Effective Date. The Employment Agreement provides, among other
things, for Mr. Larsen to receive an annual salary of not less than $1,000,000 and a combined annual
salary and bonus of not less than $2,500,000. The Employment Agreement provides for an increase in Mr.
Larsen's base salary over his current base salary with CFC and may result in an increase in the amount of
his annual bonus. The Employment Agreement also provides that if Mr. Larsen's employment is
terminated by FUNC before expiration of the term of the Employment Agreement or if Mr. Larsen
voluntarily terminates his employment with FUNC at any time or if he dies, becomes disabled or retires
before expiration of the term of the Employment Agreement, he (or his estate, if he were to die) will
receive $2,500,000 per year until the expiration of the term of the Employment Agreement. Upon
expiration of the term of the Employment Agreement, Mr. Larsen (or his current spouse, if he is not then
living) is guaranteed an annual retirement income of $1,000,000 (which he may, under certain
circumstances, elect to receive as a lump sum), offset by certain retirement benefits under plans of
predecessor employers and social security benefits. Mr. Larsen will also receive 100,000 shares of
restricted FUNC Common Stock and options to purchase 200,000 shares of FUNC Common Stock upon
24
consummation of the Merger and in the calendar year following the calendar year in which such
consummation occurs. In addition, FUNC would provide a split-dollar life insurance policy with a total
death benefit of $20,000,000, $15,000,000 of which would be payable to Mr. Larsen's designated
beneficiary, and the remaining $5,000,000 of which would be payable to FUNC. The Employment
Agreement also provides for certain payments, notwithstanding termination of employment, and
associated gross-up payments for taxes. Mr. Larsen's Employment Agreement shall supersede his
termination of employment agreement with CFC upon consummation of the Merger. FUNC has agreed
that Mr. Larsen will be elected or appointed a director and a Vice Chairman of FUNC following the
Effective Date.
Target: OSB Financial Corp.
Acquirer: FCB Financial Corp
Announcement Date: Nov. 14, 1996
Target CEO: James J. Rothenbach
Source: FCB Financial Corp S-4 filed with SEC on Mar 12, 1997.
THIS EMPLOYMENT AGREEMENT (this "Agreement") is entered into this ____ day of
_____, 1997 between FCB Financial Corp., a Wisconsin corporation (the "Company"), Fox Cities Bank,
F.S.B., a federal savings bank which is wholly-owned by the Company (the "Bank") and James J.
Rothenbach (the "Executive").
The Bank hereby employs Executive for an initial period of three (3) years commencing on
_______, 1997 (the "Commencement Date") and terminating on ________, 2000 (the "Initial Termination
25
Date"), subject to earlier termination as provided in Article II hereof. The Board of Directors of the Bank
shall review and may extend the term of this Agreement for a period of one (1) additional year beginning
on the Initial Termination Date and in each subsequent year thereafter for a period of one (1) additional
year. Any extensions of the term of this Agreement shall be made by giving Executive written notice of
such extension at least 90 days prior to the Initial Termination Date or the expiration of any renewal
period. Reference herein to the term of this Agreement shall refer to both the initial term and such
extended terms.
The Bank agrees to compensate, and the Company agrees to cause the Bank to compensate, the
Executive for his services hereunder during the term of this Agreement by payment of a salary at the
annual rate of $150,000 in such monthly, semi-monthly or other payments as are from time to time
applicable to other executive officers of the Bank. The Executive's salary may be increased from time to
time during the term of this Agreement in the sole discretion of the Board of Directors of the Bank, but
Executive's salary shall not be reduced below the level then in effect. In addition, Executive shall be
entitled to participate in incentive compensation plans as may from time to time be established by the
Company or the Bank on an equivalent basis as other executive officers of the Company or the Bank (but
recognizing differences in responsibilities among executive officers).
If, at any time after the date hereof, a "Change in Control" (as hereinafter defined) occurs and
within eighteen (18) months thereafter Executive's appointment as President or as Chief Executive Officer
of the Company or his employment as President or as Chief Executive Officer of the Bank is involuntarily
terminated (other than for Just Cause pursuant to Section 2.4) then the Executive shall be entitled to the
benefits provided below.
The Company shall promptly pay, or cause the Bank to pay, to the Executive an amount equal to
the product of 2.00 times the Executive's "base amount" as defined in Section 280G(b)(3) of the Code
(such "base amount" to be derived from Executive's compensation paid by the Company and the Bank).
26
References
Almazan, A. and J. Suarez, 2003, “Entrenchment and Severance Pay in Optimal Governance Structures,” Journal of Finance, 58, 519-547. Barclay, M. J. and C. G. Holderness, 1991, “Negotiated Block Trades and Corporate Control,” Journal of Financial Economics, 46, 861-878. Benston, G. J., W. C. Hunter and L. D. Wall, 1995, “Motivations for Bank Mergers and Acquisitions: Enhancing the Deposit Insurance Put Options Versus Increasing Operating Net Cash Flow,” Journal of Money, Credit and Banking, 27, 777-788. Bliss, R. T. and R. J. Rosen, 2001, “CEO Compensation and Bank Mergers,” Journal of Financial Economics, 61, 107-138. Bradley, M., A. Desai and E. H. Kim, 1988, “Synergistic Gains from Corporate Acquisitions and The Division Between the Stock Holders of Target and Acquiring Firms,” Journal of Financial Economics, 21, 3-40. Brewer III, E., W. E. Jackson III and J. A. Jagtiani, 2000, “Impact of Independent Directors and the Regulatory Environment on Bank Merger Prices: Evidence from Takeover Activity in the 1990s,” Federal Reserve Bank of Chicago Working Paper 2000-31.
Brook, Y., R. Hendershott, and D. Lee, 1998, “The Gains from Takeover Deregulation: Evidence From the End of Interstate Banking Restrictions,” Journal of Finance, 53, 2185-2204.
Burkart, M.., Gromb, D. and Panunzi, F., 2005, 'Minority Blocks and Takeover Premia'. CEPR Discussion Paper no. 5240. London, Centre for Economic Policy Research. http://www.cepr.org/pubs/dps/DP5240.asp.
Chhaochharia, V., and Y. Grinstein, 2005, “Corporate Governance and Firm Value–the Impact of the 2002 Governance Rules,” working paper, Cornell University. Cotter, J., and M. Zenner, 1994, “How Managerial Wealth Affects the Tenders Offer Process,” Journal of Financial Economics, 35, 63-97. DeYoung, R., and W. C. Hunter, 2003, “Deregulation, the Internet, and the Competitive Viability of Large Banks and Community Banks,” In The Future of Banking, edited by Benton E. Gup, 173-201. Quorum Books. Floegel, V., T. Gebken, and L. Johanning, (2005) "The Dynamics within Merger Waves - Evidence from Industry Merger Waves of the 1990s," unpublished working paper European Business School, (January 22). Available at SSRN: http://ssrn.com/abstract=669525 Hadlock, C., J.l Houston, and M.l Ryngaert, 1999, “The Role of Managerial Incentives in Bank Acquisitions,” Journal of Banking and Finance, 23, 221-249.
Harris, E. G., 1990, “Antitakeover Measures, Golden Parachutes, and Target Firm Shareholder Welfare,” Rand Journal of Economics, Vol 21, 614-625.
27
Hartzel., J., E. Ofek and D. Yermack 2004, “What’s In It For Me? Personal Benefits Obtained by CEOs Whose Firms Are Acquired,” Review of Financial Studies, 17, 37-61. Houston, J. F. and M. D. Ryngaert, 1994, “The Overall Gains From Large Bank Mergers,” Journal of Banking and Finance, 18, 1155-1176. Houston, J. F., C. M. James and M. D. Ryngaert, 2001, “Where do Merger Gains Come From? Bank Mergers From the Perspective of Insiders and Outsiders,” Journal of Financial Economics, 60, 285-331. Jensen, M. C., 1988, “Takeovers: Their Causes and Consequences,” Journal of Economic Perspectives, 2, 21-48.
Lambert, R. A., and D. F. Larcker, 1985, “Golden Parachutes, Executive Decision-Making, and Shareholder Wealth,” Journal Of Accounting And Economics, 7: 179-203.
Lefanowicz, C. E., J. R. Robinson, & R. Smith, 2000, "Golden Parachutes and Managerial Incentives in Corporate Acquisitions: Evidence From the 1980s and 1990s," Journal of Corporate Finance, 6, 215-239. Moeller, T,, 2005, “Let's Make a Deal! How Shareholder Control Impacts Merger Payoffs,” Journal of Financial Economics, 76, 167-190. Moyer, L., 2004, “Harrison on Deal Talks, Succession, Technology,” American Banker, 169, January 20, p. 1, 2. Shleifer, A. and R. W. Vishny, 1986, “Large Shareholders and Corporate Control,” Journal of Political Economy, 94, 461-488.
Shmanske, S. and Nabeela K. , 1995, “Golden Parachutes, Information, and Shareholder Value,” Atlantic Economic Journal, 23 57-68.
Subramaniam C. and L. A. Daley, 2000, “Free Cash Flow, Golden Parachutes, and the Discipline of Takeover Activity,” Journal of Business Finance & Accounting, 27, 1-36.
Wulf, J., 2004, “Do CEOs in Mergers Trade Power for Premium? Evidence From ’Mergers of Equals.’” Journal of Law, Economics, and Organization 20, 60-101.
Yermack, D., 1996, “Higher Market Valuation of Companies with a Small Board of Directors,” Journal of Financial Economics, 40, 185-211.
28
Endnotes
1 This story comes from Moyer (2004) and is based on comments Mr. Dimon made to Bank One employees after the JPMorgan Chase/Bank One merger agreement was announced. 2 The Z-statistics testing the hypothesis that the cumulative abnormal returns are equal to zero are -0.57, 7.00, and 2.87, respectively.
3 A number of studies examine bank mergers from a variety of perspectives. Among the more recent studies are Benston, Hunter, and Wall (1995); Bliss and Rosen (2001); Brewer, Jackson, and Jagtiani (2000); Brook, Hendershott, and Lee (1998); Hadlock, Houston, and Ryngaert (1999); and Houston, James, and Ryngaert (2001). 4 Bank mergers and acquisitions, including those involving banks that are not publicly traded, averaged 345 per year over the 1980-1989 period and 510 per year over the 1990-1999 period according to Brewer, Jackson, and Jagtiani (2000). 5 An alternative hypothesis from Burkart, Gromb, and Panunzi (2005) is that the presence of a blockholder may lead to a higher bid. The primary limitation in applying their model to our sample is that their model deals with tender offers for at least 50 percent of the shares in the firm, thus, in their model the target’s CEO plays no important role in the takeover. In contrast, almost all bank takeovers are negotiated deals for 100 percent of the target’s shares. The negotiation process potentially provides the target CEO with an opportunity to influence the outcome of the negotiations in ways that increase his utility at the expense of the target’s shareholders. 6 Previous research finds that affiliated and independent block shareholders can have an impact on corporate control decisions. Affiliated block shareholders tend to acquiesce with management while independent shareholders may facilitate control changes (Shleifer and Vishny, 1986; Barclay and Holderness, 1991). 7 The role of golden parachutes in modifying target CEO’s incentives is discussed in Jensen (1988) and Lambert and Larcker (1985), Harris (1990), Shmanske and Kahn (1995), and Almazan and Suarez (2003). 8 Hartzell et al. combined the CEO, chair and vice-chair positions into a single variable. We split CEO out as a separate variable in part because a target CEO may view having the top position as more important. Moreover, in order for the target CEO to become CEO of the combined firm the acquiring CEO must take a different position. In return for giving up his position of power, the CEO of the acquiring firm may demand extra compensation for his shareholders in the form of a lower takeover return to target shareholders. Finally, if the combined value of the two firms is enhanced when the target CEO remains, this benefit may be largest when the target CEO remains as CEO of the combined firms. 9 As discussed below, we re-ran the empirical specification using the announcement dates from SNL, and the results were qualitatively similar to those using announcement dates from SDC. 10 The sample in Hartzell, Ofek, and Yermack (2004, p. 41) is limited to observations where the target lies in the range of 10% to 1000% of the acquirer to “rule out transactions where the target CEO would have little bargaining power.” Their cutoff of 1000% does not exclude any transactions in our sample. 11 We also use $1 billion in assets as the cutoff level because, in part, DeYoung and Hunter (2003) use it to separate large and mid-sized banking organizations from smaller community banks, and because Chhaochharia and Grinstein (2005) find that corporate governance rules enhance firm value more in larger firms than in smaller ones as these rules are both less costly and more beneficial in larger firms. 12 The maximum growth rate for the acquirer of 1991.3% reflects the rapid growth of a small acquirer, starting with under $50 million in assets. As explained below, in order to determine whether our results were being driven by
29
outliers we re-estimated the model dropping all acquisitions where the target or acquirer grew by more than 100% during the 13 month period prior to the takeover. We obtained similar qualitative results. 13 The definitions of both shareholder control variables, Indepdirectors and Blockholder, varies from those used by Moeller (2005) but our basic results hold with his definitions. Moeller uses a binary variable equal to 1 if inside directors constitute 40 percent or more of the target’s shareholders. Our coefficient on inside directors has the same sign but is statistically insignificant when premium is estimated over a 40 day period and for the abnormal return. Additionally, the coefficient on inside directors has the opposite sign when premium is measured over 20 days. Moeller uses a 10 percent cutoff rather than a 5 percent cutoff for blockholder control. We obtain the same sign but reduced significance levels when our model is estimated with a 10 percent cutoff for the Blockholder binary variable. We further tried to replicate Moeller’s results using our base model with his blockholder variable and without our variables for the CEO’s role (CEO, President, ...). The coefficient on the blockholder variable remains the same (the opposite of his sign) and it is statistically significant. Although we could not identify the source of the difference in our results, there are several potentially important differences in our samples. One is that Moeller (2005) uses a cross-industry sample of non-financial firms during the 1990s whereas we use a sample of banking firms drawn from the period 1990-2004. Another possible explanation for the differences in results is that Moeller (2005) requires the market value of the target to at least equal 5 percent of the acquirer’s whereas we use a 10 percent cutoff. In our preliminary data gathering efforts we found that the frequency of target CEOs receiving a post-merger position declined dramatically when the acquirer was less than 10 percent of the target, perhaps because the responsibility CEO of such a relatively small target would be more comparable to the acquirer’s regional managers than to the acquirer’s senior management or someone sitting on the acquirer’s board. 14 Indeed, the coefficients on CEO are larger in absolute value in the two purchase price premium equations than are the premiums. However, the differences are not statistically significantly different from zero. 15 Stock is the medium of exchange in a clear majority of the deals in our sample, perhaps because bank supervisors will not approve takeovers that result in the bank failing minimum capital standards. .
Table 1. Descriptive characteristics for 162 bank acquisitions announced during the period 1990-2004 Asset size is measured by the book value of assets for the quarter before the merger announcement. The market value of equity is measured twenty days before the merger announcement and equals the number of shares outstanding times the price per share of common stock. ROAa and ROAt are average quarterly return on assets for the acquirer and target, respectively. Average quarterly return on assets is computed as the mean of the ratio of net income divided by total assets for the thirteen quarters preceding the merger announcement quarter. GTAa is the growth rate of the acquirer’s total assets over the 13 quarters prior to the merger announcement. GTAt is the growth rate of the target’s total assets over the 13 quarters prior to the merger announcement. The asset growth rate is the arithmetic mean. PREM20 is the premium of purchase price at the time of the announcement over the target’s share price 20 days before the announcement. PREM40 is the premium of purchase price at the time of the announcement over the target’s share price 40 days before the announcement.
All Deals Characteristics Mean Median MaximumAcquirer total assets prior to offer (Million) $ 44,917 $ 13,828 $ 770,912 Target total assets prior to offer (Million) $ 19,402 $ 3,762 $ 326,563 Acquirer value prior to offer (Million) $ 7,200 $ 1,960 $ 117,790 Target value prior to offer (Million) $ 2,986 $ 507 $ 57,038 Target value/ Acquirer value 0.406 0.324 1.519Target assets / Acquirer assets 0.504 0.355 1.763ROA a 0.248% 0.268% 0.503%ROA t 0.212% 0.233% 0.543%GTAa 59.16% 8.33% 1991.30%GTAt 17.99% 3.42% 213.38%PREM20 0.312 0.287 1.249PREM40 0.352 0.311 1.355
31
Table 2. Characteristics of CEOs of 162 target companies used in the empirical analysis This table reports selected descriptive statistics about the ownership, compensation, and other characteristics of CEO of target companies. Information about the target CEOs and their firms is obtained from proxy statements filed during the year before the merger announcement date. The CEO is also chairman binary variable equals one if the CEO is also the chairman of the board of directors. Characteristics Mean Median Max Obs.CEO shares/shares outstanding (percent) 1.70% 1.03% 10.80% 162CEO total options/shares outstanding (percent) 1.14% 0.73% 4.68% 145CEO salary prior to acquisition $ 470,356 $ 400,000 $ 1,000,000 157CEO bonus prior to acquisition $ 432,354 $ 179,750 $ 4,910,075 154CEO age 55.93 56.5 74 162CEO tenure 19.794 19.600 45.000 146CEO is also chairman binary 0.741 1 1 162Independent directors 73.78% 77.098 93.75% 162No independent blockholders binary variable 0.488 1 1 162
32
Table 3. Selected gains received by target CEOs for the 162 transactions This table reports employment contracts and governance considerations obtained by the CEOs of target companies. Pre-merger employment contract are based on information from the target company’s last proxy statement filed prior to the announcement date. Post-merger employment contract are based on information from Form S-4 filed by the acquirer company around the merger announcement date. Information on the status of target CEOs who become officers and directors of the acquirer is obtained from Proxy statements filed with the SEC for the first year following the acquisition.
Panel A: Pre-merger employment contracts Variable Mean Median Max Obs.Parachute binary variable 0.981481 1 1 162Parachute $ 2,841,409 $ 1,680,550 $ 29,550,375 161Received parachute binary variable 0.555 1 1 155Parachute received $ 2,272,610 $ 1,524,000 $ 9,470,000 45
Panel B: Post-merger employment contracts Variable Mean Median Max Obs. Stayed 82.71% 0 1 162 Operating position 33.96% 0 1 162 a. CEO 3.09% 0 1 162 b. President 9.26% 0 1 162 c. Other Officer 21.61% 0 1 162 Board position 41.97% 0 1 162 a. Chairman 14.20% 0 1 162 b. Vice-Chair 14.81% 0 1 162 c. Director 12.96% 0 1 162 Consultant 6.79% 0 1 162 No relationship 17.28% 0 1 162 CEO remains as officer after next proxy 0.4654 0 1 159 CEO remains as director after next proxy 0.6038 1 1 159 Parachute binary variable 0.5312 1 1 160 Parachute $ 2,154,548 $ 655,431 $ 34,500,000 161
33
Table 4. Announcement period abnormal returns and combined valuation changes for 162 banking organizations’ acquisitions announced during the period 1990-2004 This table reports the cumulative abnormal returns (CARs) over the event window [-2, +2] for targets, acquirers, and portfolio of targets and acquirers around the merger announcement date over the period 1990-2004 for our sample of 162 large banking organizations transactions. We use standard event study methodology to compute abnormal return (ARi,t) for event day t. See Bradley, Desai, and Kim (1988) for a discussion of this methodology. Following Houston and Ryngaert (1994), we define portfolio abnormal return for each merger (i =1 to 162) as:
, ,, , ,
, , , ,
.i i
i i i
i i i i
T t A tP t T t A t
T t A t T t A t
MV MVAR xAR xAR
MV MV MV MV⎡ ⎤ ⎡ ⎤
= +⎢ ⎥ ⎢ ⎥+ +⎢ ⎥ ⎢ ⎥⎣ ⎦ ⎣ ⎦
where MVT,-20 is the market value of the target firm twenty days before the merger bid for the target, MVA,-
20 is the market value of the acquirer firm twenty days before the merger bid for the target. The variance of each merger i’s portfolio abnormal return is given below:
2 2
, ,
, , , ,
( ) ( ) ( )i i
i i i
i i i i
T t A tP T A
T t A t T t A t
MV MVVAR AR xVAR AR xVAR AR
MV MV MV MV⎡ ⎤ ⎡ ⎤
= +⎢ ⎥ ⎢ ⎥+ +⎢ ⎥ ⎢ ⎥⎣ ⎦ ⎣ ⎦
, ,,
, , , ,
2 ( / ) [ ( ) ( )],i i
i i i i
i i i i
T t A tA T A T A T
T t A t T t A t
MV MVx x x n n x VAR AR xVAR AR
MV MV MV MVρ
⎡ ⎤ ⎡ ⎤+ ⎢ ⎥ ⎢ ⎥
+ +⎢ ⎥ ⎢ ⎥⎣ ⎦ ⎣ ⎦
where ρA,T, is the estimated correlation coefficient between acquirer and target market model residuals obtained over the estimation period,
iAn is the number of days in the acquirer abnormal return window, and
iTn is the number of days in the target abnormal return window. The valuation change is computed by taking the abnormal return to the target multiplied by the target’s market value twenty days before the merger announcement date and adding to it the abnormal return to the acquirer multiplied by the acquirer’s market value twenty days before the merger announcement date.
Mean Median Min Max Obs. Valuation change (millions) -$15.7 $10.8 -$5,370.0 $5,302.7 162
Table 5. Estimation of Target Shareholder Returns The three proxies for target shareholder returns are PREM20 = the premium of purchase price at the time of the announcement over the target’s share price 20 days before the announcement, PREM40 = the premium of purchase price at the time of the announcement over the target’s share price 40 days before the announcement, and T_Car = the target’s five-day cumulative abnormal returns over the [-2, +2] window. The independent variables are: ROAt = mean return on assets of target over the 13 quarters prior to the quarter of the merger announcement date; ROAa = mean return on assets of acquirer over the 13 quarters prior to the quarter of the merger announcement date; VROAt = the variance of the return on assets of the target using 13 quarters of data ending with the quarter prior to the merger announcement; VROAa = the variance of the return on assets of the acquirer using 13 quarters of data ending with the quarter prior to the merger announcement; COVt,a = the covariance of the target’s and acquirer’s return on assets using 13 quarters of data ending with the quarter prior to the merger announcement; GTAa = the growth rate of the acquirer’s total assets over the 13 quarters prior to the merger announcement; GTAt = the growth rate of the target’s total assets over the 13 quarters prior to the merger announcement; Rel_asset = the target banking organization’s total assets divided by the sum of the target banking organization’s and the acquirer banking organization’s total assets; Instate = a binary variable that equals 1 if the target and acquirer are located in the same state, and 0 otherwise; Blockholder = binary variable for independent block ownership. It is equal to one if independent blocker ownership share is less than 5%, and zero otherwise; Indepdirectors = percent of board of directors that are not inside or grey directors; Years-To-Retire =65 minus the CEO’s age if the CEO is less than 65 or zero if the CEO is 65 or older; and HGolden = pre-merger change of control with target binary indicator variable that equals 1 if the target CEO has a change of control contract with the target firm, zero otherwise; CEO Share = target CEO’s percentage ownership of outstanding common shares; CEO = 1 if the CEO becomes CEO of the new firm ; President = 1 if the CEO becomes president of the new firm; Other officer = 1 if the CEO assumes some other officer position in the new firm (typically CEO of a subsidiary); Chairman = 1 if the CEO becomes chairman of the new firm; Vice-Chair= 1 if the CEO becomes Vice-chairman of the new firm; Director = 1 if the CEO becomes a director of the new firm; Consult = 1 if the CEO becomes a consultant to the new firm. The omitted variable for benefits from the new firm is None = binary variable that is equal to one if the target CEO does not obtain any position with the combined firm. Note, only the CEO’s highest position in the new company is recognized; for example a CEO that is also a president of the firm is coded as CEO=1, President=0. Numbers in parentheses below the coefficient estimates are t-statistics. Annual fixed effects are also included in the estimation but are not reported. The F-test for operating position tests the hypothesis that coefficients on CEO, President and Other Officer are zero. The F-test for board role only tests the hypothesis that coefficients on Chairman, Vice-Chair, and Director are zero. The t-statistics and F-statistics are starred if the regression coefficients are significantly different from zero at the 10 (*), 5(**), and 1 (***) percent level. Purchase Premium 20 Trading Days 40 Trading Days Abnormal Returns Intercept 0.8075 *** 0.8216 *** 0.3768 *** (3.23) (3.03) (2.92) ROAa -12.81 -15.92 10.67 (-0.58) (-0.66) (0.93) ROAt 10.80 1.52 9.27 (0.55) (0.07) (0.91) VROAa 5874.38 4551.82 5197.33 ** (1.43) (1.02) (2.46) VROAt 582.85 614.27 456.27 (0.38) (0.37) (0.58) COVt,a -14.58 ** -12.99 * -2.56 (-2.26) (-1.86) (-0.77)
35
Table 5. Estimation of Target Shareholder Returns, continuation
Table 6. Estimation of Acquirer, Combined and target announcement returns The three proxies for target shareholder returns are PREM20 = the premium of purchase price at the time of the announcement over the target’s share price 20 days before the announcement, PREM40 = the premium of purchase price at the time of the announcement over the target’s share price 40 days before the announcement, and T_Car = the target’s five-day cumulative abnormal returns over the [-2, +2] window. The independent variables are: ROAt = mean return on assets of target over the 13 quarters prior to the quarter of the merger announcement date; ROAa = mean return on assets of acquirer over the 13 quarters prior to the quarter of the merger announcement date; VROAt = the variance of the return on assets of the target using 13 quarters of data ending with the quarter prior to the merger announcement; VROAa = the variance of the return on assets of the acquirer using 13 quarters of data ending with the quarter prior to the merger announcement; COVt,a = the covariance of the target’s and acquirer’s return on assets using 13 quarters of data ending with the quarter prior to the merger announcement; GTAa = the growth rate of the acquirer’s total assets over the 13 quarters prior to the merger announcement; GTAt = the growth rate of the target’s total assets over the 13 quarters prior to the merger announcement; Rel_asset = the target banking organization’s total assets divided by the sum of the target banking organization’s and the acquirer banking organization’s total assets; Instate = a binary variable that equals 1 if the target and acquirer are located in the same state, and 0 otherwise; Blockholder = binary variable for independent block ownership. It is equal to one if independent blocker ownership share is less than 5%, and zero otherwise; Indepdirectors = percent of board of directors that are not inside or grey directors; Years-To-Retire =65 minus the CEO’s age if the CEO is less than 65 or zero if the CEO is 65 or older; and HGolden = pre-merger change of control with target binary indicator variable that equals 1 if the target CEO has a change of control contract with the target firm, zero otherwise;CEO Share = target CEO’s percentage ownership of outstanding common shares; CEO = 1 if the CEO becomes CEO of the new firm ; President = 1 if the CEO becomes president of the new firm; Other officer = 1 if the CEO assumes some other officer position in the new firm (typically CEO of a subsidiary); Chairman = 1 if the CEO becomes chairman of the new firm; Vice-Chair= 1 if the CEO becomes Vice-chairman of the new firm; Director = 1 if the CEO becomes a director of the new firm; Consult = 1 if the CEO becomes a consultant to the new firm. The omitted variable for benefits from the new firm is None = binary variable that is equal to one if the target CEO does not obtain any position with the combined firm. Note, only the CEO’s highest position in the new company is recognized; for example a CEO that is also a president of the firm is coded as CEO=1, President=0. Numbers in parentheses below the coefficient estimates are t-statistics. Annual fixed effects are also included in the estimation but are not reported. The F-test for operating position tests the hypothesis that coefficients on CEO, President and Other Officer are zero. The F-test for board role only tests the hypothesis that coefficients on Chairman, Vice-Chair, and Director are zero. The t-statistics and F-statistics are starred if the regression coefficients are significantly different from zero at the 10 (*), 5(**), and 1 (***) percent level. Cumulative Abnormal Returns Acquirer Combined Target Intercept -0.0905 -0.0098 0.3768 *** (-1.32) (-0.16) (2.92) ROAa 5.76 -0.8848 10.67 (0.95) (-0.17) (0.93) ROAt -3.08 5.01 9.27 (-0.57) (1.06) 0.91 () VROAa -1198.95 -33.07 5197.33 ** (-1.07) (-0.03) (2.46) VROAt 312.92 414.05 456.27 0.75 () (1.13) (0.58)
Adjusted R-Square 0.0781 0.138 0.1366 F-Statistic for Equation 1.39 * 1.74 ** 1.73 ** F-Statistic for Operating position 0.20 0.84 2.11 F-Statistic for Board Role Only 2.50 * 2.00 0.83