When vision is not an option: children’s integration of auditoryand haptic information is suboptimal
Karin Petrini,1 Alicia Remark,1 Louise Smith2 and Marko Nardini1
1. Institute of Ophthalmology, University College London, UK2. Department of Experimental Psychology, University of Oxford, UK
Abstract
When visual information is available, human adults, but not children, have been shown to reduce sensory uncertainty by taking aweighted average of sensory cues. In the absence of reliable visual information (e.g. extremely dark environment, visualdisorders), the use of other information is vital. Here we ask how humans combine haptic and auditory information fromchildhood. In the first experiment, adults and children aged 5 to 11 years judged the relative sizes of two objects in auditory,haptic, and non-conflicting bimodal conditions. In Experiment 2, different groups of adults and children were tested in non-conflicting and conflicting bimodal conditions. In Experiment 1, adults reduced sensory uncertainty by integrating the cuesoptimally, while children did not. In Experiment 2, adults and children used similar weighting strategies to solve audio–hapticconflict. These results suggest that, in the absence of visual information, optimal integration of cues for discrimination of objectsize develops late in childhood.
Research highlights
• Children and adults were tested on the ability tointegrate haptic and auditory information aboutobject size, without vision.
• Optimal integration of sensory estimates in theabsence of visual information occurs late.
• Adults and children use similar weighting strategiesto solve audio–haptic conflict.
• Pre-adolescents specifically lack the ability to reducethe variability of their responses through appropri-ately weighted averaging.
Introduction
It has been shown that adults can combine a visualsensory estimate with other sensory estimates (eithervisual or non-visual) to reduce sensory uncertainty whenjudging, for example, the size, shape or the position of anobject (e.g. Alais & Burr, 2004; Ernst & Banks, 2002;Hillis, Ernst, Banks & Landy, 2002). In these tasks,
human adults optimally combined their sensory esti-mates, reducing their variance in line with a Bayesianideal observer. Recent studies have demonstrated that, incontrast to human adults, children as old as 8–10 yearsare not yet able to optimally combine the kind of sensoryinformation listed above. For example, Gori, Del Viva,Sandini and Burr (2008) showed that children youngerthan 8–10 years did not optimally integrate visual andhaptic information to reduce uncertainty when discrim-inating object size or orientation. Instead, they gave toomuch weight to the sense which was less reliable for thetask. Similarly, Nardini, Jones, Bedford and Braddick(2008) showed that young children did not integratevisual and movement-related information during spatialnavigation. Children under 12 kept two visual cuesrelating to the angle of a surface separate (Nardini,Bedford & Mareschal, 2010), not reducing uncertaintyby combining them. This allowed them to avoid the‘sensory fusion’ experienced by adults with conflictingstimuli (Hillis et al., 2002). This developmental trend forlate maturation of integration mechanisms has also beenextended to audiovisual integration, which appears toremain immature until at least 10–11 years of age
Address for correspondence: Karin Petrini, UCL Institute of Ophthalmology, 11–43 Bath Street, London EC1V 9EL, UK; e-mail: [email protected]
The reason why optimal use of multisensory informa-tion to reduce the uncertainty of estimates develops solate is yet to be determined, but different possibilitieshave been suggested. One possibility is that duringchildhood, different sensory estimates need to be keptseparate so that the sensory system can be continuouslyrecalibrated (Gori, Sandini, Martinoli & Burr, 2010;Gori, Tinelli, Sandini, Cioni & Burr, 2012). In children,sensory calibration is more important than achievingmore precise estimates through integration. Dependingon the task, the sense that is used as the benchmark forrecalibration changes (Gori et al., 2008; Gori et al.,2010; Gori et al., 2012). Another possibility is thatduring development the sensory system may be opti-mized for speed over accuracy, and so might use thefastest available single estimate (Nardini et al., 2010).
Both possibilities share the common idea that, withage, the sensory system varies the importance of uncer-tainty reduction as compared with other goals. Unsur-prisingly, all of the developmental evidence so far hascome from studies in which one of the sensory informa-tion sources under study was vision, as for healthyhumans vision is a key component of most naturalistictasks. However, certain environments (e.g. an extremelydark surrounding) and visual disorders can reduce oreven eliminate the visual input. In these cases, the use ofother information, such as touch and sound, is vital.
Here we aimed to extend what we know about thedevelopment of uncertainty reduction by using a non-visual task. Studies examining the interaction betweenhaptic and auditory cues as well as neural substrates ofthis interaction in adults (e.g. Bresciani & Ernst, 2007;Kassuba, Menz, Roder & Siebner, 2012; Sanabria, Soto-Faraco & Spence, 2005; Soto-Faraco & Deco, 2009)point to a common mechanism for reducing sensoryuncertainty in the presence or absence of visual infor-mation. Because the interaction between haptic andauditory cues has not been examined in children, it is yetto be determined whether multisensory integration ofnon-visual information develops at a similar age as thatinvolving vision.
In the real world, the likelihood of a causal relationshipbetween haptic and auditory information is often higherthan, for example, that between visual and haptic oraudio and visual information. This is because haptic-auditory conjunctions (e.g. touching an object against asurface) tend to be produced by our own actions(Tajadura-Jimenez, Valjamae, Toshima, Kimura, Tsakiris& Kitagawa, 2012), while visual-auditory conjunctions
are often caused by external events. In a visual-hapticconjunction (e.g. looking at an object while touching anobject) the two sensory inputs are only related when thesame object is being looked at and touched, which neednot be the case. In a haptic-auditory situation like thepresent one, the participant’s own action causes thesound. Thus, at least in otherwise quiet environments,there is a very strong basis for linking the haptic andauditory information. It is therefore possible that thekind of auditory-haptic integration tested in the presentstudy would develop earlier than visual-haptic integra-tion as tested previously. Alternatively, audio-hapticintegration could show even later development thanvisual-haptic because vision is a very dominant sense inother audiovisual tasks (Nava & Pavani, 2013) during theearly school years tested in the present study. Both ofthese outcomes would imply separate and patchy matu-ration of multisensory mechanisms during childhood. Ifthe development of visual-haptic and audio-haptic inte-gration occurs at the same time, this would imply acommon and single multisensory mechanism in placefrom early childhood.
To test these possibilities we investigated the timecourse of haptic-auditory integration for size discrimi-nation in the absence of visual information. In Exper-iment 1 we measured haptic-auditory integration byassessing size discrimination in auditory, haptic and non-conflicting haptic-auditory conditions in one group of5–6-, 7–8-, 10–11-year-old children and adults. Thisallowed us to examine at what age sensory uncertaintywas reduced by integrating the cues optimally (i.e. aspredicted by the maximum likelihood estimation model).In Experiment 2 we further examined the development ofhaptic-auditory integration by examining size discrimi-nation in haptic-auditory conditions with three differentlevels of cue conflict in a second group of 5–6-, 7–8-, 10–11-year-old children and adults. This allowed us toexamine the relative weighting (reliance on) haptic andauditory information about size across ages.
Method
Auditory stimuli selection
Both changes in pitch (especially as a consequence ofchanges in fundamental frequency) and in amplitude andthus loudness are important for judgments of the size ofobjects striking a surface (Grassi, 2005). For this reason,before deciding on the best auditory stimuli to use in ourstudy we ran pilot experiments with adult participants.We ran two experiments, one with changes only in pitch,and one with changes only in amplitude/loudness.
Integration of auditory and haptic information 377
Participants judged which one of two wooden balls (astandard and a comparison ball) was bigger based eitheron touch, sound, or both (please refer to the Procedure,stimuli, and design section for details on task andloudness manipulation). For the pitch manipulation,the fundamental frequency (F0) of the middle-range ball(i.e. the standard ball with a F0 of 151 Hz) dropping ona wooden surface was increased or decreased by 15 Hzfor the other eight comparison stimuli, giving rise to ninesounds ranging in F0 from 211 to 91 Hz. Psychometricfunctions were fitted to the proportion of ‘bigger’responses given by each participant as a function ofcomparison stimulus size (please refer to the Resultssection for details on fitting and exclusion criteria).Strikingly, in the pitch experiment, 45% (5 of 11) ofadults were unable to use pitch differences reliably todiscriminate size. Their psychometric functions couldnot be fitted and they had to be excluded from analysis.By contrast in the amplitude experiment, 86% (12 of 14)used amplitude reliably.Their ability to base size judgments on amplitude is in
line with and supported by previous work in whichadults judged the size of balls hitting a resonating plate(Grassi, 2005). The plate’s oscillation increases with themass of the object hitting it. Consequently, for largerobjects the amplitude of the acoustic waveform is greater,and so is the loudness of the resulting sound. The resultsfrom the Grassi (2005) study show a strong correlationbetween amplitude domain indexes (power in particular)and the size of the ball. Indeed, the amplitude (power inparticular), which is directly related and proportionate toperceived loudness, was the strongest predictor ofparticipants’ judgments of ball size. Similarly, in ourstudy, the standard sound was recorded hitting aresonating surface (wooden table) after being droppedfrom a standard height (150 mm; Grassi, 2005). Forparticipants the task was set up as if they were producingsounds by patting the balls against a similar table. So it isnot surprising that pitch was not used as a reliable cue, asin this situation most of the sound is produced by thesurface (table top), which does not change in pitch withobject size. The poor ability of adults in our pilot studiesto use pitch convinced us that we should use amplitude,in order to make the task feasible for children when usingour set-up. It could also be possible, however, that theuse of pitch for size discrimination decreases with ageand that our pilot results for the pitch condition reflectadults’ decreased ability to use the pitch information.Although we cannot completely exclude this possibility,Grassi (2005) showed that when the size of the resonat-ing surface was changed (changing the pitch of the soundmade by the balls) adults did use pitch information whenjudging the sizes of balls. Furthermore, developmental
studies have shown that although both children andadults can use pitch information in several other kinds ofperceptual task (e.g. music perception and speakerrecognition; Demorest, 1992; Demorest & Serlin, 1997;Petrini & Tagliapietra, 2008), this ability improves withage (i.e. adults use the pitch information more thanchildren when, for example, discriminating betweenspeakers).We also chose to vary one stimulus dimension –
amplitude – to create the stimuli, rather than usenaturally recorded sounds of the different sized balls.The rationale for this was to be able to conclude whichcue all participants were using. If more than one cue isavailable, it is possible for developmental differences toreflect differences in strategy or attention to differentcues.
Procedure, stimuli, and design
Participants sat in a comfortable chair behind a blackcurtain that covered the experimental set-up and stimuli(Figure 1). All participants were then asked to slide thedominant hand (as assessed using the Oldfield Edin-burgh Handeness Inventory) through a hole in thecurtain and rest their arm on a semi-soft foam surface. Inthe middle of the rectangular foam surface was a square
(a) (b)
(c)
Figure 1 Experimental set-up. (a) Experimental set-up andtrial description. Participants sat behind a black curtain withtheir dominant hand inserted through the curtain andpositioned comfortably on a semi-soft foam surface. A speakerwas positioned as close as possible to the position at which thehand of the participant would pat either the wooden ball or apen on the surface underneath. A touchscreen was placed justbelow the foam and, when pressed, the sound was playedthrough the speaker. (b) An example of the auditory-onlycondition during which participants tapped a pen on the touchscreen twice to hear the sound made by each ball, beforejudging which sound was produced by the bigger ball. (c) Anexample of the haptic condition during which participantspatted a pair of wooden balls (one at the time) while wearing athick glove, before judging which ball was bigger.
hole, 5 cm deep, into which the stimuli were positionedone at a time. The stimuli consisted of nine wooden balls,differing in diameter by 2 mm (range 41–57 mm). Thesound of the standard ball (49 mm) hitting a woodsurface was recorded with a D7 LTD dynamic micro-phone through Focusrite Saffire PRO 40 sound cardusing the Psychtoolbox PsychPortAudio commandlibrary (Brainard, 1997; Pelli, 1997). We recorded thesound by dropping the ball from a standard height. If werecorded the sound by hitting the ball then the size of thehand at the recording time (for example that of theexperimenter) would influence the force of the impactand the resulting sound. The sound thus recorded wouldhave been more consistent with adults’ than children’sexpectations of what the resulting sound should be. Wewished to avoid this, especially when testing children ofdifferent ages and adults for whom hand size andstrength vary greatly. Loudness was increased ordecreased by 1 dB for the other eight stimuli (followingpiloting), giving rise to nine sounds ranging in amplitudefrom 71 to 79 dB.
During the experiment, balls were placed in the holeone at a time by the experimenter, and the participant’shand was placed on top of the ball. On each trial,participants were asked to touch two different woodenballs in sequence, keeping their hand flat (i.e. they didnot grasp the ball but only patted it). We askedparticipants to pat the ball rather than grasp it, becausesimilarly to the auditory case we wanted to vary onestimulus dimension – height. If participants could graspthe ball then they could use its weight as well, and, asfor the auditory cue, we would not know whetherdevelopmental differences would reflect differences instrategy or attention to different cues. Another very thin(1 cm) layer of soft foam was inserted between the thicklayer of foam and a touch screen positioned underneath(Figure 1) to eliminate any impact sound between thewooden balls and the hard surface of the touch screen.The ball’s sound was played through a speaker, posi-tioned as close as possible to the position of the ball(Figure 1b–c), when pressure was sensed on the touchscreen. Synchronization between the pressure elicited onthe touch screen and the played sound was achievedusing a Focusrite Saffire PRO 40 sound card inconjunction with the Psychtoolbox PsychPortAudiocommand library (Brainard, 1997; Pelli, 1997). Afterpatting the second ball participants reported which oneof the two stimuli was the bigger (the first or thesecond). The standard stimulus was always present inthe pair, but its position was unpredictably first orsecond, with equal numbers as first and second withineach experimental condition. A one-back randomiza-tion was used, i.e. random orders were generated until
an order in which no stimulus appears twice in a rowwas found and the experimenter followed the instruc-tions displayed on the computer screen to know whichpair of stimuli to present. The number of trials/repetitions, the exclusion criteria, method of fittingand number of subjects are like those previously used ina similar visual-haptic size discrimination task (Goriet al., 2008).
Experiment 1
Participants
A total of 34 children (eight 5- to 6-year-olds, 16 7- to8-year-olds, and ten 10- to 11-year-olds) and 12 adults(aged between 19 and 35) participated in the study. Thisnumber does not include children who were excludedfrom the study because they performed at chance level inone or more task conditions (see below). In bothexperiments the adults and the children’s parents orguardians gave informed consent for participation in thestudy, which received ethical approval from the researchethics board of University College London.
Procedure
Participants took part in one of two experimentalconditions each consisting of three different trial types,the order of which was counterbalanced across partic-ipants. Participants were assigned iteratively to eachexperimental condition in order to minimize samplingissues. In some conditions, to reduce the haptic reliabilitywe asked participants to wear thick skiing gloves whichvaried in size from extra-small to extra-large to fit as wellas possible children’s and adults’ hand sizes. Thepurpose of the gloves was to reduce participants’sensitivity during patting, thus decreasing the quality ofthe haptic information. A group of participants per-formed a condition including auditory-only, haptic-onlywithout glove, and bimodal without glove trials. Duringthe auditory-only condition participants tapped a pen onthe touch screen (Figure 1b) instead of the balls to elicitthe sounds. During this condition the experimenter tookback the pen from the participant after every first soundand gave it back before every second sound, matchingthe task and timing as closely as possible to the otherconditions. A second group performed a conditionincluding auditory-only, haptic-only with glove, bimodalwith glove trials. Each participant completed threeblocks of 54 trials (including each of the nine compar-isons six times) in each of three conditions, for a total of162 trials.
Integration of auditory and haptic information 379
Experiment 2
Participants
A total of 22 children (six 5- to 6-year-olds, ten 7- to8-year-olds, and six 10- to 11-year-olds) and six adults(aged between 19 and 35) participated in the study. Thisnumber does not include children who were excludedfrom the study because they performed at chance level inone or more task conditions.
Procedure
Participants performed a condition including a bimo-dal congruent condition without glove (the same as thebimodal condition without glove in the first group)and two bimodal incongruent conditions without glove.In these incongruent conditions the auditory andhaptic cues provided by the standard stimulus werein conflict, indicating different sizes, but averaging to49 mm similarly to the congruent bimodal standard
ball. In one bimodal incongruent condition the hapticsize of the standard stimulus was 49 + 4 mm and thatof the auditory standard stimulus 49�4 mm, in theother the haptic size was 49�4 mm and the auditory49 + 4 mm. The comparison stimuli were the same asin Experiment 1.
Results
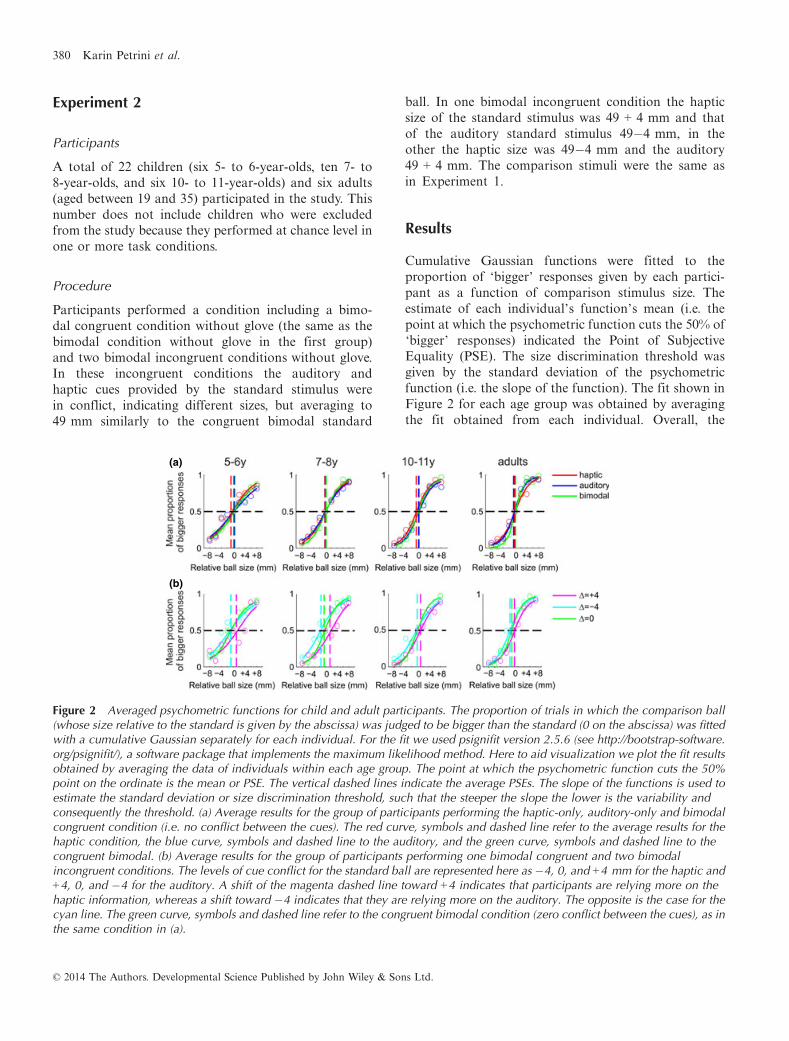
Cumulative Gaussian functions were fitted to theproportion of ‘bigger’ responses given by each partici-pant as a function of comparison stimulus size. Theestimate of each individual’s function’s mean (i.e. thepoint at which the psychometric function cuts the 50% of‘bigger’ responses) indicated the Point of SubjectiveEquality (PSE). The size discrimination threshold wasgiven by the standard deviation of the psychometricfunction (i.e. the slope of the function). The fit shown inFigure 2 for each age group was obtained by averagingthe fit obtained from each individual. Overall, the
(a)
(b)
Figure 2 Averaged psychometric functions for child and adult participants. The proportion of trials in which the comparison ball(whose size relative to the standard is given by the abscissa) was judged to be bigger than the standard (0 on the abscissa) was fittedwith a cumulative Gaussian separately for each individual. For the fit we used psignifit version 2.5.6 (see http://bootstrap-software.org/psignifit/), a software package that implements the maximum likelihood method. Here to aid visualization we plot the fit resultsobtained by averaging the data of individuals within each age group. The point at which the psychometric function cuts the 50%point on the ordinate is the mean or PSE. The vertical dashed lines indicate the average PSEs. The slope of the functions is used toestimate the standard deviation or size discrimination threshold, such that the steeper the slope the lower is the variability andconsequently the threshold. (a) Average results for the group of participants performing the haptic-only, auditory-only and bimodalcongruent condition (i.e. no conflict between the cues). The red curve, symbols and dashed line refer to the average results for thehaptic condition, the blue curve, symbols and dashed line to the auditory, and the green curve, symbols and dashed line to thecongruent bimodal. (b) Average results for the group of participants performing one bimodal congruent and two bimodalincongruent conditions. The levels of cue conflict for the standard ball are represented here as �4, 0, and +4 mm for the haptic and+4, 0, and �4 for the auditory. A shift of the magenta dashed line toward +4 indicates that participants are relying more on thehaptic information, whereas a shift toward �4 indicates that they are relying more on the auditory. The opposite is the case for thecyan line. The green curve, symbols and dashed line refer to the congruent bimodal condition (zero conflict between the cues), as inthe same condition in (a).
percentage of children excluded was 22% for 5–6-year-olds, 13% for 7–8-year-olds, and 15% for 10–11-year-olds, all of them due to an inability to do the haptic-onlytask when wearing the glove (i.e. they were not able todiscriminate the standard ball from the others and theirPSE or threshold fell outside the chosen range ofstimuli). No adults had to be excluded for this reason.
Experiment 1
We tested the goodness of fit for each participant andfound that the overall mean R2 in the bimodal congruentcondition was 0.87 SE � 0.02, for the haptic conditionwas 0.81 SE � 0.02, and for the auditory condition was0.84 SE � 0.01, indicating that the chosen Gaussianpsychometric function fitted the data well. We carriedout a mixed factorial ANOVA with stimulus condition(auditory-only, haptic-only and bimodal congruent) aswithin-subjects factor and age group as between factoron the R2 values. We found no significant interactionbetween age and condition (F(6, 82) = 0.923, p = .483),but a main effect of age (F(3, 41) = 3.545, p = .023). T-tests, Bonferroni corrected, post-hoc analyses showedthat only the younger group of children differed signif-icantly in their R2 compared to adults (p = .017).Nevertheless, the mean R2 of the 5–6-year-old childrenfor the bimodal congruent condition was 0.75 SE �0.06, i.e. the method of fitting still explained the youngchildren’s data well.
Before using parametric procedures to test differencesin the thresholds obtained we tested whether the datacould be approximated to a normal distribution. For thispurpose we performed Kolmogorov–Smirnov tests ofnormality separately for each age group and experimentalcondition. We found that in 10 out of 12 cases the datawere normally distributed (i.e. the tests of normality gavenon-significant results), and in the two remaining cases(i.e. the adults’ data in the auditory condition and the 10–11-year-old children’s data in the bimodal condition) thedata approximated normality (p = .03, p = .021). Over-all, the thresholds obtained approximated well a normaldistribution, thus allowing us to perform parametricanalyses as previously done in similar studies (e.g. Goriet al., 2008; Gori et al., 2010; Nardini et al., 2008).
An initial mixed-model ANOVA with noise level asbetween-subjects factor (no glove, glove) and stimulustype as within-subjects factor (auditory-only, haptic-onlyand bimodal) was carried out within each age group toexamine the effect of noise on the size discriminationthresholds. This analysis revealed no main effect of noiselevel (5–6y: F(1, 6) = 0.104, p = .758; 7–8y: F(1, 14) =1.530, p = .236; 10–11y: F(1, 8) = 2.757, p = .135; adults:F(1, 10) = 2.580, p = .139), and no interaction between
noise level and stimulus type (5–6y: F(3, 18) = 0.544,p = .658; 7–8y: F(3, 42) = 0.582, p = .63; 10–11y: F(3, 24)= 2.104, p = .126; adults: F(3, 30) = 0.196, p = .898).Based on this initial analysis we combined the data forthe two noise level groups within each age group beforefurther analysis.
To examine the effect of age on the size discriminationthreshold for the different conditions, we carried out amixed model factorial ANOVA with age as a between-subjects factor and condition as within-subjects factor.This analysis revealed a significant main effect of age(F(3, 42) = 11.868, p < .001), a main effect of condition(F(3, 126) = 13.477, p < .001), and a significant interac-tion between age and condition (F(9, 126) = 1.911,p = .048). T-tests, Bonferroni corrected, post-hoc analy-ses showed that overall adults had significantly lowerthresholds than 5–6-year-old (p < .001), 7–8-year-old(p < .001), and 10–11-year-old children (p = .017). Theolder group of children had significantly lower thresh-olds compared to the 5–6-year-old children (p = .016),but not compared to the 7–8-year-old children(p = .476). Finally, 5–6- and 7–8-year-old children didnot differ in their estimated thresholds (p = 1). Figure 3
Figure 3 Mean size discrimination thresholds as a function ofage. Mean discrimination thresholds for haptic (red line andsymbols), auditory (blue line and symbols), and bimodalcongruent (green line and symbols) conditions as a function ofage. The black line and symbols represent the average MLEmodel predictions for the bimodal condition as a function ofage. The predicted bimodal threshold (rHA) was calculatedindividually for each subject, and then averaged, by enteringthe individual haptic (rH) and auditory (rA) thresholds into theequation r2HA ¼ r2Hr
Integration of auditory and haptic information 381
summarizes these results and clearly shows that althoughdiscrimination thresholds decrease with age in all con-ditions, the bimodal discrimination thresholds were onlywell predicted by the optimal (ideal observer) estimatefor adults. The optimal estimate was calculated byentering the unimodal discrimination thresholds intothe maximum likelihood (MLE) model.This observation was further supported by a series of
planned one-tailed t-tests showing that the bimodalthreshold for adults was significantly lower than both thehaptic (t(11) = �3.279, p = .007) and the auditorythreshold (t(11) = �1.428, p = .05), and did not differfrom the predicted optimal bimodal threshold (t(11)= �0.134, p = .44). This was not, however, the case forthe children. The 10- to 11-year-old group’s bimodalthreshold was significantly higher than that predicted byMLE (t(9) = 2.249, p = .02), and was no different fromeither the haptic (t(9) = �0.422, p = .34) or the auditory
threshold (t(9) = �0.400, p = .34). The 7- to 8-year-oldgroup’s bimodal threshold, similarly to the older chil-dren, was higher than that predicted by MLE (t(15)= 2.389, p = .01), and was no different from the haptic(t(15) = �0.958, p = .17), but was significantly lowerthan the auditory (t(15) = �2.262, p = .01). Finally, the5- to 6-year-old group’s bimodal threshold was signifi-cantly higher than that predicted by MLE (t(7) = 2.247,p = .02), but was no different from either the haptic(t(7) = 0.866, p = .20) or the auditory threshold (t(7)= �0.678, p = .26).Figure 4a shows how the relationship between optimal
predicted and measured bimodal discrimination thresh-old changes with age. It also shows how the distributionof individual performance becomes more consistent (lessvariable) with age, with a higher number of individualsperforming as an ideal observer. Figure 4b plots therelationship between ratios of single-cue variances (A/H)
(a)
(b)
Figure 4 Measured bimodal thresholds against MLE-predicted bimodal thresholds for individuals in each age group. (a) The bluesymbols represent the individual data and the black dots indicate the group average thresholds. The observed thresholds come closerto the MLE prediction with age, as indicated by the black dot approaching the solid black line. (b) Ratios of single-cue variances(A/H) and combined-to-single-cue variances (AH/H) for individuals in each age group. Individual and group average performance isplotted together with predictions based on use of the single worst cue (red line), the single best cue (green line), or integration of cuesaccording to the Bayesian model (black line). High ratios along the x-axis correspond to much more reliable touch than sound. Lowratios (<1) along the y-axis corresponds to an improvement given both cues compared to touch alone. To aid visualization individualdata out of the represented x and y range are not shown.
and combined- to single-cue variances (AH/H) at eachage. The three lines indicate the predictions of differentcue combination rules: relying on the worst single cue(red line), the best single cue (green line), or using theBayesian model (black curve). Ratios greater than 1along the abscissa indicate that participants’ hapticinformation had greater variability than auditory. Themagenta star represents group average performance andshows that with age it goes from being between the worstand best single cue, to being close to best single cue, tobeing better than best single cue, as predicted byintegration. The individual data, however, show thatthere was a great deal of variability in individualchildren’s performance at the youngest two ages.
Experiment 2
As with Experiment 1, we tested the goodness of fit foreach participant and found that the overall mean R2 forthe bimodal congruent condition was 0.87 � 0.02, for the+4D bimodal incongruent was 0.78 � 0.02, and for the�4D bimodal incongruent was 0.78 � 0.03, indicatingthat the chosenGaussian psychometric function fitted thedata well. We carried out a mixed factorial ANOVAwithstimulus condition (bimodal congruent and two bimodalincongruent conditions) as within-subjects factor and agegroup as between-subjects factor on the R2 values. Wefound no significant interaction between age andcondition (F(6, 48) = 0.743, p = .617), but a main effectof age (F(3, 24)= 6.954, p = .002), similar to the findings ofExperiment 1. T-tests, Bonferroni corrected, post-hocanalyses showed that only the younger group of childrendiffered significantly in their R2 compared to adults(p = .002). Nevertheless, the mean R2 of the 5–6-year-oldchildren for the bimodal congruent condition was 0.76 SE� 0.08, i.e. the method of fitting explained the youngchildren’s data well.
Before using parametric procedures to test differencesin obtained thresholds, we tested whether the data couldbe approximated by a normal distribution. We per-formed Kolmogorov–Smirnov tests of normality sepa-rately for each age group within each experimentalcondition. We found that in 11 out of 12 cases the datawere normally distributed (i.e. the tests of normality gavenon-significant results), and in the remaining case (i.e.the 5–6-year-old children’s data in the bimodal congru-ent condition) the data approximated normality(p = .043).
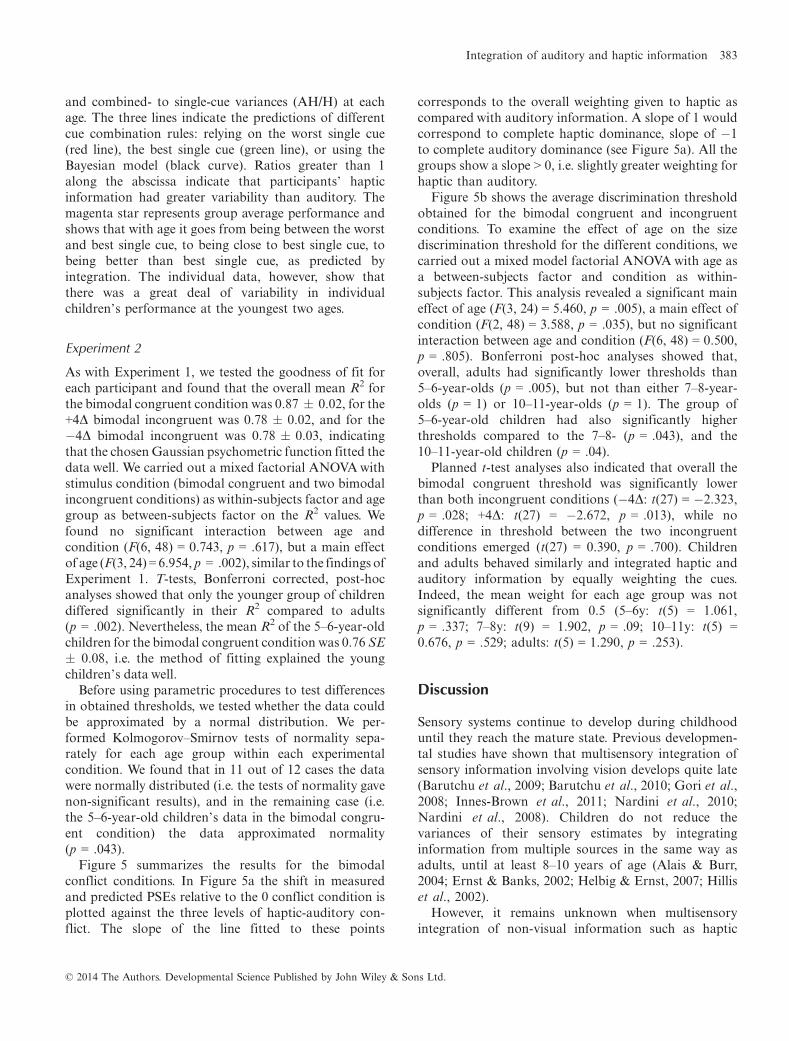
Figure 5 summarizes the results for the bimodalconflict conditions. In Figure 5a the shift in measuredand predicted PSEs relative to the 0 conflict condition isplotted against the three levels of haptic-auditory con-flict. The slope of the line fitted to these points
corresponds to the overall weighting given to haptic ascompared with auditory information. A slope of 1 wouldcorrespond to complete haptic dominance, slope of �1to complete auditory dominance (see Figure 5a). All thegroups show a slope > 0, i.e. slightly greater weighting forhaptic than auditory.
Figure 5b shows the average discrimination thresholdobtained for the bimodal congruent and incongruentconditions. To examine the effect of age on the sizediscrimination threshold for the different conditions, wecarried out a mixed model factorial ANOVAwith age asa between-subjects factor and condition as within-subjects factor. This analysis revealed a significant maineffect of age (F(3, 24) = 5.460, p = .005), a main effect ofcondition (F(2, 48) = 3.588, p = .035), but no significantinteraction between age and condition (F(6, 48) = 0.500,p = .805). Bonferroni post-hoc analyses showed that,overall, adults had significantly lower thresholds than5–6-year-olds (p = .005), but not than either 7–8-year-olds (p = 1) or 10–11-year-olds (p = 1). The group of5–6-year-old children had also significantly higherthresholds compared to the 7–8- (p = .043), and the10–11-year-old children (p = .04).
Planned t-test analyses also indicated that overall thebimodal congruent threshold was significantly lowerthan both incongruent conditions (�4D: t(27) = �2.323,p = .028; +4D: t(27) = �2.672, p = .013), while nodifference in threshold between the two incongruentconditions emerged (t(27) = 0.390, p = .700). Childrenand adults behaved similarly and integrated haptic andauditory information by equally weighting the cues.Indeed, the mean weight for each age group was notsignificantly different from 0.5 (5–6y: t(5) = 1.061,p = .337; 7–8y: t(9) = 1.902, p = .09; 10–11y: t(5) =0.676, p = .529; adults: t(5) = 1.290, p = .253).
Discussion
Sensory systems continue to develop during childhooduntil they reach the mature state. Previous developmen-tal studies have shown that multisensory integration ofsensory information involving vision develops quite late(Barutchu et al., 2009; Barutchu et al., 2010; Gori et al.,2008; Innes-Brown et al., 2011; Nardini et al., 2010;Nardini et al., 2008). Children do not reduce thevariances of their sensory estimates by integratinginformation from multiple sources in the same way asadults, until at least 8–10 years of age (Alais & Burr,2004; Ernst & Banks, 2002; Helbig & Ernst, 2007; Hilliset al., 2002).
However, it remains unknown when multisensoryintegration of non-visual information such as haptic
Integration of auditory and haptic information 383
and auditory develops. Audio-haptic integration forobject’s size judgment could potentially show either anearlier or a later development than visual-haptic (Goriet al., 2008), for reasons we reported in the introduction.Here, we report the findings for two size discriminationexperiments to investigate the time course of haptic-auditory integration in the absence of visual information.In Experiment 1 we show that human adults canintegrate auditory and haptic cues nearly optimally (i.e.can reduce sensory uncertainty by taking a weightedaverage of cues) when performing objects’ size discrim-ination. This is consistent with their ability to nearlyoptimally integrate visual and haptic cues when perform-ing the same kind of task (Gori et al., 2008). By8–10 years, children can integrate visual and haptic cuesoptimally; however, at the same age children do not showoptimal integration of auditory and haptic cues. Thisresult indicates that optimal integration of non-visualcues for objects’ size discrimination might occur later inlife, at least for the auditory feature under study (i.e.loudness). This conclusion is further supported by thefindings of Experiment 2 in which even adults were not
completely able to solve sensory conflict through haptic-auditory integration. To assess whether this holds forother auditory features relevant to size discriminationsuch as pitch, future studies could use a modified versionof our method and set-up. This further investigationwould be also important to understand whether theability to use the pitch information for size discrimina-tion improves or worsens with age.Our results agree with previous studies (Gori et al.,
2008; Nardini et al., 2010; Nardini et al., 2008) in that onaverage adults, but not children, benefit from combiningtouch and sound, as indicated by their lower discrimina-tion threshold in this condition when compared to bothsingle-cue conditions. As subjects age, their performanceimproves (Figure 3); starting worse than the best singlecue and ending up better than the best single cue, aspredicted by integration. Our results, like those of anotherrecent study (Nardini, Begus &Mareschal, 2012), indicatethat some individual participants in all age groups didreduce sensory uncertainty through cue integration(Figure 4). Another result that is consistent with previousreports examining size discrimination in young children
(a)
(b)
Figure 5 Predictions and behavior in the conflict condition. (a) The black symbols and dashed line represent the measured PSEs inthe conflict condition (on the ordinate) plotted against the three level of haptic-auditory conflict (�4, 0, +4 mm). The yellow dashedline represents the prediction for the auditory dominant model, the green dashed line for the haptic dominant model. Error barsrepresent standard error of the mean. (b) Mean discrimination thresholds for bimodal congruent (green bar), �4D (cyan bar), and+4D (magenta bar) conditions as a function of age (different panels). Error bars represent standard error of the mean.
(e.g. Gori et al., 2008) is that the haptic information isweightedmore than the other cueswhen determining bothperceived size and discrimination thresholds. With age,this haptic dominance gradually decreases, with adultsrelying more on the auditory cue when discriminatingobjects’ size.
A further intriguing result is that although 10- to11-year-old children have lower discrimination thresh-olds than 7–8-year-olds, their performance on thebimodal condition does not differ from that of the7- to 8-year-olds. This indicates that the lack of devel-opment between these ages is specific to the ability toreduce variability when given both cues. Similar resultshave been found recently in other studies, and possibleexplanations of why this happens have been suggested(Barutchu et al., 2009; Barutchu et al., 2010; Nardiniet al., 2012). One possibility suggested by Nardini et al.(2012) is that during early adolescence the body isgrowing, and/or sensory systems are developing, morerapidly than at younger ages. From our data, thisappears to be especially true for the auditory sensorysystem. An adult-like ability to use the auditory infor-mation to judge object size was reached only at 10 to11 years, consistent with findings in speaker discrimina-tion (Petrini & Tagliapietra, 2008). The continuingdevelopment of unisensory ability may mean that chil-dren at these ages are still learning to calibrate theirsensory systems and to weight sensory informationappropriately (Gori et al., 2010; Gori et al., 2012).Another possibility is that structural and functionalreorganization in the brain is at the root of this lack ofmultisensory development during early adolescence(Paus, 2005; Steinberg, 2005). Physiological and psycho-physical studies, examining sight and sound integration inanimals and infants, indicate that development of mul-tisensory integration is delayed with respect to that of thetwo separate senses (Neil, Chee-Ruiter, Scheier, Lew-kowicz & Shimojo, 2006; Stein, Labos & Kruger, 1973;Stein, Meredith & Wallace, 1993; Wallace & Stein, 2001).
The results of Experiment 2 show that, on average,both children and adults used similar weighting strate-gies to solve audio–haptic conflict, resulting in lowerthresholds in the absence of conflict. The larger variance,shown by all age groups, when presented with audio–haptic conflict indicates that they were not integrating atall times, but alternated between the cues. One possibleexplanation behind this lack of integration in all agegroups is that participants were aware of the conflict.However, when questioned at the end of the experiment,no participant reported being aware of it. All of the agegroups were found to use a similar weighting strategy,equally weighting the haptic and auditory senses. At firstglance, this is a very surprising result showing similar
behavior in both children and adults. However, thepresent work differs from previous studies in that it is thefirst to examine how children and adults would behavewhen exposed only to multisensory conditions. In otherwords, the children and adults judging the ball sizes inthe three different bimodal conflict conditions were neverexposed to either the auditory or haptic informationalone. In this situation, which is much closer to real-lifesituations where experiencing pure single modality isquite rare, all of the age groups similarly weighted(~0.50) the two senses. The similarity between children’sand adults’ behavior under these circumstances indicatesthat children do not always weight one modality morethan the other, and that their underlying system of cuecombination may overall be quite adult-like. We proposethat the crucial difference between children and adults isthat, unlike adults, individual children do not weightcues according to their own cue reliabilities. This meansthat while adults and children can show similar meanweights (Figure 5a), and behavior consistent with inte-gration of cues (Figure 5b), children do not showvariance reduction given multiple cues (Figure 3). How-ever, some individual children show variance reduction(Figure 4), because they chose appropriate cue weightsthat reduce variance, perhaps by chance. A similarpattern of results was seen in a recent study of visual–haptic integration for hand localization (Nardini et al.,2012). Individual differences between children whointegrate and those who do not could depend on somechildren learning faster than others to combine the cues,perhaps due to greater exposure to these kinds of sensorycontingencies. This possibility could be examined byusing learning/training tasks with children.
Intriguingly, many studies have shown that infantspossess a variety of multisensory abilities (Lewkowicz,2000, 2010; Lewkowicz & Ghazanfar, 2009) and youngchildren possess Bayesian-like reasoning abilities (Duffy,Huttenlocher & Crawford, 2006; Gopnik, Glymour,Sobel, Schulz, Kushnir & Danks, 2004; Gopnik &Schulz, 2004; Huttenlocher, Hedges & Duncan, 1991;Huttenlocher, Hedges & Vevea, 2000). For example,4-year-old children can make Bayesian inferences bycombining prior probability information (e.g. almostnone of the blocks are blickets) with conditional depen-dency information (e.g. one of two blocks activates thedetector when either alone or with another block) tomake causal inferences (only the block activating thedetector in both instances is a blicket; Gopnik & Schulz,2004). Similarly, 5-year-old children can make Bayesianinferences by combining categorical knowledge (e.g.different fish size distributions) with fine-grained infor-mation (e.g. fish size) to estimate the sizes of stimuli(matching fish size; Duffy et al., 2006). Thus the ability
Integration of auditory and haptic information 385
to make Bayesian inferences and the capacity to compareinformation from different senses are available early indevelopment. However, the ability to integrate optimallyby choosing the appropriate weights for the differentsensory cues develops much later, as shown here and inprevious studies (Nardini et al., 2012). This processcould stem from the earlier developed Bayesian abilitiesor all these processes outlined might be quite distinct.What these findings confirm is that the difference
between children and adults lies in the ability tooptimally assess and weight the single senses rather thanin the ability to integrate them. This appears to besimilar for sensory combinations, whether or not theyinvolve vision (Nardini et al., 2012). We do not knowwhether these developmental changes in weightingstrategy reflect consistent changes in underlying multi-sensory mechanisms. A recent fMRI study demonstratedthat in adults haptic and auditory information isintegrated at different hierarchical levels in the cortexincluding superior temporal sulcus (STS; Kassuba et al.,2012). The multisensory process then culminates in theleft fusiform gyrus, which seems to be a higher-orderregion of sensory convergence for object recognition(Kassuba, Klinge, Holig, Menz, Ptito, Roder & Siebner,2011; Kassuba et al., 2012). In both monkeys andhumans, posterior STS is now considered to be a keybrain area for multisensory integration (Beauchamp,Lee, Argall & Martin, 2004; Calvert, 2001). In humans,this area responds more to auditory-tactile stimuli thaneither auditory or tactile in isolation (Beauchamp, Yasar,Frye & Ro, 2008), and more to audio-visual stimuli thaneither auditory or visual in isolation (Beauchamp et al.,2004). Between 4 and 21 years the posterior portion ofthe superior temporal gyrus STG develops and under-goes a gradual grey matter loss (Gogtay, Giedd, Lusk,Hayashi, Greenstein, Vaituzis, Nugent, Herman, Clasen,Toga, Rapoport & Thompson, 2004). A loss of greymatter may mean a functional specialization and refine-ment of this region to achieve adult-like multisensoryprocessing. It may also signify that different multisensoryprocesses develop at different rates during childhood andthroughout adolescence until either a common system ordifferent specialized systems are formed. A lack ofphysiological, psychophysical and neuroimaging studiescomparing the time courses for different cross-modalprocesses from an early age prevent us from knowingwhether different task-dependent multisensory processesdevelop before others in typical individuals. Our studysuggests that for the same task, optimal integration foraudio-haptic information occurs later than that ofvisual-haptic (Gori et al., 2008), supporting the existenceof separate multisensory mechanisms. However, resultsfrom different laboratories cannot be directly compared
as they have used different methods and differentparticipants. Future studies may help to elucidate thispoint, providing a baseline from which to compare themultisensory development of atypical populations andthose with sensory deficits.
Acknowledgements
We are very grateful for the support and help that StPaul’s Cathedral School has given us during the testing.This work was supported by the James S. McDonnellFoundation 21st Century Science Scholar in Under-standing Human Cognition Program and the NuffieldFoundation Undergraduate Research Bursary Scheme.We would also like to thank Paul Johnson and IanMaCartney from the UCL Institute of Ophthalmologyworkshop for making the wooden balls, and SarahKalwarowsky for helping with the English revision of themanuscript.
References
Alais, D., & Burr, D. (2004). The ventriloquist effect resultsfrom near-optimal bimodal integration. Current Biology, 14(3), 257–262.
Barutchu, A., Crewther, D.P., & Crewther, S.G. (2009). Therace that precedes coactivation: development of multisensoryfacilitation in children. Developmental Science, 12 (3),464–473.
Barutchu, A., Danaher, J., Crewther, S.G., Innes-Brown, H.,Shivdasani, M.N., & Paolini, A.G. (2010). Audiovisualintegration in noise by children and adults. Journal ofExperimental Child Psychology, 105 (1–2), 38–50.
Beauchamp, M.S., Lee, K.E., Argall, B.D., & Martin, A.(2004). Integration of auditory and visual information aboutobjects in superior temporal sulcus. Neuron, 41 (5), 809–823.
Beauchamp, M.S., Yasar, N.E., Frye, R.E., & Ro, T. (2008).Touch, sound and vision in human superior temporal sulcus.NeuroImage, 41 (3), 1011–1020.
Brainard, D.H. (1997). The Psychophysics Toolbox. SpatialVision, 10 (4), 433–436.
Bresciani, J.P., & Ernst, M.O. (2007). Signal reliability modu-lates auditory–tactile integration for event counting. Neuro-Report, 18 (11), 1157–1161.
Calvert, G.A. (2001). Crossmodal processing in the humanbrain: insights from functional neuroimaging studies. Cere-bral Cortex, 11 (12), 1110–1123.
Demorest, S.M. (1992). Information integration theory: anapproach to the study of cognitive development in music.Journal of Research in Music Education, 40 (2), 126–138.
Demorest, S.M., & Serlin, R.C. (1997). The integration of pitchand rhythm in musical judgment: testing age-related trends innovice listeners. Journal of Research in Music Education, 45(1), 67–79.
Duffy, S., Huttenlocher, J., & Crawford, L.E. (2006). Childrenuse categories to maximize accuracy in estimation. Develop-mental Science, 9 (6), 597–603.
Ernst, M.O., & Banks, M.S. (2002). Humans integrate visualand haptic information in a statistically optimal fashion.Nature, 415 (6870), 429–433.
Gogtay, N., Giedd, J.N., Lusk, L., Hayashi, K.M., Greenstein,D., Vaituzis, A.C., Nugent, T.F. 3rd, Herman, D.H., Clasen,L.S., Toga, A.W., Rapoport, J.L., & Thompson, P.M. (2004).Dynamic mapping of human cortical development duringchildhood through early adulthood. Proceedings of theNational Academy of Sciences, USA, 101 (21), 8174–8179.
Gopnik, A., Glymour, C., Sobel, D.M., Schulz, L.E., Kushnir, T.,& Danks, D. (2004). A theory of causal learning in children:causalmapsandBayesnets.PsychologicalReview,111 (1), 3–32.
Gopnik,A.,&Schulz, L. (2004).Mechanismsof theory formationin young children. Trends in Cognitive Sciences, 8 (8), 371–377.
Gori, M., Del Viva, M., Sandini, G., & Burr, D.C. (2008).Young children do not integrate visual and haptic forminformation. Current Biology, 18 (9), 694–698.
Gori, M., Sandini, G., Martinoli, C., & Burr, D. (2010). Poorhaptic orientation discrimination in nonsighted children mayreflect disruption of cross-sensory calibration. Current Biol-ogy, 20 (3), 223–225.
Gori, M., Tinelli, F., Sandini, G., Cioni, G., & Burr, D. (2012).Impaired visual size-discrimination in children with move-ment disorders. Neuropsychologia, 50 (8), 1838–1843.
Grassi, M. (2005). Do we hear size or sound? Balls dropped onplates. Perception & Psychophysics, 67 (2), 274–284.
Helbig, H.B., & Ernst, M.O. (2007). Optimal integration ofshape information from vision and touch. ExperimentalBrain Research, 179 (4), 595–606.
Lewkowicz, D.J. (2000). Infants’ perception of the audible,visible, and bimodal attributes of multimodal syllables. ChildDevelopment, 71 (5), 1241–1257.
Lewkowicz, D.J., & Ghazanfar, A.A. (2009). The emergence ofmultisensory systems through perceptual narrowing. Trendsin Cognitive Sciences, 13 (11), 470–478.
Nardini, M., Bedford, R., & Mareschal, D. (2010). Fusion ofvisual cues is not mandatory in children. Proceedings of theNational Academy of Sciences, USA, 107 (39), 17041–17046.
Nardini, M., Begus, K., & Mareschal, D. (2012). Multisensoryuncertainty reduction for hand localization in children andadults. Journal of Experimental Psychology: Human Percep-tion and Performance, 39 (3), 773–787.
Nardini, M., Jones, P., Bedford, R., & Braddick, O. (2008).Development of cue integration in human navigation.Current Biology, 18 (9), 689–693.
Nava, E., & Pavani, F. (2013). Changes in sensory dominanceduring childhood: converging evidence from the colavitaeffect and the sound-induced flash illusion. Child Develop-ment, 84 (2), 604–616.
Neil, P.A., Chee-Ruiter, C., Scheier, C., Lewkowicz, D.J., &Shimojo, S. (2006). Development of multisensory spatialintegration and perception in humans. Developmental Sci-ence, 9 (5), 454–464.
Paus, T. (2005). Mapping brain maturation and cognitivedevelopment during adolescence. Trends in Cognitive Sci-ences, 9 (2), 60–68.
Pelli, D.G. (1997). The VideoToolbox software for visualpsychophysics: transforming numbers into movies. SpatialVision, 10 (4), 437–442.
Petrini, K., & Tagliapietra, S. (2008). Cognitive maturation andthe use of pitch and rate information in making similarityjudgments of a single talker. Journal of Speech, Language andHearing Research, 51 (2), 485–501.
Sanabria, D., Soto-Faraco, S., & Spence, C. (2005). Assessingthe effect of visual and tactile distractors on the perception ofauditory apparent motion. Experimental Brain Research, 166(3–4), 548–558.
Soto-Faraco, S., & Deco, G. (2009). Multisensory contributionsto the perception of vibrotactile events. Behavioural BrainResearch, 196 (2), 145–154.
Stein, B.E., Labos, E., & Kruger, L. (1973). Sequence ofchanges in properties of neurons of superior colliculus of thekitten during maturation. Journal of Neurophysiology, 36 (4),667–679.
Stein, B.E., Meredith, M.A., & Wallace, M.T. (1993). Thevisually responsive neuron and beyond: multisensory integra-tion in cat and monkey. Progress in Brain Research, 95, 79–90.
Steinberg, L. (2005). Cognitive and affective development inadolescence. Trends in Cognitve Sciences, 9 (2), 69–74.
Tajadura-Jimenez, A., Valjamae, A., Toshima, I., Kimura, T.,Tsakiris, M., & Kitagawa, N. (2012). Action sounds recal-ibrate perceived tactile distance. Current Biology, 22 (13),R516–R517.
Wallace, M.T., & Stein, B.E. (2001). Sensory and multisensoryresponses in the newborn monkey superior colliculus. Journalof Neuroscience, 21 (22), 8886–8894.