I.J.A.B.R, VOL. 6(4) 2016: 448-465 ISSN 2250 – 3579 448 WHEN, WHICH AND WHERE OF DISEASE INCIDENCE IN INDIA: AN IDSP ANALYSIS *Ashwini Reddy, Hemanta Kumar Naik, Suresh Munuswamy Indian Institute of Public Health- Hyderabad, India; * Corresponding author e-mail: [email protected]ABSTRACT In 2004 the Union Ministry of Health & Family Welfare, Government of India, rolled out an Integrated Disease Surveillance Project (IDSP), a decentralized state-based disease surveillance system. The purpose of the study is to analyze country wide IDSP data from 2011 to 2013 to identify the disease and district associated with the seasonal peaks in disease incidence numbers, and to identify the gaps in the existing surveillance system. Weekly datasets from IDSP were sourced from National Centre for Disease Control- New Delhi, GOI through due process. The disease outbreak incidence numbers are summed up and sequenced quarterly. In the next step the incidence peak quarters were identified and analyzed. The highest number of cases were reported in July to September (Quarter 2) of 2011 (34%), second quarter of 2012 (31%), and second quarter of 2013 (34%). Acute diarrhoeal disease (ADD) (40.85%) constitutes the biggest reason for peak disease incidence followed by dengue/ chickungunya (19.50%), food poisoning (18.44%), PUO (fever of unknown origin) (13.20%), and Cholera (8%). 13 districts have reported the reoccurrence of diseases during the peak outbreak incidence period of all the years. The main diseases that are showing a clustering effect are ADD (average number of cluster in the three years = 3), and Dengue and Chickungunya (2) and Cholera (2). The reported disease outbreak data under IDSP accounted for 1% of missing information on the date of disease outbreaks and approximately 25% of missing date of reporting of the same. The IDSP disease outbreak reporting procedure suffered a time lag of a minimum 3 days and a maximum time lag of 64 days. The study highlights the time, disease and district that need to be prioritized for better focus of resources. Also the more critical question of “why” regarding the disease incidence should be further researched up on. KEYWORDS: time series, India, outbreak, spatial analysis, surveillance system. INTRODUCTION In 2004 the Union Ministry of Health & Family Welfare, Government of India, rolled out an Integrated Disease Surveillance Project (IDSP), a decentralized state-based disease surveillance system, intended to detect early warning signals of epidemic prone diseases, so that timely and effective public health actions can be initiated in response to health challenges in the country at the state and the national level. Major components of the project are [1] : 1. Integration and decentralization of surveillance activities 2. Strengthening of public health laboratories 3. Human Resource Development – Training of State Surveillance Officers (SSO), District Surveillance Officers (DSO), Rapid Response Team (RRT), other medical and paramedical staff 4. Use of Information Technology for collection, collation, compilation, analysis, and dissemination of data 5. Avian Influenza Human Component Under the project weekly (Monday to Sunday) disease surveillance aggregated data on epidemic prone disease are being collected from reporting units such as sub centers, primary health centers, community health centers, hospitals including government and private sector hospitals and medical colleges. The data from various health institutions are collected on three reporting forms, namely the Suspected (S) cases, the Presumptive (P) cases, and the Laboratory-confirmed (L) cases filled in by health workers, clinicians and clinical laboratory staff respectively. Investigation on the data collected is performed by the Medical Officers and the Rapid Response Teams. Reasons for disease surveillance data can include the need to assess the health status of a population, establish public health priorities, create an early warning system based on past experience and reduce the burden of disease in a population by appropriately targeting effective disease prevention and control activities [2] . Prompt detection of an outbreak of infectious disease may lead to control measures that limit its impact and help prevent future outbreaks. According to the Oxford Handbook of Public Health Practice, two of the principal objectives of an effective surveillance system are to "give early warning changes of incidence," and "detect outbreaks early". Unfortunately, the reality of public health practice is that most monitoring agencies routinely fall short of these objectives, because of coordination delays. The purpose of this study is: 1.To analyze country wide IDSP data from 2011 to 2013 through time series analysis to identify for seasonal peaks. Also knowing the disease and district associated with the seasonal peaks would help in future disease
ABSTRACTIn 2004 the Union Ministry of Health & Family Welfare, Government of India, rolled out an Integrated DiseaseSurveillance Project (IDSP), a decentralized state-based disease surveillance system. The purpose of the study is to analyzecountry wide IDSP data from 2011 to 2013 to identify the disease and district associated with the seasonal peaks in diseaseincidence numbers, and to identify the gaps in the existing surveillance system. Weekly datasets from IDSP were sourcedfrom National Centre for Disease Control- New Delhi, GOI through due process. The disease outbreak incidence numbersare summed up and sequenced quarterly. In the next step the incidence peak quarters were identified and analyzed. Thehighest number of cases were reported in July to September (Quarter 2) of 2011 (34%), second quarter of 2012 (31%), andsecond quarter of 2013 (34%). Acute diarrhoeal disease (ADD) (40.85%) constitutes the biggest reason for peak diseaseincidence followed by dengue/ chickungunya (19.50%), food poisoning (18.44%), PUO (fever of unknown origin)(13.20%), and Cholera (8%). 13 districts have reported the reoccurrence of diseases during the peak outbreak incidenceperiod of all the years. The main diseases that are showing a clustering effect are ADD (average number of cluster in thethree years = 3), and Dengue and Chickungunya (2) and Cholera (2). The reported disease outbreak data under IDSPaccounted for 1% of missing information on the date of disease outbreaks and approximately 25% of missing date ofreporting of the same. The IDSP disease outbreak reporting procedure suffered a time lag of a minimum 3 days and amaximum time lag of 64 days. The study highlights the time, disease and district that need to be prioritized for better focusof resources. Also the more critical question of “why” regarding the disease incidence should be further researched up on.
KEYWORDS: time series, India, outbreak, spatial analysis, surveillance system.
INTRODUCTIONIn 2004 the Union Ministry of Health & Family Welfare,Government of India, rolled out an Integrated DiseaseSurveillance Project (IDSP), a decentralized state-baseddisease surveillance system, intended to detect earlywarning signals of epidemic prone diseases, so thattimely and effective public health actions can be initiatedin response to health challenges in the country at the stateand the national level. Major components of the projectare [1]:1. Integration and decentralization of surveillance
activities2. Strengthening of public health laboratories3. Human Resource Development – Training of State
Surveillance Officers (SSO), District SurveillanceOfficers (DSO), Rapid Response Team (RRT), othermedical and paramedical staff
4. Use of Information Technology for collection,collation, compilation, analysis, and dissemination ofdata
5. Avian Influenza Human Component
Under the project weekly (Monday to Sunday) diseasesurveillance aggregated data on epidemic prone diseaseare being collected from reporting units such as subcenters, primary health centers, community healthcenters, hospitals including government and privatesector hospitals and medical colleges. The data from
various health institutions are collected on threereporting forms, namely the Suspected (S) cases, thePresumptive (P) cases, and the Laboratory-confirmed (L)cases filled in by health workers, clinicians and clinicallaboratory staff respectively. Investigation on the datacollected is performed by the Medical Officers and theRapid Response Teams.Reasons for disease surveillance data can include theneed to assess the health status of a population, establishpublic health priorities, create an early warning systembased on past experience and reduce the burden ofdisease in a population by appropriately targetingeffective disease prevention and control activities [2].Prompt detection of an outbreak of infectious diseasemay lead to control measures that limit its impact andhelp prevent future outbreaks. According to the OxfordHandbook of Public Health Practice, two of the principalobjectives of an effective surveillance system are to"give early warning changes of incidence," and "detectoutbreaks early". Unfortunately, the reality of publichealth practice is that most monitoring agencies routinelyfall short of these objectives, because of coordinationdelays.The purpose of this study is:1. To analyze country wide IDSP data from 2011 to 2013through time series analysis to identify for seasonalpeaks. Also knowing the disease and district associatedwith the seasonal peaks would help in future disease
Disease incidence in India: an IDSP analysis
449
prevention and control. The need is to answer threequestions:a. In a year when do diseases occur most?b. Which diseases occur most?c. Where (district) do these diseases occur most?2. To identify the gaps in the existing surveillance system
and suggest newer methodologies to capture healthhappenings from varied potential sources ofinformation.
METHODOLOGYWeekly datasets from IDSP for the years 2011-2013 wassourced from National Centre for Disease Control- NewDelhi, Government of India through due process. Datacleansing was performed using SAS University Edition.The dataset was divided according to Regions i.e.Central, East, North, South, and West. The reporteddisease outbreak incidence numbers were summed upand sequenced quarterly (April-June being the firstquarter), for time series data analysis. In the next step theincidence peak quarter in each of the three years wasidentified. The dataset was further subset to only include5 diseases contributing the highest number of casesreported per region during the period of the incidencepeak quarter. Five districts from each region reportingthe highest number of cases for those diseases wasextracted and the analysis was performed on thesedistricts. The Variable cases are defined as the Numberof individuals affected by a particular disease for which arecord was made. The district level analysis was mappedusing the ARC GIS software. The reporting of diseaseoutbreaks was evaluated by identifying the time lagbetween outbreak date and reported date. Also, the data
was checked for inefficiencies and inconsistencies withthe ground reality. On the basis of the identified gaps inthe existing surveillance system, we have suggestednewer methodologies for the development of anindicator-based public health surveillance system.
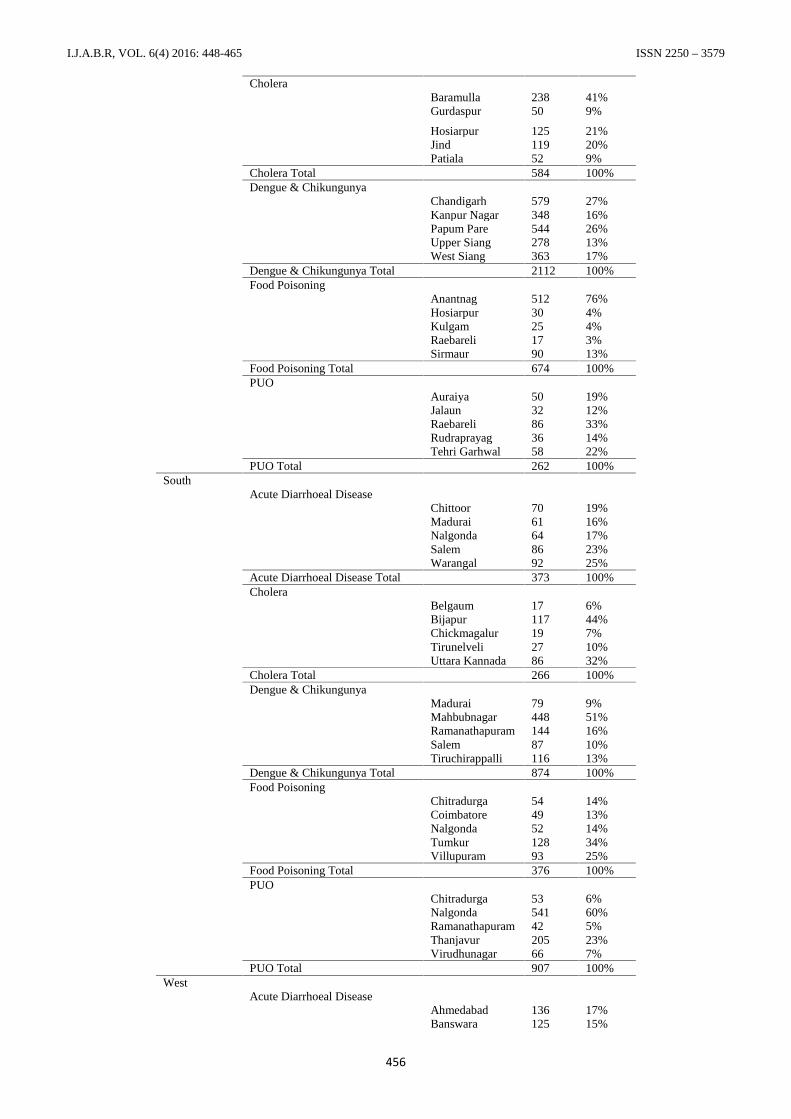
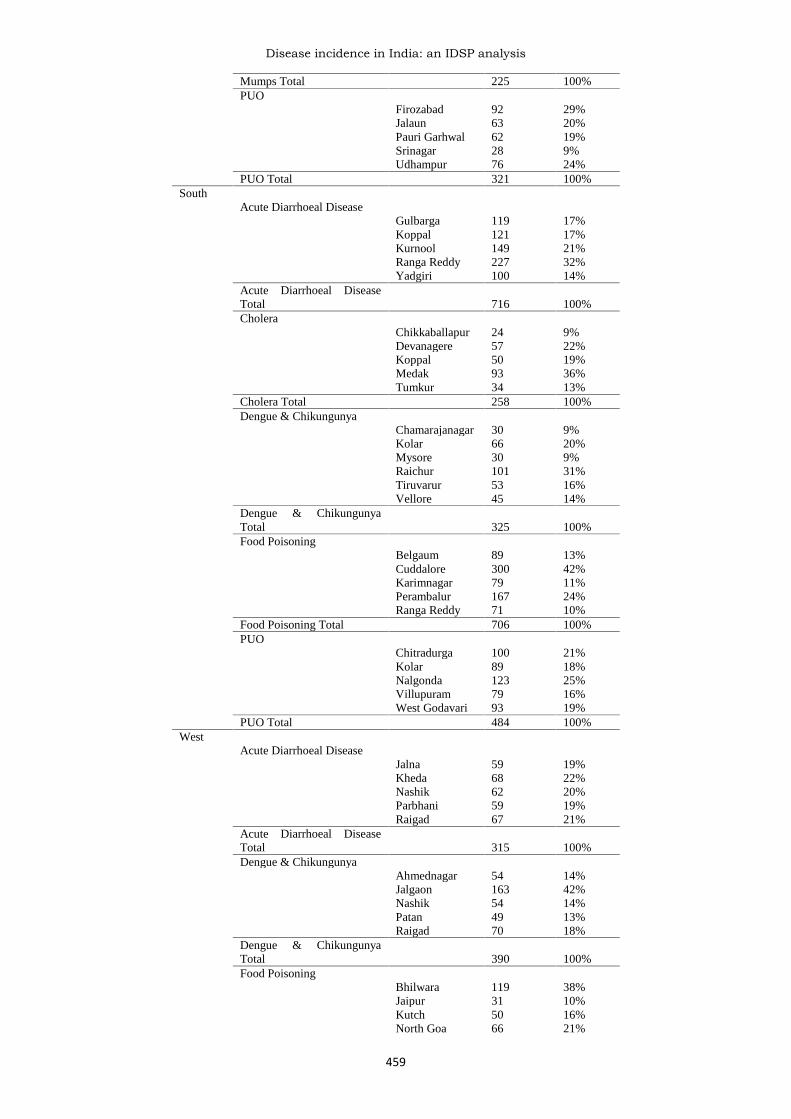
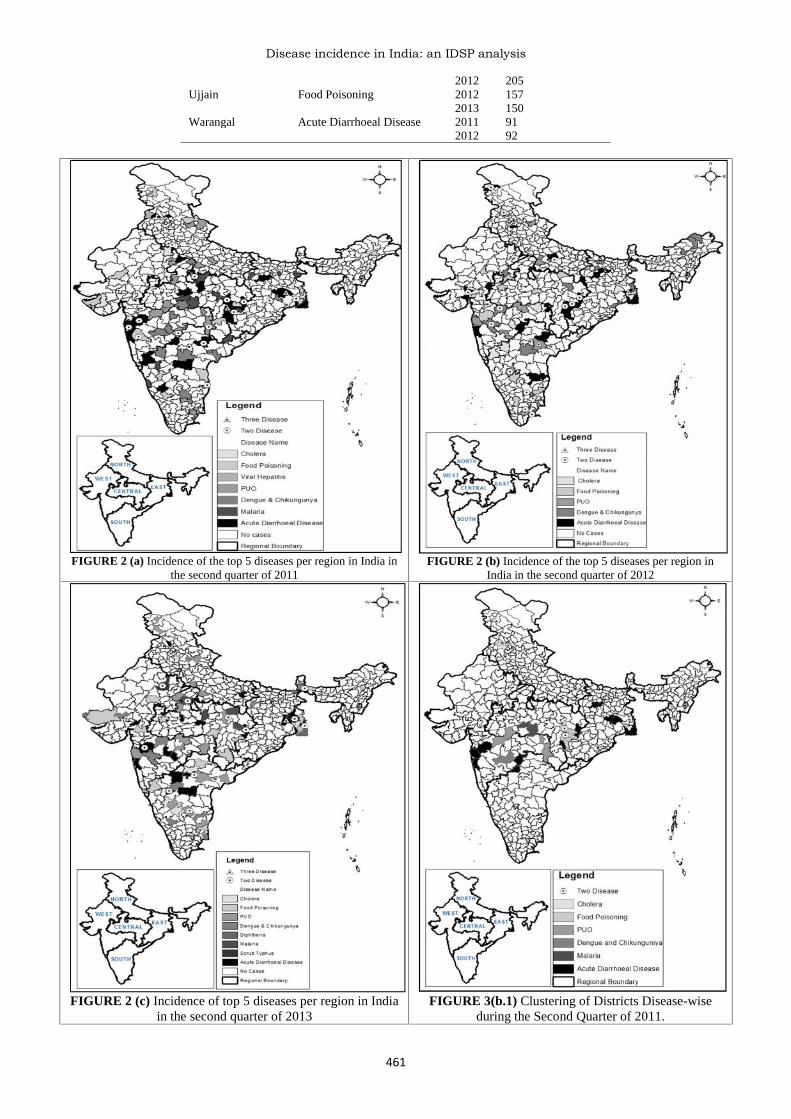
RESULTSFigure 1(a) shows the quarterly country wide distributionof all disease outbreaks for three years (2011, 2012, and2013). The number of reported cases (incidence) isshowing a clear increasing trend. Also there is a clearcyclical disease outbreak incidence with maximumincidence in the second quarter of every year. The highestnumber of cases reported has been in the second quarter of2011 (34%), second quarter of 2012 (31%), and secondquarter of 2013 (34%). Figure 2 (a, b, c) and Table 2 (a, b,c) shows the composition of diseases during the peakoutbreak incidence period of the second quarter of 2011,2012, and 2013 respectively. Acute diarrhoeal disease(40.85%) constitutes the biggest reason for peak diseaseincidence followed by dengue/ chickungunya (19.50%),food poisoning (18.44%), PUO (fever of unknown origin)(13.20%), and Cholera (8%). Figure 2(d) shows thecomposition of 13 districts that have reported thereoccurrence of diseases during the peak outbreakincidence period of all the years. Figure 3 (a, b, c) andTable 3 (a, b, c) show the groups of districts that form acluster of a same disease occurring during the secondquarter of 2011, 2012, and 2013 respectively. The maindiseases that are showing a clustering effect are AcuteDiarrhoeal Disease (average number of cluster in the threeyears = 3), and Dengue and Chickungunya (2) and Cholera(2).
TABLE 1(a) Quarterly Incidence of all Diseases in India2011 2012 2013
FIGURE 1 (a) Quarterly Incidence of all Diseases in India for the years 2011, 2012, 2013First Quarter of every year is April to June (1 year is April to March)
FIGURE 1 (b) Quarterly Incidence of all diseases in the Central Region of India for the years 2011, 2012, 2013First Quarter of every year is April to June (1 year is April to March)
TABLE 1 (c) Quarterly Incidence of all diseases in the East region of India
FIGURE 1 (c) Quarterly Incidence of all Diseases in the East Region of India for the years 2011, 2012, 2013First Quarter of every year is April to June (1 year is April to March)
TABLE 1(d) Quarterly Incidence of all diseases in the North region of India
FIGURE 1 (d) Quarterly Incidence of all Diseases in the North Region of India for the years 2011, 2012, 2013First Quarter of every year is April to June (1 year is April to March)
TABLE 1 (e) Quarterly Incidence of all diseases in the South region of India2011 2012 2013
FIGURE 1 (e) Quarterly Incidence of all Diseases in the South region of India for the years 2011, 2012, 2013First Quarter of every year is April to June (1 year is April to March)
TABLE 1 (f) Quarterly Incidence of all diseases in the West region of India
FIGURE 1 (f) Quarterly Incidence of all Diseases in the West region of India for the years 2011, 2012, 2013First Quarter of every year is April to June (1 year is April to March)
When and where of public health happenings is animportant factor that helps in identifying early warningsignals of diseases and thus ensures the efficiency of apublic health surveillance system. The reported diseaseoutbreak data under IDSP accounted for 1% of missinginformation on the date of disease outbreaks andapproximately 25% of missing date of reporting of the
same. The IDSP disease outbreak reporting proceduresuffered a time lag of a minimum 3 days and a maximumtime lag of 64 days. Moreover, detailed locationinformation as a field apart from the district in which theoutbreak occurred wasn’t reported, however the locationwas recorded in the free-flow text of the commentssection.
TABLE 2 (a) Incidence of the top 5 diseases per region in India in the Second quarter of 2011
TABLE 3(b.1) Clustering of Districts Disease-wise during the second quarter of 2011Disease Number of ClustersAcute Diarrhoeal Disease 5PUO 2Malaria 1Cholera 1Food Poisoning 1Dengue and Chickungunya 1
TABLE 3(b.2) Clustering of Districts Disease-wise during the second quarter of 2012Disease Number of ClustersAcute Diarrhoeal Disease 4Cholera 3Dengue and Chickungunya 2Food Poisoning 1PUO 1
FIGURE 3(b.2) Clustering of Districts Disease-wise during thesecond quarter of 2012
FIGURE 3(b.3) Clustering of Districts Disease-wise during thesecond quarter of 2013
TABLE 3(b.3) Clustering of Districts Disease-wise during the second quarter of 2013Disease Number of ClustersAcute Diarrhoeal Disease 3Dengue and Chickungunya 2PUO 2Cholera 2
However, despite the shortcomings in IDSP the followingresults were obtained from the reported disease outbreakdata during 2011 – 2013: In the North region of India, noparticular state had a clear majority in the number of
disease outbreaks. The Badgum district of Jammu andKashmir reported the highest incidence of AcuteDiarrhoeal Disease (77%) during the second quarter of2011. In the second quarter of 2013, North Delhi reported
Disease incidence in India: an IDSP analysis
463
the highest incidence of Dengue and Chikungunya (96%).Ganderbal and Anantnag districts of Jammu and Kashmirreported repeated outbreaks of Acute Diarrhoeal Diseaseand Food Poisoning respectively during the secondquarters of 2011 and 2012. The districts of West Bengalreported the majority of disease outbreaks during theincidence peak quarters of 2011 to 2013. Bankura districtof West Bengal observed the highest incidence of AcuteDiarrhoeal Disease (49%), Food Poisoning (45%) in 2011and Cholera (17%) in 2012. There were repeatedoutbreaks of Acute Diarrhoeal Disease, Food Poisoning,and Cholera over the years in Bankura. Apart fromBankura reporting the majority of disease outbreaks, theHowrah district of West Bengal had the highest incidenceof Dengue and Chikungunya (85%) in 2011. Maharashtrastate in the West region of India accounted for the highestnumber of reported disease outbreaks over the years. Inthe second quarter of 2012, Kota district of Rajasthanobserved the highest incidence of Dengue andChikungunya (85%). Many districts of Maharashtra andGujarat, namely, Nanded, Ahmednagar, Beed, and Jalgaonfaced a reoccurrence of Dengue and Chikungunyacontributing to the peak incidence quarters of 2011, 2012,and 2013. Multiple outbreaks of Acute Diarrhoeal Disease(35%), Food Poisoning (20%) and Dengue andChikungunya (1%) were reported in Raipur in the secondquarter of 2011. Raipur also observed a repeated outbreakof Acute Diarrhoeal Disease (15%) and Food Poisoning(44%) in the second quarter of 2012.
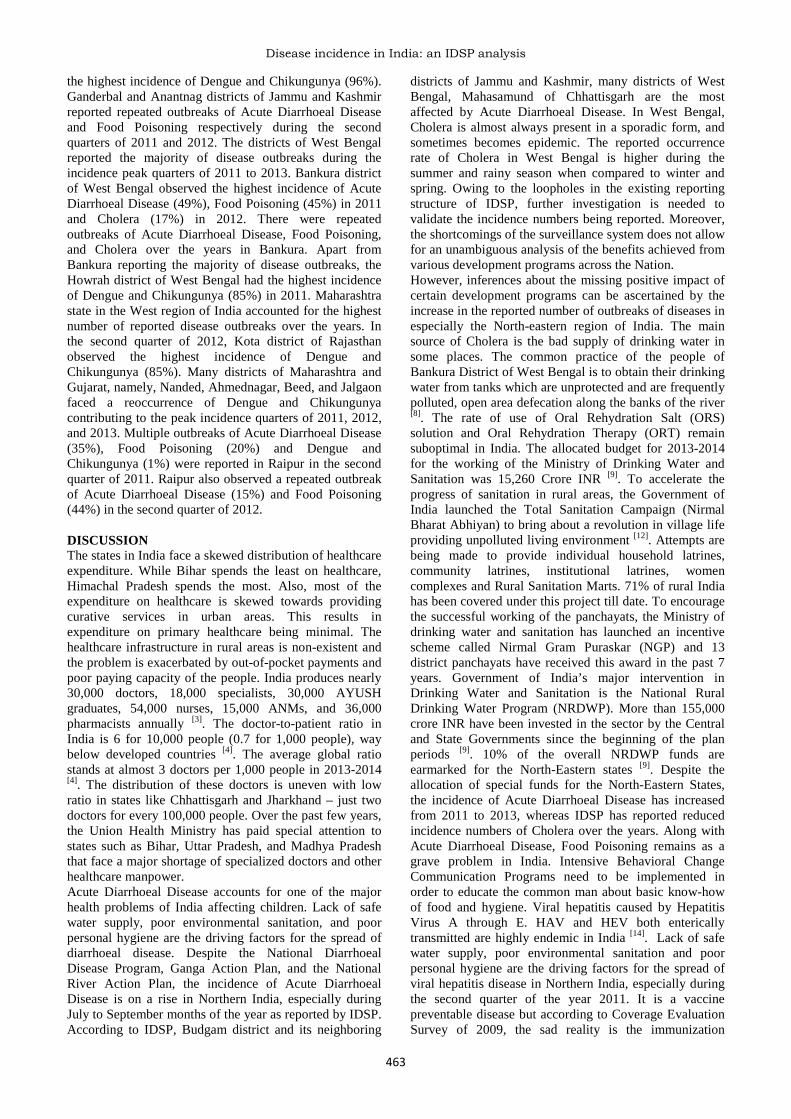
DISCUSSIONThe states in India face a skewed distribution of healthcareexpenditure. While Bihar spends the least on healthcare,Himachal Pradesh spends the most. Also, most of theexpenditure on healthcare is skewed towards providingcurative services in urban areas. This results inexpenditure on primary healthcare being minimal. Thehealthcare infrastructure in rural areas is non-existent andthe problem is exacerbated by out-of-pocket payments andpoor paying capacity of the people. India produces nearly30,000 doctors, 18,000 specialists, 30,000 AYUSHgraduates, 54,000 nurses, 15,000 ANMs, and 36,000pharmacists annually [3]. The doctor-to-patient ratio inIndia is 6 for 10,000 people (0.7 for 1,000 people), waybelow developed countries [4]. The average global ratiostands at almost 3 doctors per 1,000 people in 2013-2014[4]. The distribution of these doctors is uneven with lowratio in states like Chhattisgarh and Jharkhand – just twodoctors for every 100,000 people. Over the past few years,the Union Health Ministry has paid special attention tostates such as Bihar, Uttar Pradesh, and Madhya Pradeshthat face a major shortage of specialized doctors and otherhealthcare manpower.Acute Diarrhoeal Disease accounts for one of the majorhealth problems of India affecting children. Lack of safewater supply, poor environmental sanitation, and poorpersonal hygiene are the driving factors for the spread ofdiarrhoeal disease. Despite the National DiarrhoealDisease Program, Ganga Action Plan, and the NationalRiver Action Plan, the incidence of Acute DiarrhoealDisease is on a rise in Northern India, especially duringJuly to September months of the year as reported by IDSP.According to IDSP, Budgam district and its neighboring
districts of Jammu and Kashmir, many districts of WestBengal, Mahasamund of Chhattisgarh are the mostaffected by Acute Diarrhoeal Disease. In West Bengal,Cholera is almost always present in a sporadic form, andsometimes becomes epidemic. The reported occurrencerate of Cholera in West Bengal is higher during thesummer and rainy season when compared to winter andspring. Owing to the loopholes in the existing reportingstructure of IDSP, further investigation is needed tovalidate the incidence numbers being reported. Moreover,the shortcomings of the surveillance system does not allowfor an unambiguous analysis of the benefits achieved fromvarious development programs across the Nation.However, inferences about the missing positive impact ofcertain development programs can be ascertained by theincrease in the reported number of outbreaks of diseases inespecially the North-eastern region of India. The mainsource of Cholera is the bad supply of drinking water insome places. The common practice of the people ofBankura District of West Bengal is to obtain their drinkingwater from tanks which are unprotected and are frequentlypolluted, open area defecation along the banks of the river[8]. The rate of use of Oral Rehydration Salt (ORS)solution and Oral Rehydration Therapy (ORT) remainsuboptimal in India. The allocated budget for 2013-2014for the working of the Ministry of Drinking Water andSanitation was 15,260 Crore INR [9]. To accelerate theprogress of sanitation in rural areas, the Government ofIndia launched the Total Sanitation Campaign (NirmalBharat Abhiyan) to bring about a revolution in village lifeproviding unpolluted living environment [12]. Attempts arebeing made to provide individual household latrines,community latrines, institutional latrines, womencomplexes and Rural Sanitation Marts. 71% of rural Indiahas been covered under this project till date. To encouragethe successful working of the panchayats, the Ministry ofdrinking water and sanitation has launched an incentivescheme called Nirmal Gram Puraskar (NGP) and 13district panchayats have received this award in the past 7years. Government of India’s major intervention inDrinking Water and Sanitation is the National RuralDrinking Water Program (NRDWP). More than 155,000crore INR have been invested in the sector by the Centraland State Governments since the beginning of the planperiods [9]. 10% of the overall NRDWP funds areearmarked for the North-Eastern states [9]. Despite theallocation of special funds for the North-Eastern States,the incidence of Acute Diarrhoeal Disease has increasedfrom 2011 to 2013, whereas IDSP has reported reducedincidence numbers of Cholera over the years. Along withAcute Diarrhoeal Disease, Food Poisoning remains as agrave problem in India. Intensive Behavioral ChangeCommunication Programs need to be implemented inorder to educate the common man about basic know-howof food and hygiene. Viral hepatitis caused by HepatitisVirus A through E. HAV and HEV both entericallytransmitted are highly endemic in India [14]. Lack of safewater supply, poor environmental sanitation and poorpersonal hygiene are the driving factors for the spread ofviral hepatitis disease in Northern India, especially duringthe second quarter of the year 2011. It is a vaccinepreventable disease but according to Coverage EvaluationSurvey of 2009, the sad reality is the immunization
coverage among children in few states of India evaluatedto be only 58.9% [15].The National Vector Borne Disease Control Programme(NVBDCP) is an umbrella programme for the preventionand control of vector borne diseases like Dengue,Chikungunya, Malaria and so on. The various States areresponsible for implementation of the programme whilethe Directorate of NVBDCP, Delhi provides withassistance in the form of cash and commodity andtechnical support as per approved pattern [16]. Malaria isone of the major public health problems of India. Due tolack of efficiency in diagnosis and reporting at the PrimaryHealth Centre and Sub center levels, people suffering fromFever most of the time are categorized as PUO (Fever ofUnknown Origin) and go unnoticed as any other potentialdisease like Malaria, Dengue or Chikungunya. Around50% of the total malaria cases reported is due to P.falciparum. One of the reasons attributed to the rise in P.falciparum cases is the resistance to chloroquine, whichwas used for a long time as the first line treatment ofmalaria cases. The incidence of Malaria is the highestamong the districts of the Central region of India. Theglobal fund supported ‘Intensified Malaria Control Project– Phase 2’ is being implemented since October 2010 for aperiod of 5 years in 7 North-Eastern States. The strategiesof the project are early diagnosis and complete treatment,integrated vector control including promotion ofInsecticide Treated Bed Net (Long-Lasting InsecticidalNets), through intensive IEC and capacity building &training of the health workers & community volunteers.These project activities have resulted in a sharp decline inthe number of Malaria cases reported over the years.Implementation of the World Bank Supported Project onMalaria Control in states namely Andhra Pradesh,Chhattisgarh, Gujarat, Jharkhand, Madhya Pradesh,Maharashtra, Orissa, Karnataka, and West Bengal hasstabilized the reported incidence of Malaria from 2011 to2013.The global incidence of Dengue has growndramatically in recent decades. Dengue is found in tropicaland sub-tropical climates worldwide, mostly in urban andsemi-urban areas. There is no specific treatment fordengue or severe dengue, but early detection and access toproper medical care lowers fatality rates to below 1%. Theprevention and control of Dengue solely depends oneffective vector control measures. The incidence ofDengue has been on a rise from 2011 to 2013, with thehighest number of Dengue cases being reported during thesecond quarter of 2012, similar is the case withChikungunya. The month of July is observed as AntiDengue Month when states are undertaking widespreadcampaigns for community awareness and mobilization,inter-personal communication, etc. in addition to regularInformation Education and Communication (IEC)/Behavior Change Communication (BCC) activities. In thecase of Chikungunya, the Government of India ismonitoring the situation regularly, sending guidelines andadvisories for the prevention and control of Chikungunyafever to states. For the prevention and control of Dengueand Chikungunya the government of India has launched acomprehensive Mid Term Plan [18]. Focused resourceallocation to the North Eastern states through the variousdisease control national programmes has indeed brought
about a significant reduction in the incidence of Cholera inthese states over the years. Having learnt from thisexperience, attention needs to be given to the NorthernIndia states and West Bengal to curb the incidence ofcommunicable diseases.The analysis drawn from the disease outbreak datareported under IDSP is only half-baked due to a variety ofshortcomings in the surveillance system. Quoting theimplementation challenges documented in the IDSP JointImplementation Review in January 2009, inefficiency ofIDSP surround the issues of non-availability of skilledworkforce to analyze the IDSP data and mount appropriatelocal response, poor participation of private healthproviders and public hospitals in reporting, lack of clearguidelines for diagnosis of certain communicable diseases,lack of an indicator-based surveillance and delayedreporting of disease outbreaks.Along with improving the efficiency in resourcemobilization and allocation, the government of India needsto increase the investment in mobile health technologies.Mobile technologies have played a key role in keepingpeople healthy, managing diseases, and loweringhealthcare costs. The disease profile in the country iscomplex considering the high incidence of communicableand non-communicable diseases. The growing private andpublic expenditure on healthcare is ensuring a greaterfocus on technology-based healthcare delivery solutions inthe country. For India, the mobile health initiative willimpact many stakeholders including patients, doctors,technology companies, pharmaceutical companies,hospitals and will also benefit the entire public healthcaresystem of the country. Moreover, having an indicator-based disease surveillance system integrated in an event-based disease surveillance system allows for earlydetection of disease outbreaks and calls for urgentattention of the required authorities. There is a need tointegrate social media and new media as potential sourcesof public health happenings of a nation. The exchange ofhealth information on the Internet by users of social mediacould lead to faster recognition of cases of communicablediseases. Access to such data can help in detectingpotential public health threats that are rare, new diseasesor early-level warnings for epidemics. Integration of suchvaried sources of public health information will not onlyrequire an efficient development of the surveillancesystem to handle this real time data feed, but also requiresan adequate validation and regulation of diseasesurveillance data in order to allow for the efficient dataconversion into meaningful and timely information. Thiswill also help in evaluating the benefits achieved throughinvestments in various development programs in the mostneeded parts of India. Further, we will then be in a betterposition to advocate for the efficient use of limitedresources to allow for sustainable development of India.The challenges for implementation that include resourceavailability, technical understanding and requirements,acceptability to public health workforce and policymakerswill have wide-reaching implications for public healthsurveillance in India.
CONCLUSIONThe study highlights the time, disease and district that
Disease incidence in India: an IDSP analysis
465
need to be prioritized for better focus of resources. Alsothe more critical question of “why” regarding the diseaseincidence should be further researched up on. Thegovernment of India needs to shift the focus of resourcesfrom the North-Eastern States to the Northern States, WestBengal, Maharashtra, and Rajasthan. This will result inreducing the incidence of communicable diseases in thesestates. In the next few years, the mobile health market inIndia will be led by diagnosis and monitoring services andit is expected to bridge India’s health deficit, particularlyin rural areas. Moreover, there is an urgent need todevelop an indicator based disease surveillance systemwhich consists of social media as a potential source ofpublic health happenings of a nation.
ACKNOWLEDGEMENTSWe would like to take this opportunity to express ourprofound gratitude and deep regard to Dr. SureshMunuswamy, for his exemplary guidance, valuablefeedback and constant encouragement throughout theduration of the research. Working under him was anextremely knowledgeable experience for us. We thank theNational Center for Disease Control – Delhi for providingus the Disease Outbreak data of the years 2011-2013 inIndia. We would also like to give our sincere gratitude toall our friends and colleagues who helped in the research,without which this research would be incomplete.
nic.in/[2]. Ministry of Health and Family Welfare. www.moh
fw.gov .in.[3]. India has just one doctor for every 1,700 people. U
Anand Kumar. 22nd September 2013. The New IndianExpress.“http://www.newindianexpress.com/magazine/India-has-just-one-doctor-for-every-1700-people/2013/09/22/article1792010.ece”
[4]. Physicians (per 1,000 people). World HealthOrganization's Global Health Workforce Statistics,OECD, supplemented by country data.
[5]. Bhattacharya SK. Progress in the prevention andcontrol of diarrhoeal diseases since Independence.National Medical Journal of India. 2003
[6]. Child Health Program in India. Ministry of Health andFamily Welfare
[7]. Tyagi BN. A review of diarrhoeal disease controlprogram in India. Health and Population: Perspectivesand Issues. 1983 Oct-Dec.
[8]. Public Health –Bankura. Chapter 4. Gazet “http://www. bankura.nic.in/Gazet/Chapter_4.PDF”
[9]. Outcome Budget of Ministry of Drinking Water andSanitation 2013-14. Ministry of Drinking Water andSanitation. Government of India
[10]. Total Sanitation Campaign. “http://rural.nic.in/ sites/TSC.asp”
[11]. Total Sanitation Campaign – Success Stories“http://rural.nic.in/sites/downloads/our-schemes-glance/ TSCSuccessStories.pdf”
[12]. Salient Features of TSC. http://rural.nic.in/sites/downloads/ our-schemes-glance/SalientFeatures TSC.pdf
[13]. Glimpses of IDSP Works, West Bengal.[14]. Acharya S K , Madan Kaushal, Gupta Datta S, and
Panda S K, “Viral Hepatitis in India”, The NationalMedical Journal of India, Vol: 19, No. 4 July/ August2006, Special Series: Communicable Diseases.
[15]. Vashishtha V M and Kumar P, “50 years ofImmunization in India: Progress and Future”, IndianPediatr 2013, 50:111-118 available at www.indianpediatrics.net/jan2013/jan-111-118.htm. Accessed onMay11, 2015.
[16]. National Vector Borne Disease Control Programme(NVBDCP). http://nvbdcp.gov.in/
[17]. National Drug Policy on Malaria –2013. NationalVector Borne Disease Control Programme. DirectorateGeneral of Health Services. Ministry of Health andFamily Welfare.
[18]. Annual Report 2014-15: National Vector BorneDisease Control Programme. Government of India.National Vector Borne Disease Control Programme.Directorate General of Health Services. Ministry ofHealth and Family Services.