36
© 2016 LMC International. All rights reserved. www.lmc.co.uk Where are agricultural prices heading? AGIC, Melbourne July 2016

© 2016 LMC International. All rights reserved. www.lmc.co.uk
Whereareagriculturalpricesheading?AGIC,Melbourne
July2016

Agricultural prices went up from 2003-2013. Why?
Agricultural prices went down from 2013-16. Why?
What happens next?

© 2016 LMC International. All rights reserved. AGIC, Melbourne, July 2016
From 2005, almost all crop prices moved to a much higher level than average, but they have come down since 2013.
Indexedworldpricesforvariousmajorcrops
3
0
30
60
90
120
150
180
210
2000 2002 2004 2006 2008 2010 2012 2014 2016
Inde
x: A
vera
ge p
rices
200
0-20
13 =
100
Corn/Maize Soybeans Rapeseed Wheat
Understandingtheriseandfallinprices

Whydidpricesrise?1.Weneededmuchmorefarmland

© 2016 LMC International. All rights reserved. AGIC, Melbourne, July 2016
This is the change in the world’s arable area since 1980: no change at all from 1980 to 2002!
Changeinworldarableareavs.1980
6
-20
0
20
40
60
80
100
120
1981 1985 1989 1993 1997 2001 2005 2009 2013
Are
a ch
ange
(mill
ion
hect
ares
)

© 2016 LMC International. All rights reserved. AGIC, Melbourne, July 2016
After 2002, the total world arable area changed dramatically.
Changeinworldarableareavs.1980
7
-20
0
20
40
60
80
100
120
1981 1985 1989 1993 1997 2001 2005 2009 2013
Are
a ch
ange
(mill
ion
hect
ares
)

© 2016 LMC International. All rights reserved. AGIC, Melbourne, July 2016
If we split the total into oil and grain crops, another story emerges. To 2002, oil crop area was displacing grain crop area, leaving the total area largely unchanged.
Changeinoilandgraincropareasvs.1980
8
-100
-50
0
50
100
150
1982 1986 1990 1994 1998 2002 2006 2010 2014
Tota
l are
a ch
ange
sinc
e 19
81, m
illio
n ha
.
Change since 1981 for oil crops Change since 1981 for grain

© 2016 LMC International. All rights reserved. AGIC, Melbourne, July 2016
After 2003, oil crops continued their previous upward trajectory, adding global area each year.
Changeinoilandgraincropareasvs.1980
9
-100
-50
0
50
100
150
1982 1986 1990 1994 1998 2002 2006 2010 2014
Tota
l are
a ch
ange
sinc
e 19
81, m
illio
n ha
.
Change since 1981 for oil crops Change since 1981 for grain

© 2016 LMC International. All rights reserved. AGIC, Melbourne, July 2016
However, there was a profound change in direction of the world grain crop area around 2003. With both sectors expanding, total arable area exploded.
Changeinoilandgraincropareasvs.1980
10
-100
-50
0
50
100
150
1982 1986 1990 1994 1998 2002 2006 2010 2014
Tota
l are
a ch
ange
sinc
e 19
81, m
illio
n ha
.
Change since 1981 for oil crops Change since 1981 for grain

Whydidweneedsomuchmoreland?
© 2016 LMC International. All rights reserved. AGIC, Melbourne, July 2016
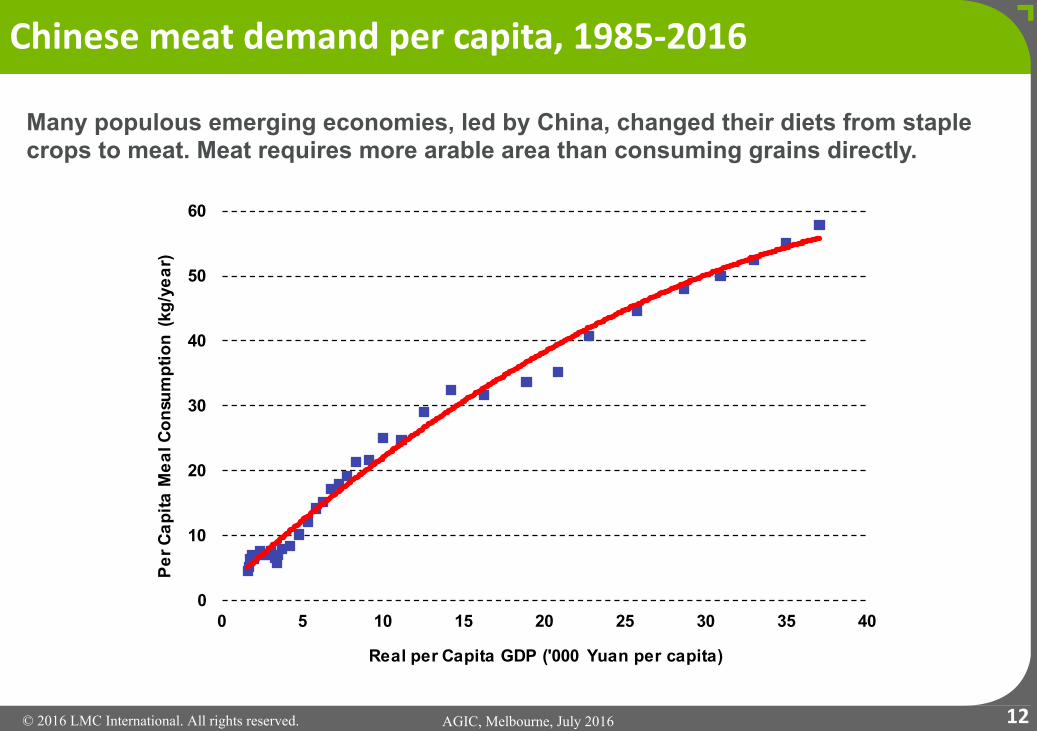
Many populous emerging economies, led by China, changed their diets from staple crops to meat. Meat requires more arable area than consuming grains directly.
Chinesemeatdemandpercapita,1985-2016
12
0
10
20
30
40
50
60
0 5 10 15 20 25 30 35 40
Per C
apita
Mea
l Con
sum
ptio
n (k
g/ye
ar)
Real per Capita GDP ('000 Yuan per capita)

© 2016 LMC International. All rights reserved. AGIC, Melbourne, July 2016
For example, China was a major maize/corn exporter but became a large importer by 2010. Production could not keep pace with feed demand.
Chinesenetexportsofmaize(i.e.negativeisimports)
13
-6
-3
0
3
6
9
12
15
18
2000 2002 2004 2006 2008 2010 2012 2014
Net e
xpor
ts o
f cor
n, m
illio
n to
nnes

© 2016 LMC International. All rights reserved. AGIC, Melbourne, July 2016
Since 2010, Chinese maize/corn imports have levelled out. This helps explain the market turnaround since 2012/3.
Chinesenetexportsofmaize(i.e.negativeisimports)
14
-6
-3
0
3
6
9
12
15
18
2000 2002 2004 2006 2008 2010 2012 2014
Net e
xpor
ts o
f cor
n, m
illio
n to
nnes

© 2016 LMC International. All rights reserved. AGIC, Melbourne, July 2016
Another example: China now imports 60% of the world’s soybeans, almost all for animal feed.
Chinesesoybeanandrapeseedimports
15
0
10
20
30
40
50
60
70
80
90
2000 2002 2004 2006 2008 2010 2012 2014
Mill
ion
tonn
es o
f oils
eeds
Soybean Rapeseed

© 2016 LMC International. All rights reserved. AGIC, Melbourne, July 2016
Which crops have increased their area most since 2000?
Totalchangeinworldareaofselectedcropssince2000
16
0 5 10 15 20 25 30 35 40
Corn
Soybean
Rice
Rapeseed
Oil Palm
Wheat
Sugarcane
Peanut
Million hectares

© 2016 LMC International. All rights reserved. AGIC, Melbourne, July 2016
The dominant feed crops accounted for most of the world area expansion from 2000. But is it just for feed?
Totalchangeinworldareaofselectedcropssince2000
17
0 5 10 15 20 25 30 35 40
Corn
Soybean
Rice
Rapeseed
Oil Palm
Wheat
Sugarcane
Peanut
Million hectares

Whydidpricesrise?2.Wedecidedtoturnfoodintofuel

© 2016 LMC International. All rights reserved. AGIC, Melbourne, July 2016
Nearly 20% of the world’s corn (maize) is now used for fuel.
Totalandnon-fueluseofcorn/maize
19
400
500
600
700
800
900
1,000
1980 1983 1986 1989 1992 1995 1998 2001 2004 2007 2010 2013
Mill
ion
tonn
es
Total Consumption Non-Fuel Consumption

© 2016 LMC International. All rights reserved. AGIC, Melbourne, July 2016
Global food and non-food use of vegetable oils, 1980-2015
Totalandfooduseofvegetableoils
20
20
40
60
80
100
120
140
160
180
1980 1983 1986 1989 1992 1995 1998 2001 2004 2007 2010 2013
Mill
ion
tonn
es
Total Consumption Food Use Consumption

© 2016 LMC International. All rights reserved. AGIC, Melbourne, July 2016
Food and feed demand for all major crops expanded faster in the 2000s than in the 1990s.
Changeindemandduringdecadeforallmajorcrops
21
0
20
40
60
80
100
120
140
160
180
Food Feed Fuel
Gro
wth
per
dec
ade,
mill
ion
tonn
es
1990s 2000s

© 2016 LMC International. All rights reserved. AGIC, Melbourne, July 2016
But the most dramatic change was in fuel demand for crops, which added a vital third element to demand for crops in the 2000s.
Changeindemandduringdecadeforallmajorcrops
22
0
20
40
60
80
100
120
140
160
180
Food Feed Fuel
Gro
wth
per
dec
ade,
mill
ion
tonn
es
1990s 2000s

© 2016 LMC International. All rights reserved. AGIC, Melbourne, July 2016
If we look at the annual % growth in demand by end-use category…
Annual%changeindemandforallcrops
23
0%
5%
10%
15%
20%
25%
Food Feed Fuel
Annu
al p
erce
ntag
e gr
owth
1990s 2000s 2010s

© 2016 LMC International. All rights reserved. AGIC, Melbourne, July 2016
If we look at the annual % growth in demand by end-use category…the impact of the “biofuel decade” in the 2000s is clear.
Annual%changeindemandforallcrops
24
0%
5%
10%
15%
20%
25%
Food Feed Fuel
Annu
al p
erce
ntag
e gr
owth
1990s 2000s 2010s

© 2016 LMC International. All rights reserved. AGIC, Melbourne, July 2016
If we look at the annual % growth in demand by end-use category…the impact of the “biofuel decade” in the 2000s is clear. This effect has now declined.
Annual%changeindemandforallcrops
25
0%
5%
10%
15%
20%
25%
Food Feed Fuel
Annu
al p
erce
ntag
e gr
owth
1990s 2000s 2010s

Theirrationaleconomicsofbiofuels

© 2016 LMC International. All rights reserved. AGIC, Melbourne, July 2016
How much more do you want to pay for your fuel?
Pricesofmajorbiodieselfeedstocksvs.Brentcrudeoil
27
200
400
600
800
1,000
1,200
1,400
1,600
Jan-07 Jan-08 Jan-09 Jan-10 Jan-11 Jan-12 Jan-13 Jan-14 Jan-15 Jan-16
EU p
rices
, US
$ pe
r ton
ne
Brent Crude Soy oil Rapeseed oil Palm oil

© 2016 LMC International. All rights reserved. AGIC, Melbourne, July 2016
Let’s revisit our opening diagram of indexed world arable crop prices, adding palm oil.
Indexedpricesofmajorcrops
28
0
30
60
90
120
150
180
210
Jan-00 Jul-01 Jan-03 Jul-04 Jan-06 Jul-07 Jan-09 Jul-10 Jan-12 Jul-13 Jan-15
Inde
x: A
vera
ge p
rices
200
0-20
13 =
100
Corn/Maize Soybeans RapeseedPalm Oil Wheat Brent Crude

© 2016 LMC International. All rights reserved. AGIC, Melbourne, July 2016
Biofuels have tied almost all crop prices to the price of petroleum.
IndexedpricesofmajorcropsandBrentcrudeoil
29
0
30
60
90
120
150
180
210
Jan-00 Jul-01 Jan-03 Jul-04 Jan-06 Jul-07 Jan-09 Jul-10 Jan-12 Jul-13 Jan-15
Inde
x: A
vera
ge p
rices
200
0-20
13 =
100
Corn/Maize Soybeans RapeseedPalm Oil Wheat Brent Crude

Sowhydidcroppricesfallfrom2013?

© 2016 LMC International. All rights reserved. AGIC, Melbourne, July 2016
We linked crop prices to energy prices, so when the price of petroleum falls, crop prices had to fall in line.
Brentcrudeoilprice
31
0
20
40
60
80
100
120
140
Jan-00 Jan-02 Jan-04 Jan-06 Jan-08 Jan-10 Jan-12 Jan-14 Jan-16
US$
per b
arre
l

© 2016 LMC International. All rights reserved. AGIC, Melbourne, July 2016
The world developed enough new crop land to meet demand. The total additions are now levelling out.
Changeinareaofmajorcropsvs.2006
32
0
10
20
30
40
50
60
70
80
2006 2007 2008 2009 2010 2011 2012 2013 2014 2015 2016
Chan
ge in
are
a ha
rves
ted
sinc
e 20
05
Wheat Soybean Corn Rapeseed

Whathappensnext?

© 2016 LMC International. All rights reserved. AGIC, Melbourne, July 2016
After the general exuberance of the biofuel decade, we may be entering a period like the 1990s, when the market was more selective about which crops it wanted to expand. Has the “protein decade” begun?
Soybeanareaas%ofcombinedsoybean/palmoilarea
34
85%
86%
87%
88%
89%
90%
91%
92%
93%
1961 1967 1973 1979 1985 1991 1997 2003 2009 2015
Soyb
ean
area
as
% o
f tot
al s
oy+
oil p
alm
are
a

© 2016 LMC International. All rights reserved. AGIC, Melbourne, July 2016
Singapore16 Collyer Quay #21-00
Singapore 049318Singapore
T +65 6818 9231
This presentation and its contents are to be held confidential by the client, and are not to be disclosed, in whole or in part, in any manner, to a third party without the prior written consent of LMC International.
While LMC has endeavoured to ensure the accuracy of the data, estimates and forecasts contained in this presentation, any decisions based on them (including those involving investment and planning) are at the client’s own risk.
LMC International can accept no liability regarding information analysis and forecasts contained in this presentation.
© LMC International, 2016All rights reserved
New York1841 Broadway
New York, NY 10023USA
T +1 (212) 586-2427F +1 (212) 397-4756
Oxford 4th Floor, Clarendon House
52 Cornmarket StreetOxford OX1 3HJ
UK
T +44 1865 791737F +44 1865 791739
Kuala LumpurB-03-19, Empire Soho
Empire SubangJalan SS16/1, SS1647500 Subang Jaya
Selangor Darul EhsanMalaysia
T +603 5611 9337
www.lmc.co.uk

Formoreinformation,pleasevisitwww.lmc.co.uk


