Where Country Meets The City Where Country Meets The City PLANSCAPE BUILDI G COMMUNITY THROUGH PLANNING N APPENDICES August 15, 2003 City of Hamilton Agricultural Economic Impact & Development Study
Transcript
Where Country
Meets The City
Where Country
Meets The City
PLANSCAPE
BUILDI G COMMUNITY THROUGH PLANNINGN
APPENDICES
August 15, 2003
City of Hamilton
Agricultural Economic Impact & Development Study
PLANSCAPE
BUILDI G COMMUNITY THROUGH PLANNINGN
CITY OF HAMILTON
AGRICULTURAL ECONOMIC IMPACT & DEVELOPMENT STUDY
P LANSCAPE
Bracebridge, Ontario
In association with:
Regional Analytics Inc.Burlington, Ontario
Riley & AssociatesMilford Bay, Ontario
DBH Soil Services Inc.Kitchener, Ontario
August 15, 2003
Dr. Betsy DonaldPhD, MCIP, RPPKingston, Ontario
Hamilton-Wentworth Federation of Agriculture
This project is funded in part by the Government of Canada’sLocal Labour Market Partnerships Program.
“The opinions and interpretations in this publication are those of the authorand do not necessarily reflect those of the Government of Canada.”
City of HamiltonAgricultural Economic Impact & Development Study
The City of Hamilton gratefully acknowledges the financial contributions of thefollowing:
Government of Canada
Hamilton Training Advisory Board
Hamilton-Wentworth Federation of Agriculture
City of Hamilton Agricultural Economic Impact and Development Study
August 15, 2003 PLANSCAPE – Building Community through Planning
CITY OF HAMILTON
AGRICULTURAL ECONOMIC IMPACT AND DEVELOPMENT STUDY
APPENDICES LIST
Appendix 1 – Steering Committee Members and Funding Partners Appendix 2 – Farming Survey and Questionnaire Analysis Appendix 3 – Income and Expense Survey of Agricultural Sectors Appendix 4 – An Economic Impact Analysis of Agricultural Production in the City of
Hamilton Appendix A – Input Profiles by Commodity Groups Appendix B – Output Profiles by Commodity Groups
Appendix C – Impact Summaries by Commodity Group across all Sectors of the Hamilton Economy
Appendix 5 – Canada Land Inventory Classifications Appendix 6 – Excerpts from Ontario Regulations 282/98 Farmlands Property Class
Criteria Appendix 7 – Excerpts from Severance Activity in Ontario’s Agricultural Land 1990 to
2000 (Dr. Wayne Caldwell and Claire Weir, School of Rural Planning, University of
Guelph) Appendix 8 – Agriculturally Related Businesses
APPENDIX 1Steering Committee Members and
Funding Partners
City of Hamilton Agricultural Economic Impact and Development Study Page A1.1
August 15, 2003 PLANSCAPE – Building Community through Planning
APPENDIX 1
CITY OF HAMILTON AGRICULTURAL ECONOMIC IMPACT & DEVELOPMENT STUDY
STEERING COMMITTEE MEMBERS
Susan Coverdale, Co-ordinator City of Hamilton
Liz Robinson/Judy Travis Hamilton Training Advisory Board
Henry Swierenga Ontario Federation of Agriculture
Carol Pupo Ontario Ministry of Agriculture and Food
Bob Campbell Rockton Agricultural Society
Marjorie Tregunno Wentworth District Women’s Institute
Nancy Mills Wentworth District Women’s Institute
Philip Krakar, President Hamilton-Wentworth Federation of Agriculture
Robert Pasuta Hamilton-Wentworth Pork Producers
Roy Shuker Wentworth Corn Producers & Wentworth Wheat Producers
Gary Comley Wentworth Soil and Crop Improvements Binbrook Agricultural Society Kathy Smith Ancaster Agricultural Society
City of Hamilton Agricultural Economic Impact and Development Study Page A1.2
August 15, 2003 PLANSCAPE – Building Community through Planning
FUNDING PARTNERS
City of Hamilton Human Resources Development Canada Hamilton Training Advisory Board Hamilton-Wentworth Federation of Agriculture (HWFA)
HWFA Supporting Partners
South-Wentworth Plowmen’s Association
North-Wentworth Plowmen’s Association
Wentworth Niagara Guernsey Club
Wentworth Cattlemen’s Association
Hamilton-Wentworth Pork Producers
Hamilton-Niagara Ayrshire Club
Golden Horseshoe Jersey Club
Agri-Food Awareness Program
Hamilton-Wentworth 4H Association
Halton-Wentworth Growers Association
Wentworth Soil and Crop Improvement
Wentworth Corn Producers
Wentworth Wheat Producers
Brant-Wentworth Holstein Club
Wentworth Dairy Producers
Wentworth District Women’s Institute
Ancaster Agricultural Society
Binbrook Agricultural Society
Rockton Agricultural Society
Ministry of Agriculture, Food and Rural Affairs,
Ontario Federation of Agriculture
APPENDIX 2Farming Survey and Questionnaire
Analysis
104 Kimberley Ave., Bracebridge, ON P1L 1Z8 / T 705.645.1556 / F 705.645.4500 / E [email protected] / www.planscape.ca
PLANSCAPE BUILDING COMMUNITY THROUGH PLANNING MARGARET RICHARD WALTON HUNTER MPI. MCIP RPP MCIP RPP
August 2, 2002 Dear Sir/Madam: As you may be aware, the Hamilton Wentworth Federation of Agriculture and the City of Hamilton have joined forces to conduct a study entitled The Agriculture Economic Impact and Development Study. This study is to identify the importance of agriculture in the City and to ensure that the conditions exist for it to flourish and prosper. We are asking for your co-operation in completing the enclosed confidential survey. The goal of our research is to contribute to the sound planning of agricultural land in the City, to ensure that adequate protection and attention are given to existing agricultural activities, and to take future agricultural needs into account. The study’s success depends on our ability to understand the City’s agricultural community and the current economic development and trends within the industry. Within the next week, a member of the consulting team will be calling you to arrange a time when it would be convenient to complete the survey over the telephone. We are providing the questionnaire in advance so you will be aware of its nature when you receive the call. All information collected through this survey will be handled with the strictest confidence. No individual’s identity will be revealed in the presentation of results. Our report will present an aggregate overview of current trends and practices. The information we are gathering does not currently exist, so this is not an update of available information. Hence, your participation is vital to the success of the study. We have tried to keep the length of the survey to a bare minimum. Please call 1-800-363-2432 if you have any questions about its contents. A list of the Steering Committee members is also enclosed should you wish to discuss this with them. Thank you in advance for your assistance with this study. The results are scheduled to be available through the City and the Federation of Agriculture in November of this year. Yours truly, PLANSCAPE Margaret Walton Margaret Walton, M.PI., MCIP, RPP Planning Consultant
HAMILTON AGRICULTURAL STUDY FARMING SURVEY
HAMILTON QUESTIONNAIRE - 1 - FINAL 02/05/22
1) Location: Lot/Concession: Township/Former Municipality: 911/ Municipal Address: 2) Ownership Type: Sole Proprietorship Corporate Rent/Lease
Partnership 3) What is the total size of your farming operation? __________(Total Acres) Land in Crops _______(Acres) Rented __________ Area of Greenhouses _______(Acres) Owned __________ Number of Greenhouses _______ 4a) Do you farm any rental properties? Yes No If yes, Location (in relation to home farm) Within 1 Mile 5 Miles 10 Miles Outside City of Hamilton Please Specify Municipality ____________________________ 4b) How many parcels are rented? __________(#) 4c) How many landlords? __________(#) 4d) Is your home farm in the City of Hamilton? Yes No 4e) For your rental properties please indicate the type of rental agreement: Annual Lease 5 + (Long Term) 1-5 Year (Short Term) Informal Arrangement 5) How long have you been farming? ___________ Years 6a) How many generations has your family farmed? ___________ generations 6b) How many generations of your family have farmed this property? ___________ generations 7a) Do you have family members working on the farm? Yes No Number___________ 7b) In what capacity are they working? Full Time Part Time Unpaid Other ____________ 8a) Are members of the next generation working on the farm? Yes No 8b) In what capacity are they working? Full Time Part Time Unpaid Other ____________ 9) Is the next generation taking over the farming operation? Yes No Maybe 10) Do you have a succession plan? Yes No
HAMILTON AGRICULTURAL STUDY FARMING SURVEY
HAMILTON QUESTIONNAIRE - 2 - FINAL 02/05/22
11a) Is farming your full time occupation? Yes No 11b) Is farming your spouse’s full time occupation? Yes No If No, what percentage of your family income is generated off the farm? _______________% 12a) What is the type of work that is done by you off site? Skilled (Trade) Unskilled Professional 12b) What is the type of work that is done by your spouse off site? Skilled (Trade) Unskilled Professional 13) Number of employees (include yourself & spouse) Full Time (Year Round) Full Time (Seasonal) Part Time (Year Round) Part Time (Seasonal) 14) Do you have a problem finding employees? Yes No 15) Do you have a problem with employee turnover? Yes No If yes, please specify _______________________________________________________________________ 16) Please indicate what type of labour requirements are needed? Specialized (Skilled) Please Specify __________________________________________________________ Labourers Farm Experience Other (Please Specify) ________________________________________________________ 17a) Do you hire offshore (migrant) labourers? Yes No How many _______________ 17b) If yes, Where do they come from?____________________________________________________________ 17c) Why do you hire offshore (migrant) labourers? ______________________________________________ 17d) Are they the same people year after year? Yes No 17e) Are they from the same places year after year? Yes No What jobs are they hired for?
17f) Is the availability of migrant laborers important to the success of your operation? Yes No 18) Do you provide staffing accommodations for: other workers, offshore workers? (Other) Yes No (Offshore) Yes No
HAMILTON AGRICULTURAL STUDY FARMING SURVEY
HAMILTON QUESTIONNAIRE - 3 - FINAL 02/05/22
19a) What educational background do you have? __________________________________________________ ________________________________________________________________________________________________
19b) What educational background do your employees have? Offshore (migrant)__________________________________________________________________________ Casual__________________________________________________________________________________ Full Time_________________________________________________________________________________ 19c) What on-going training do you need to operate your farm? ______________________________________
19d) What skills would you require new employees to possess? _____________________________________
19e) Would apprenticeship or co-op programs be of interest to you? Yes No If yes, what type? _________________________________________________________________________
19f) What Level? High school Post Secondary 20a) What type of farming operations do you run? (Please indicate by % all that apply) (Note These are the categories provided by Statistics Canada) Dairy _____% Wheat _____% Vegetable _____% Cattle (Beef) _____% Grain & Oilseed _____% Miscellaneous Specialty _____% Hog _____% Field Crop _____% Livestock Combination _____% Poultry & Egg _____% Fruit _____% Other Combination _____% 20b) If you choose Grain & Oilseed, Field Crop, Fruit, Vegetable, Miscellaneous Specialty or Livestock Combination please elaborate further: (Continues onto next page) Grain & Oilseed Miscellaneous
Specialty Livestock
Combination
Oilseed _______%
Sheep & Lamb _____% Cattle & Hog _____%
Grain Corn _______%
Goat _____% Cattle, Hog & Sheep _____%
Dry Field pea & bean _______%
Horse & Pony _____% Other Combination _____%
Small Grain (except wheat) _______%
Fur _____%
Other Animal Specialty _____% Field Crop Mushroom _____% Hay & Other Fodder Crop _______
_____________________ _____% _______________________ _____% _____________________ _____% _______________________ _____% _____________________ _____% _______________________ _____% 20c) If you chose any of the following under Miscellaneous Specialty, please breakdown further. Other Animal Specialty
___________________ _______%
_______________________
_____%
___________________
_______%
_______________________
_____%
Greenhouse Product(s)
___________________ _______%
_______________________
_____%
___________________
_______%
_______________________
_____%
Other Horticultural Specialty
___________________ _______%
_______________________
_____%
___________________
_______%
_______________________
_____%
21a) Do you export any of your products outside of the City of Hamilton? Yes No 21b) If yes, please outline the percentages for the following areas Out of the City (former region) __________% U.S./Mexico ____________% Out of the Province __________% Off Continent ____________% 22) Who buys your products? Please indicate the location and industry/sector of your three (3) most important agricultural and agricultural-related customers (by $ volume) Location (city/province/state) Industry/sector (e.g. feed dealers etc.) Volume ($) _________________________
________________________________
$________________
_________________________
________________________________
$________________
23a) Do you have contracts with specific firms/industries for products? Yes No 23b) If yes, please check one of the following: One principal firm Co-op Variety of firms 24) Do the commodities you supply come under a marketing board? Yes No If yes, do you use the marketing board? Yes No
HAMILTON AGRICULTURAL STUDY FARMING SURVEY
HAMILTON QUESTIONNAIRE - 5 - FINAL 02/05/22
25a) Do you import goods & services from outside the City of Hamilton? Yes No If yes, please outline the percentages for the following areas Out of the City (former region) __________% U.S./Mexico ____________% Out of the Province __________% Off Continent ____________% 25b) What goods & services do you import? _____________________________________________
______________________________________________
_____________________________________________
______________________________________________
25c) If the goods or services were available locally, would you purchase them locally? Yes No 26) Where do you buy your machinery and equipment? Please list the three most important types of agriculture-related machinery and equipment (e.g. tractors, tillage equipment, milking systems, etc.) purchased for use at your business, by type. Please also indicate the location of the supplier of the machinery or equipment and the approximate value (by $ volume) for each. Type of machinery/equipment Location of suppliers (city): Volume _________________________
________________________________
$________________
_________________________
________________________________
$________________
27) Where do you purchase your services? Please list the three most important types of agricultural-related services (e.g. financial services, crop consultation services, vet services) for use at your business, by type. Please also indicate the location of your service provider. Type of service Location of service provider (city) ________________________________________
_____________________________________________
________________________________________
_____________________________________________
28) Please indicate if you use any outside services/expertise- (research) information or new products, etc? OMAFRA Associations/Federations College/University Staff Federal Agencies Private Consultants Industry Suppliers Other Provincial Agencies (Please Specify) _________________________________________ 29) In general, how important to the success of your business are the following types of marketing (1 is “not important”, 5 is “extremely important”, circle number) Self marketing 1 2 3 4 5 Marketing Organizations 1 2 3 4 5 Marketing Agencies 1 2 3 4 5 Marketing Boards 1 2 3 4 5 Other (explain)_______________ 1 2 3 4 5
30) What assistance do you feel you need to improve the marketing of your products? ______________________________________________
______________________________________________
______________________________________________
______________________________________________
HAMILTON AGRICULTURAL STUDY FARMING SURVEY
HAMILTON QUESTIONNAIRE - 6 - FINAL 02/05/22
31a) Do you have on site processing? Yes No 31b) If Yes, What type? Packaging (Wholesale) Consumer Ready Product (Retail) 31c) Do you provide any of the following services on your farm? Tours (Agri Education) Wholesale Directly to retailers Farm gate sales Bed & Breakfasts Farmers’ market Pick your own Customer Delivery Restaurant Other (Please Specify) ___________________________________________________________ 31d) To what extent?__________________________________________________________________________ 32) Has there been a significant shift in production during the time you have managed the farm? Yes No If yes, what are the significant shifts?_____________________________________________________ 33) Do you have plans to expand your farming operation within the next 5 years? Yes No If yes, please specify _____________________________________________________________ 34) Over the next 5 years are you planning to reduce the size of your operation? Yes No If yes, please specify _____________________________________________________________ 35) What are the major issues/constraints related to your farming operation. Urban encroachment (Right to Farm) Transportation (To Markets) Land Use Regulations Availability of Support Services Issues with neighbours Veterinary Availability of Skilled workers Equipment Availability of Unskilled workers Financial (Banking) Marketing Support Other (Please Specify) Best management practice requirements Insurance Income from farming Price Quota Other Issues (Please Specify) __________________________________________________ 36) Would you like to provide any further Comments/Issues/Concerns?
City of Hamilton Agricultural Economic Impact and Development Study Farmer Survey – Questionnaire Analysis Page A2.1
August 15, 2003 PLANSCAPE – Building Community through Planning
INTRODUCTION As part of the overall agricultural study, a survey of farm operators was undertaken. A total of 94 responses were received to the survey. A total of 318 surveys were mailed. This represents a 29.6 % response. The purpose of the survey was to obtain information on a variety of characteristics of the farming community, including identification of business practices and opportunities. A copy of the survey and the covering letter are attached at the end of this Appendix. The appendix provides a breakdown of the responses to the various questions, with brief statements to further explain the tables and charts. OVERVIEW OF SURVEY RESULTS The following provides a breakdown of the results of the surveys. While a total of 94 responses were received, not all questions were answered in each instance. Where this has occurred, rather the analysis has been completed on the basis of the number of respondents that answered the particular question. As such, the total number of respondents may vary for each question.
City of Hamilton Agricultural Economic Impact and Development Study Farmer Survey – Questionnaire Analysis Page A2.2
August 15, 2003 PLANSCAPE – Building Community through Planning
0.0
10.0
20.0
30.0
40.0
50.0
60.0
Perc
enta
ge (%
)
Flamborough Glanbrook Ancaster Unknown Stoney Creek Dundas
Response Frequency Percentage (%)Flamborough 51 54.3Glanbrook 15 16.0Ancaster 9 9.6Unknown 9 9.6Stoney Creek 8 8.5Dundas 2 2.1Total 94 100.0
Question 1: Location COMMENTS: The majority of respondents (54.3%) are from Flamborough, followed by Glanbrook (16.0%), and Ancaster (9.6%). This distribution is generally reflective of the overall farming community in Hamilton, as noted in the 2001 Census information, although respondents from Glanbrook tend to be under-represented.
City of Hamilton Agricultural Economic Impact and Development Study Farmer Survey – Questionnaire Analysis Page A2.3
August 15, 2003 PLANSCAPE – Building Community through Planning
Sole Proprietorship Corporate Rent/Lease Partnership
Question 2: Ownership Type: COMMENTS: This question asked the respondents to identify the ownership type of their farming operation. Over ½ of the respondents operate as sole proprietorship (52.1%), usually representing a family ownership. This is followed by 26.6% that operate as partnerships. Only 18% of respondents indicate that they operate under a corporate structure.
City of Hamilton Agricultural Economic Impact and Development Study Farmer Survey – Questionnaire Analysis Page A2.4
August 15, 2003 PLANSCAPE – Building Community through Planning
Question 3: What is the total size of your farming operation? (differentiate between area owned/rented, and area in crops or used by greenhouses)
Question 3b: Number of Farms (Ownership)
COMMENT: Two thirds of respondents advise that they own the land they farm. Almost one-third also farm rental properties. It is interesting to note that the average size of farm where the farmer is not involved with rental is 81 acres. Farmers that own & rent property have an average size of 264 acres, of which an average 85 acres is owned. The average area rented is 179 acres, over twice the average size of the owned farms.
City of Hamilton Agricultural Economic Impact and Development Study Farmer Survey – Questionnaire Analysis Page A2.5
August 15, 2003 PLANSCAPE – Building Community through Planning
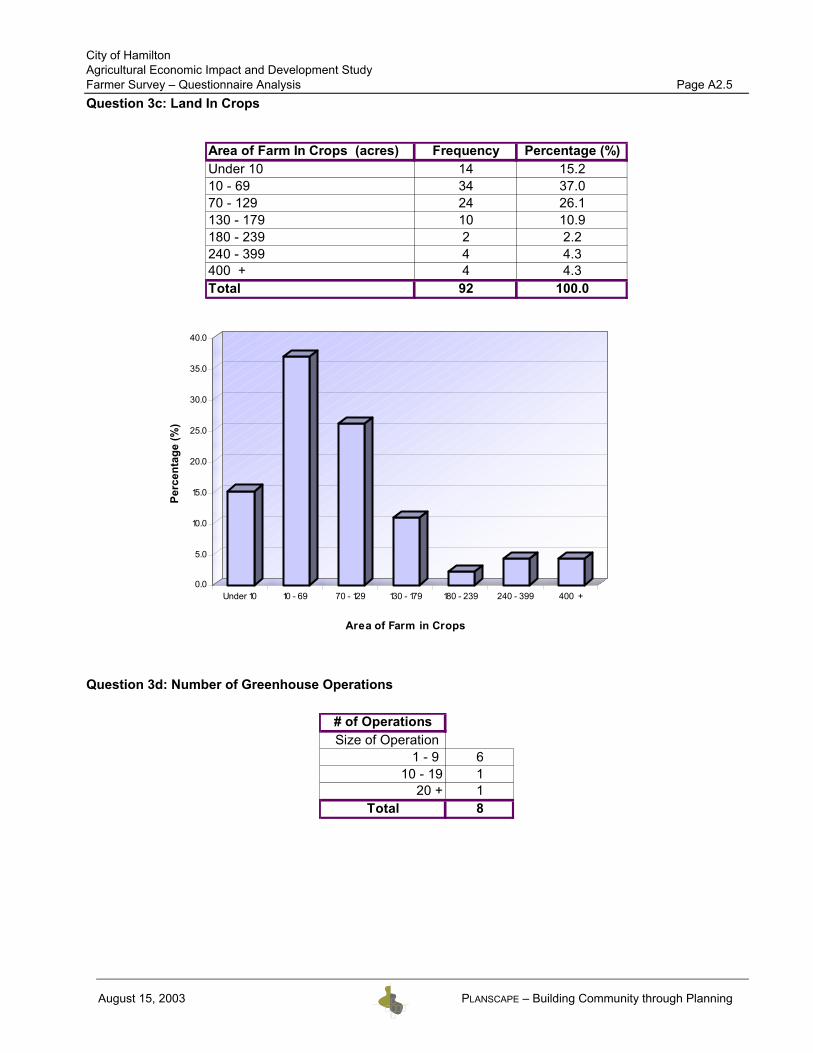
# of OperationsSize of Operation
1 - 9 610 - 19 1
20 + 1Total 8
Area of Farm In Crops (acres) Frequency Percentage (%)Under 10 14 15.210 - 69 34 37.070 - 129 24 26.1130 - 179 10 10.9180 - 239 2 2.2240 - 399 4 4.3400 + 4 4.3Total 92 100.0
A rea o f F arm in C ro ps as a % o f T o tal A creage
Question 3e: Area of farms in Crops as a % of total acreage owned/rented.
City of Hamilton Agricultural Economic Impact and Development Study Farmer Survey – Questionnaire Analysis Page A2.7
August 15, 2003 PLANSCAPE – Building Community through Planning
Response Frequency Percentage (%)Yes 35 37.2No 59 62.8Total 94 100.0
N o62.8%
Yes37.2%
Response Frequency Percentage (%)Within 1 Mile 20 54.15 Miles 9 24.310 Miles 4 10.8Outside City of Hamilton 4 10.8Total 37 100.0
0.0
10.0
20.0
30.0
40.0
50.0
60.0
Perc
enta
ge (%
)
Within 1 M ile 5 M iles 10 M iles Outside City o f Hamilton
Question 4a: Do you farm any rental properties? COMMENTS: Slightly less than two-thirds of respondents do not farm rental properties. If yes, Location (in relation to home farm) Number of parcels exceed number of respondents because some farm operators farm at different locations. COMMENTS: Of the 35 respondents who indicated that they farmed rental properties 20 advised that their rental property was located Within 1 mile of their home farm. Some respondents advised that they farmed more than one rental property, and with having more than one, the location of that property in relation to their home farm, may be different.
City of Hamilton Agricultural Economic Impact and Development Study Farmer Survey – Questionnaire Analysis Page A2.8
August 15, 2003 PLANSCAPE – Building Community through Planning
Response Frequency Percentage (%)Annual Lease 16 38.11-5 Year 6 14.35+ 6 14.3Informal Agreement 14 33.3Total 42 100.0
0.0
5.0
10.0
15.0
20.0
25.0
30.0
35.0
40.0
Perc
enta
ge (%
)
Annual Lease 1-5 Year 5+ Informal Agreement
Rental Agreement
% 50 17.6 8.8 23.4
Sum 17 6 3 8 34
4 + 8 8 20.5
3 1 3 4 11.8
2 1 5 6 17.6
1 16 16 47.11 2 3 4+ Sum %
# of Landlords
# of
Par
cels
R
ente
d
Question 4b & c: How many parcels are rented? How many landlords? COMMENTS: It is common for a farmer renting other farms to have a number of different landlords. Question 4d: Is your home farm in the City of Hamilton? One hundred per cent of the respondents indicated that their home farm was located in the City of Hamilton. Question 4e: For your rental properties please indicate the type of rental agreement: COMMENTS: Thirty-Five respondents indicated that they farmed rental properties. Of those 35 respondents a variety of rental agreements were identified. Some farmers had different agreements with more than one landlord, 16 or 38.1% indicated that they had an annual lease agreement with their landlord. A significant number of respondents also have an informal agreement (14 of 33.3%) with their landlord. Less than 30% of respondents have any long term agreements.
City of Hamilton Agricultural Economic Impact and Development Study Farmer Survey – Questionnaire Analysis Page A2.9
August 15, 2003 PLANSCAPE – Building Community through Planning
Question 5: How long have you been farming? (Years)
COMMENTS: Only 8.8% of respondents have farmed less than 10 years. Over 50% of respondents have farmed for over 30 years, about 18% have farmed for over 50 years. These figures reinforce other statistics indicating that fewer new farmers are entering the labour force and the age of farmers is increasing.
City of Hamilton Agricultural Economic Impact and Development Study Farmer Survey – Questionnaire Analysis Page A2.10
August 15, 2003 PLANSCAPE – Building Community through Planning
# of Generations Frequency Percentage (%)1 21 22.82 14 15.23 22 23.94 12 13.05 8 8.76 10 10.9
7+ 5 5.4Total 92 100.0
0
5
10
15
20
25
Res
pons
e
1 2 3 4 5 6 7+
# of Generations
Question 6a: How many generations has your family farmed? (Generations) COMMENTS: Historically, farming has been a multi-generational family activity. Less than 23% of respondents are first generation farmers, over 77% have been farming at least 2 generations.
City of Hamilton Agricultural Economic Impact and Development Study Farmer Survey – Questionnaire Analysis Page A2.11
August 15, 2003 PLANSCAPE – Building Community through Planning
# of Generations Frequency Percentage (%)1 56 60.22 20 21.53 6 6.54 7 7.55 2 2.26 2 2.2
Total 93 100.0
Question 6b: How many generations has your family farmed this property? (Generations)
COMMENTS: A clear majority, 56 respondents or 60.2%, indicated that they were the first generation farming their particular property. This would indicate that while children have continued farming, they are likely to acquire their own farming operation rather than just taking over the family farm.
0
10
20
30
40
50
60
Res
pons
e
1 2 3 4 5 6
# of Generations
City of Hamilton Agricultural Economic Impact and Development Study Farmer Survey – Questionnaire Analysis Page A2.12
August 15, 2003 PLANSCAPE – Building Community through Planning
Response Frequency Percentage (%)Yes 65 69.1No 29 30.9Total 94 100.0
Question 7a: Do you have family members working on the farm? COMMENTS: A clear majority, 65 respondents or 69.1% advised that they have family members working on their farming operation. This number reinforces the fact that farming, as an occupation, is a family activity. Number of Family Members working on the farming operations COMMENTS: The second part of the question asked the respondents provide how many family members worked on the farm. Of the respondents, which indicated that there were family members, working on the farm 11 respondents did not provide a breakdown of numbers. Of those who responded 27 of the 58 respondents indicated that there was only 1 family member working on the farm. A large number of the respondents (15 or 25.9%) have two family members working on the farm.
City of Hamilton Agricultural Economic Impact and Development Study Farmer Survey – Questionnaire Analysis Page A2.13
August 15, 2003 PLANSCAPE – Building Community through Planning
Response Frequency Percentage (%)Full Time 30 28.8Full Time & Part Time 11 10.6Part Time 32 30.8Full Time & Unpaid 3 2.9Part Time & Unpaid 7 6.7Unpaid 21 20.2Total 104 100.0
0.0
5.0
10.0
15.0
20.0
25.0
30.0
35.0
Perc
enta
ge (%
)
Full Time Full Time & PartTime
Part Time Full Time &Unpaid
Part Time &Unpaid
Unpaid
Question 7b: In what capacity are they working?
COMMENTS: The respondents were then asked to provide information on the work status of their family members. Over 30% of the family members are working on a part time basis; 28.8% of the family members are working full time. Almost 30% of respondents indicated that family members perform unpaid work on the farm.
City of Hamilton Agricultural Economic Impact and Development Study Farmer Survey – Questionnaire Analysis Page A2.14
August 15, 2003 PLANSCAPE – Building Community through Planning
Response Frequency Percentage (%)Yes 49 52.7No 44 47.3Total 93 100.0
Question 8a: Are members of the next generation working on the farm? COMMENTS: Over half (49 of 93) respondents indicated that they had members of the next generation working on the farm. Question 8b: In what capacity are they working?
COMMENTS: The respondents were asked to provide the working status of the members of the next generation who are currently employed. The majority of the family members, 24 respondents or 41.4%, are working on a part time basis. Significantly, 27.6% of the family members are also working on a full time basis, and 29.3% perform unpaid labour.
Yes52.7%
N o47.3%
Response Frequency Percentage (%)Full Time 16 27.6Part Time 24 41.4Unpaid 17 29.3Other 1 1.7Total 58 100.0
0.0
5.0
10.0
15.0
20.0
25.0
30.0
35.0
40.0
45.0
Perc
enta
ge (%
)
Full Time Part Time Unpaid Other
City of Hamilton Agricultural Economic Impact and Development Study Farmer Survey – Questionnaire Analysis Page A2.15
August 15, 2003 PLANSCAPE – Building Community through Planning
Yes37.0%
N o63.0%
Question 9: Is the next generation taking over the farming operation?
COMMENTS: Of the 92 surveys 37 respondents indicated that the next generation may be taking over the farming operation. There was also a significant portion of the respondents (34 or 37%) who indicated that the next generation would not be taking over the farming operation. Question 10: Do you have a succession plan?
COMMENTS: Almost two-thirds of respondents (63.0%) indicated that they do not have a succession plan for their farming operation.
Response Frequency Percentage (%)Yes 34 37.0No 58 63.0Total 92 100.0
City of Hamilton Agricultural Economic Impact and Development Study Farmer Survey – Questionnaire Analysis Page A2.16
August 15, 2003 PLANSCAPE – Building Community through Planning
Response Frequency Percentage (%)Yes 31 41.3No 44 58.7Total 75 100.0
Yes41.3%
N o 58.7%
Question 11a: Is farming your full time occupation? COMMENTS: A clear majority, 70 respondents or 75.3%, advised that farming was their full time occupation. 24.7% of the respondents advised that farming was not their full time occupation. Question 11b: Is farming your spouse’s full time occupation? COMMENTS: 41.3% of respondents indicated that their spouses worked full time on the farm.
Response Frequency Percentage (%)Yes 70 75.3No 23 24.7Total 93 100.0
Yes75.3%
N o24.7%
City of Hamilton Agricultural Economic Impact and Development Study Farmer Survey – Questionnaire Analysis Page A2.17
August 15, 2003 PLANSCAPE – Building Community through Planning
If No, what percentage of your family income is generated off the farm? COMMENTS: A large majority of the respondents whose spouses do not work full time on the farm (24 or 55.8%) indicated that over 60% of their family income was generated off the farm.
% Income Frequency Percentage (%)20% & Less 8 18.621 - 40 5 11.641 - 59 6 14.060+ 24 55.8Total 43 100.0
0.0
10.0
20.0
30.0
40.0
50.0
60.0
Perc
enta
ge (%
)
20% & Less 21 - 40 41 - 59 60+
City of Hamilton Agricultural Economic Impact and Development Study Farmer Survey – Questionnaire Analysis Page A2.18
August 15, 2003 PLANSCAPE – Building Community through Planning
Question 12a: What is the type of work that is done by you off site?
COMMENTS: Of the 23 respondents who indicated that farming was not their full time occupation, 15 respondents or 68.2% indicated that they performed a level of professional work off site.
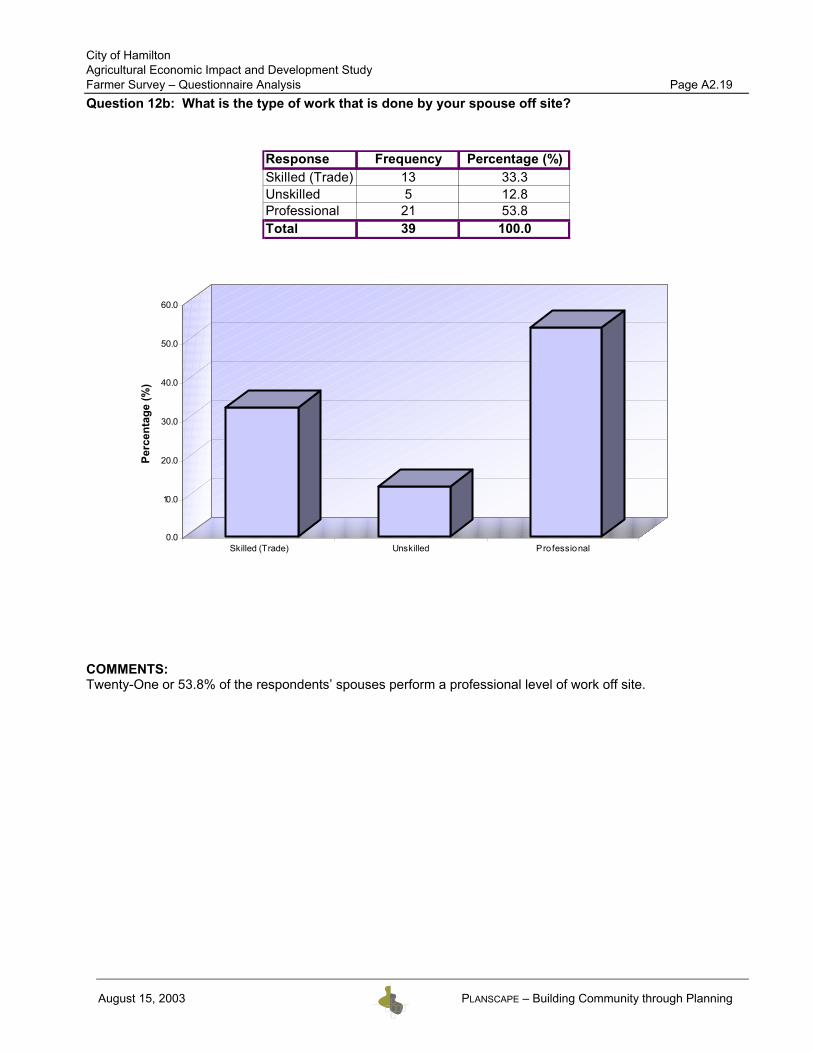
Question 12b: What is the type of work that is done by your spouse off site?
COMMENTS: Twenty-One or 53.8% of the respondents’ spouses perform a professional level of work off site.
0.0
10.0
20.0
30.0
40.0
50.0
60.0
Perc
enta
ge (%
)
Skilled (Trade) Unskilled Professional
City of Hamilton Agricultural Economic Impact and Development Study Farmer Survey – Questionnaire Analysis Page A2.20
August 15, 2003 PLANSCAPE – Building Community through Planning
Response Frequency Percentage (%)Yes 23 27.1No 62 72.9Total 85 100.0
# of Employees 1 - 2 3 - 8 10 - 19 20 + Total %Full Time (Year Round) 35 82 19 55 191 31.6Part Time (Year Round) 16 39 7 15 77 12.7Full Time (Seasonal) 1 8 18 131 158 26.2Part Time (Seasonal) 5 79 24 70 178 29.5Total # of Employees 57 208 68 271 604 100.0# of Respondents 36 45 5 4 90
Question 13: Number of employees (include yourself & spouse) COMMENTS: A total of 604 employees were noted from the 90 respondents. The number of employees from 1-2 persons to 192, with an average of 6.7 employees per farm. 3.16% of employees are listed as full time (year round) with the balance in various seasonal and part time positions. Over 55% of employees are employed on a seasonal basis. Question 14: Do you have a problem finding employees? COMMENTS: A majority, 62 respondents or 72.9%, indicated that they do not have problems finding employees. Significantly, however, over one-quarter of respondents indicated that they do have problems finding employees.
Yes27.1%
N o72.9%
City of Hamilton Agricultural Economic Impact and Development Study Farmer Survey – Questionnaire Analysis Page A2.21
August 15, 2003 PLANSCAPE – Building Community through Planning
Question 15: Do you have a problem with employee turnover? COMMENTS: A clear majority, 62 respondents or 74.7%, advised that they had no problems with employee turnover. One-quarter of respondents have problems with employee turnover. If yes, please specify:
COMMENTS: The respondents who indicated that they had problems with employee turnover were asked to provide reasons why they have a high turnover rate. The 2 main reasons given were that the work performed was only Seasonal Employment, and the Nature of Work (8 responses or 32.0% each).
Response Frequency Percentage (%)Yes 21 25.3No 62 74.7Total 83 100.0
Yes25.3%
N o74.7%
Response Frequency Percentage (%)Seasonal Employment 8 32.0Nature of Work 8 32.0Poor Work Ethics 6 24.0Contracted Positions 1 4.0Lacking Experience 1 4.0Low Wage Levels 1 4.0Total 25 100.0
0.0
5.0
10.0
15.0
20.0
25.0
30.0
35.0
Perc
enta
ge (%
)
SeasonalEmployment
Nature of Work Poor Work Ethics ContractedPositions
Lacking Experience Low Wage Levels
City of Hamilton Agricultural Economic Impact and Development Study Farmer Survey – Questionnaire Analysis Page A2.22
August 15, 2003 PLANSCAPE – Building Community through Planning
Question 16: Please indicate what type of labour requirements are needed? Note: Total exceeds the number of respondents since some indicated more than one need.
COMMENTS: This question encouraged the respondents to provide information on what labour requirements were needed to help run their farming operation. The main type of requirement needed was Labourers (47 responses or 45.6%), followed by employees with farm experience (44 responses or 42.7%) The respondents were asked to elaborate on the specialized requirements that were needed to help run their farming operation, the following information was provided: Equipment Operations (4 responses), Animal Husbandry (2 responses) , Lab Technical Experience, Tree Nursery Experience, Greenhouse Knowledge, Sales Experience, and Horticultural Knowledge,
0.0
5.0
10.0
15.0
20.0
25.0
30.0
35.0
40.0
45.0
50.0
Perc
enta
ge (%
)
Labourers Farm Experience Specialized Other
City of Hamilton Agricultural Economic Impact and Development Study Farmer Survey – Questionnaire Analysis Page A2.23
August 15, 2003 PLANSCAPE – Building Community through Planning
Question 17a: Do you hire offshore (migrant) labourers?
How many?
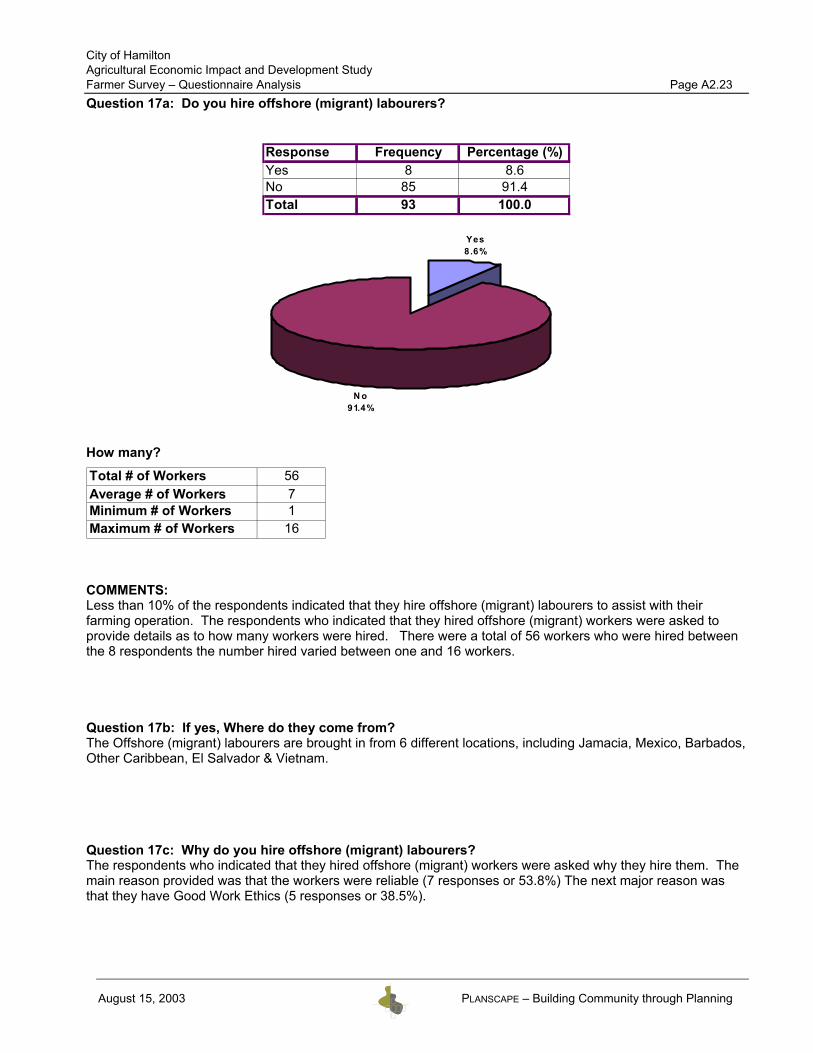
COMMENTS: Less than 10% of the respondents indicated that they hire offshore (migrant) labourers to assist with their farming operation. The respondents who indicated that they hired offshore (migrant) workers were asked to provide details as to how many workers were hired. There were a total of 56 workers who were hired between the 8 respondents the number hired varied between one and 16 workers. Question 17b: If yes, Where do they come from? The Offshore (migrant) labourers are brought in from 6 different locations, including Jamacia, Mexico, Barbados, Other Caribbean, El Salvador & Vietnam. Question 17c: Why do you hire offshore (migrant) labourers? The respondents who indicated that they hired offshore (migrant) workers were asked why they hire them. The main reason provided was that the workers were reliable (7 responses or 53.8%) The next major reason was that they have Good Work Ethics (5 responses or 38.5%).
Response Frequency Percentage (%)Yes 8 8.6No 85 91.4Total 93 100.0
Yes8.6%
N o91.4%
Total # of Workers 56Average # of Workers 7Minimum # of Workers 1Maximum # of Workers 16
City of Hamilton Agricultural Economic Impact and Development Study Farmer Survey – Questionnaire Analysis Page A2.24
August 15, 2003 PLANSCAPE – Building Community through Planning
Question 17d: Are they the same people year after year? The response was unanimous, 100% of the respondents who hire offshore (migrant) workers continue to bring in the same people year after year. Question 17e: Are they from the same places year after year? 100% of the respondents who hired offshore (migrant) labourers bring them in from the same places year after year. What jobs are they hired for? Most of the employees are hired for general labour positions. The other employees are hired for Picking Fruit and Nursery work (12.5% each) Question 17f: Is the availability of migrant labourers important to the success of your operation? COMMENTS: Only 6 respondents (6.5%) advised that offshore (migrant) labourers were important to the success of their operation.
Response Frequency Percentage (%)Yes 6 6.5No 87 93.5Total 93 100.0
Yes6.5%
N o93.5%
City of Hamilton Agricultural Economic Impact and Development Study Farmer Survey – Questionnaire Analysis Page A2.25
August 15, 2003 PLANSCAPE – Building Community through Planning
Question 18: Do you provide staffing accommodations for: offshore workers, other workers? Offshore Workers:
COMMENTS: 75% of the farm operators who hire offshore labour provide accommodation for the workers. Other Workers: COMMENTS: 10% of respondents provide some accommodation for staff.
City of Hamilton Agricultural Economic Impact and Development Study Farmer Survey – Questionnaire Analysis Page A2.26
August 15, 2003 PLANSCAPE – Building Community through Planning
Question 19: What educational background do you have?
COMMENTS: The respondents were asked to provide information as to what type of educational background they had. Of the respondents 47 or 50% indicated that they had a secondary level education, 39 respondents or 41.5% indicated that they had a post secondary school education.
City of Hamilton Agricultural Economic Impact and Development Study Farmer Survey – Questionnaire Analysis Page A2.27
August 15, 2003 PLANSCAPE – Building Community through Planning
Elementary Secondary Post SecondaryCasual 5 26 13Full Time 2 30 13
0
5
10
15
20
25
30
Res
pons
e
Elementary Secondary Post Secondary
Casual Full Time
Response Frequency Percentage (%)No Training Required 43 48.3Pesticide Training Course 21 23.6Vet Medicine Course 7 7.9Crop Information Seminars 5 5.6Equipment Operations 5 5.6Chemical Training Course 2 2.2WHMIS 2 2.2Other 4 4.5Total 89 100.0
Question 19b: What education background do your employees have? COMMENTS: The respondents were asked to provide information pertaining to their employees educational background. When examining the responses one has to take into consideration that 85 respondents do not hire offshore (migrant) workers. Those that do hire them, 8 respondents were not aware of their employees educational background. The main type of education received for both casual and full time employees was a secondary school level, over 25% of casual and full time employees have post secondary education. Question 19c: What on-going training do you need to operate your farm? COMMENTS: Almost half of the respondents indicated on-going training was not required. Of the training needed, Pesticide training is by far the largest identified need, followed by Vet Medicine, Crop Information & Equipment Operations.
City of Hamilton Agricultural Economic Impact and Development Study Farmer Survey – Questionnaire Analysis Page A2.28
August 15, 2003 PLANSCAPE – Building Community through Planning
Response Frequency Percentage (%)No Specified Skill Required 38 37.6Good Work Ethics 21 20.8Farm Experience 14 13.9Equipment Operations 6 5.9Mechanical Experience 6 5.9On Site Training 3 3.0Pesticide Training Course 3 3.0Vet Medicine Skills 3 3.0Other 7 6.9Total 101 100.0
Question 19d: What skills would you require new employees to possess? COMMENTS: A variety of skills have been identified. Good work ethics & willingness to work is the major skill identified, followed by specific farm & equipment related skills. Question 19e: Would apprenticeship or co-op programs be of interest to you? COMMENTS Almost one-quarter of respondents indicated they would be interested in apprenticeship or co-op programs. If yes, what type? A variety of types of programs were identified. These included general exposure to the farm industry, mechanical operations, horticulture, biology & farm and livestock management.
Response Frequency Percentage (%)Yes 21 23.3No 69 76.7Total 90 100.0
Yes23.3%
N o76.7%
City of Hamilton Agricultural Economic Impact and Development Study Farmer Survey – Questionnaire Analysis Page A2.29
August 15, 2003 PLANSCAPE – Building Community through Planning
Question 19f: What level?
COMMENTS: The respondents were asked to identify what level of apprenticeship or co-op program they would like to have on their farming operation. There were 21 respondents who indicated that they would like to have a program on their farm. 8 respondents or 38.1% indicated that they would like to have both a high school level program and a post secondary level program on their farming operation. 7 respondents advised that they would like to have a High School level program, and six identified a program at the post secondary level.. Question 20a: What type of farming operation do you run? (Please indicate by % all that apply) (Note these are the categories provided by Statistics Canada) Asked for information on the type of farming operations. Due to the range of responses, it is not practical to summarize the data in table or chart form. The following provides a summary of the type of operations: Dairy – 6 Dairy operations 4 – 100% Dairy 1 – 90% Dairy; 8% Wheat; 2% Grain & Oilseed 1 – 80% Dairy; 10% Grain & Oilseed; 10% Field Crop Cattle – 20 with Cattle operations, but 13 with over 50% cattle 7 – 100% Beef Cattle 2 – 90 % Beef Cattle; 10% Field Crop 1 – 80% Beef Cattle; 10% Grain & Oilseed; 10% Field Crop 1 – 75% Beef Cattle; 25% Field Crop 1 – 60% Beef Cattle; 40% Field Crop 1 – 50% Beef Cattle; 50% Grain & Oilseed.
Response Frequency Percentage (%)High School 7 33.3Post Secondary 6 28.6Both 8 38.1Total 21 100.0
H igh Scho o l33.3%B o th
38.1%
P o st Seco ndary
28.6%
City of Hamilton Agricultural Economic Impact and Development Study Farmer Survey – Questionnaire Analysis Page A2.30
August 15, 2003 PLANSCAPE – Building Community through Planning
Hog – 2 Operations 1 – 100% Hogs 1 – 50% Hog; 30% Cattle; 10% Field Crop; 10% Miscellaneous Specialty Poultry & Egg – 12 with Poultry operations of which 11 have over 60% 9 – 100% Poultry & Egg 1 – 85% Poultry & Egg; 15% Field Crops 1 – 60% Poultry & Egg; 40% Vegetable Wheat – 15 have Wheat operations of which only 2 have 50% Wheat 1 – 50% Wheat; 50% Field Crops 1 – 50% Wheat; 50% Grain & Oilseed Grain & Oilseed – 25 have Grain & Oilseed operations of which 13 have 50% or more in Grain &
Oilseed 4 – 100% Grain & Oilseed 1 – 90% Grain & Oilseed; 10% Wheat 1 – 82% Grain & Oilseed; 12% Wheat; 6% Field Crops 1 – 79% Grain & Oilseed; 18% Field Crop; 4% Miscellaneous Specialty 1 – 75% Grain & Oilseed; 25% Cattle 1 – 74% Grain & Oilseed; 14% Wheat; 12% Field Crop 1 – 60% Grain & Oilseed; 40% Wheat 1 – 57% Grain & Oilseed; 23% Field Crop; 20% Miscellaneous Specialty 1 – 50% Grain & Oilseed; 25% Wheat; 25% Cattle 1 – 50% Grain & Oilseed; 50% Cattle (already noted under Cattle) Field Crops – 30 Operations have a Field Crop operation of which 9 have 50% or more in Field Crops 4 – 100% Field Crops 1 – 80% Field Crops; 50% Miscellaneous Specialty 2 – 50% Field Crops; 50% Livestock Combination 1 – 50% Field Crops; 50% Wheat (already noted in Wheat) Fruit – 9 Fruit operations of which 8 have over 60% in Fruit 7 – 100% Fruit 1 – 60% Fruit; 30% Vegetables; 10% Wheat Vegetable – 5 Vegetable Operations of which 3 have over 50% in Vegetables 2 – 100% Vegetables 1 – 50% Vegetables; 50% Miscellaneous Specialty Miscellaneous Specialty – 25 Miscellaneous Specialty operations of which 21 have over 50% in
Miscellaneous Specialty 12 – 100% Miscellaneous Specialty 1 – 80% Miscellaneous Specialty; 20% Field Crop 1 - 80% Miscellaneous Specialty; 20% Wheat 1 – 70% Miscellaneous Specialty; 30% Field Crop 1 – 66% Miscellaneous Specialty; 33% Fruit 1 – 65% Miscellaneous Specialty; 35% Field Crop 1 – 60% Miscellaneous Specialty; 30% Beef Cattle; 10% Poultry & Egg 2 – 50% Miscellaneous Specialty; 50% Field Crop (already noted in Field Crop) 1 – 50% Miscellaneous Specialty; 50% Vegetables (already noted in Vegetables) Livestock Combination – 4 operations of which 3 have 50% or more 1 – 60% Livestock Combination; 16% Grain & Oilseed; 14% Field Crop; 10% Wheat 1 – 50% Livestock Combination; 25% Grain & Oilseed 1 – 50% Livestock Combination; 50% Field Crop (already noted in Field Crop)
City of Hamilton Agricultural Economic Impact and Development Study Farmer Survey – Questionnaire Analysis Page A2.31
August 15, 2003 PLANSCAPE – Building Community through Planning
Other Combination – 2 operations of which 1 has over 50% 1 – 100% Other Combination Question 20b: If you choose Grain & Oilseed, Field Crop, Fruit, Vegetable, Miscellaneous Specialty or Livestock Combination please elaborate further: A review of the breakdown of the Miscellaneous Specialty operations revealed the following: 11 were Horse & Pony 3 were Nursery 3 were Other Horticultural 2 were Sheep & Lamb 2 were Other Animal 1 was Mushroom 1 was Goat Note: There were 27 responses to this question while in Question 20a, only 25 operations identified Miscellaneous Specialty as part of their Operations. The 9 Fruit operations were broken down as follows:
Fruit Operation
Grapes Cherries Pears Peaches Plums Strawberries Raspberries Apples
Greenhouse Products were mostly related to horticulture.
City of Hamilton Agricultural Economic Impact and Development Study Farmer Survey – Questionnaire Analysis Page A2.32
August 15, 2003 PLANSCAPE – Building Community through Planning
Question 21a: Do you export any of your products outside the City of Hamilton?
COMMENTS: A majority, 48 respondents or 53.3%, advised that they do export their products outside of the City of Hamilton. Question 21b: If yes, please outline the percentages for the following areas. Of the 48 respondents that export their products outside of the City, only 2 indicated that their products went Off Continent, and in each case, this represented only 5% of their products. Twelve respondents indicated that their product was shipped to the United States/Mexico, and the amount ranged from 100% to 5%. Nine respondents indicated that their product was shipped Out of Province, ranging from 100% to 10% of their product. Forty-three of the respondents shipped their product Outside of the City. Most shipped the majority of their product (100% - 90%) in this category.
Response Frequency Percentage (%)Yes 48 53.3No 42 46.7Total 90 100.0
Yes53.3%
N o46.7%
City of Hamilton Agricultural Economic Impact and Development Study Farmer Survey – Questionnaire Analysis Page A2.33
August 15, 2003 PLANSCAPE – Building Community through Planning
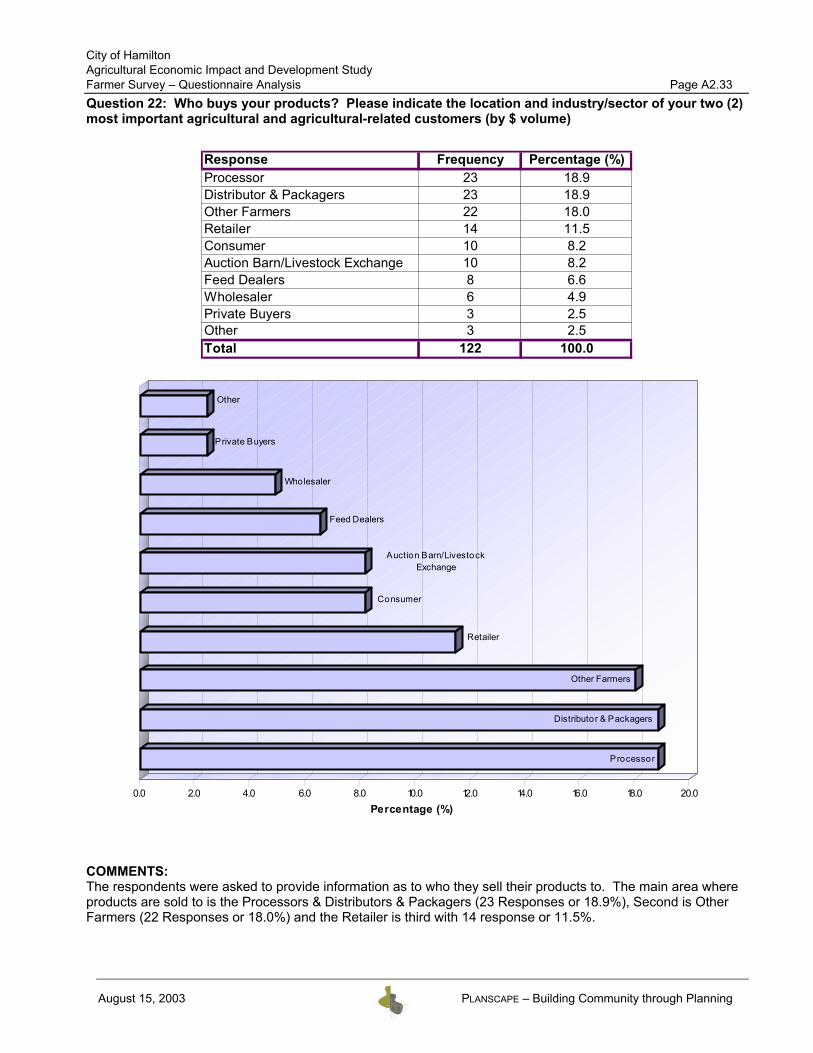
Question 22: Who buys your products? Please indicate the location and industry/sector of your two (2) most important agricultural and agricultural-related customers (by $ volume) COMMENTS: The respondents were asked to provide information as to who they sell their products to. The main area where products are sold to is the Processors & Distributors & Packagers (23 Responses or 18.9%), Second is Other Farmers (22 Responses or 18.0%) and the Retailer is third with 14 response or 11.5%.
City of Hamilton Agricultural Economic Impact and Development Study Farmer Survey – Questionnaire Analysis Page A2.34
August 15, 2003 PLANSCAPE – Building Community through Planning
Location: Where Product is Shipped
COMMENTS: The main area where the farmers products are shipped is “Other Ontario” this category includes such places as Ottawa, Brampton, Kitchener, Niagara, London. 38 respondents or 31.4% ship their products locally. Volume ($) of Product Shipped: COMMENTS: 31.8% of the volume shipped is within $10,000 - $19,999. Significantly 30.6% is $100,000 and over.
Response Frequency PercentageHamilton 38 31.4Toronto 10 8.3Other Ontario 59 48.8Other Canada 4 3.3United States 8 6.6Other 2 1.7Total 121 100.0
Hamilton Toronto Other Ontario Other Canada United States Other
City of Hamilton Agricultural Economic Impact and Development Study Farmer Survey – Questionnaire Analysis Page A2.35
August 15, 2003 PLANSCAPE – Building Community through Planning
Question 23a: Do you have contracts with specific firms/industries for products? COMMENTS: 63 respondents or 70.0%, advised that they do not have contracts with specific firms/industries. Question 23b: If yes, please check one of the following:
COMMENTS: Twenty Seven respondents have contracts with specific firms/industries, of the 27, 19 respondents or 73.1% deal with One Principal Firm, 6 respondents or 23.1% deal with a Variety of Firms and 1 respondents or 3.8% have a contract with a Co-Op.
Response Frequency Percentage (%)Yes 27 30.0No 63 70.0Total 90 100.0
Yes30.0%
N o70.0%
Response Frequency Percentage (%)One Principal Firm 19 73.1Co-Op 1 3.8Variety of Firms 6 23.1Total 26 100.0
0.0
10.0
20.0
30.0
40.0
50.0
60.0
70.0
80.0
Perc
enta
ge (%
)
One Principal Firm Co-Op Variety o f Firms
City of Hamilton Agricultural Economic Impact and Development Study Farmer Survey – Questionnaire Analysis Page A2.36
August 15, 2003 PLANSCAPE – Building Community through Planning
Yes51.1%
N o48.9%
Question 24: Do the commodities you sell come under a marketing board? COMMENTS: Forty-Six respondents have indicated that the commodities they supply fall under a marketing board. If yes, do you use the marketing board?
COMMENTS: Of the 46 respondents who indicated that their commodities supplied fell under a marketing board 42 respondents or 97.7% indicated that they used the board.
Response Frequency Percentage (%)Yes 46 51.1No 44 48.9Total 90 100.0
Response Frequency Percentage (%)Yes 42 97.7No 1 2.3Total 43 100.0
Yes97.7%
N o2.3%
City of Hamilton Agricultural Economic Impact and Development Study Farmer Survey – Questionnaire Analysis Page A2.37
August 15, 2003 PLANSCAPE – Building Community through Planning
Question 25a: Do you import goods & services from outside the City of Hamilton? COMMENTS: Forty-Eight respondents or 52.7%, indicated they purchase goods & services from outside the City of Hamilton. If yes, please outline the percentages for the following areas: Of the 48 respondents who indicated that they imported their goods & services from outside the city, only 6 respondents indicated that they imported from Off Continent. The percentages of goods & services imported ranged from 5% to 100%. Six respondents indicated that they imported goods & services from the United States/Mexico. The percentages of goods & services imported ranged from 5% to 100%. Nine respondents indicated that they imported goods & services from Outside of the Province. The percentages of goods & services imported ranged from 1% to 95%. Thirty-eight of the respondents indicated that they import from Outside of the City. The respondents imported the majority of their goods & services (4% to 100%) in this category.
Response Frequency Percentage (%)Yes 48 52.7No 43 47.3Total 91 100.0
Yes52.7%
N o47.3%
City of Hamilton Agricultural Economic Impact and Development Study Farmer Survey – Questionnaire Analysis Page A2.38
August 15, 2003 PLANSCAPE – Building Community through Planning
Question 25b: What goods & services do you import? COMMENTS: The respondents were asked to provide information as to what type of goods & services were imported. The respondents indicated that the main good or service imported was Plant Materials (18 responses or 20.0%), and second was Seeds (12 responses or 13.5%), and third was Fertilizers & Sprays (11 responses or 12.4%_ Also Feed, Custom Work, and Live Animals are important goods & services, each having 10 response or 11.2%.
City of Hamilton Agricultural Economic Impact and Development Study Farmer Survey – Questionnaire Analysis Page A2.39
August 15, 2003 PLANSCAPE – Building Community through Planning
Question 25c: If the goods or services were available locally, would you purchase them locally? COMMENTS: A significant number of respondents (76 or 88.4%) indicated that they would purchase the goods & services locally if they were available. 43 of the 86 responses do not purchase any good & services from outside the City of Hamilton, which in turn means that they purchase their goods and services locally.
Response Frequency Percentage (%)Yes 76 88.4No 10 11.6Total 86 100.0
Yes88.4%
N o11.6%
City of Hamilton Agricultural Economic Impact and Development Study Farmer Survey – Questionnaire Analysis Page A2.40
August 15, 2003 PLANSCAPE – Building Community through Planning
Question 26: Who do you buy your machinery and equipment from? Please list the two most important types of agriculture-related machinery and equipment (e.g. tractors, tillage equipment, milking systems, etc) purchased for use at your business, by type. Please also indicate the location of the supplier of the machinery or equipment and the approximate value (by $ volume) for each. Type of Machinery or Equipment: COMMENTS: The respondents were asked what their two most important types of agriculture-related machinery and equipment was. Over half of the respondents indicated that the Tractor was the most important type of machinery or equipment, followed by Farm Implements/Equipment (16.8%), and Specialized Equipment/Machinery (11.0%). Location:
COMMENTS: Most machinery & equipment is purchased locally – either in Hamilton or elsewhere in Ontario.
Response Frequency Percentage (%)Hamilton 60 40.0Ontario 87 58.0United States 1 0.7Other 2 1.3Total 150 100.0
0.0
10.0
20.0
30.0
40.0
50.0
60.0
Perc
enta
ge (%
)
Hamilton Ontario United States Other
City of Hamilton Agricultural Economic Impact and Development Study Farmer Survey – Questionnaire Analysis Page A2.41
August 15, 2003 PLANSCAPE – Building Community through Planning
Volume ($): COMMENTS: 25 respondents spend between $10,000 - $19,999 on their machinery and equipment. 20 respondents spend less than $5,000 and 15 respondents spend between $5,000 $9,999 and $30,000 - $39,999.
City of Hamilton Agricultural Economic Impact and Development Study Farmer Survey – Questionnaire Analysis Page A2.42
August 15, 2003 PLANSCAPE – Building Community through Planning
Question 27: Where do you purchase your services? Please list the two most important types of agricultural-related services (e.g. financial services, crop consultation services, vet services) for use at your business, by type. Please also indicate the location of your service provider. Location: COMMENTS: The respondents were asked to provide information as to where they purchase their services from as well as what the two most important type of services were. 45 respondents indicated “Other Ontario: - an example of this may be Financial in London. 40 respondents purchase their services locally. No services were recorder from either Out of Province or Out of the Country.
City of Hamilton Agricultural Economic Impact and Development Study Farmer Survey – Questionnaire Analysis Page A2.43
August 15, 2003 PLANSCAPE – Building Community through Planning
Services: COMMENTS: The main type of service used is Financial (59 responses or 38.8%), second is Vet Services (44 responses or 28.9%) and third is Crop Consultation (12 responses or 7.9%)
City of Hamilton Agricultural Economic Impact and Development Study Farmer Survey – Questionnaire Analysis Page A2.44
August 15, 2003 PLANSCAPE – Building Community through Planning
OM AFRA
Associations/Federations
Industry Suppliers
College/University Staff
Private Consultants
Federal Agencies
Other Provincial Agencies
0.0 5.0 10.0 15.0 20.0 25.0
Percentage (%)
Question 28: Please indicate if you use any outside services/expertise (research) information or new products, etc? COMMENTS: The respondents were asked if they used any outside services/expertise (research) information or new products. The main service/expertise used is OMAFRA (47 responses or 25.0%) the second service is Associations/Federations (40 responses or 21.3%) and the third most used service is Industry Suppliers (35 responses or 18.6%). The respondents may have indicated that they used more than one services/expertise (research) information or new product.
Question 29: In general, how important to the success of your business are the following types of marketing (1 is “not important”, 5 is “extremely important”, circle number)
COMMENTS: Self Marketing is clearly indicated as an extremely important marketing activity. Question 30: What assistance do you feel you need to improve the marketing of your products? A variety of responses were provided to this question. Many related to the overall state of commodity prices, international competitiveness (and trade inequalities). Suggestions for assistance included additional advertising to local consumers, through provincial & association publications. The pros and cons of existing and potential marketing board were also noted. Question 31a: Do you have onsite processing? COMMENTS: Almost 25% of respondents indicated that they do not have on site processing facilities.
Response Frequency Percentage (%)Yes 23 24.5No 71 75.5Total 94 100.0
Yes24.5%
N o75.5%
City of Hamilton Agricultural Economic Impact and Development Study Farmer Survey – Questionnaire Analysis Page A2.46
August 15, 2003 PLANSCAPE – Building Community through Planning
Question 31b: If yes, what type? COMMENTS: Of the respondents who indicated that they had onsite processing, 8 respondents or 34.8%, advised that they had Packaging (Wholesale) and 8 respondents or 34.8%, advised that they had Consumer Ready Product (Retail). Seven respondents indicated that they had both Packaging and Consumer Ready Product processing available on site.
Packaging (Wholesale) Consumer Ready (Retail) Both
City of Hamilton Agricultural Economic Impact and Development Study Farmer Survey – Questionnaire Analysis Page A2.47
August 15, 2003 PLANSCAPE – Building Community through Planning
0.0
5.0
10.0
15.0
20.0
25.0
Perc
enta
ge (%
)
Farm GateSales
CustomerDelivery
Tours (AgriEducation)
WholesaleDirectly toRetailers
Farmers'M arket
Pick YourOwn
Other Bed &Breakfasts
Restaurant
Question 31c: Do you provide any of the following services on your farm?
COMMENTS: The respondents were asked if they provide any services on their farming operation. The main service that is provided was Farm Gate Sales (20 responses or 23.5%) and second was Customer Delivery (18 responses or 21.2%) and third was Tours (Agri-Education) (15 responses or 21.2%), followed by wholesaling directly to retailers (13 or 55.3%). A number of operations offer a variety of services to deliver their products (e.g. tours, customer delivery, direct wholesaling). It was noted by a number of respondents that agri-tours do not generate many dollars, but are recognized as important activities. Farm gate sales are viewed as important activities.
Response Frequency Percentage (%)Farm Gate Sales 20 23.5Customer Delivery 18 21.2Tours (Agri Education) 15 17.6Wholesale Directly to Retailers 13 15.3Farmers' Market 10 11.8Pick Your Own 7 8.2Other 2 2.4Bed & Breakfasts 0 0.0Restaurant 0 0.0Total 85 100.0
City of Hamilton Agricultural Economic Impact and Development Study Farmer Survey – Questionnaire Analysis Page A2.48
August 15, 2003 PLANSCAPE – Building Community through Planning
Response FrequencyIncrease In Production 15Streamlined Production 4Decrease In Production 3Moved to Niche Markets 3Decrease In Acreage 2Moved away from Dairy 2Moved away from Beef 2Moved from Beef to Cash Crops 2Moved to Mechanization 1Moved from Dairy to Beef 1Moved from Diary to Beef & Hogs 1Moved from Diary to Cash Crops 1Moved from Dairy to Horses 1Moved from Dairy to Soya Beans 1Moved from Cattle to Goats 1Moved from Cash Crops to Horticulture 1Moved from Cash Crops to Hay & Small Grains 1Moved from Cash Crops to Grapes 1Moved from Corn & Beans to Hay 1Moved from Grapes & Christmas Trees to Retail Plants 1Moved from Hogs to Beef 1Moved from Livestock to Grain 1Moved to Cash Crops 1Moved to Dairy Specialization 1Moved to Pears 1Moved from Sheep to Llama's 1Total 51
Question 32: Has there been a shift in production during the time you have managed the farm? COMMENTS: A clear majority, 53 respondents or 58.2%, indicated that there has been a shift in production during the time that they have managed the farming operation. If yes, what are the significant shifts?
Response Frequency Percentage (%)Yes 53 58.2No 38 41.8Total 91 100.0
Yes58.2%
N o41.8%
City of Hamilton Agricultural Economic Impact and Development Study Farmer Survey – Questionnaire Analysis Page A2.49
August 15, 2003 PLANSCAPE – Building Community through Planning
Question 33: Do you have plans to expand your farming operation within the next 5 years? COMMENTS: A significant majority 76 or 81.7%, indicated that they were not planning to expand the size of their farming operation within the next 5 years. If yes, please specify COMMENTS: The respondents were asked if they had plans to expand their farming operation and if so how were they going to do this. The main way the operation is going to be expanded is by Purchasing More Land (5 responses or 35.7%), second was to Purchase More Livestock and Increase Number of Facilities (3 responses or 21.4% each) and third was to Purchase More Quota (2 responses or 14.3%).
Response Frequency Percentage (%)Yes 17 18.3No 76 81.7Total 93 100.0
Yes18.3%
N o81.7%
Response Frequency Percentage (%)Purchase More Land 5 35.7Purchase More Livestock 3 21.4Increase Number of Facilities 3 21.4Purchase More Quota 2 14.3Increase in Land Production 1 7.1Total 14 100.0
City of Hamilton Agricultural Economic Impact and Development Study Farmer Survey – Questionnaire Analysis Page A2.50
August 15, 2003 PLANSCAPE – Building Community through Planning
Question 34: Over the next 5 years are you planning to reduce the size of your operation? COMMENTS: A significant number, 66 or 71.7%, indicated that they were not planning to reduce the size of their farming operation with the next 5 years. Although it is also significant to note that almost 30% of farm operators are in fact planning to reduce the size of their operation.
Response Frequency Percentage (%)Yes 26 28.3No 66 71.7Total 92 100.0
Yes28.3%
N o71.7%
City of Hamilton Agricultural Economic Impact and Development Study Farmer Survey – Questionnaire Analysis Page A2.51
August 15, 2003 PLANSCAPE – Building Community through Planning
If yes, please specify:
COMMENTS: Of those respondents that indicated that they were planning on reducing the size of their farming operation the main reason for operation reduction was Retiring (16 respondents or 64.0%). This is reflective of the aging population of the farm community and the large number of farmers who have farmed over 40 years.
Retiring Selling Land Lost Interest Non Profitable Health Issues Reducing Operation
City of Hamilton Agricultural Economic Impact and Development Study Farmer Survey – Questionnaire Analysis Page A2.52
August 15, 2003 PLANSCAPE – Building Community through Planning
Income From Farming
Urban Encroachment
Land Use Regulations
Issues with Neighbours
Price Quota
Unskilled Workers
BM PR
Availability o f Skilled Workers
M arketing Support
Transportation (To M arkets)
Other
0.0 5.0 10.0 15.0 20.0 25.0
Percentage (%)
.
Question 35: What are the major issues/constraints related to your farming operation?
COMMENTS: The major constraint/Issue to farming is related to farm incomes. Other issues that have land use planning implications, include urban encroachment, land use regulations & issues with neighbours. Operational issues related to availability of workers, marketing support & farm priorities were also cited. The respondents were asked to provide other issues that may be of concern to them, the following were the responses that were provided: Environmental Constraints, Completing Surveys, On Farm Business Regulations, Funding Assistance for Irrigation Systems, Price of Good Farm Land, Weather, Global Pricing Standards, and Unfair Local Competition for Capitalization.
Response Frequency Percentage (%)Income From Farming 62 21.6Urban Encroachment 48 16.7Land Use Regulations 42 14.6Issues with Neighbours 29 10.1Price Quota 21 7.3Availability of Unskilled Workers 20 7.0BMPR 18 6.3Availability of Skilled Workers 17 5.9Marketing Support 16 5.6Transportation (To Markets) 8 2.8Other 6 2.1Total 287 100.0
City of Hamilton Agricultural Economic Impact and Development Study Farmer Survey – Questionnaire Analysis Page A2.53
August 15, 2003 PLANSCAPE – Building Community through Planning
Availability of Services Breakdown:
COMMENTS: The major issue/constraint in the are of services was Financial (banking) having 36.4%, second was Insurance (25.0%) and third was Equipment (22.7%).
Financial (Banking) Insurance Equipment Veterinary Other
City of Hamilton Agricultural Economic Impact and Development Study Farmer Survey – Questionnaire Analysis Page A2.54
August 15, 2003 PLANSCAPE – Building Community through Planning
Question 36: Would you like to provide any further Comments/Issues/Concerns? A large number of additions comments were provided that help provide insight into other issues affecting the farm community; a selected listing of some of there comments is produced below:
There is a lack of profitability for the next generation of farmers. There is a need for long term training of employees. It is very difficult to keep employees returning year
after year. Oyster Mushrooms are a very specific type of farming operation, which requires a high degree of
training and education. Property taxes are too high. To maintain agriculture, people need to buy the products locally, especially when fruits are in season. Insurance companies will not insure farms for Pick Your Own type of service. Improper management of farmland by the municipality is hindering farmers and is frustrating. There is not enough money for the next generation to take over the farm. There is a high rate of debt associated with farming. The cost of farming is continually rising but the level of income generated does not. Rents property from developers The prices for corn are set in Chicago, and the marketing board does not have much control over this,
which disables them from being able to help the farmers. People would like to see subsidies of the same nature as the United States. This would level the playing
field for all worldwide markets. The son owns most of the farming equipment and uses it on the farm when required. Would not recommend for anyone to go into farming in this day and age. Marketing boards hold too much power over a lot of farmers (adversely affecting their incomes). 75% of the family income is generated from investment income and not farming. Over time farming has become much more technical in nature. Experienced help is not available for seasonal employment due to the low wage levels being offered. Production based subsidies (i.e. production per worker ratio) could be used to support higher-level
producing farmers. There is virtually no support towards agriculturally used land in the City of Hamilton Farming and agricultural land use policies are geared towards pro-development and in order to keep
people farming this trend must change. There are no mechanisms in place for vast improvements in the farming operations. The voices of the farmers are not strongly heard among the City Councillors. The importance of farming needs to be recognized on the Federal Government Level. Value added products on farms are to be charged business taxes. Federal Agencies act as if the farmers do not exist. OMAFRA is not as strong as they used to be at providing valuable information to the farmers. Government subsidies need to be increased to the level of European farmers in order to maintain
Canadians working as farmers, and so that the agriculture industry does not become an import industry. The water level in the area is dropping due to the subdivision development on the rear of the farm lots. There are major concerns of how to pass the farm over to the next generation. Supermarkets offer prices that are too low for the produce, which in turn hurts the retail prices of the
produce. The City of Hamilton is imposing Urban By-laws, planning permits, etc… onto the rural agricultural
community, which is making it impossible to continue to farm and expand the operations. The nursery/greenhouse industry employs 000’s of people, so why is Hamilton restricting the growth
and profitability of them. Financial and Insurance Services charge the farmers too high of rates. People who are not farmers but purchase land in a farming area are unconscious of the issues that
surround the farming industry. Farmers would like to provide additional activities but find it difficult to do so. The price for purchasing milk quota is extremely high. There are too many surveys to complete throughout the year. The food market is no longer profitable. Trucking companies are not very reliable.
City of Hamilton Agricultural Economic Impact and Development Study Farmer Survey – Questionnaire Analysis Page A2.55
August 15, 2003 PLANSCAPE – Building Community through Planning
The city of Hamilton needs to understand the Agricultural Industry. The farm has purposely been located centrally so that distribution is no more than 30 minutes to all
areas that are being dealt with. The servicing of farm machinery is becoming extremely expensive. People do not like seeing farmland being developed into golf courses and subdivisions. There is a concern for new management requirements that the livestock farms will have to conform with.
The costs to conform to these requirements could put many farmers out of business. The tax base should not be the only thing that councils look at when determining land severances, as it
is there are too many. Severances should be more closely watched and restricted. Farm is surrounded by 120 homes and the people that live there are unconscious about the farmers’
properties. Farmers are concerned with the fact that other people are using their property as personal parks. All school children should have summer terms working on a farm in Canada. Can foresee a shortage of food in the future and thinks that people need to better understand farming
and help protect it. Education of the consumers about farming should be improved in the future. Many new laws and regulations are becoming problematic for farmers. The OFA needs to be revitalized and continue to be an evolving organization. Government assistance forms are complicated and are forced to pay professionals to fill them out.
APPENDIX 3Income and Expense Survey of
Agricultural Sectors
104 Kimberley Ave., Bracebridge, ON P1L 1Z8 / T 705.645.1556 / F 705.645.4500 / E [email protected] www.planscape.ca
PLANSCAPE BUILDING COMMUNITY THROUGH PLANNING MARGARET RICHARD WALTON HUNTER MPL MCIP RPP MCIP RPP
August 29, 2002 Dear Sir/Madam: As you may be aware, the Hamilton Wentworth Federation of Agriculture and the City of Hamilton have joined forces to conduct a study entitled The Agriculture Economic Impact and Development Study. This study is to identify the importance of agriculture in the City and to ensure that the conditions exist for it to flourish and prosper. We are asking for your co-operation in completing the enclosed confidential survey. The goal of our research is to contribute to the sound planning of agricultural land in the City, to ensure that adequate protection and attention are given to existing agricultural activities, and to take future agricultural needs into account. The study’s success depends on our ability to understand the City’s agricultural community and the current economic development and trends within the industry. We would like you to complete the survey as soon as possible, and mail it back to us in the return envelope provided. If faxing it back is easier, our number is (705) 645-4500 – just make sure to send both sides of the survey. Someone from our office will be calling in September to make sure you received the survey, and to answer any questions you may have. All information collected through this survey will be handled with the strictest confidence. No individual’s identity will be revealed in the presentation of results. Our report will present an aggregate overview of current trends and practices. The information we are gathering does not currently exist, so this is not an update of available information. Hence, your participation is vital to the success of the study. We have tried to keep the length of the survey to a bare minimum. Please call 1-800-363-2432 if you have any questions about its contents. A list of the Steering Committee members is also enclosed should you wish to discuss this with them. Thank you in advance for your assistance with this study. The results are scheduled to be available through the City and the Federation of Agriculture in November of this year. Yours truly, PLANSCAPE
Margaret Walton Margaret Walton, M.PI., MCIP, RPP Planning Consultant
City of Hamilton Agricultural Economic Impact & Development Study
Survey of Agricultural Components
Instructions to Respondents
This questionnaire will provide the data required to provide a specific economic analysis of the position agriculture occupies in the local economy. The results will help us raise the profile of agriculture in new City of Hamilton. The data being sought is not available to the study team from any other source. Therefore we ask your patience and help in working through the questions. PLEASE COMPLETE A QUESTIONNAIRE FOR EACH OF YOUR SEPARATE FARMING OPERATIONS AS SOON AS YOU CAN, AND RETURN IT IN THE ENVELOPE PROVIDED (BY THE END OF SEPTEMBER). ). If you need more copies please call 1-800-363-2432. We realize that this information is not readily available, but it is important that we get data about where you spend your money so we can show how important agriculture is to your community. If you participate in NISA, your NISA statement will contain most of the information we are asking for. Otherwise, please give us the total amount of your expenses, and estimate the percentage of that amount that you spend in each category. Depending on the type of farming you do, you may not have expenses in each of the categories or you may spend most of your money in only a few of the categories. We would like to have all surveys returned by the end of September. A Planscape employee will be calling you to make sure that you received the survey and to answer any questions you may have. If you have any concerns, or require any further information, please contact Jacquie Tschekalin, Margaret Walton or Rick Hunter at 1-800-363-2432. Section A: Respondent Contact Information
Name of farm or business: Phone Number: Fiscal year for which you are reporting information: Section B: Description of the Agricultural Operation
1. What type of farming operation(s) do you run? (Please list by commodity
produced or, if available, provide the NISA industry code that best describes your farming operation(s) as entered on page 1 of NISA Statement A).
2. Please provide the approximate percentage breakdown (by $ produced) of the operations referred to in Question 1. (If more than one, please specify)
02/08/28 2
Section C: Expenses (Inputs) of the Agricultural Operation
This portion of the questionnaire is designed to gather information on the types and quantities of non-depreciable inputs (e.g., purchases that you do not depreciate on a yearly basis) used in your operation in its last complete fiscal year. PLEASE COMPLETE ONE FOR EACH OPERATION/COMMODITY GROUP. The commodity groupings used below have been cross-referenced with NISA codes for your assistance. If you do not participate in NISA, please estimate (using tax information, your memory and any other information you may have) how much of your total expenses were spent on each category. All of your expenses may not fit in these categories (ie. your answers may not add up to 100%). YOUR OWN RECORDS AND RECOLLECTIONS WILL BE ABSOLUTELY CRUCIAL IN THIS EXERCISE.
Inpu
t –
Out
put
Com
mod
ity
No.
Input-Output Commodities Approximate per centage of total input costs.
seedlings, livestock (including horses & foals), fruit, vegetables, fruit, flowers, trees, shrubs, etc.. [Include all eligible expenditures in NISA commodity groups “Grains, Oilseeds, and Special Crops” (except those NISA commodities listed for “Grains” above and 002, and 046), “Edible Horticulture”, “Non-edible Horticulture”, “Poultry”, “Cattle & Calves”, “Sheep & Lambs”, “Other Red Meats (including hides, velvet and pelts)” and “Other Commodities” (except NISA commodity 259). [Include also NISA eligible expense line 9713]
%
9 Processed meat, dairy & fish products including fish meal, feed from animal by-products, and animal by-products for industrial use.[The only relevant NISA commodity code is commodity 263 or fish meal.]
%
10 Processed grain (e.g., flours & cereals), processed fruit (e.g., jams, juices etc.) and vegetable products (e.g., feeds, feed supplements, feeds from grain and vegetable by-products). [Include eligible expenditures on NISA commodities 046, and 081]
%
13 Plastic, Rubber and Leather Products including plastic pipe & fittings, rubber products (e.g., boots, waterproof clothes, rubber tires) and Leather products. [Include 50% of NISA non-eligible expense line 9661]
%
14 Textile products including twine, rope, tarpaulins, covers, nets, fabrics, cord. [Include 50% of NISA non-eligible expense line 9661]
%
16 Lumber & wood products (processed/prepared) including structural products, prefabricated wood structures, & pallets, particle & wafer boards, wood barrels & kegs.[Include 50% of NISA non-eligible expense line 9795]
%
02/08/28 3
21 Other (non-depreciable) metal products including wire fencing, boilers, piping, steel structural materials, barrels, cans, screens, chains, welding rods, bolts, nuts, builders hardware, machine tools, furnaces & parts, fuel burning equipment, valves, regulators, hand & measuring tools, firearms.[Include NISA eligible expense line 9820].
%
22 Machinery & equipment (non-depreciable) including bearings & mechanical power transmission equipment, pumps, compressors, fans & blowers, conveyors, elevators, general purpose machinery, power hand tools, refrigeration & a/c equipment, scales & balances.
%
24 Electrical, electronic & communication products including heating equipment, freezers, appliances, radar & radio navigation equipment, alarms & signals, electric motors, power generation equipment, batteries, insulated wire & cable, light bulbs, non-portable electric light fixtures.
%
25 Cement, lime, sand-lime products, ready-mix concrete, bricks, clay, refractory products, gypsum building products, glass & glass products, asbestos products, abrasives. Mineral products (quarry mining) [Note: NISA eligible expense line 9662 includes “Fertilizers & Lime”. Only the lime portion of this should be tracked here, and the fertilizer component should be tracked in commodity 27 below.]
27 Fertilizers, pesticides, herbicides, pharmaceuticals, lime spray, lime for barn floors, paints & related products, adhesives, detergents & soaps, refined vegetable oils, glycerin & glycol, antifreeze, explosives, potash, nitrogen & phosphates. [Include that portion of NISA eligible expense line 9662 accounted for by fertilizers and all of NISA eligible expense line 9663] Produced by manufacturing.
31 Repair construction including only repairs done by a hired tradesperson % 32 Transportation & storage including grain storage, air transportation (passenger, freight & specialty), rail transportation
(passenger & freight), bus transportation, travel agent & tour wholesaler fees, truck transportation, rail transportation, taxi cab fees, pipeline transportation, grain storage, other storage & warehousing, [include eligible NISA expense lines 9801 and 9822]
%
33 Communication services such as telephone charges, postal charges, and other telecommunications. [Including: NISA eligible expense line 9824 in addition to all non-telephone telecommunications.]
%
34 Electricity, natural gas, water & other utilities [Include NISA eligible expense line 9799] % 38 Bank charges, license fees, insurance premiums, real estate commissions, financing charges, & lease
WHAT IS THE APPROXIMATE DOLLAR VALUE OF ALL EXPENSES? Total $ Value $
Have we missed anything on the expense (input) side? Please enter commodity names and percentages for items purchased by your operation that, in your opinion, do not fit any of the above categories. (Please refer
to the same complete fiscal year that you used above).
COMMODITY
% TOTAL INPUT
02/08/28 5
Please provide details on all depreciable capital items (e.g., buildings, equipment and machinery) purchased in the last fiscal year. Note that none of the items listed here should have been listed with the non-depreciable expenses above. Please enter each item by name, include a brief description and the dollar amounts invested. (Please refer to the same complete fiscal year that you used above). Feel free
to use more space if necessary.
DEPRECIABLE CAPITAL ITEM
$ VALUE (approx. amount paid)
02/08/28 6
Section D: Income (Output) of the Agricultural Operation
This portion of the questionnaire is designed to gather information on the types and quantities of products produced and sold by your operation in its last complete fiscal year. The commodity groupings used below have been cross-referenced with NISA codes (where possible). Use of your NISA forms is not required, but rather included here for your convenience if applicable. YOUR OWN RECORDS AND RECOLLECTIONS WILL BE ABSOLUTELY CRUCIAL IN THIS EXERCISE.
Inpu
t –
Out
put
Com
mod
ity
No.
Input-Output Commodities % of total income (output).
1 Grains (feed & seed )[Include income from the sale of NISA commodities 003, 007, 018, 020, 021, 039, 045, 049, & 056] % 2 Other Agricultural Products including veterinary services & medicine, artificial insemination fees, seeds, seedlings,
livestock (including horses & foals), fruit, vegetables, fruit, flowers, trees, shrubs, etc.. [Include income received from the sale of NISA commodities “Grains, Oilseeds, and Special Crops” (except those NISA commodities listed for “Grains” above and 002, and 046), “Edible Horticulture”, “Non-edible Horticulture”, “Poultry”, “Cattle & Calves”, “Sheep & Lambs”, “Horse”, “Raw Milk”,“Other Red Meats (including hides, velvet and pelts)” and “Other Commodities” (except NISA commodity 259).]
%
9 Processed meat, dairy & fish products including fish meal, feed from animal by-products, and animal by-products for industrial us, cheese, horse meat. [only relevant NISA commodity code is commodity 263 or fish meal]
%
10 Processed grain (e.g., flours & cereals), fruit (e.g., jams) and vegetable products (e.g., feeds, feed supplements, feeds from grain and vegetable by-products, roasted beans). [Include income from the sales of NISA commodities 046, and 081]
%
11 Wine, soft drinks & other alcoholic beverages [Include income from the sale of NISA commodity 088] % 12 Tobacco and tobacco products [Include income from the sale of NISA commodity 269]` % 42 Accommodation services & meals including Bed & Breakfast operations on farm, farm vacation packages, agri-tourism. %
WHAT IS THE APPROXIMATE DOLLAR VALUE OF PRODUCTS YOU PRODUCED AND SOLD? $
02/08/28 7
Have we missed anything on the income (output) side? Please enter commodity names and percentage for items produced & sold by your operation that, in your opinion, do not fit any of the above categories
COMMODITY
% TOTAL OUTPUT
Please provide details on all depreciable capital items (e.g., buildings, equipment and machinery) sold in the last fiscal year. Note that none of the items listed here should have been listed with the non-depreciable expenses above. Please enter each item by name, include a brief description and
the dollar amounts invested. (Please refer to the same complete fiscal year that you used above). Feel free to use more space if necessary.
DEPRECIABLE CAPITAL ITEM
$ VALUE (approx. amount received)
Please put your survey in the return envelope and mail it back to our offices now.
THANK YOU! WE REALLY APPRECIATE YOU TAKING THE TIME TO COMPLETE OUR SURVEY!
APPENDIX 4An Economic Impact Analysis of Agricultural
Production in the City of Hamilton
A - Input Profiles by Commodity GroupsB - Output Profiles by Commodity GroupsC - Impact Summaries by Commodity Group across all
Sectors of the Hamilton Economy
City of Hamilton Agricultural Economic Impact and Development Study Page A4 1
August 15, 2003
Appendix 4A: Input Profiles by Commodity Groups for Hamilton
City of Hamilton Agricultural Economic Impact and Development Study Page A4.4
August 15, 2003
Appendix 4C: Impact Summaries by Commodity Group Across all Sectors of the Hamilton Economy Poultry and Egg Total Output Impact Total Output Impact Direct Impact Indirect Impact Induced Impact Operations ($) Closed ($) Open ($) Closed ($) Closed ($) Closed ($)
City of Hamilton Agricultural Economic Impact and Development Study Page A4.10
August 15, 2003
Fruit Total Output Impact Total Output Impact Direct Impact Indirect Impact Induced Impact Operations ($) Closed ($) Open ($) Closed ($) Closed ($) Closed ($)
City of Hamilton Agricultural Economic Impact and Development Study Page A4.15
August 15, 2003
All Commodities Total Output Impact Total Output Impact Direct Impact Indirect Impact Induced Impact In ($) Closed ($) Open ($) Closed ($) Closed ($) Closed ($)
City of Hamilton Agricultural Economic Impact and Development Study Page A5.1
August 15, 2003 PLANSCAPE – Building Community through Planning
APPENDIX 5 CANADA LAND INVENTORY (CLI)
CLASSES
Class 1 Soils have no signification limitations; generally level or very gentle slopes, deep, good water holding capacity, and are well to imperfectly drained.
Class 2 Moderate limitations that restrict the range of crops or require moderate conservation practices. Soils are deep with good water-holding capacity. Limitations are moderate (i.e. Adverse regional climate, poor soil structure, low fertility, moderate erosion) and are generally easily correctable.
Class 3 Moderately severe limitations that restrict the range of crops or require special conservation practices, but are considered fair to moderately high in productivity for a wide range of field crops. Limitations may be a combination of those found under Class 2 or may include one or more of the following: Moderate climatic limitations Moderately severe erosion Intractable soil mass or very slow permeability Correctable low fertility Moderate to steep slopes Frequent runoff accompanied by crop damage Stoniness necessitating some clearing
Class 4 Severe limitations that restrict the range of crops or require special conservation practices. This class is generally considered suitable for only a few crops (yield for a range of crops low/crop failure high). Productivity is low to medium for narrow range of crops with a higher productivity for specially adapted crop types. Limitations include the following: steep slopes, severe past erosion, frequent surface runoff, severe salinity or aridity, and extreme stoniness.
Class 5 Very severe limitations that restrict their capability in producing perennial forage crops, and improvement practices are feasible. This soil class generally includes serious physical, climatic and other limitations that make it incapable of sustaining production of annual field crops.
Class 6 There soils are capable only of producing perennial forage crops, and improvement practices are not feasible. Improvement practices on these types are not economical due to serious climatic and other physical limitations. Soils are marginal for agricultural use though they are generally used for periodic rough grazing for farm animals.
Class 7 No capacity for arable culture or permanent pasture. With a low economic feasibility caused from a combination of severe climatic and physical limitations this class is not suitable for agricultural use. All classified areas not including organic are placed in this Class including areas of exposed rock and small water bodies.
Organic Soils Not placed in capability classes.
City of Hamilton Agricultural Economic Impact and Development Study Page A5.2
August 15, 2003 PLANSCAPE – Building Community through Planning
CAPABILITY SUBCLASSES
Subclasses are divisions within classes that have the same kind of limitations for agricultural use. There are 13 recognized types of limitations as follows:
C Adverse climate
➣ Significant adverse climate for crop production which limits maturity of field crops from insufficient precipitation and less than optimal high growing-season temperatures causing partial or total crop failure.
D Undesirable Soils Structure and/or Low Permeability
➣ Soils difficult to till, or absorb water slowly, or where depth of rooting zone is restricted
➣ Not including high water table or consolidated bedrock
E Erosion
➣ Where damage caused from erosion limits agricultural use
➣ Damage assessed on loss of productivity and on difficulty of farming land with gullies
F Low Fertility
➣ Correctable with careful management or difficult to correct in a feasible way
➣ Limitations include lack of available plant nutrients, high acidity or alkalinity, low exchange capacity, high levels or carbonates or presence of toxic compounds
I Inundation by Streams or Lakes
➣ Restricted agricultural use or crop damage from inundation
M Moisture Limitations
➣ Soils with generally low water-holding capacity characteristics which adversely affects crops
N Salinity
➣ These soil types are limited to Class 3 to 7
➣ Restrictions in the range of crops that may be grown due to high content of soluble salts
City of Hamilton Agricultural Economic Impact and Development Study Page A5.3
August 15, 2003 PLANSCAPE – Building Community through Planning
P Stoniness
➣ Soils which contain stones to adversely affect or hinder tillage, planting and harvesting
➣ These soils are generally less productive than comparable soils without stones
R Consolidated Bedrock
➣ The presence of bedrock on or near the surface restricts agricultural use
➣ Not considered as a limitation where consolidated bedrock is located at depths of over three feet from the surface, however, greater depth of soil is required for irrigated lands
S Combination of Subclasses
➣ Includes one or more of the following subclasses: D, F, M, and N
T Topography
➣ Limitation factors which increase the cost of farming over that of smooth land, include percent of slope and pattern or frequency of slopes in different directions
➣ Topography may decrease the uniformity, growth and maturity of crops and may increase the likelihood of erosion from water
W Excess Water
➣ Not including inundation by streams or lakes
➣ Limitations include inadequate soil drainage, high water table, seepage or runoff from surrounding area
X This Subclass is comprised of soils having a limitation resulting from the cumulative effect of two or more adverse characteristics
Source: Department of Regional Economic Expansion, Soil Capability Classification for Agriculture, The Canada Land Inventory, Report #2, 1969. Environment Canada (Lands Directorate), Land Capability for Agriculture, Preliminary Report, Canada Land Inventory, Report #10, 1978.
APPENDIX 6Excerpts from Ontario Regulations 282/98
Farmlands Property Class Criteria
APPENDIX 7Excerpts from Severance Activity in
Ontario’s Agricultural Land 1990 to 2000(Dr. Wayne Caldwell and Claire Weir, School of Rural
Planning, University of Guelph)
APPENDIX 8Agriculturally Related Businesses
City of HamiltonAgricultural Economic Impact and Development Study Page A8.1
115 Support Activities for Agriculture115110 Country Depot x 1993 Hamilton L8W 3N1 Seeds and Fertilizer to the Ag Industry115110 General Seed Company x 2000 Ancaster L0R 1R0 Wholesale Distributor of Seeds115210 DBA Warner x 1982 Flamborough L0R 2B0 Horse Boarding Facility115210 Poseidon Equestrian Services x 1994 Flamborough L0R 1V0 Horse Boarding and Riding115210 Woodburn Equestrian Stable x 1988 Glanbrook L0R 1C0 Horse Boarding stable
311 Food Manufacturing311224 Canamera Foods x 1992 Hamilton L8N 3K7 Processing of soybean and canola seeds311340 AnDea Chocolate Confections x 1988 Ancaster L9G 4V5 manufacture and distributor of chocolates311340 Beta Brands Ltd x 1930 Hamilton L8M 1Z1 hard candy - lifesavers
311420 E. D. Smith & Sons Ltd x 1879 Stoney Creek L8E 5S3manufacture jams, jellies, pie fillings etc. in fruit line of products
311420 Great Lakes Foods x 1969 Hamilton L8E 3C4 mushroom canning plant311420 Olivieri Foods x 1996 Hamilton L8E 3C5 pasta and sauce manufacturer311515 Paron Cheese Co x 1978 Glanbrook L0R 1P0 cheese processing311515 Salerno Dairy Products x 1962 Hamilton L8H 3R7 Producers of cheese
311520 Stoney Creek Dairy x 1900 Stoney Creek L8G 1L4Manufacturer/retailer of ice cream & dairy products.
311611 Millgrove Packers Co. Ltd x 1977 Flamborough L0R 1V0 Slaughter house and meat packers
311614 Medallion Meats Ltd x x Hamilton L8H 3R7Processing- make deli products (beef, turkey, pork)
311614Denningers Foods of the World Meat Processing Plant x 1954 Hamilton L8L 4C7
Manufacturer of the Finest Meat Products - Ready to Eat Food Products - on site catering
311614 Fernando Meat Products x 1971 Hamilton L8L 3R3Wholesale meat processing and local delivery of meats.
311614 Maple Leaf Meats x 1898 Hamilton L8E 3C3Manufacturers of wieners, cottage rolls and corn beef brisket for wholesale.
311615 Soldaat's Poultry and Meats x 1972 Ancaster L0R 1R0Processing then distributing to restaurant and institutions,
311710 Fish King Processor x 1954 Dundas L9H 5G1 value added seafood manufacturer
311811 Shire's Bakery x 1992 Hamilton L9C 2Y4wholesale bakery to grocery stores and vending companies
311811 Baltic Bread Products Ltd x 1961 Hamilton L8L 6K1 bakery which bakes bread, cakes and cookies311811 Bonanza Bakery x 1998 Hamilton L8L 3G4 retail bakery
311811 Bread of Life Pie & Cookie Co. Inc x 1995 Stoney Creek L8V 2S1Wholesale/retail bakery, specialize in wholesale home made meat pies, fruit pies & cookies.
311811 Buns Master Bakery x 1978 Hamilton L8H 7P4 retail bakery311811 Cakes with Flair x 1996 Hamilton L8W 2Z9 cakes for special occasions311811 Cinnabon x 1988 Hamilton L9A 4X5 bakery 311811 Custom Cakes Bakery x 2000 Hamilton L8H 3Z3 custom cakes and baked goods
Appendix 8List of Agriculturally Related BusinessesBusinesses According to NAICS Classification
Number of employees
August 15, 2003 PLANSCAPE - Building Community through Planning
City of HamiltonAgricultural Economic Impact and Development Study Page A8.2
Appendix 8List of Agriculturally Related BusinessesBusinesses According to NAICS Classification
Number of employees
311811 Emilio's Bakery x 1993 Dundas L9H 1V1wholesale bakery consisting of mainly bread, with some retail of cold cuts and buns.
311811 Glendale Bakery x 1999 Stoney Creek L8J 1P8 retail bakery311811 Greek Corner Store & Bakery x 1962 Hamilton L8N 1E5 retail bake goods and import food
311811 La Bakeri x 1980 Hamilton L8V 1W9retail bakery specializing in Italian bakery and cakes
311811 Maria's Bread x x Hamilton L8G 4R2 retail bakery
311814 Canada Bread x 1988 Hamilton L8W 2E1 manufacturing bakery, baking bread and buns.
311814 Golden Mill Bakery x 1992 Hamilton L8W 3N1 Industrial bakery - production of bread and rolls
311814 National Specialty Cakes x x Hamilton L8V 1S9
manufacturer and distributor of specialty desserts and breakfast foods. Provide fresh cakes, pies, pastries, muffins, danish, etc.
311814 Sunshine Bread Co Ltd x 1935 Hamilton L8H 3E4bakery and catering; commercial and over the counter
311940 Dunn G. S & Co. Ltd x 1867 Hamilton L8R 2M9
Canada's only dry mustard miller, a complete line of mustard flours, ground mustards, brans & deactivated mustard making us the premier supplier of mustard products to the world!
311940 Global Spices & Seasonings Inc x 1968 Hamilton L8W 2E5 process spices for wholesale
311940 Young-Winfield Inc. x 1908 Hamilton L8H 3S1 wholesaler & packager of spices & herbs
311990 Reilly's Food Processing x 1984 Hamilton L8W 3R4 Fresh potato product processing & retail
312
312110 Arctic Glaciers x 1991 Hamilton L8L 6C1ice mfg and distributor of ice refrigeration machinery
312110 Spring Water Ice Ltd x 1987 Flamborough L0R 2H0 Manufactures and distributes ice312120 Brew Time Brewery & Winery x 1999 Hamilton L8E 1H6 Brew your beer and wine312120 Firkin Brewery x 1991 Hamilton L8W 3M7 u Brew - brew beer and wine312120 Flamboro Mix & Brew House Inc x 1991 Hamilton L8N 2Z7 brew on premises beer and wine
312120 Lakeport Brewing Corporation x 1992 Hamilton L8L 4H2
Value priced segment of the beer market in Ontario. Lakeport is also Canada's leading co-packer of beer, non-alcoholic beer and spirit based products.
312120 Main West Brew Inc x 1992 Hamilton L8S 1G5 brew on premises wine
312120 O'Daly's Brewing Emporium x 1992 Stony Creek L8G 5G2 beer and wine making/retail purified water
312130 Carafe x 1997 Hamilton L9A 4V9make your own wine and wine for sale on premises
312130 Vin Bon Juice Co x 1991 Hamilton L3E 2X3 import wine juice, sell retail312130 Wine & Brew Crafters x 1991 Hamilton L8S 1Z2 on premises wine making312130 Wine Art x 1988 Hamilton L8P 1C2 wine and beer making equipment312130 Wine Court x 1997 Hamilton L8L 5W9 brews on premises
Beverage and Tobacco Product Manufacturing
August 15, 2003 PLANSCAPE - Building Community through Planning
City of HamiltonAgricultural Economic Impact and Development Study Page A8.3
Appendix 8List of Agriculturally Related BusinessesBusinesses According to NAICS Classification
Number of employees
316
316110 Smith Saddlery Western Store x 1975 Dundas L9H 5E1Retail & manufacturer of custom leather work & saddlery
3253NONE
333 Machinery Manufacturing333110 Case Canada Corp x 1977 Hamilton L8N 4C4 farm & construction equip distributor333110 Crown Automated Feeders Inc x 1996 Ancaster L9G 4V5 manufacturer bowl feeders333110 McGuire Oscillating Screw Chillers Inc x 1992 Hamilton L8L 3E8 fabricate machinery for poultry processing
333110 VTR x 1995 Hamilton L8W 2Z9manufacture, distribute and service automated machinery that sorts parts
411 Farm Product Wholesaler-Distributors411130 Braun Nursery Limited x 1995 Glanbrook L0R 1W0 Tree nursery/wholesale411130 Canadian Hydrogardens Ltd x 1975 Ancaster L9G 4V5 horticultural distributor411130 Koornneef A & Sons x 1959 Stoney Creek L8E 5K9 Wholesale Flower growers
411130 Kouwenberg John Floral Inc x x Stoney Creek L8E 5S7 Flower wholesale distributor to Quebec and USA411130 Staalduinen Floral Ltd x 1938 Stoney Creek L8E 5P1 floral wholesaler411130 Woodhill Greenhouses x 1976 Flamborough L0R 1T0 flower wholesale
413413110 Discount Food Services Ltd x 1994 Hamilton L8E 4V4 bulk food sales (wholesale)413110 Lumsden Brothers Ltd x 1800 Hamilton L8H 2Z3 Food Wholesaler413110 Rycott Wholesale Foods Ltd x 1979 Hamilton L8E 3X8 food distributing company
413110 South Pacific Wines Inc x x Stoney Creek L8G 3H9 import and distributor of grape products
413110 The Wine Village x x Stoney Creek L8G 3H9 import and distributor of grape products413120 Natrel Ontario Inc x 1997 Hamilton L8E 2Z9 dairy product distributor
413120 Sam's Importing & Distributing Co. Ltd x 1973 Hamilton L8P 2A5 wholesale and retail sale of cheeses413120 Sealtest Ontario x 1997 Hamilton L8E 2Z9 dairy product distributor
413130 Highland Poultry Fine Food Ltd x 1967 Hamilton L8W 2E1process chicken pieces to sell wholesale across Canada
413130 Stoney Creek Poultry Produce Ltd x 1959 Stoney Creek L8J 2V7 wholesale and retail of poultry
413150 J & D Foods x 1988 Hamilton L8W 3N1 food distributor - fruits and vegetable wholesaler
413150 Mirella Foods Ltd x 1990 Stoney Creek L8E 4W2wholesale of produce to restaurants and institutions; retail store for produce
413160 Peameal Bacon of Canada x 1980 Stoney Creek L8E 2Y3 wholesale distributor of peameal bacon
413160 Springer's Meats Inc. x 1956 Hamilton L8H 5Y7Meat processing & wholesale to institutions. Retailer of fresh, frozen meat & poultry products
Food, Beverage and Tobacco Wholesaler-Distributors
Pesticide, Fertilizer and Other Agricultural Chemical Manufacturing
Leather and allied product manufacturing
August 15, 2003 PLANSCAPE - Building Community through Planning
City of HamiltonAgricultural Economic Impact and Development Study Page A8.4
Appendix 8List of Agriculturally Related BusinessesBusinesses According to NAICS Classification
Number of employees
413160 TMF - The Meat Factory Ltd x 1980 Stoney Creek L8E 2Y3
specialists in quality beef, pork & value added products; Manufacturers of portion controlled steaks, pre-cooked or marinated products
413160 Venetian Meat & Salami Co. Ltd x 1953 Hamilton L8L 4K6manufacture deli products; process cured, dried and fermented meat products
413190 x 1994 Ancaster L9G 4V5 distribution for bread, buns and pastry products
413190 F & C Food Importing Inc x 1989 Hamilton L8E 2Z1import vegetables, canned & jarred vegetables, cooking oils, sun dried tomatoes all from Italy
413190 Finlay Greenwood Corporation x 1989 Hamilton L8H 2P5 food wholesaler - distributor of food products
413190Hostess Frito Lay Company (Brockley) x 1988 Hamilton L8E 3K3 sales office for distribution of potato chips
413190 x 2000 Hamilton L8X 3C3 confectionery importer413190 John Lepore Foods & Packaging x 1997 Hamilton L8L 1B4 wholesale distribution of frozen foods413190 M&L Gourmet Enterprises Inc x x Hamilton L8W 2Z9 food wholesaler (nuts, candies, etc)
413190 Metarom Canada Inc x 1992 Flamborough L0R 2H5wholesale rep for Quebec company that sells flavours for food
413190 Rachael's Gourmet Snacks x x Hamilton L8E 5B1 sell/distribute potato chips413190 Romolo's Pasta x 1992 Hamilton L8W 3R6 wholesale of fresh pasta413190 S & J Food Distributors x 1990 Hamilton L8W 2E1 wholesale sales & delivery of deli food
413190 Staley Canada Ltd x 1995 Stoney Creek L8E 2B4distribute sugars & starches - mostly food products - some industrial starches
413190 Therien Enterprises x 1974 Hamilton L8L 4A8
distributor of manufactured snack foods; supply pubs and taverns; manufacture foods such as pickled eggs
413190 Traynor's Bakery Wholesale x 1948 Hamilton L3N 3C8 wholesale of bakery products, flour etc413190 Triple-C-Inc x 1959 Hamilton L8E 5B1 importer/distributor of candy & confections
413190 Ulisse Fine Foods x 1978 Hamilton L8E 2K3 Deli & Italian meats, cheeses & sandwich bar413190 Vachon x 1923 Hamilton L8H 7P4 bakery outlet, distribution centre413210 Flamborough Springs Inc x 1987 Flamborough L0R 2H0 manufacturer & distributor bottled spring water
413210 Long Life Water Distillers x 1978 Hamilton L9C 2Z9distilling & distribution of drinking water and water treatment equipment
413210 Multi Entreprise Services x 1995 Stoney Creek L8G 1G3 bottled water sales & delivery413210 Pepsi Cola Canada Beverages x 1997 Hamilton L8E 2J8 distribution facility for Pepsi cola products413210 Novy Trading x x Dundas L9H 3W1 import alcoholic beverages for the government
4171
417110 Galer Farm Equipment x 1950 Dundas L9H 5E2retail of farm equipment/lawn and garden and light industrial
417110 Grant's Poultry Processing Equipment x 1993 Hamilton L8H 6H6Sell poultry processing equipment e.g.. Sculding machine
417110 Hgy 6 Motors x 1978 Glanbrook L0R 1W0industrial and farm equipment repairs; sell farm equipment
417110 Marsh Bros Tractor Inc x x Dundas L9H 5E2 tractor and farm equipment sales417110 Marsh Bros Tractor Inc (Lynden) x 1970 Flamborough L0R 1T0 tractor and farm equipment sales
Jacques Walter - Confectionary Importer
Dempsters' Bread Div of Canada Bread Co. Ltd
Farm, Lawn and Garden Machinery and Equipment Wholesaler-Distributors
August 15, 2003 PLANSCAPE - Building Community through Planning
City of HamiltonAgricultural Economic Impact and Development Study Page A8.5
Appendix 8List of Agriculturally Related BusinessesBusinesses According to NAICS Classification
Number of employees
417110 O'Niels Farm Equipment (1971) Ltd x 1918 Glanbrook L0R 1C0 sell farm and lawn equipment and service facilities417110 Regional Ford New Holland x 1991 Flamborough L0R 1K0 agricultural and Industrial equipment dealer
417110 Windmill Power Equipment Ltd x 1988 Dundas L9H 2M1lawn, garden & construction equipment sales, repair and rental
417110 Crossroads Equipment x 1988 Ancaster L0R 1R0sales and service of farm, lawn and garden equipment
417110 County Agricultural Services Inc x 1960 Flamborough L0R 1T0 tractor and farm equipment sales
4183418310 Howe Feed & Supplies x 1980 Flamborough L0R 1K0 feed mill and farm supplies418310 Quick Feeds x 1993 Copetown L0R 1J0 farm feeds sales & some pet food
418320 Outdoor Supplies & Equipment Inc x 1998 Hamilton L8E 2W4wholesale turf supplies; ice melting products (winter)
418320 Vannoort M & Sons Bulb Co. Ltd x 1960 Stoney Creek L8E 5E4wholesalers of bulbs, perennial roots, fruit and vegetable roots & roses
418390 Agrico Canada x 1931 Hamilton L8H 7S3 terminal for bulk fertilizer and grain products
418390 Flamborough Farm Supply x 1996 Flamborough L0R 1V0 sell fertilizer & chemicals to farmers & retail store
418390 Outdoor Supplies & Equipment Inc x 1998 Hamilton L8E 2W4wholesaler of outdoor supplies such as fertilizer and de-I ing products, etc
418390 Sylvite Sales Inc x 1994 Hamilton L8L 4J5 fertilizer wholesale and distribution
419 Wholesale Agents and Brokers419130 JEM Food Brokers & Distribution x 1997 Hamilton L8T 2W5 retail food brokers
419130 National Grocers Cash & Carry x 1973 Hamilton L8M 3E3wholesale foods - supplies to independent grocers restaurants
419130 Winexpert Inc x 1993 Stoney Creek L8E 5S7 wholesale wine kits to self brew & retail stores
Appendix 8List of Agriculturally Related BusinessesBusinesses According to NAICS Classification
Number of employees
48 & 49 Transportation and Warehousing
481 Air Transportation NOTE: no businesses listed that provide agricultural products transportation
482 Rail Transportation
482113 Railink Southern Ontario x 1997 Hamilton L8N 3P9 Provide short hall railway transportation service.
483 Water Transportation NOTE: no businesses listed that provide agricultural products transportation
484 Truck Transportation48411 general freight trucking local NOTE: 7 businesses had descriptions that may provide agriculturally related trucking services
48212 general freight trucking long distance NOTE: 30 businesses listed that do long distance freight
4842 Specialized freight48422 Specialized freight trucking - local NOTE: 3-4 businesses had descriptions that may provide agriculturally related trucking48423 NOTE: 3-4 businesses had descriptions that may provide agriculturally related trucking
488 Support Activities for Transportation
48832 Marine Cargo Handling NOTE: 3-4 businesses had description that may provide agr related loading/warehousing activities
493 Warehousing and Storage
493110 x 1971 Stoney Creek L8E 2V9warehouse, shipping/receiving, wine bottles, juice bottles, glass bottles
493110 Hamilton Terminals x x Hamilton L8E 3V1 warehousing and storage493120 Atlas Cold Storage x 1954 Hamilton L8E 3M5 refrigerated warehouse
54194 Veterinary Services NOTE: 36 businesses listed including animal hospitals/clinicsNOTE: only 4 business specified large animal services or general services, although location of many others would imply farm services.
541940 Dr. Gerald Dinelle x 1987 Dundas L0R 2H2Veterinarian stable standard breed horses train horses for races buggies
541940 Flamboro Vet Services x 1986 Dundas L9H 5E2 Veterinary Services for large & small animals541940 McMaster Equine x 1991 Campbellville L0P 1B0 Veterinarian Office for horses only
711213 Horse Race Tracks711213 Bond Curt Racing Stables x 1978 Ancaster L9G 4G3 training/racing stables for standard bred horses711213 Flamboro Downs Harness Racing x 1970 Dundas L9H 5G1 horse racing track
Source: Hamilton On Line Business Directory, February 2003
NOTE: no farm product warehousing and storage facilities listed (49313)
Specialized freight trucking - long distance
Consumers Glass (Saltfleet Warehouse)
August 15, 2003 PLANSCAPE - Building Community through Planning