Where Did Agriculture Originate?. Origins of agriculture Agriculture = deliberate modification of Earth’s surface through the cultivation of plants and/or rearing of animals Cultivate = “to care for” Crop = any plant cultivated by people. Where Did Agriculture Originate?. - PowerPoint PPT Presentation
Where Did Agriculture Originate? • Origins of agriculture – Agriculture = deliberate modification of Earth’s surface through the cultivation of plants and/or rearing of animals – Cultivate = “to care for” – Crop = any plant cultivated by people
Transcript
Where Did Agriculture Originate?• Origins of agriculture– Agriculture = deliberate modification of Earth’s
surface through the cultivation of plants and/or rearing of animals
– Cultivate = “to care for”– Crop = any plant cultivated by people
Where Did Agriculture Originate?• Origins of agriculture– Hunter-gatherers• Perhaps 250,000 remaining today
– Invention of agriculture• When it began = unclear• Diffused from many hearths
Crop Hearths
Figure 10-2
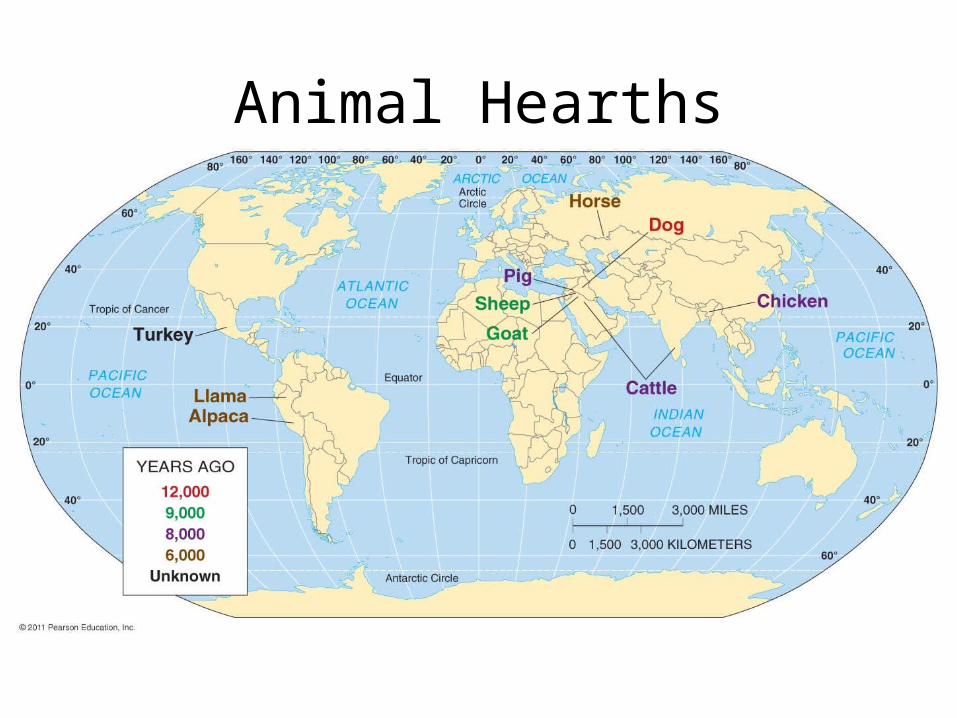
Animal Hearths
Figure 10-3
Where Did Agriculture Originate?
• Commercial and subsistence agriculture– Subsistence = produced mainly for the farm
family’s survival• Most common in LDCs
– Commercial = produced mainly for sale off the farm• Most common in MDCs
Agriculture and Climate
Figure 10-4
Where Did Agriculture Originate?• Commercial and subsistence agriculture– Five characteristics distinguish commercial
from subsistence agriculture• Purpose of farming• Percentage of farmers in the labor force• Use of machinery • Farm size• Relationship of farming to other businesses
Agricultural Workers
Figure 10-5
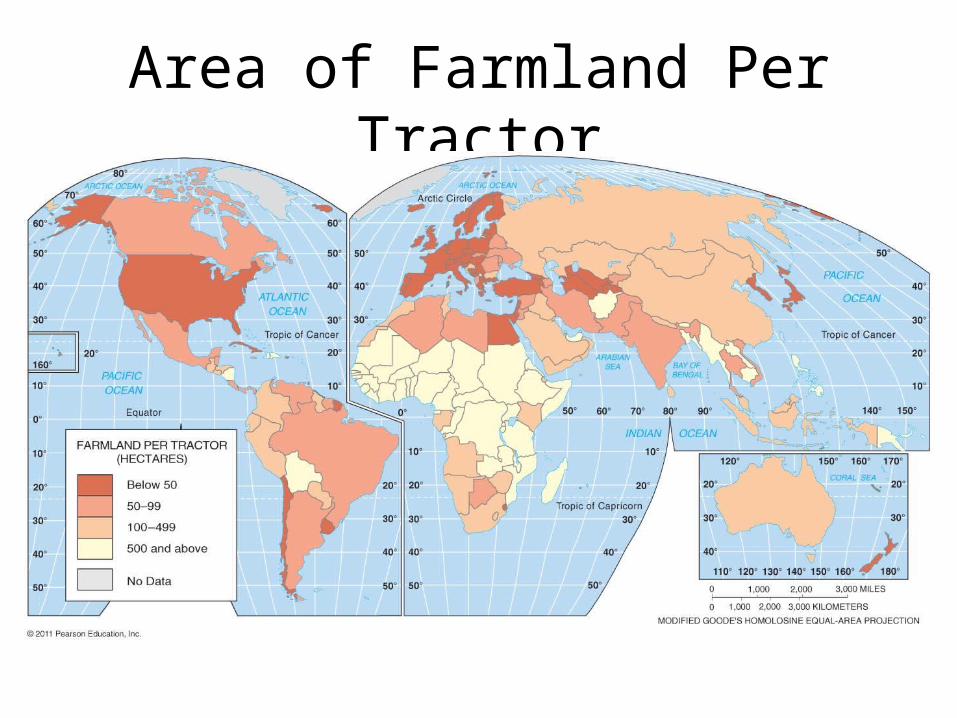
Area of Farmland Per Tractor
Figure 10-6
Where are Agricultural Regions in LDCs?
• Shifting cultivation– Most prevalent in low-latitude, A-type climates– Two features:• Land is cleared by slashing and burning debris
– Slash-and-burn agriculture
• Land is tended for only a few years at a time
– Types of crops grown vary regionally– Traditionally, land is not owned individually
– Found primarily in arid and semiarid B-type climates
– Animals are seldom eaten• The size of the herd indicates power and prestige
– Type of animal depends on the region• For example, camels are favored in North Africa and
Southwest Asia
– Transhumance practiced by some pastoral nomads
Where are Agricultural Regions in LDCs?
• Intensive subsistence– Found in areas with high population and
agricultural densities• Especially in East, South, and Southeast Asia • To maximize production, little to no land is wasted
– Intensive with wet rice dominant– Intensive with wet rice not dominant
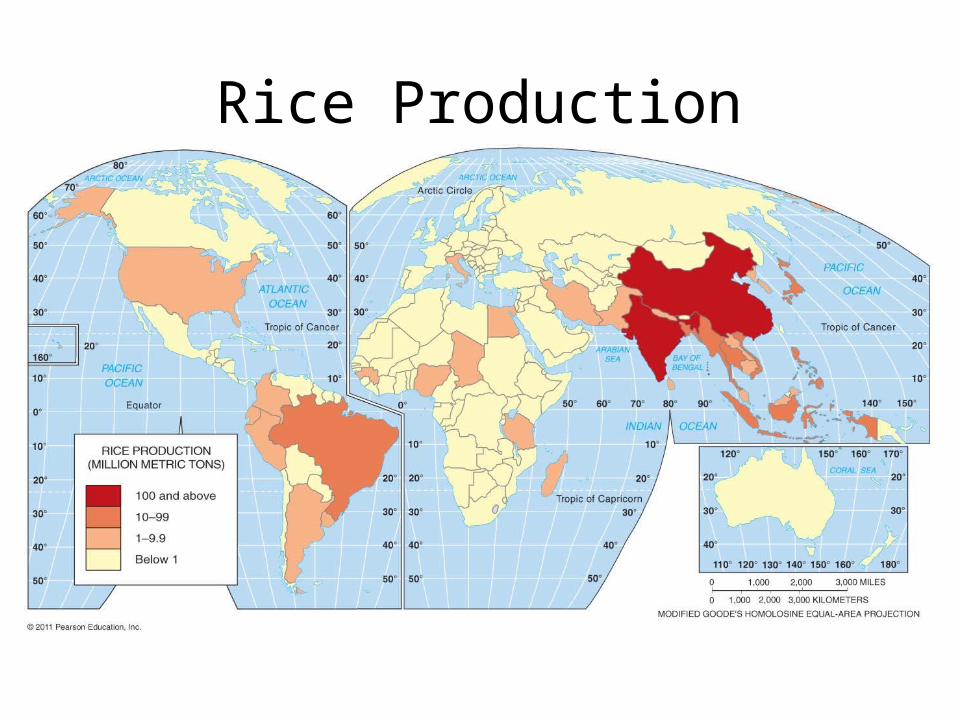
Rice Production
Figure 10-12
Where are Agricultural Regions in LDCs?
• Plantation farming– Found in Latin America, Africa, and Asia– Products are grown in LDCs but typically are
sold to MDCs– Plantations specialize in one or two cash crops• Important crops = coffee, sugarcane, cotton,
rubber, and tobacco
– A large labor force is usually needed in sparsely settled regions
Where are Agricultural Regions in MDCs?
• Mixed crop and livestock farming– Most land = devoted to crops– Most profits = derive from the livestock
• Dairy farming– Regional distribution: the milkshed– Two primary challenges• Labor-intensive• Expense of winter feed
Corn (Maize) Production
Figure 10-15
Milk Production
Figure 10-17
Where are Agricultural Regions in MDCs?
• Grain farming– The largest commercial producer of grain = the United
States
• Livestock ranching– Practiced in marginal environments
• Mediterranean agriculture– Based on horticulture
• Commercial gardening and fruit farming– Truck farms
Wheat Production
Figure 10-19
Meat Production
Figure 10-21
Why Do Farmers Face Economic Difficulties?
• Challenges for commercial farmers– Access to markets is important
• The von Thünen model (1826)– The choice of crop to grow is related to the proximity to the
market
Figure 10-24
Why Do Farmers Face Economic Difficulties?
• Challenges for commercial farmers– Overproduction• Agricultural efficiencies have resulted in
overproduction• Demand has remained relatively constant
– As a consequence, incomes for farmers are low
– Sustainable agriculture• Sensitive land management• Integrated crop and livestock
Why Do Farmers Face Economic Difficulties?
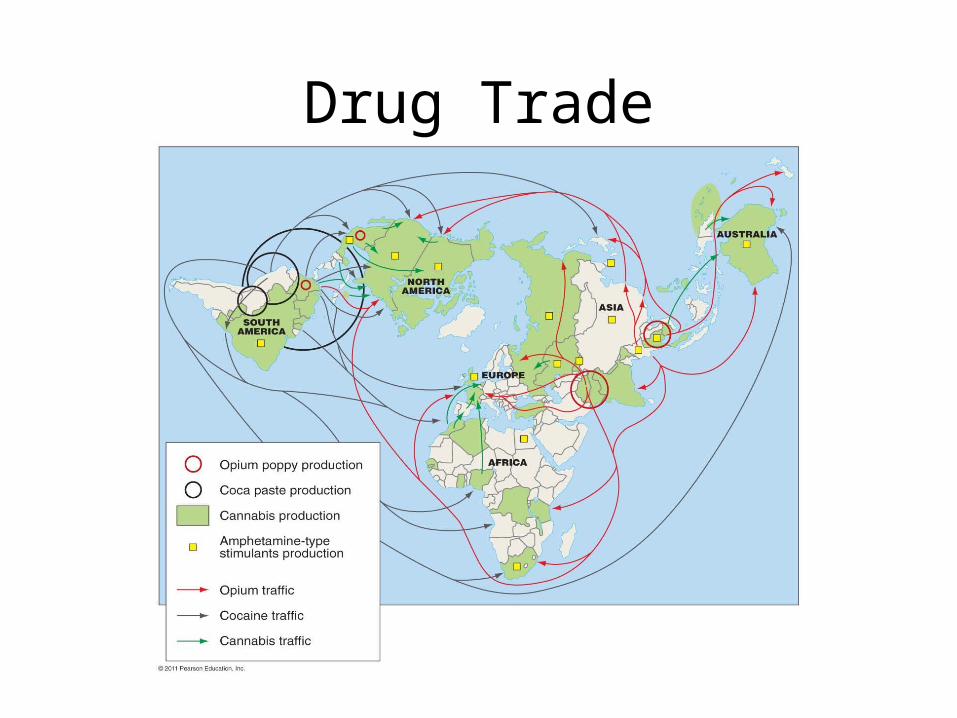
• Challenges for subsistence farmers– Population growth– International trade– Drug crops
Drug Trade
Figure 10-27
Why Do Farmers Face Economic Difficulties?
• Strategies to increase food supply– Expanding agricultural land• Desertification
– Increasing productivity • The green revolution
– Identifying new food sources• Cultivating oceans, developing higher-protein
cereals, and improving palatability of foods– Increasing trade
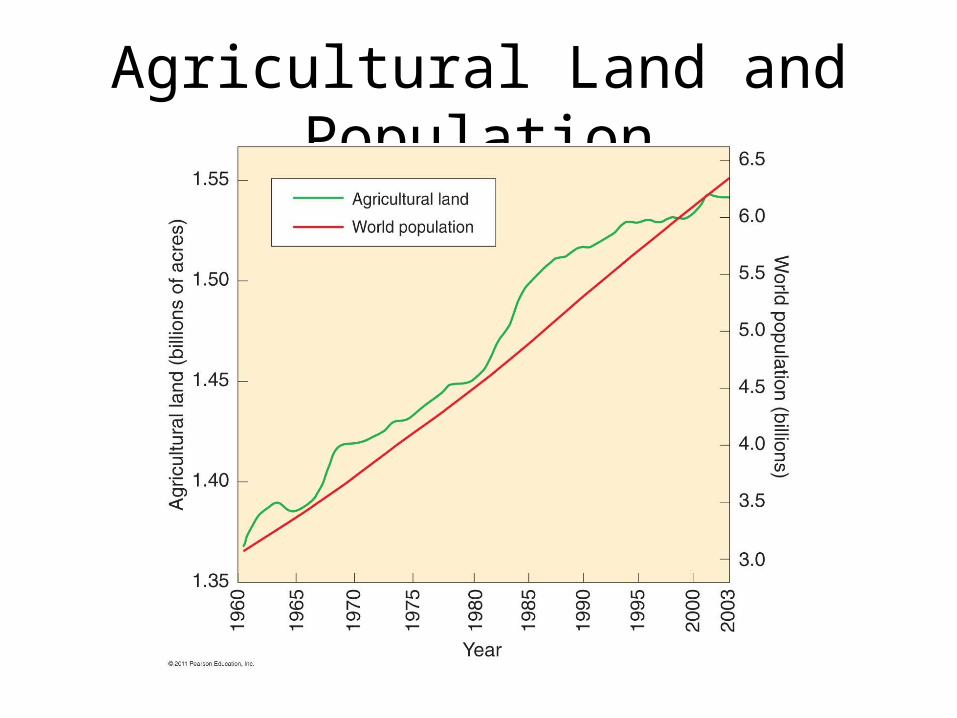
Agricultural Land and Population
Figure 10-28
Grain Imports and Exports
Figure 10-32
Where is Industry Distributed?• Origin of industry– From cottage industries to the Industrial
Revolution – Impact of the Industrial Revolution especially
great on iron, coal, transportation, textiles, chemicals, and food processing
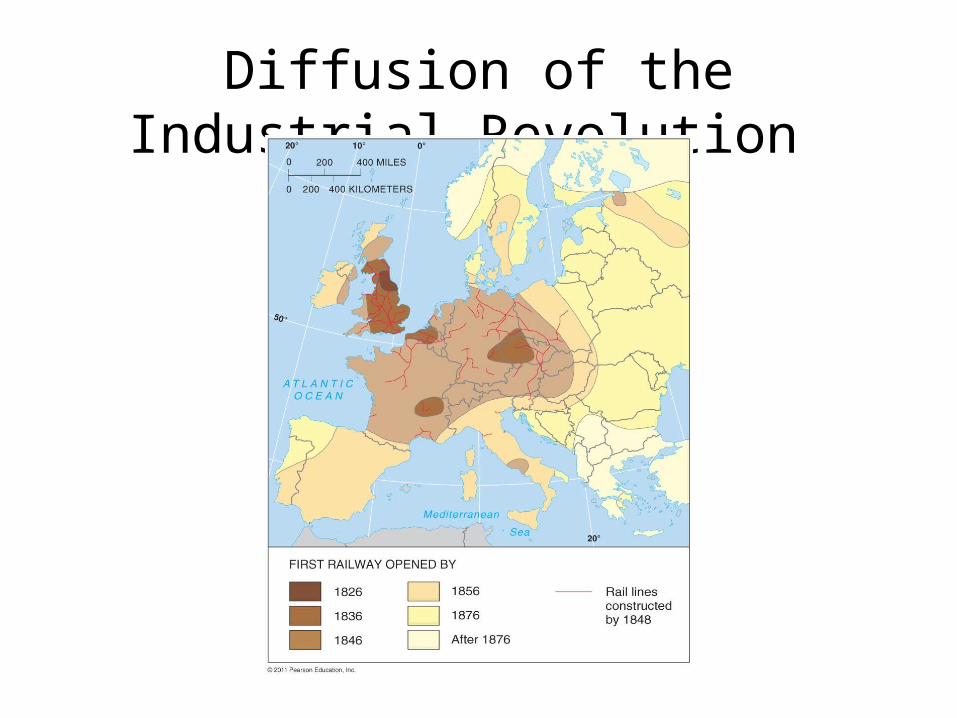
Diffusion of the Industrial Revolution
Figure 11-2
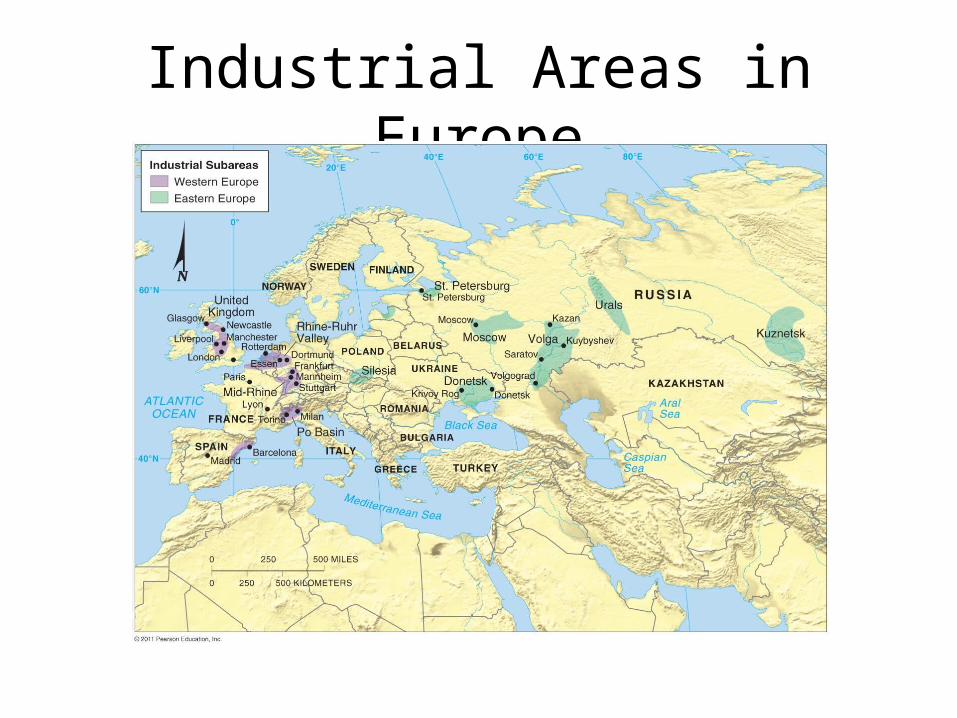
Where is Industry Distributed?• Industrial regions– Europe• Emerged in late nineteenth and early twentieth
centuries
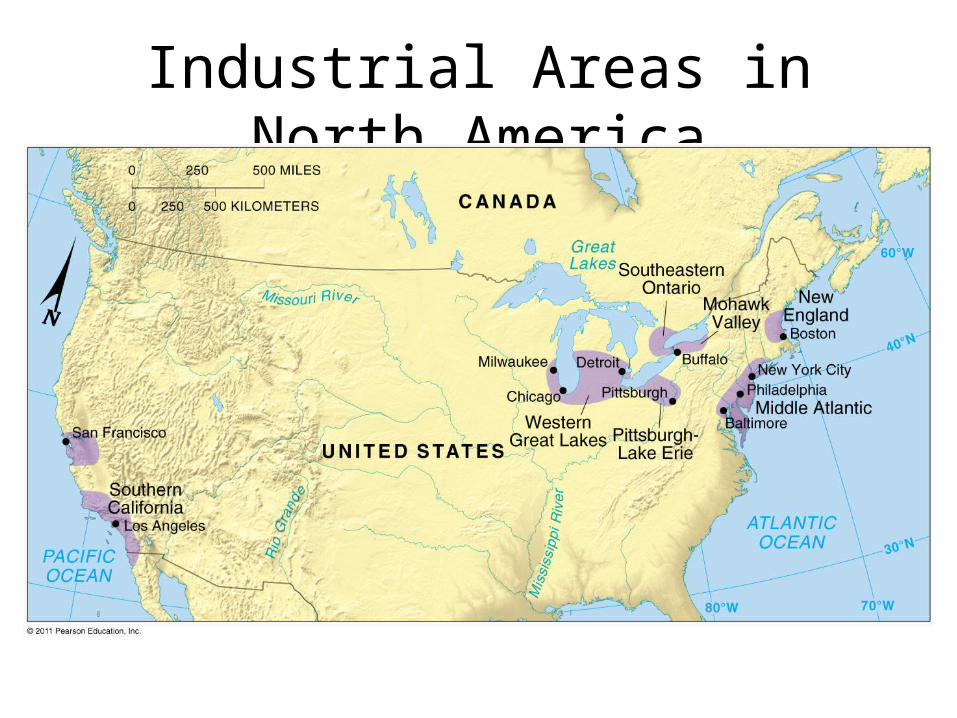
– North America• Industry arrived later but spread faster than in
Europe
– East Asia
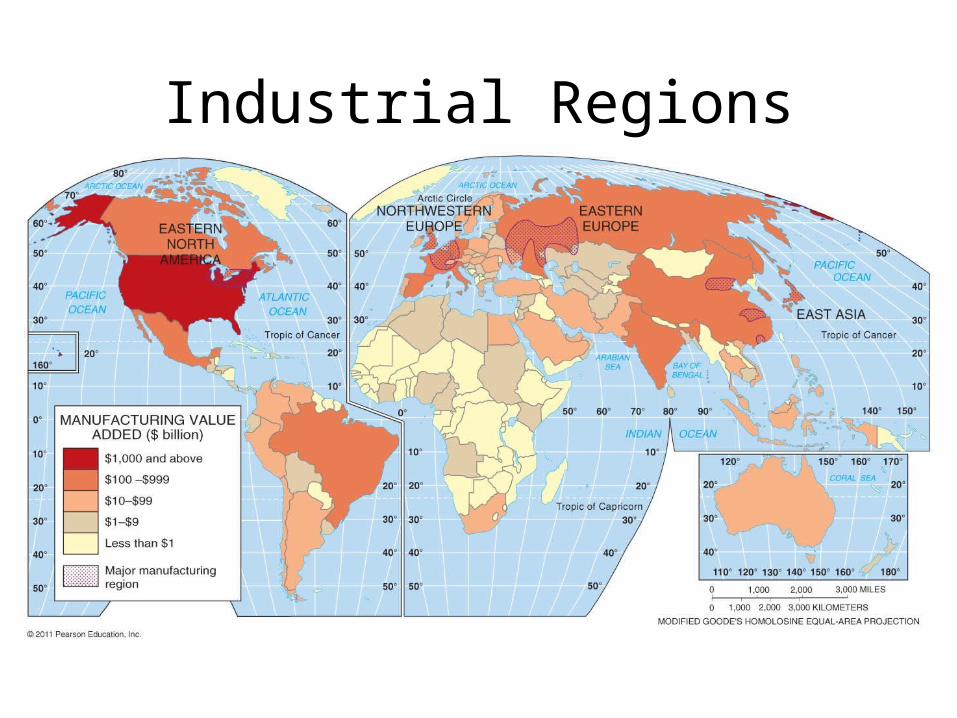
Industrial Regions
Figure 11-3
Industrial Areas in Europe
Figure 11-4
Industrial Areas in North America
Figure 11-5
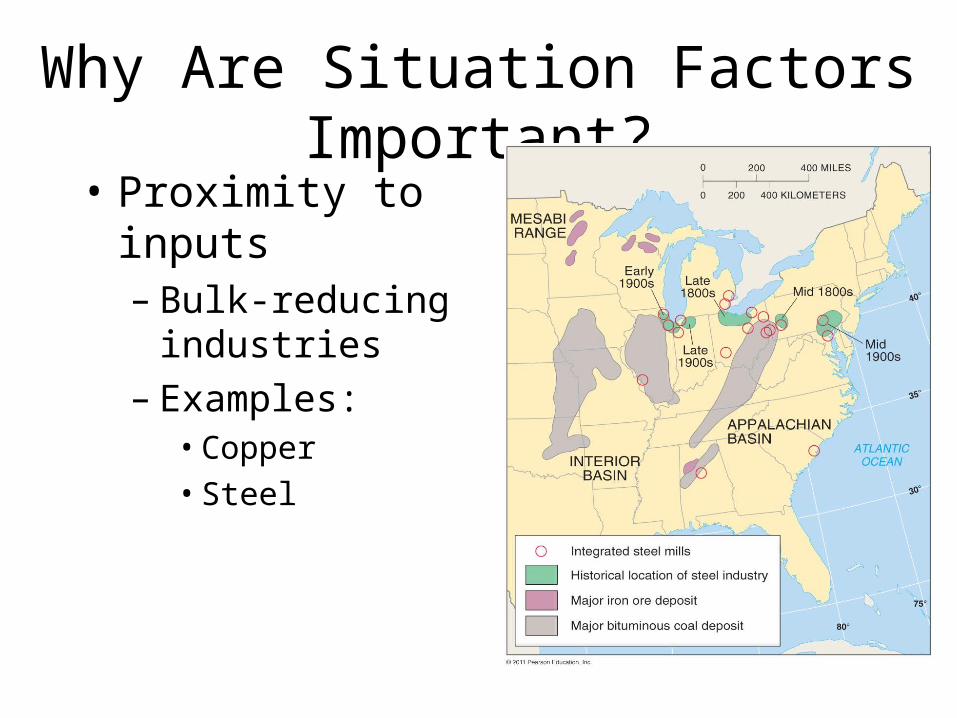
Why Are Situation Factors Important?• Proximity to inputs– Bulk-reducing
industries– Examples:• Copper• Steel
Figure 11-8
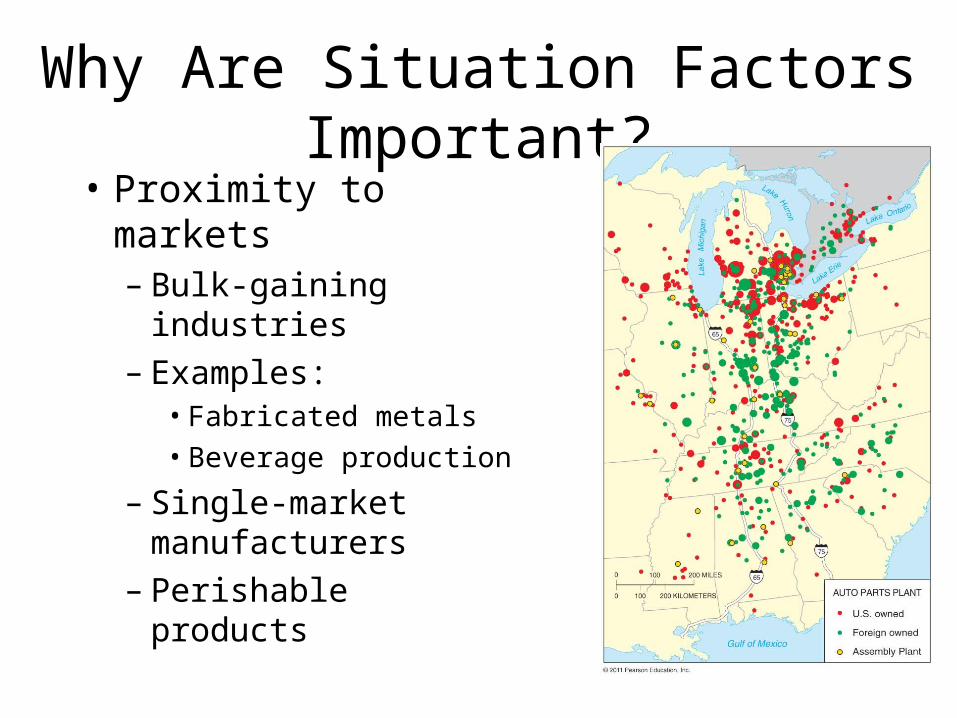
Why Are Situation Factors Important?• Proximity to markets– Bulk-gaining industries– Examples:• Fabricated metals• Beverage production
– Single-market manufacturers
– Perishable products
Figure 11-10
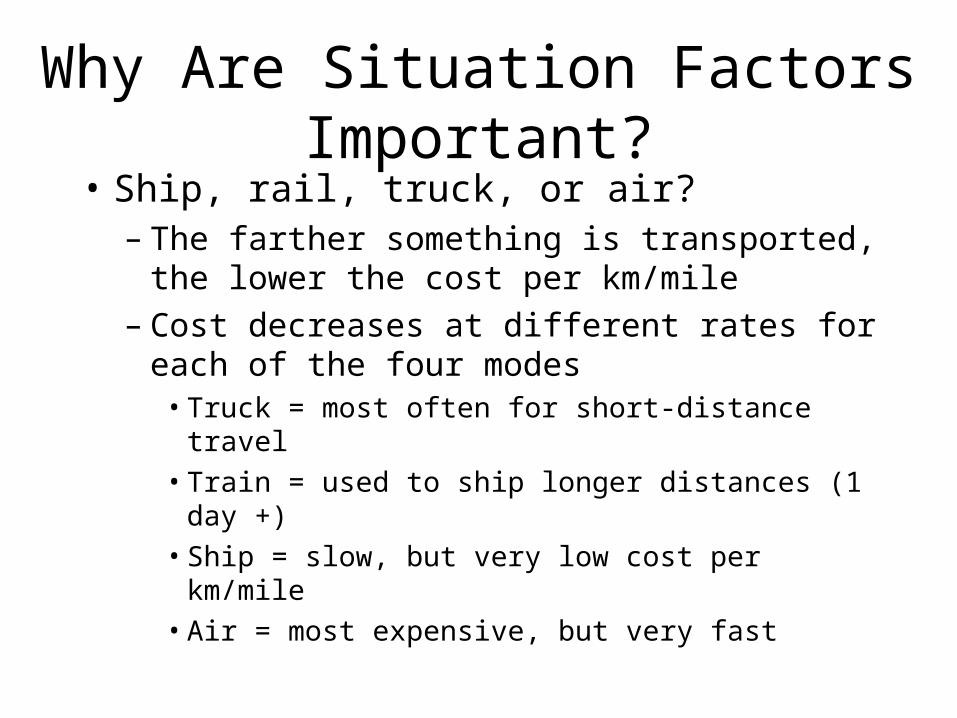
Why Are Situation Factors Important?• Ship, rail, truck, or air?– The farther something is transported, the
lower the cost per km/mile– Cost decreases at different rates for each of
the four modes• Truck = most often for short-distance travel• Train = used to ship longer distances (1 day +)• Ship = slow, but very low cost per km/mile• Air = most expensive, but very fast
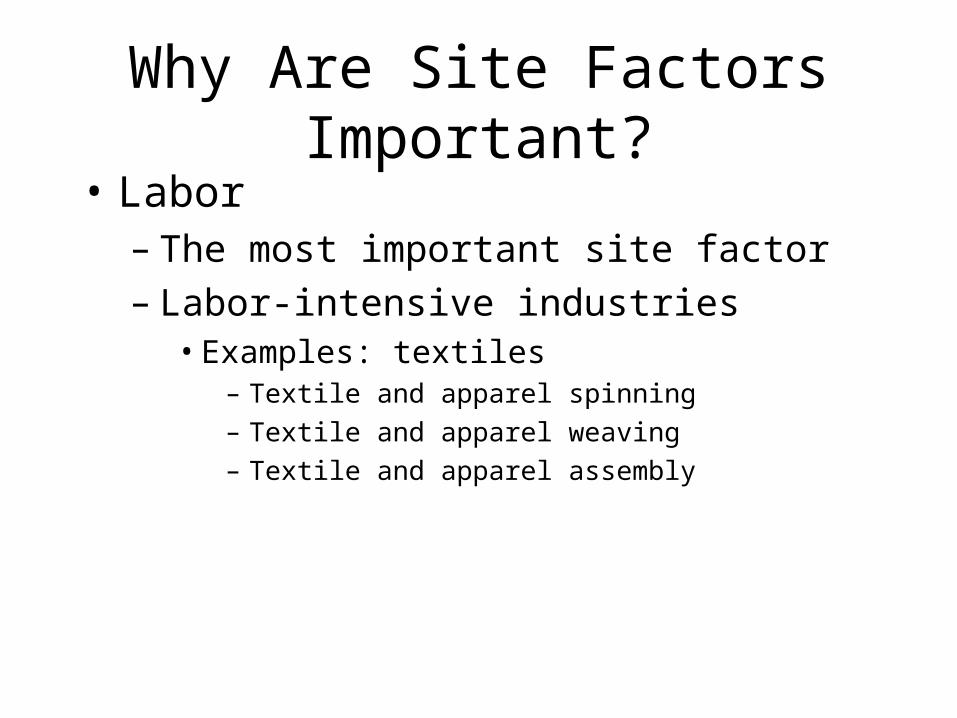
Why Are Site Factors Important?• Labor– The most important site factor– Labor-intensive industries• Examples: textiles
– Textile and apparel spinning – Textile and apparel weaving– Textile and apparel assembly
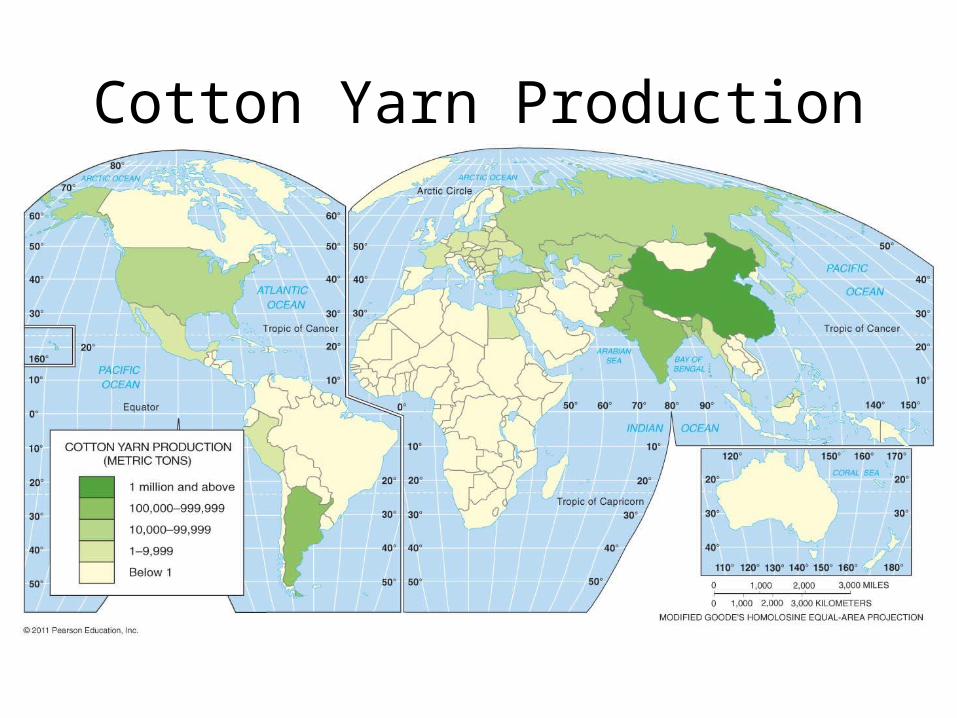
Cotton Yarn Production
Figure 11-16
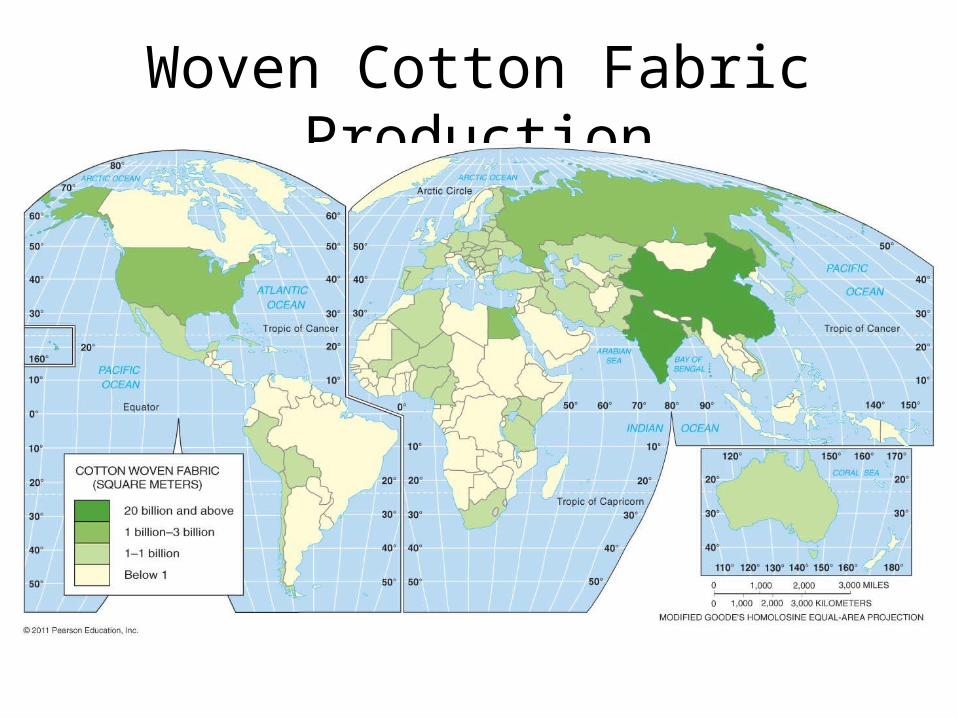
Woven Cotton Fabric Production
Figure 11-17
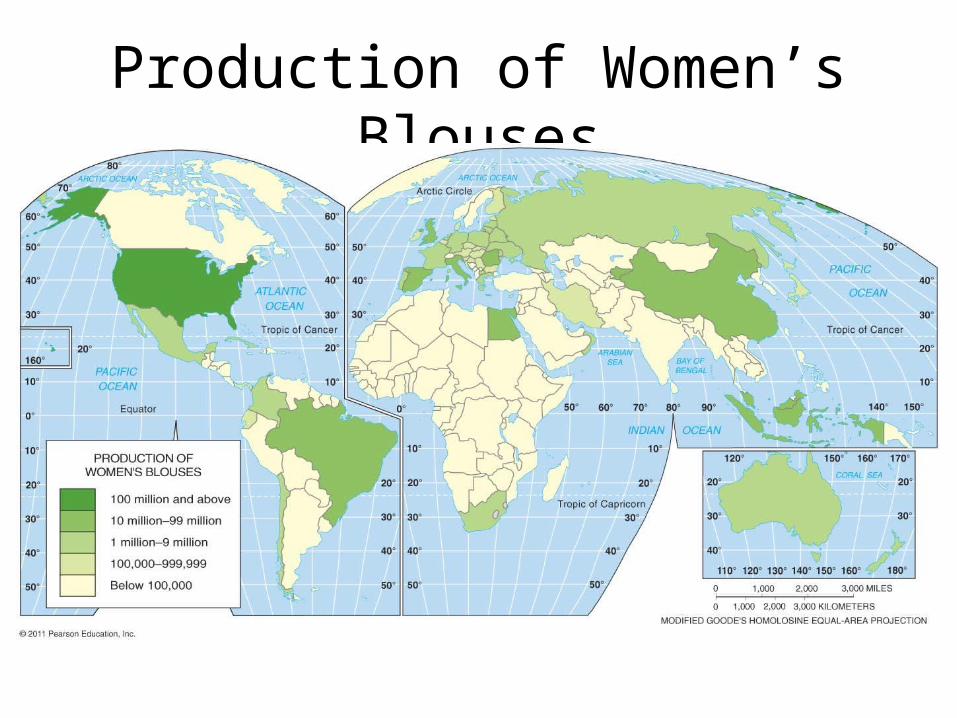
Production of Women’s Blouses
Figure 11-18
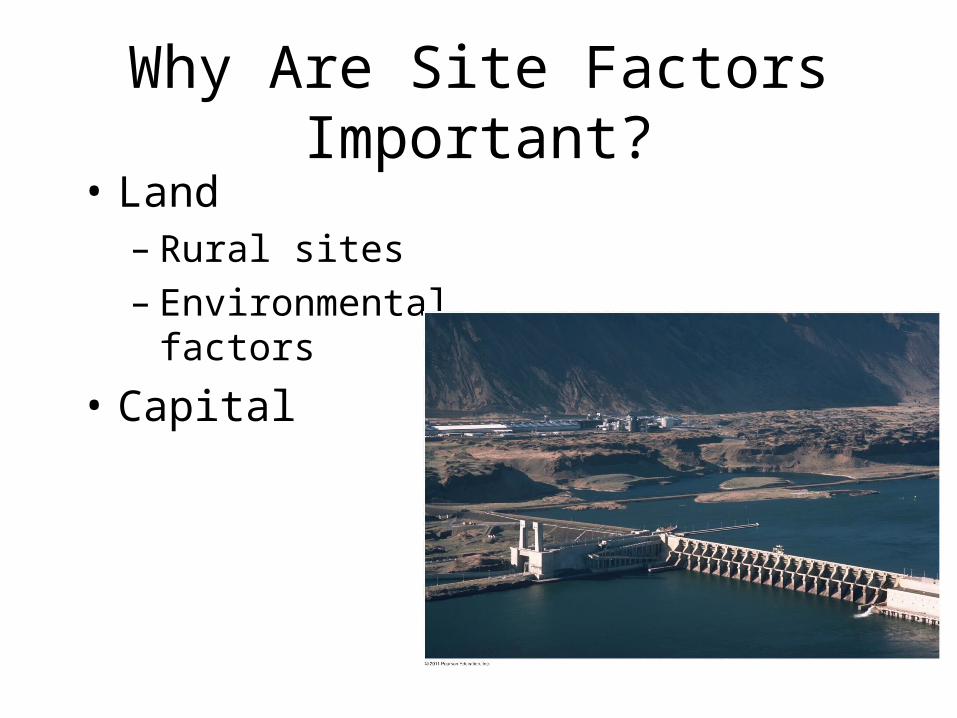
Why Are Site Factors Important?• Land– Rural sites– Environmental factors
• Capital
Figure 11-20
Why Are Location Factors Changing?• Attraction of new industrial regions– Changing industrial distribution within MDCs• Interregional shift within the United States
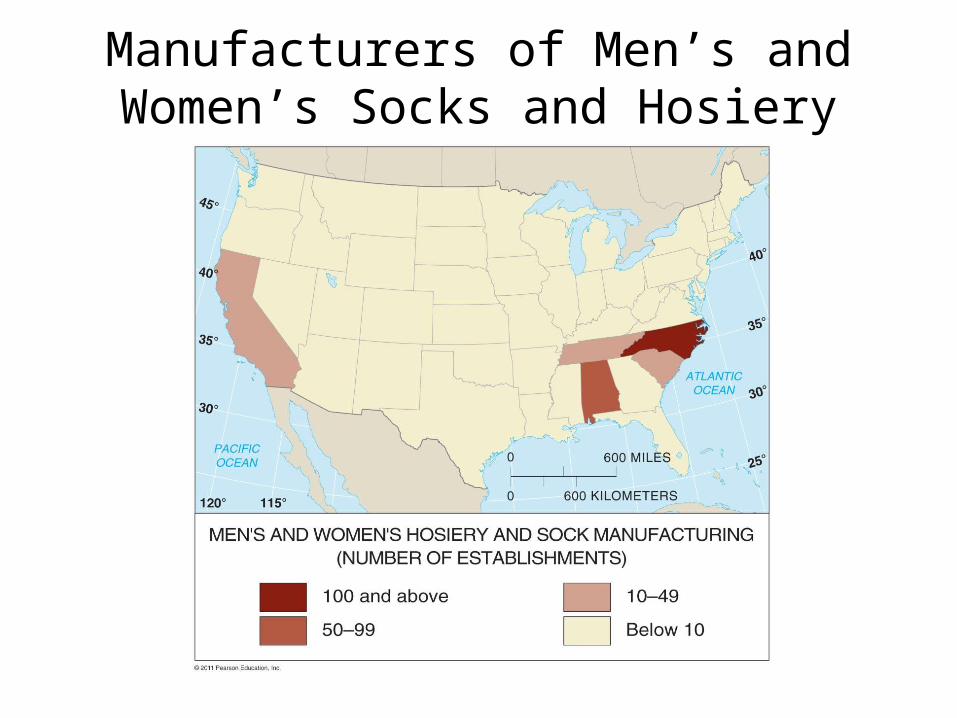
– Right-to-work laws– Textile production
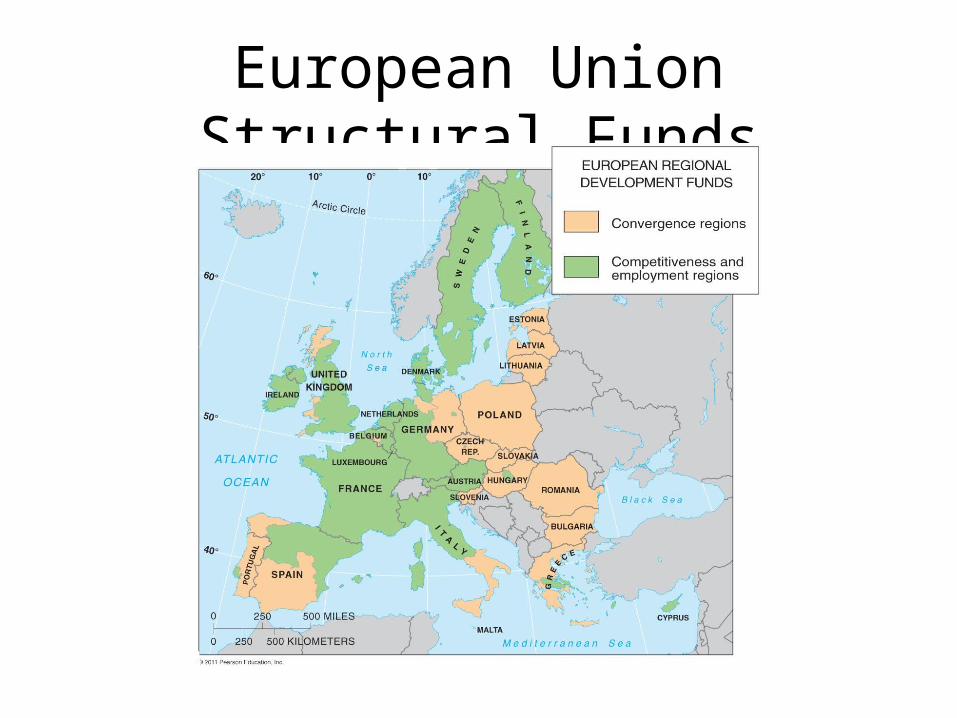
• Interregional shifts in Europe– Convergence shifts– Competitive and employment regions
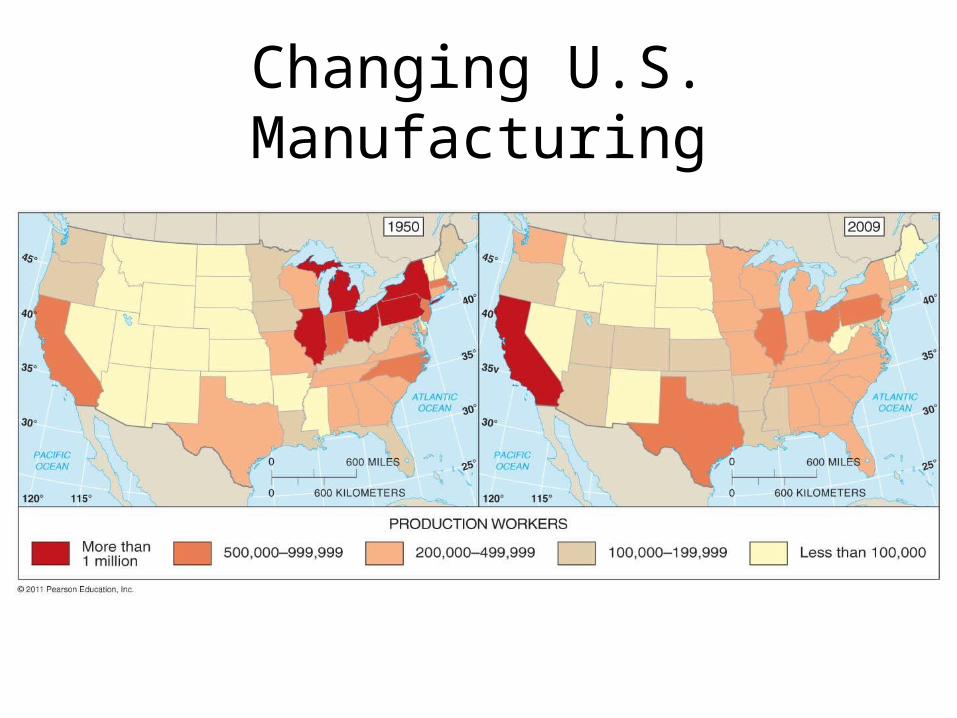
Changing U.S. Manufacturing
Figure 11-21
Manufacturers of Men’s and Women’s Socks and Hosiery
Figure 11-22
European Union Structural Funds
Figure 11-23
Why Are Location Factors Changing?• Attraction of new industrial regions– International shifts in industry• East Asia• South Asia• Latin America
– Changing distributions– Outsourcing
World Steel Production
Figure 11-24
Global Production
Figure 11-25
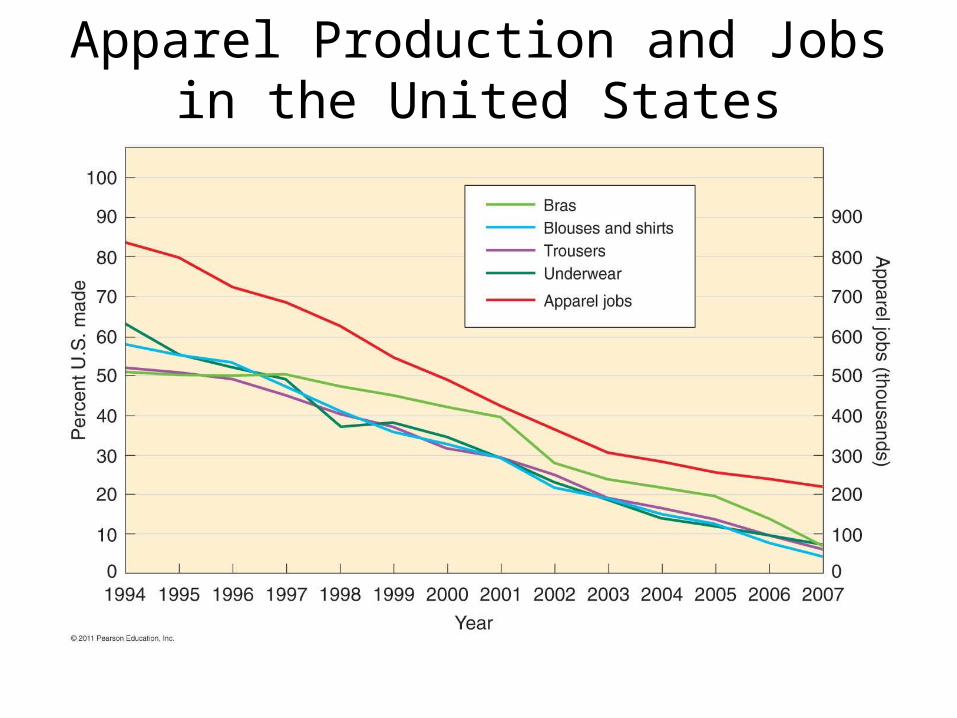
Apparel Production and Jobs in the United States
Figure 11-26
Why Are Location Factors Changing?
• Renewed attraction of traditional industrial regions– Proximity to skilled labor• Fordist, or mass production• Post-Fordist, or lean production• Just-in-time delivery
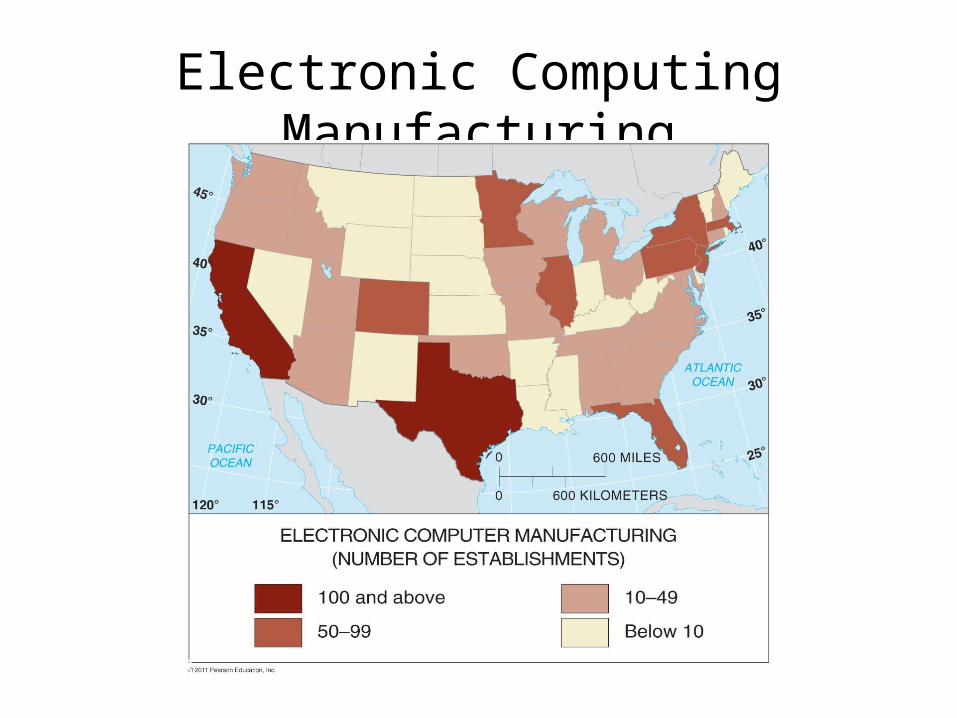
Electronic Computing Manufacturing
Figure 11-28
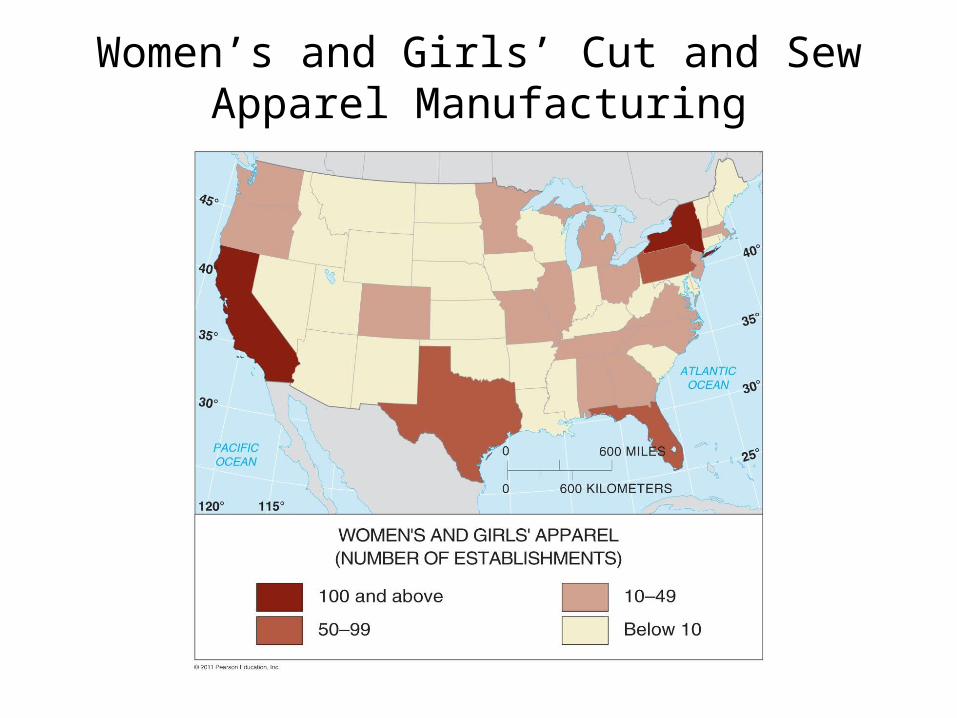
Women’s and Girls’ Cut and Sew Apparel Manufacturing
Figure 11-29
Services• Service = any activity that fulfills a human
want or need• Services are located in settlements– Location of services is important for
profitability – Affluent regions tend to offer more services – Local diversity is evident in the provision of
services
Where Did Services Originate?• Three types of services– Consumer services• About 44 percent of all jobs in the United States
– Business services• About 24 percent of all jobs in the United States
– Public services• About 17 percent of all jobs in the United States
– In the United States, all employment growth has occurred in the services sector
Percentage of GDP from Services, 2005
Figure 12-1
Employment Change in the United States by Sector
Figure 12-2
Where Did Services Originate?• Services in early rural settlements– Early consumer services met societal needs• Examples = burial of the dead, religious centers,
manufacturing centers
– Early public services probably followed religious activities
– Early business services to distribute and store food
Where Did Services Originate?• Services in early urban settlements– Services in ancient cities• Earliest urban settlements (e.g., Ur), Athens, Rome
– Services in medieval cities • Largest settlements were in Asia• European cities developed with feudalism
Where Are Contemporary Services Located?
• Services in rural settlements– Half of the world’s population lives in rural
settlements– Two types
• Clustered rural settlements– Circular or linear– Clustered settlements in Colonial America
• Dispersed rural settlements– In the United States– In Great Britain
» Enclosure movement
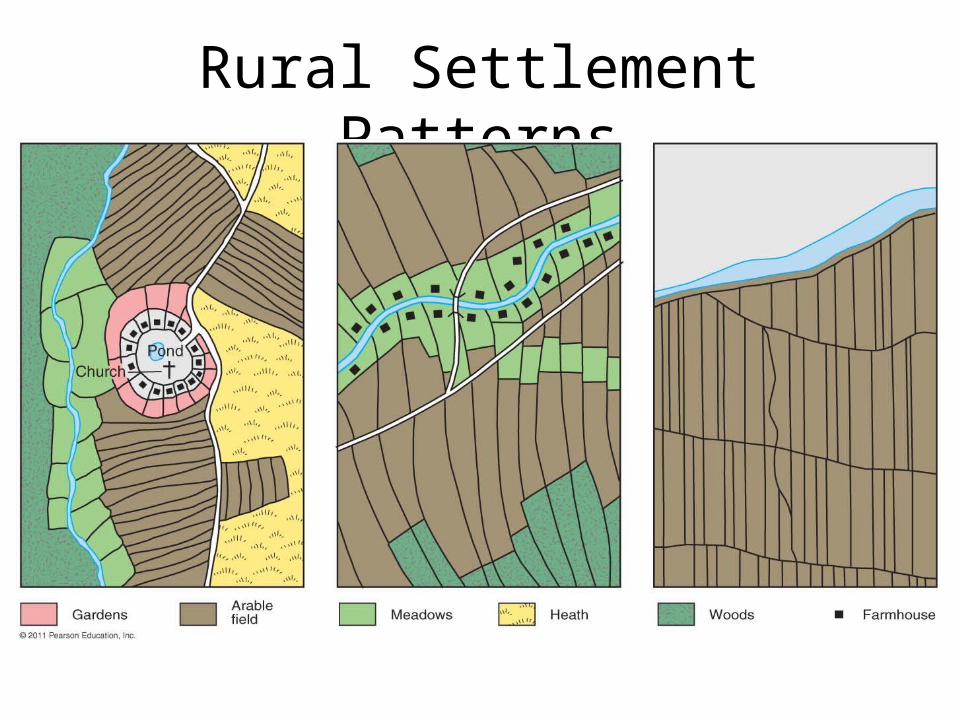
Rural Settlement Patterns
Figure 12-10
Where Are Contemporary Services Located?
• Services in urban settlements– Differences between urban and rural
settlements• Large size• High density• Social heterogeneity
– Increasing percentage of people in cities– Increasing number of people in cities
Percentage of Population Living in Urban Settlements
Figure 12-14
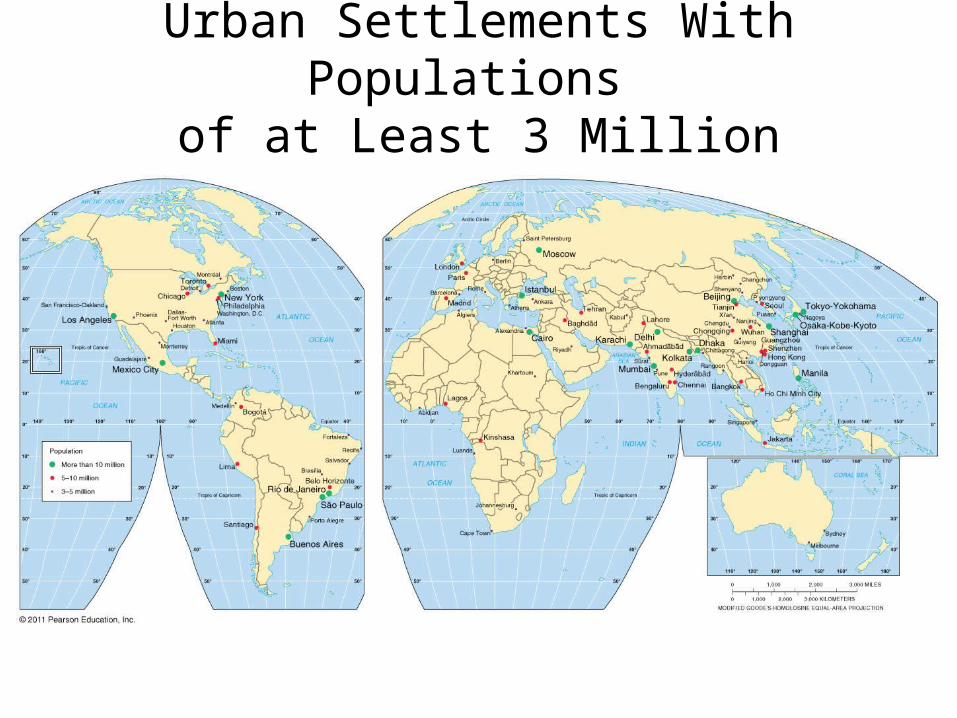
Urban Settlements With Populations of at Least 3 Million
Figure 12-15
Why Are Consumer Services Distributed in a Regular Pattern?
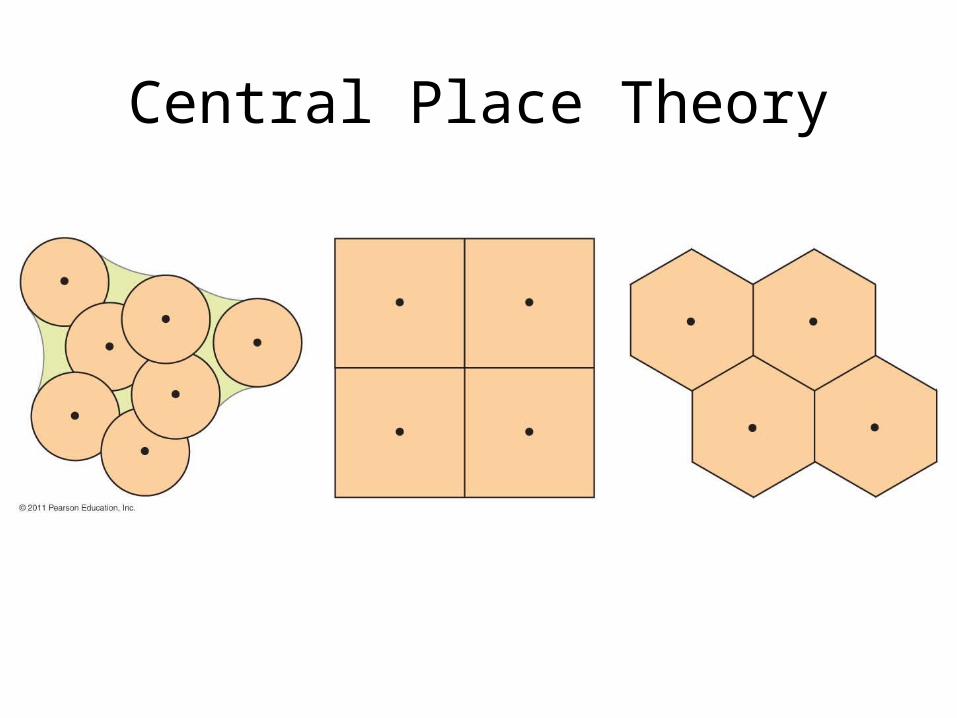
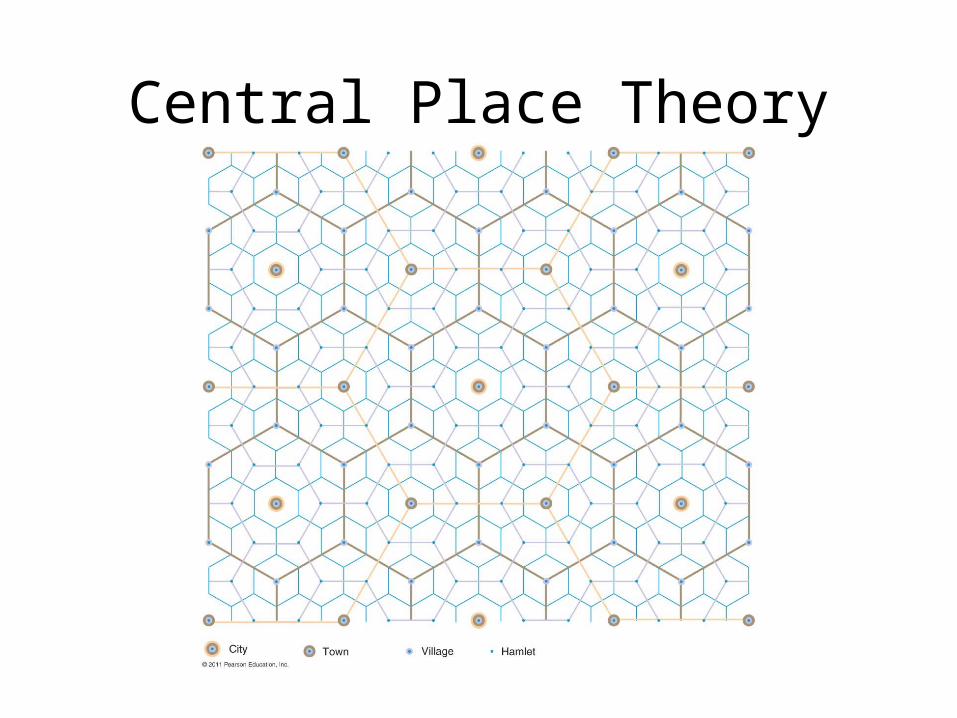
• Central place theory– First proposed by Walter Christaller (1930s)– Characteristics• A central place has a market area (or hinterland)
– Size of a market area• Range• Threshold
“Daily Urban Systems”
Figure 12-16
Central Place Theory
Figure 12-17
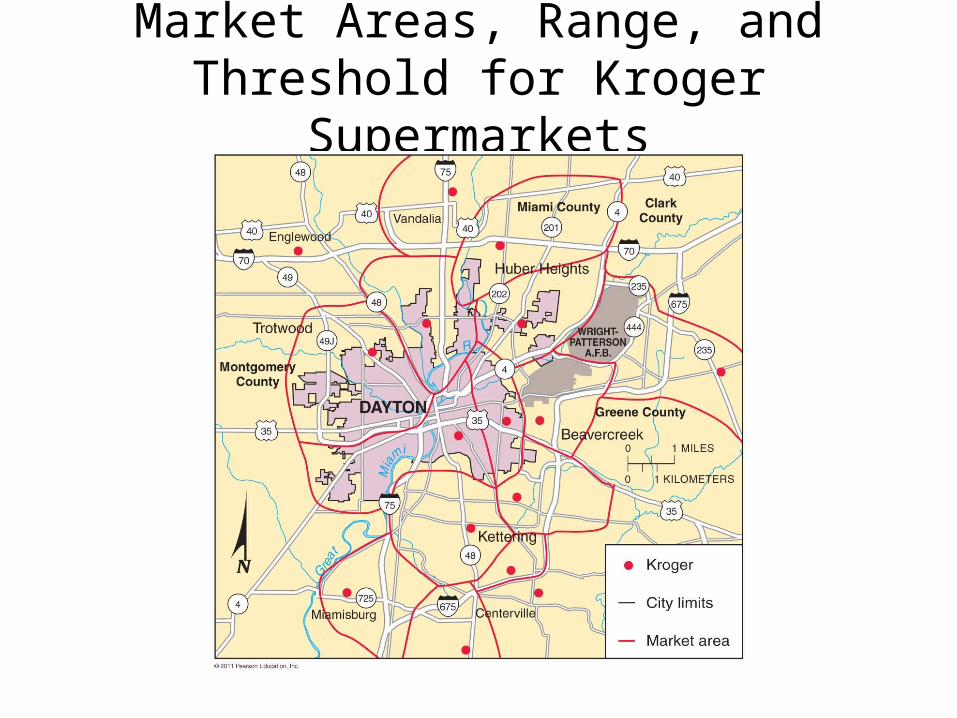
Market Areas, Range, and Threshold for Kroger Supermarkets
Figure 12-18
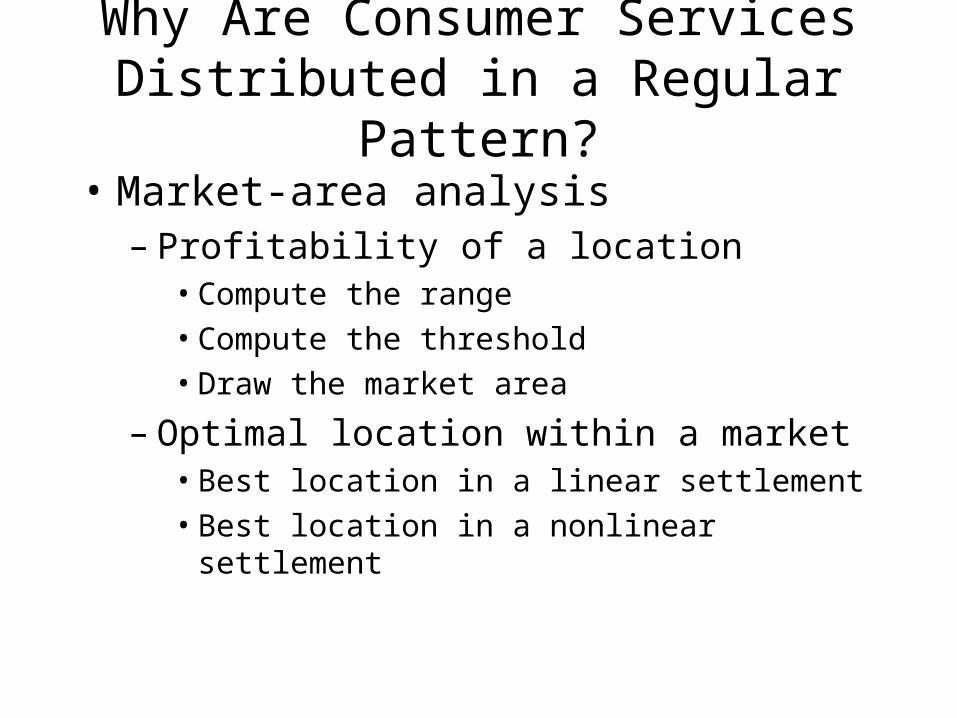
Why Are Consumer Services Distributed in a Regular Pattern?
• Market-area analysis– Profitability of a location• Compute the range• Compute the threshold• Draw the market area
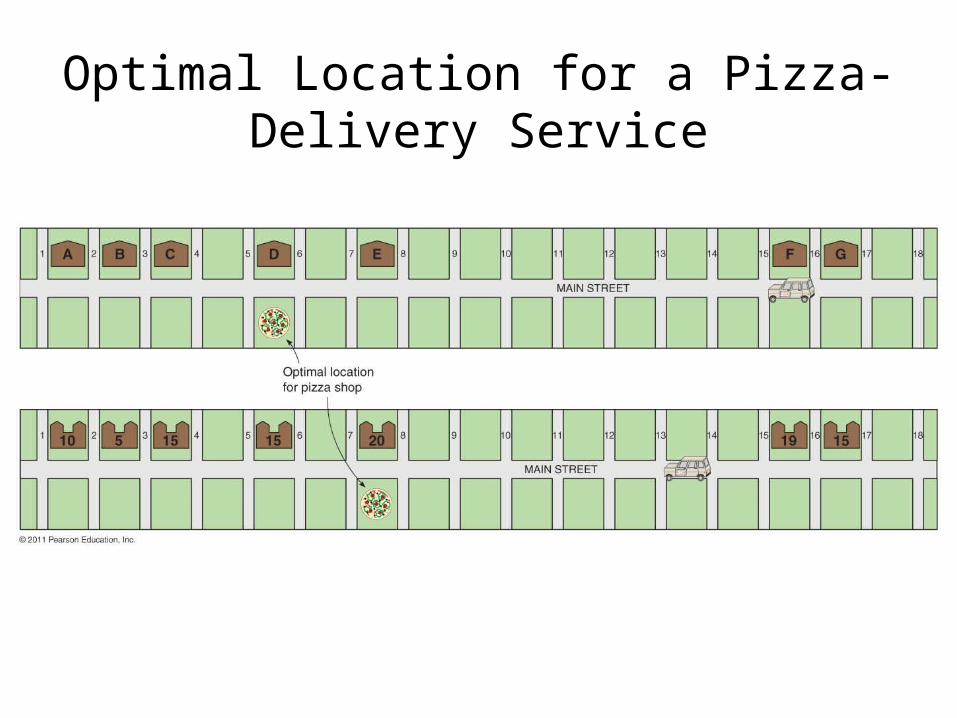
– Optimal location within a market• Best location in a linear settlement• Best location in a nonlinear settlement
Optimal Location for a Pizza-Delivery Service
Figure 12-20
Why Are Consumer Services Distributed in a Regular Pattern?
• Hierarchy of services and settlements– Nesting• Market areas in MDCs = a series of hexagons of
various sizes
– Rank-size distribution of settlements• Primate city rule
– Primate cities
– Periodic markets
Central Place Theory
Figure 12-21
Rank-Size Distribution in theUnited States and Indonesia
Figure 12-23
Why Do Business Services Cluster in Large Settlements?
• Hierarchy of business services– Services in world cities
• Business: clustering of services is a product of the Industrial Revolution
• Consumer: retail services with extensive market areas– May include leisure services of national importance due to
large thresholds, large ranges, and the presence of wealthy patrons.
• Public: world cities are often the center of national or international political power
World Cities
Figure 12-25
Why Do Business Services Cluster in Large Settlements?
• Business services in LDCs– Offshore financial services• Two functions:
– Taxes– Privacy
– Back offices• LDCs are attractive because of:
– Low wages– Ability to speak English
Why Do Business Services Cluster in Large Settlements?
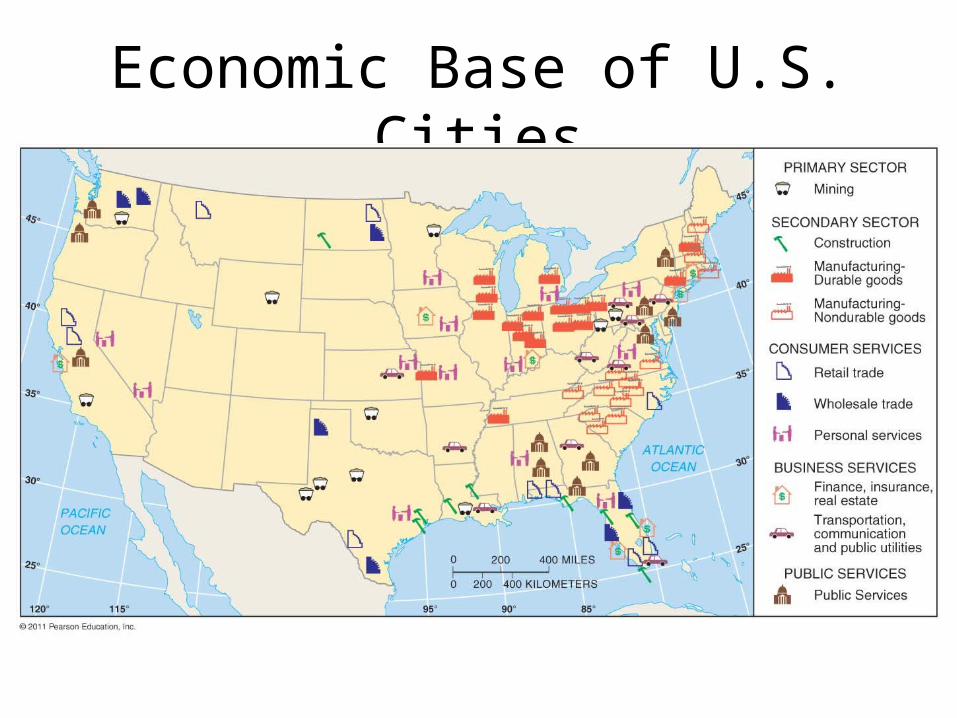
• Economic base of settlements– Two types:• Basic industries• Nonbasic industries
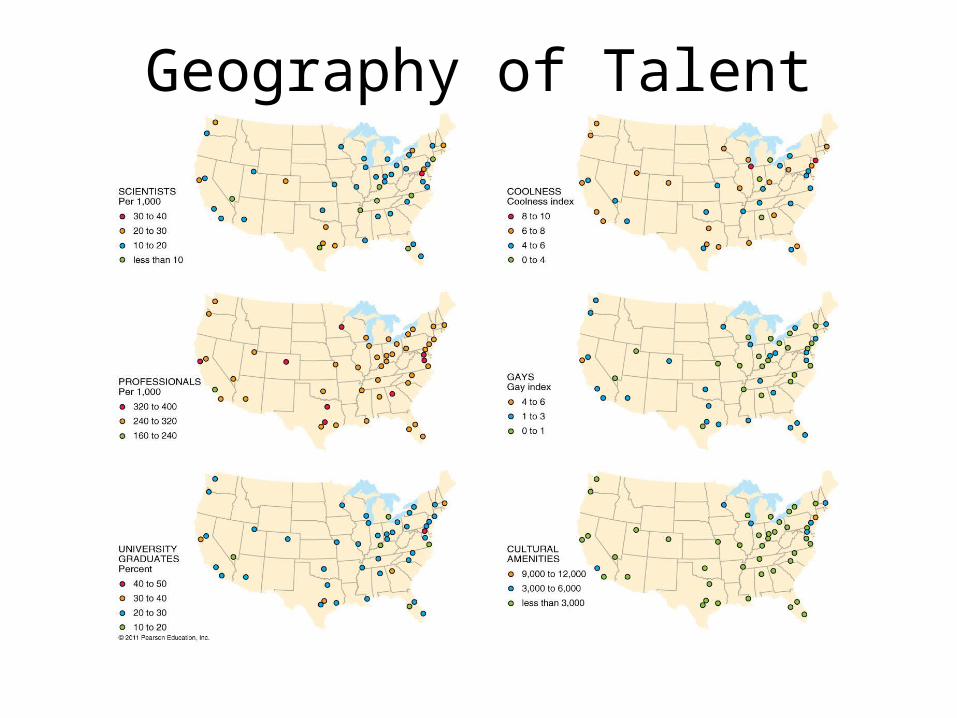
– Specialization of cities in different services– Distribution of talent
Economic Base of U.S. Cities
Figure 12-28
Geography of Talent
Figure 12-29
Why Do Services Cluster Downtown?• CBD land uses– Central business districts (CBDs)– Retail services in the CBD• Retailers with a high threshold• Retailers with a high range• Retailers serving downtown workers
– Business services in the CBD
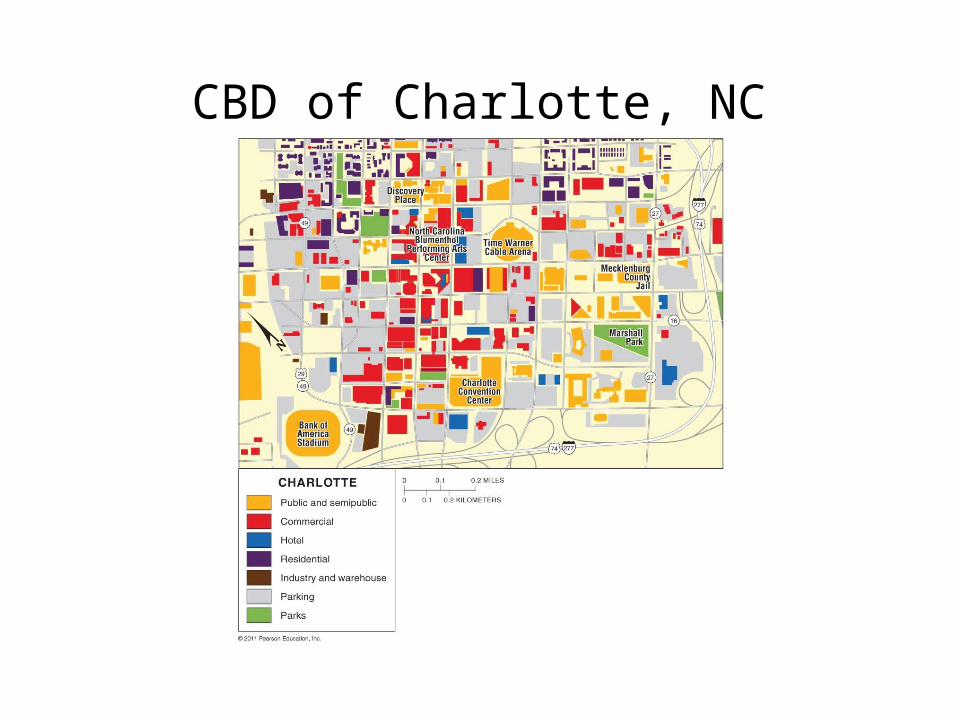
CBD of Charlotte, NC
Figure 13-1
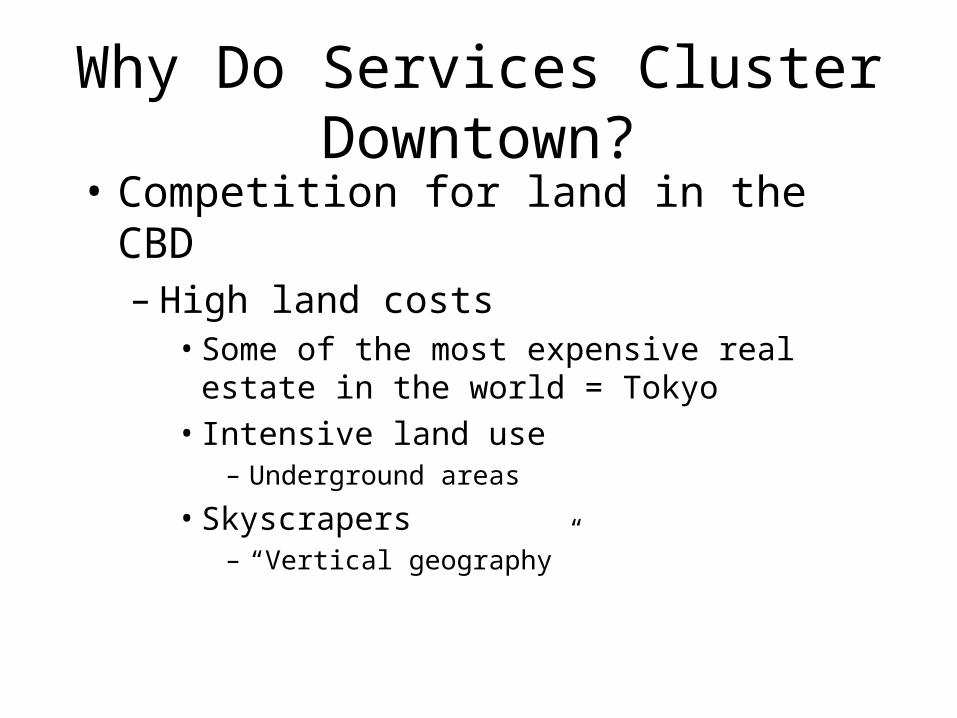
Why Do Services Cluster Downtown?• Competition for land in the CBD– High land costs• Some of the most expensive real estate in the
world = Tokyo• Intensive land use
– Underground areas
• Skyscrapers – “Vertical geography”
Why Do Services Cluster Downtown?• Activities excluded from the CBD– Lack of industry in the CBD• Modern factories require large, one-story parcels of
land
– Lack of residents in the CBD• Push and pull factors involved
• CBDs outside North America– Less dominated by commercial considerations.
Where Are People Distributed in Urban Areas?
• Models of urban structure– Are used to explain where people live in cities– Three models, all developed in the city of
Chicago• Concentric zone model• Sector model• Multiple nuclei model
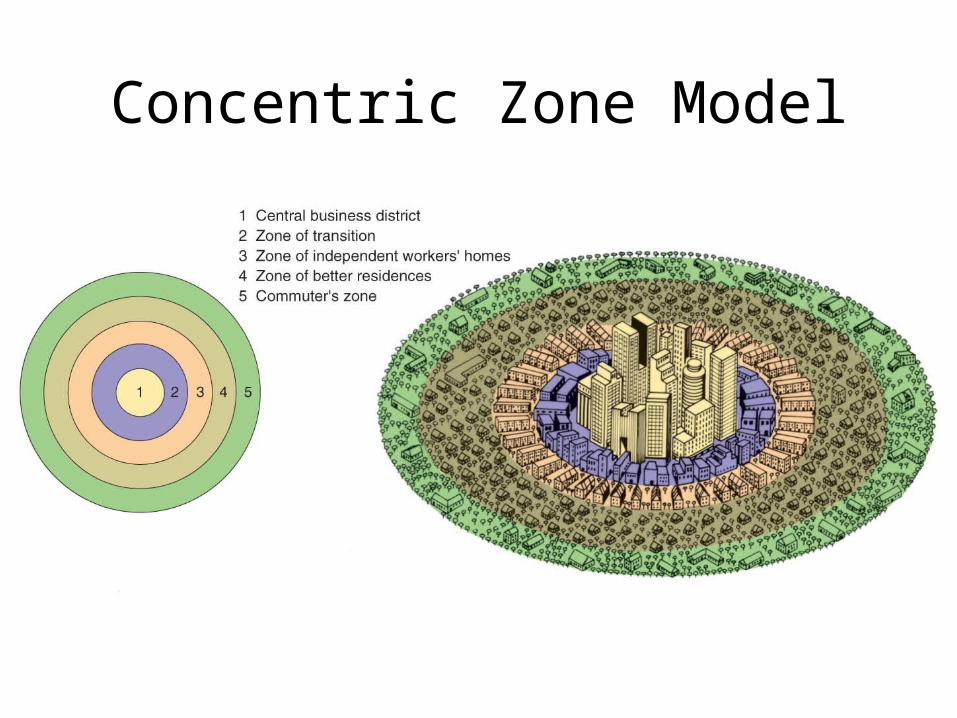
Concentric Zone Model
Figure 13-4
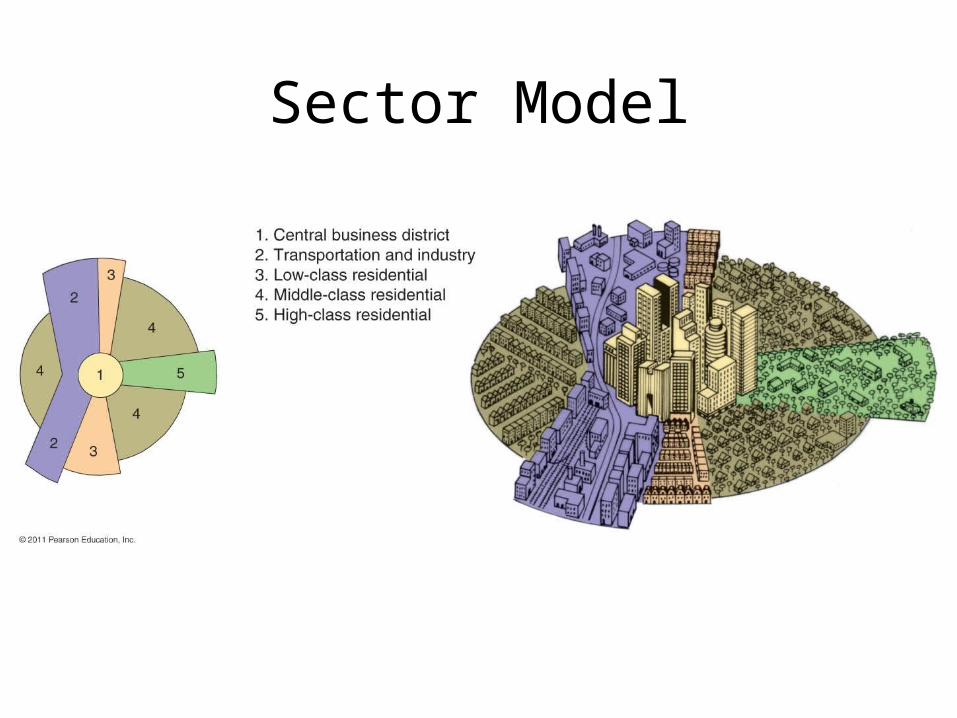
Sector Model
Figure 13-5
Multiple Nuclei Model
Figure 13-6
Where Are People Distributedin Urban Areas?
• Geographic application of the models– Models can be used to show where different
social groups live in the cities• Census tracts• Social area analysis
– Criticism of the models• Models may be too simple• Models may be outdated
Where Are People Distributedin Urban Areas?
• Applying the models outside North America– European cities– Less developed countries• Colonial cities• Cities since independence• Squatter settlements
– Urban renewal– Public housing– Renovated housing• Gentrification
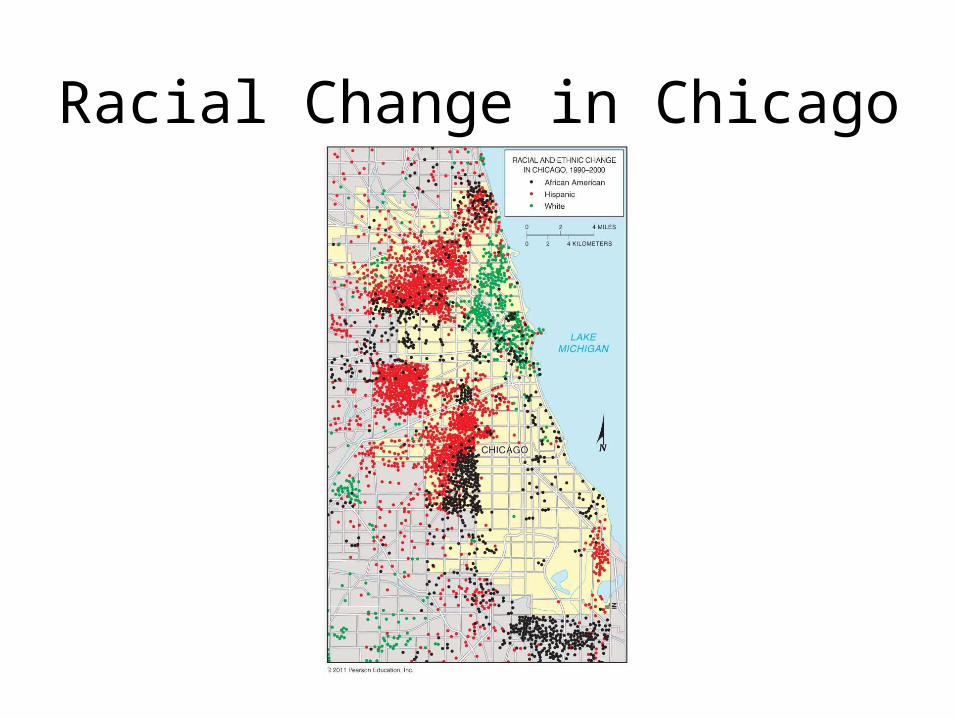
Racial Change in Chicago
Figure 13-16
Why Do Inner Cities Face Distinctive Challenges?
• Inner-city social issues– The underclass• An unending cycle of social and economic issues• Homelessness
– Culture of poverty
Why Do Inner Cities Face Distinctive Challenges?
• Inner-city economic issues– Eroding tax base• Cities can either reduce services or raise taxes
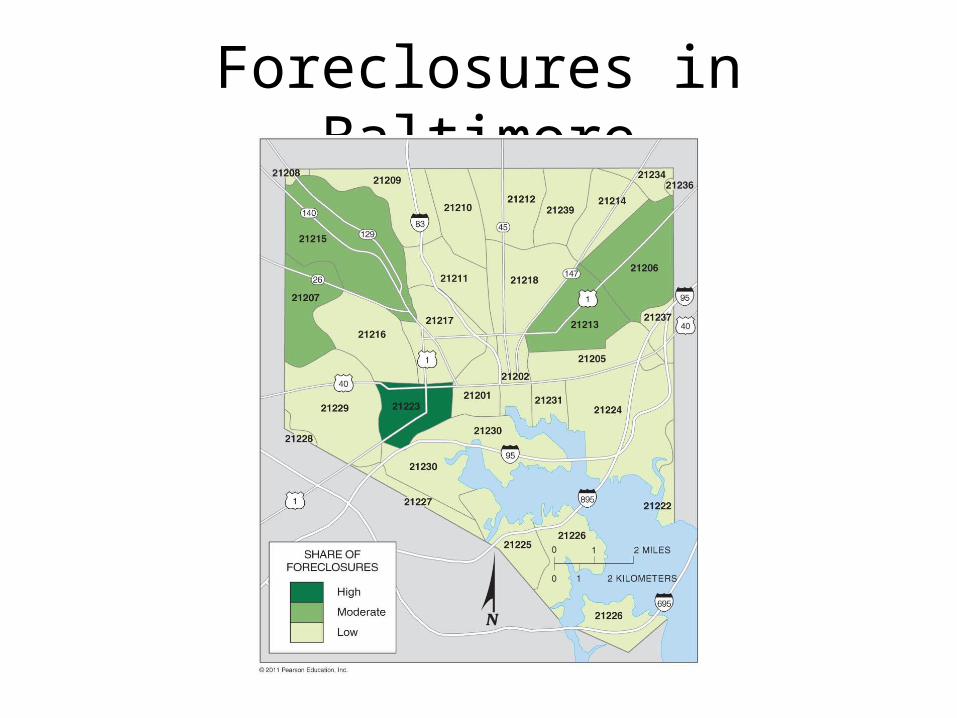
– Impact of the recession• Housing market collapse
Foreclosures in Baltimore
Figure 13-18
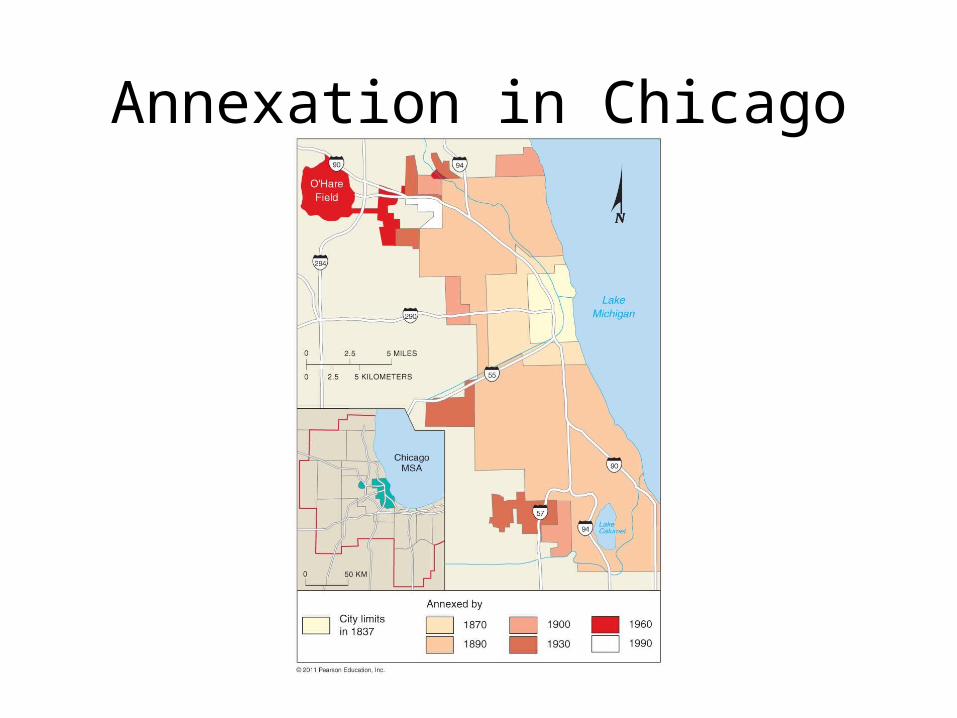
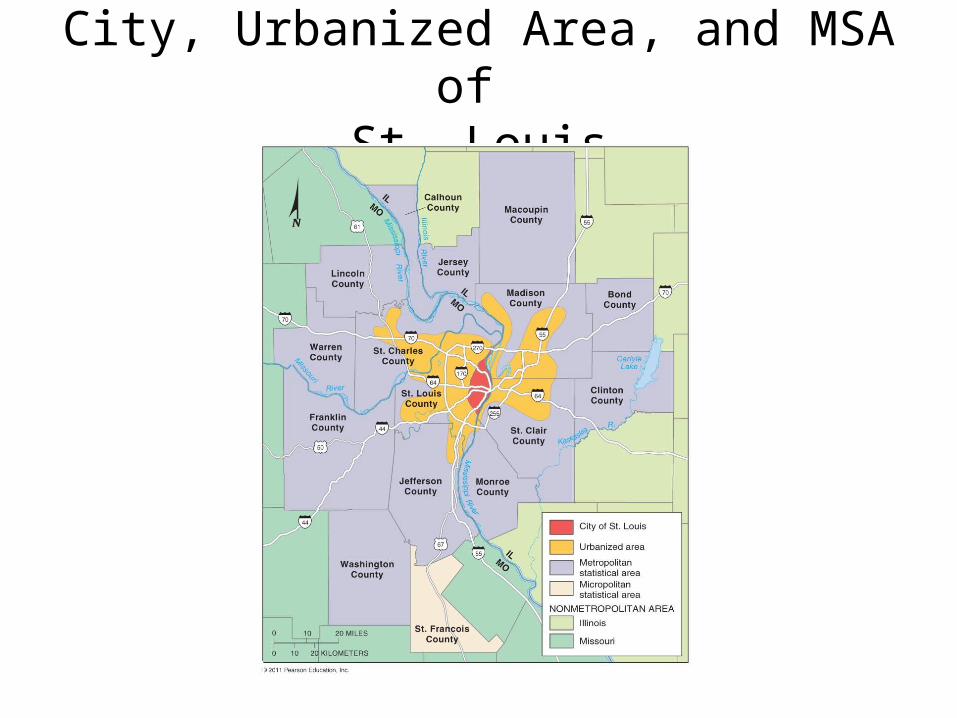
Why Do Suburbs Face Distinctive Challenges?
• Urban expansion– Annexation– Defining urban settlements • The city• Urbanized areas• Metropolitan statistical areas (MSAs)
– Metropolitan divisions– Micropolitan statistical areas
Annexation in Chicago
Figure 13-19
City, Urbanized Area, and MSA of St. Louis
Figure 13-20
Why Do Suburbs Face Distinctive Challenges?
• Urban expansion– Local government fragmentation• Council of government• Consolidations of city and county governments• Federations
– Overlapping metropolitan areas
Why Do Suburbs Face Distinctive Challenges?
• Peripheral model– Edge cities– Density gradient– Cost of suburban sprawl
• Suburban segregation– Residential segregation– Suburbanization of businesses
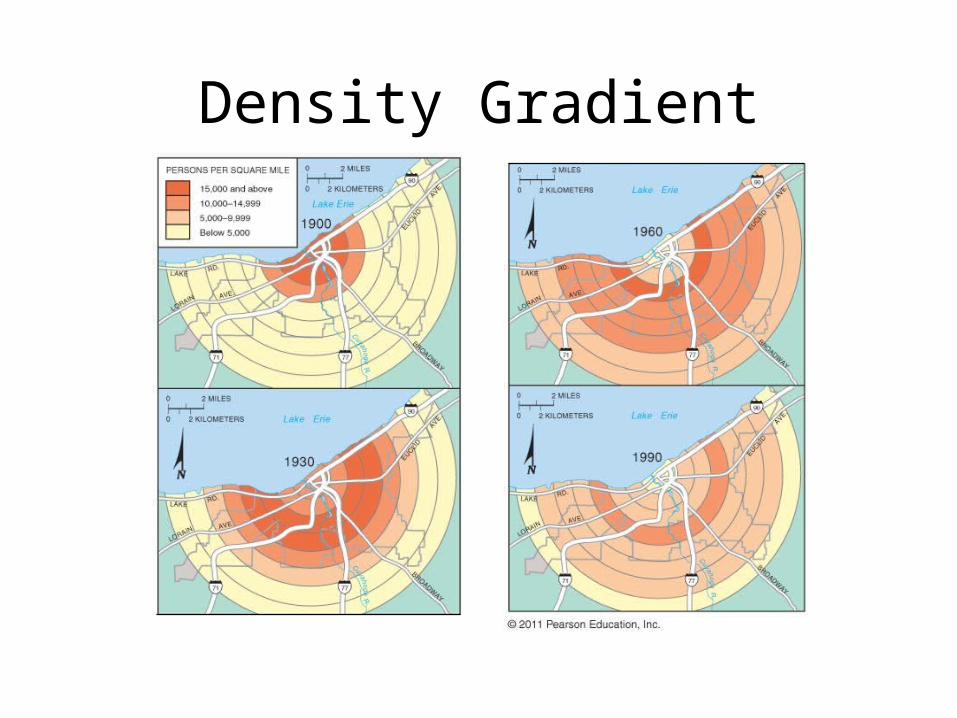
Density Gradient
Figure 13-23
Suburban Stress
Figure 13-25
Why Do Suburbs Face Distinctive Challenges?
• Transportation and suburbanization– Motor vehicles
• More than 95 percent of all trips = made by car– Public transit
• Advantages of public transit– Transit travelers take up less space– Cheaper, less pollutant, and more energy efficient than an automobile– Suited to rapidly transport large number of people to small area
• Public transit in the United States– Used primarily for rush-hour community for workers into and out of
CBD– Small cities-minimal use– Most Americans prefer to commute by automobile
Subway and Tram Lines in Brussels, Belgium
Figure 13-28
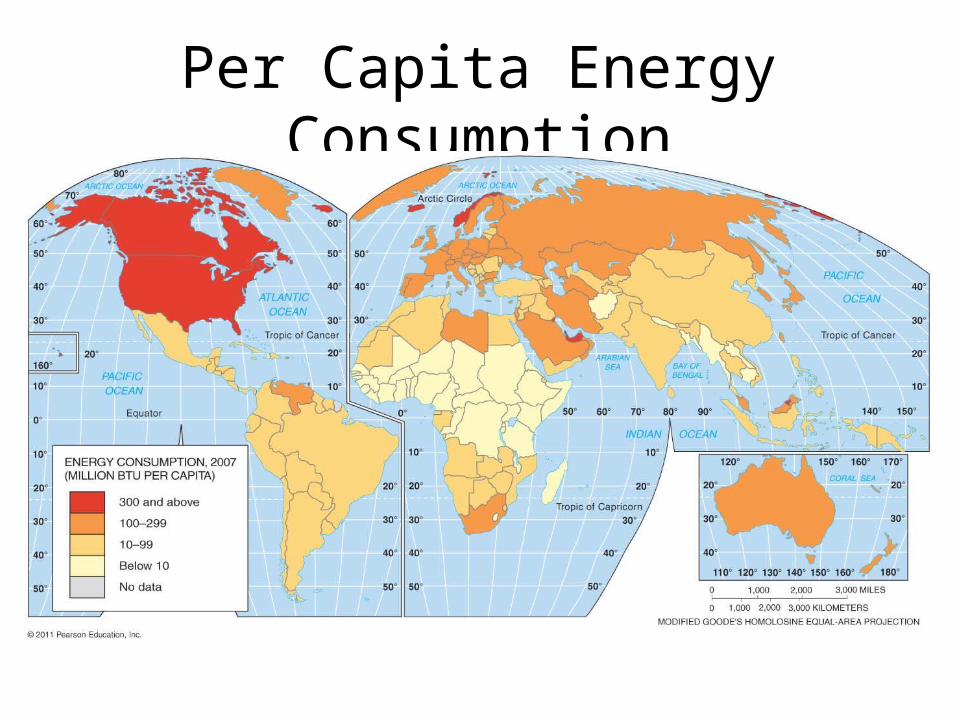
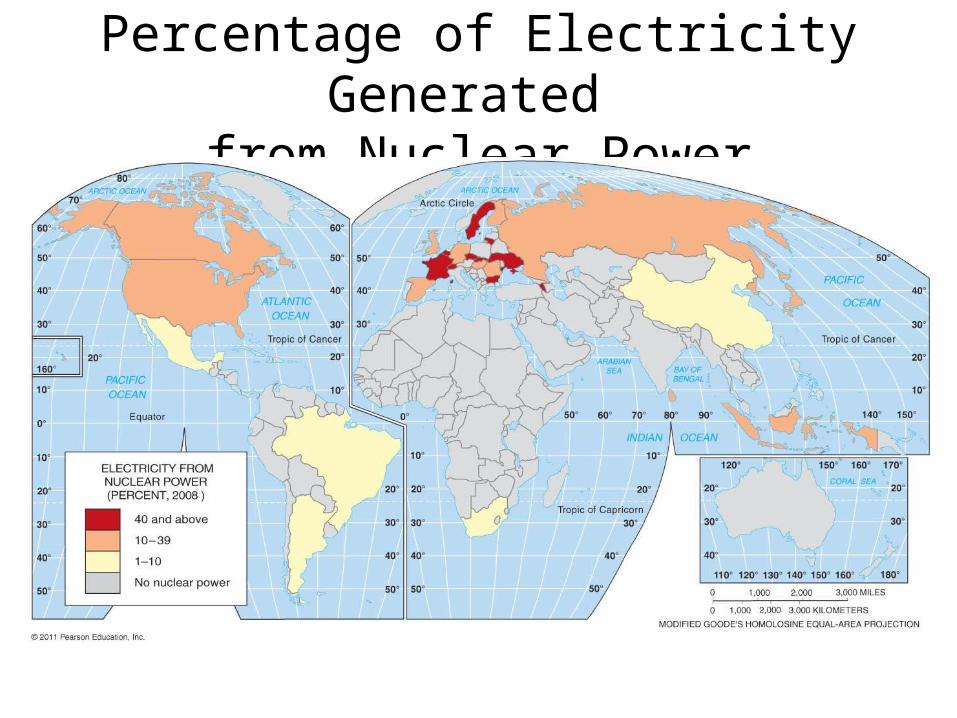
Why Are Resources Being Depleted?• Energy resources– Animate versus inanimate power– Energy supply and demand• Five-sixths of the world’s energy supply comes from
coal, natural gas, and oil– Finiteness of natural resources• Renewable versus nonrenewable resources
– Proven reserves– Potential reserves
Per Capita Energy Consumption
Figure 14-1
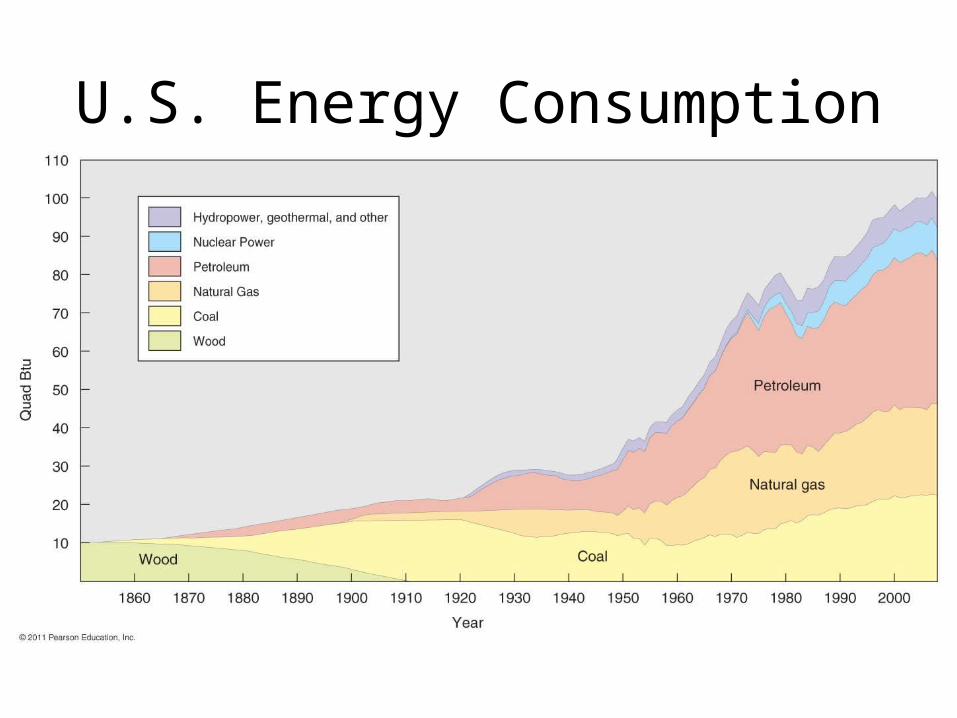
U.S. Energy Consumption
Figure 14-2
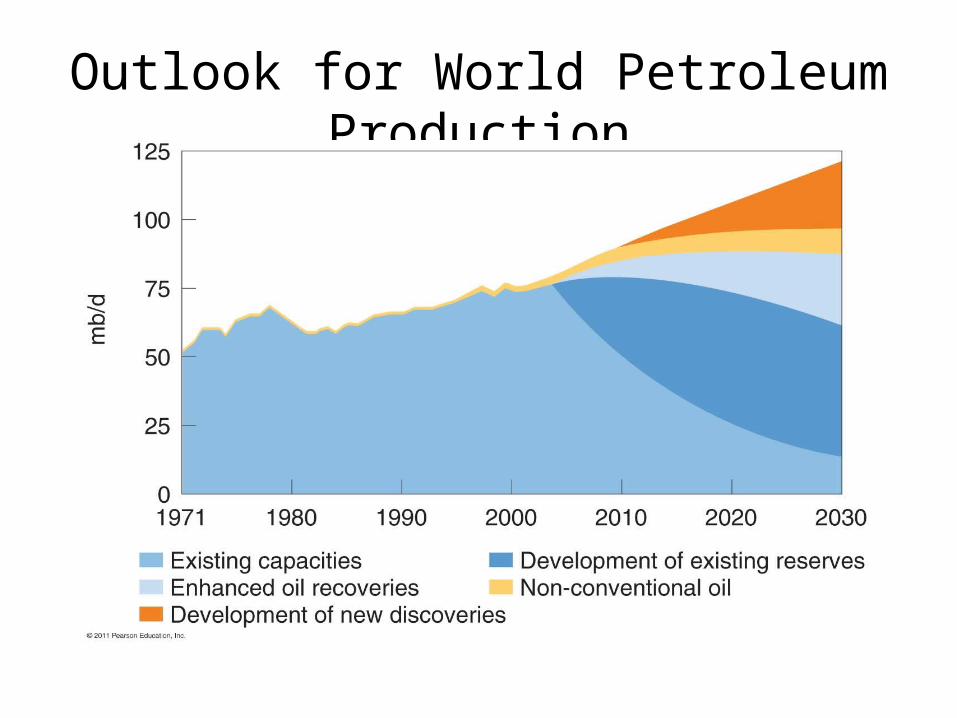
Outlook for World Petroleum Production
Figure 14-3
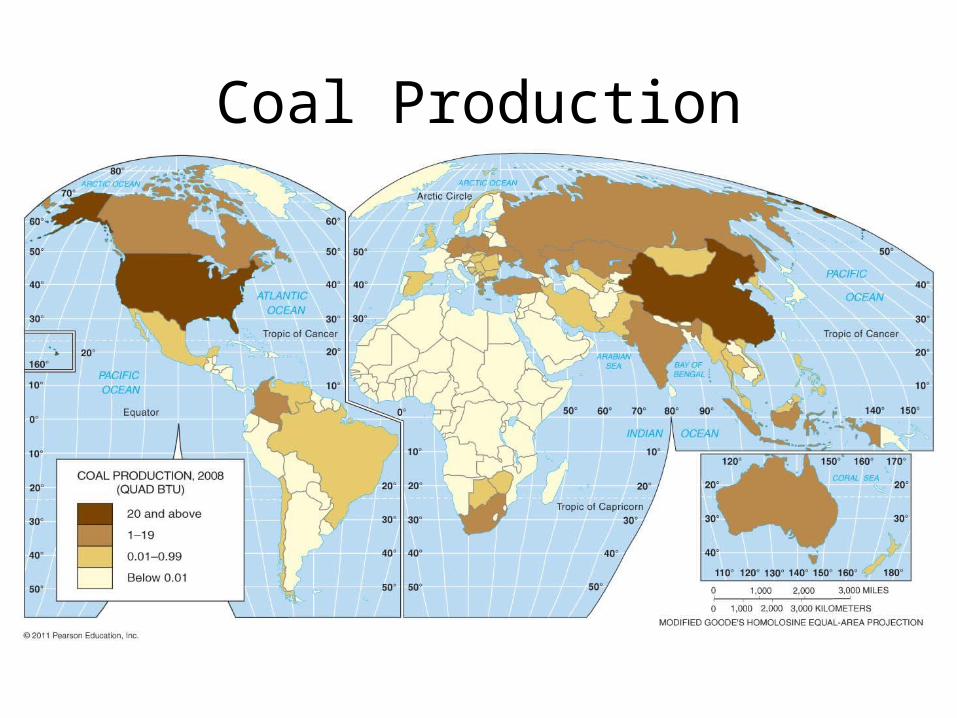
Coal Production
Figure 14-4
Proven Reserves of Fossil Fuels
Figure 14-5
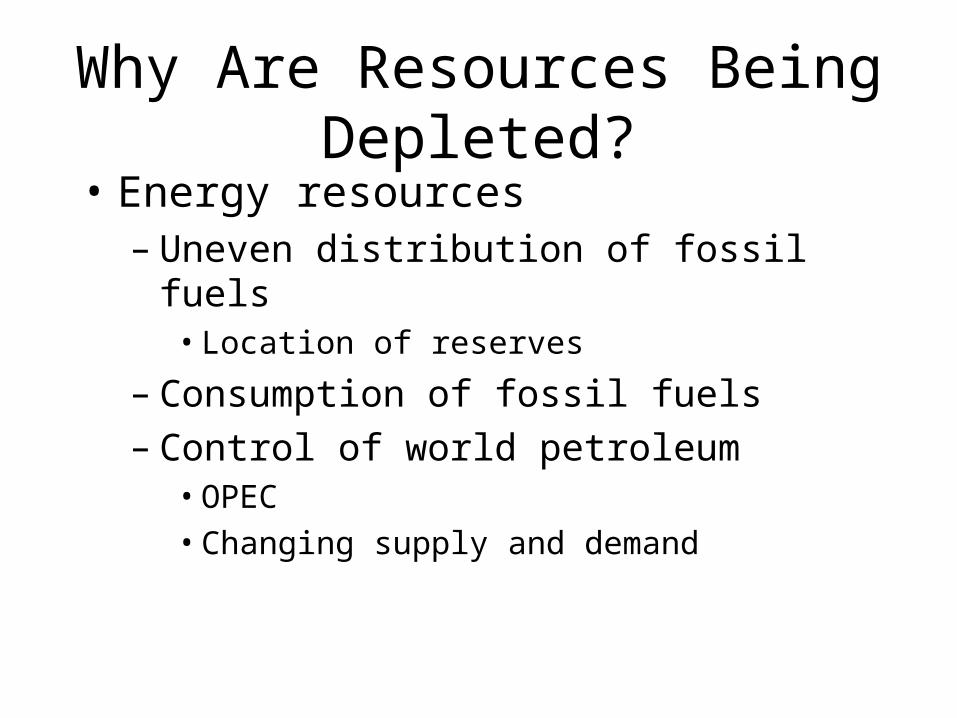
Why Are Resources Being Depleted?• Energy resources– Uneven distribution of fossil fuels• Location of reserves
– Consumption of fossil fuels– Control of world petroleum• OPEC• Changing supply and demand
Why Are Resources Being Depleted?• Mineral resources– Metallic or nonmetallic• Nonmetallic = 90 percent of extraction is for
building stone• Ferrous metallic minerals = iron ore, chromium,


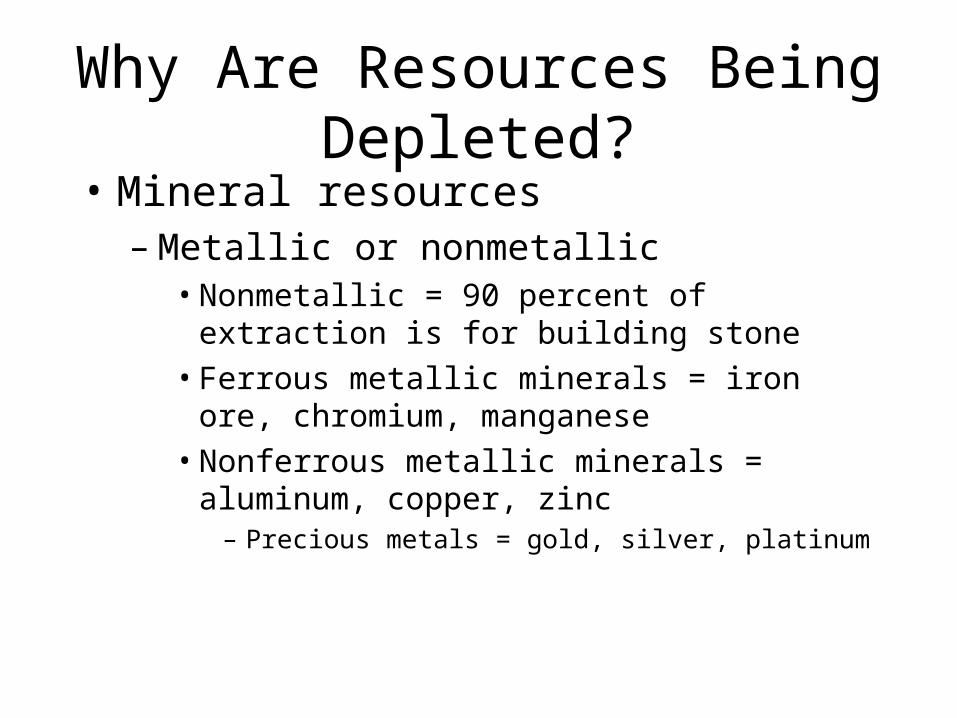


![Where did poetry originate?. Greek Translation The Greek verb ποιεω [poiéo (= I make or create)]](https://static.documents.pub/doc/80x56/56649ed35503460f94be31ad/where-did-poetry-originate-greek-translation-the-greek-verb-poieo.jpg)


