20
Where is the social capital in Glasgow? A study of volunteer applicants for the Glasgow 2014 Commonwealth Games Russell Jones
| Date post: | 15-Dec-2015 |
| Category: |
Documents |
| Upload: | annika-littleton |
| View: | 213 times |
| Download: | 0 times |

Where is the social capital in Glasgow?
A study of volunteer applicants for the Glasgow 2014 Commonwealth Games
Russell Jones

Methods
• Sweep 1 – online questionnaire
• Recruitment via OC– 50,811 volunteer applicants– Conducted prior to status being known
• 7722 unique responses

QuestionnaireMotivationsExpectationsRecent volunteering experienceSocial capitalSelf-efficacyPhysical activityMental wellbeingHealthDemographics

Analysis
Restricted to UK respondents (n=7494)
Descriptive Frequencies
Comparisons by demographics and area
Two step binary logistic regression modelling

Respondent demographics
2/3 Scottish (13% Glasgow)
2/3 female
58% married/civil partnership/cohabiting
60% aged 45 +
60% employed (only 3% unemployed)
59% educated to 1st degree or higher (<1% with no education)

Notable demographic differences
Glasgow younger and less likely to be in stable relationship
All Scotland less likely to be educated to 1st degree or higher
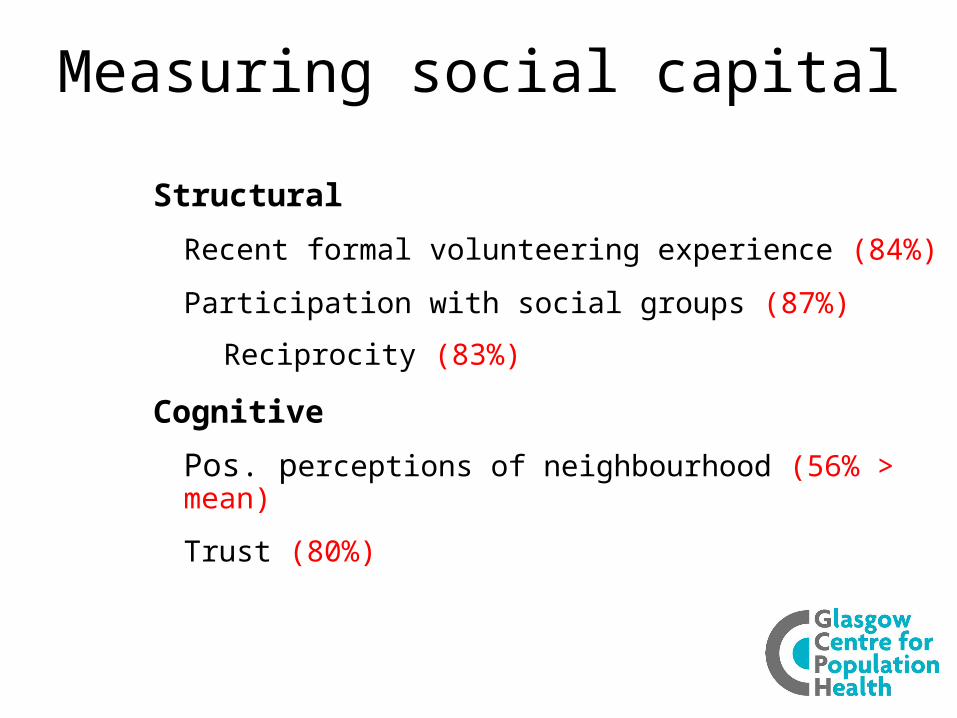
Measuring social capital
Structural
Recent formal volunteering experience (84%)
Participation with social groups (87%)
Reciprocity (83%)
Cognitive
Pos. perceptions of neighbourhood (56% > mean)
Trust (80%)

Social capital by gender

Social capital by age

Social capital by marital status

Social capital by education

Social capital by employment

Social capital by area

Rest of UK is 159% times more likely to have recent formal volunteering experience than Glasgow
Variable Odds Ratio p
25-44 vs. 16-2445-64 vs. 16-24
Rest of Scotland vs. GlasgowRest of UK vs. Glasgow
0.540.59
1.452.59
.000
.002
.000
.000

Rest of UK is 77% times more likely to have participated in social groups than Glasgow
Variable Odds Ratio p
25-44 vs. 16-2445-64 vs. 16-24
1st degree + vs. some educ.
Part-time vs. full-timeRetired vs. full-timeStudent vs. full-time
Rest of Scotland vs. GlasgowRest of UK vs. Glasgow
0.570.63
0.69
1.441.291.50
1.531.77
.002
.013
.000
.001
.029
.029
.000
.000

Rest of Scotland is 55% more likely to have exchanged favours with neighbours than Glasgow
Variable Odds Ratio p
25-44 vs. 16-2465+ vs. 16-24
Married/civ. ptnr./cohabit vs. single
Part-time vs. full-timeRetired vs. full-time
Rest of Scotland vs. GlasgowRest of UK vs. Glasgow
0.621.99
1.63
1.291.39
1.551.39
.000
.000
.000
.008
.005
.000
.001

Rest of Scotland is 50% more likely to have a positive perception of neighbourhood than Glasgow
Variable Odds Ratio p
Male vs. female
25-44 vs. 16-2465+ vs. 16-24
Married/civ. ptnr./cohabit vs. single
1st degree or higher vs. some educ.
Part-time employment vs. full-timeRetired vs. full-time
Rest of Scotland vs. GlasgowRest of UK vs. Glasgow
0.85
0.731.58
1.37
1.15
1.501.49
1.501.29
.003
.006
.002
.000
.010
.000
.000
.000
.001
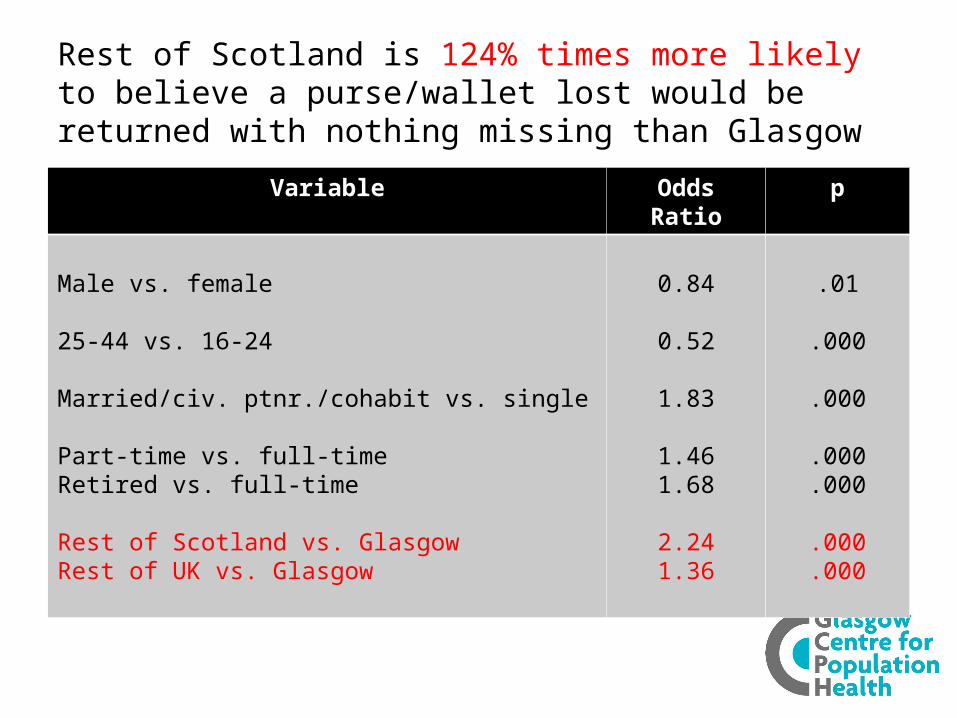
Rest of Scotland is 124% times more likely to believe a purse/wallet lost would be returned with nothing missing than Glasgow
Variable Odds Ratio p
Male vs. female
25-44 vs. 16-24
Married/civ. ptnr./cohabit vs. single
Part-time vs. full-timeRetired vs. full-time
Rest of Scotland vs. GlasgowRest of UK vs. Glasgow
0.84
0.52
1.83
1.461.68
2.241.36
.01
.000
.000
.000
.000
.000
.000

SummarySocial capital measures are high among volunteer applicants across all areas
A consistent pattern exists: Glasgow scores less favourably on all measures of social capital
This pattern holds up when taking all other demographic variables into account
Reflects other research into differences in social capital between Glasgow, Liverpool and Manchester
(http://www.gcph.co.uk/assets/0000/3828/Three-city_survey_report_2013.pdf)

Questions for discussion
Why is it that volunteer applicants from Glasgow score less positively on these measures of social capital?
What are the implications of these findings for policy and practice (e.g. volunteering, employability, etc.)?


