R ESERVOIR C HARACTERIZATION … AN I NTEGRATION T ECHNOLOGY Richard Heil Heil is a geological consultant in the Reservoir Characterization Department. He has worked for Saudi Aramco since 1981 and has special- ized in reservoir characterization and modeling since 1985. In 1968, he received a BSc from Tufts University in Medford, Mass., and a MA in geolo- gy from the University of Texas at Austin in 1972. Prior to joining Saudi Aramco, his work focused on digital terrain and hydrological modeling in support of land use management for regional, state and federal planning agencies. During his career with Saudi Aramco, he has constructed and maintained many 3D geocellular models, including the Khuff C reservoir in Ghawar field, Hanifa and Hadriya reservoirs in Berri field and the Shu’aiba reservoir in Shaybah field. He has also supervised/consulted on numerous other modeling efforts, such as the ‘Unayzah reservoir in various central Arabian fields, the Safaniya and Khafji reservoirs in the offshore fields, Arab-D in Abu Safah and the Hanifa reservoir in the Abqaiq field. ABSTRACT Saudi Aramco manages the development and production of the largest accumulation of crude oil and gas in the world. These reserves are distributed in about 250 reservoirs, among 87 fields. Reservoir characterization, a major activity of the Exploration Organization, is a process that combines the scientific and engi- neering data of a hydrocarbon reservoir into reservoir descriptions, often as 3-dimensional (3D) computer models. The aim of reservoir characterization is to reduce the uncertainty of exactly where reservoir rocks and fluids are located, many thou- sands of feet below the surface. Some of the important business activities impacted by reservoir characterization are drilling operations, field development planning, production optimization and reserve assessments.
Transcript
R E S E R V O I R C H A R A C T E R I Z AT I O N … A N I N T E G R AT I O N T E C H N O L O G Y
Richard Heil
Heil is a geological consultant in the Reservoir CharacterizationDepartment. He has worked for Saudi Aramco since 1981 and has special-ized in reservoir characterization and modeling since 1985. In 1968, hereceived a BSc from Tufts University in Medford, Mass., and a MA in geolo-gy from the University of Texas at Austin in 1972. Prior to joining SaudiAramco, his work focused on digital terrain and hydrological modeling insupport of land use management for regional, state and federal planningagencies. During his career with Saudi Aramco, he has constructed andmaintained many 3D geocellular models, including the Khuff C reservoir inGhawar field, Hanifa and Hadriya reservoirs in Berri field and the Shu’aibareservoir in Shaybah field. He has also supervised/consulted on numerousother modeling efforts, such as the ‘Unayzah reservoir in various centralArabian fields, the Safaniya and Khafji reservoirs in the offshore fields,Arab-D in Abu Safah and the Hanifa reservoir in the Abqaiq field.
ABSTRACT
Saudi Aramco manages the development and production of the
largest accumulation of crude oil and gas in the world. These
reserves are distributed in about 250 reservoirs, among 87 fields.
Reservoir characterization, a major activity of the Exploration
Organization, is a process that combines the scientific and engi-
neering data of a hydrocarbon reservoir into reservoir
descriptions, often as 3-dimensional (3D) computer models. The
aim of reservoir characterization is to reduce the uncertainty of
exactly where reservoir rocks and fluids are located, many thou-
sands of feet below the surface. Some of the important business
activities impacted by reservoir characterization are drilling
operations, field development planning, production optimization
and reserve assessments.
50527araD2R1.p2.ps 12/06/2001 07:13 PM Page 2
I N T R O D U C T I O N
Reservoir characterization is a process that combines the scientific and engineering data of a hydrocarbon reservoir into reservoir descriptions, often as 3-dimensional computermodels. This process plays a critical role throughout the productive life of an oil or gas field. Early in a field’s develop-
S A U D I A R A M C O J O U R N A L O F T E C H N O L O G Y • W I N T E R 2 0 0 1 3
Major oil and gas fields in eastern and central Saudi Arabia
The lithologic column shows theprincipal rock types found in themajor oil (green) and gas (red)reservoirs. Most fields havereserves in multiple reservoirs.
LAWHAH
MISHRIF
RUMAILA
AHMADI
WARA
MAUDDUD
SAFANIYA
KHAFJI
SHU'AIBA
ZUBAIR
BUWAIB
MANIFA
ARAB-C
JUBAILA
HANIFA
HADRIYA
UPPER FADHILI
SHARAR
FARIDAH
MARRAT
LOWER FADHILI
ARAB-D
HITH STRINGER
RIMTHAN
ARAB-A
ARAB-B
UPPER RATAWI
LOWER RATAWI
MINJUR
JILH
KHUFF-A
KHUFF-B
KHUFF-C
UNAYZAH-A
UNAYZAH-B
JAUF
50527araD2R1.p3.ps 12/06/2001 07:13 PM Page 3
ment or producing history, with information from only a fewwells available, this process has a great deal of uncertaintyassociated with it. Years later, after many more wells have beendrilled and after many years of production data have been col-lected, uncertainty about field-scale parameters has decreased,while knowledge of the local complexity of the reservoir hasincreased tremendously. Fortunately, both geosciences and com-puter technology have advanced to the point where much ofthis complexity can be modeled in dynamic reservoir simula-tion models, as well as static, 3D geocellular models.
Saudi Aramco manages the development and production ofthe largest accumulation of crude oil and gas in the world.Gas reserves (dissolved, associated and non-associated) total219 trillion cubic feet. Crude oil and condensate reserves totalabout 260 billion barrels, or about 25 percent of the world’sproven crude oil reserves. These reserves are distributed inabout 250 reservoirs, among 87 fields. Only a small fractionof these fields are on production, some producing from morethan one reservoir and a few producing large quantities ofnon-associated gas. Reservoir characterization has been goingon for more than 50 years in some of these fields. In fact,every producing reservoir has a reservoir simulation model,which is continually updated by new drilling and productiondata and is used to develop and evaluate alternative reservoirmanagement strategies.
The mix of geological environments found in the producingfields is quite diverse. Carbonate reservoirs are mostly rampand platform limestones of Jurassic age, with one notableexception. This is the rudistid-complex (i.e., extinct, oyster-like mollusks) in Shaybah field, which is early Cretaceous inage and located deep within the Rub’ al-Khali desert. Most ofthe clastic (i.e., sandstone) oil reservoirs are found offshoreand produce from Cretaceous age fluvio-deltaic sediments.Braided-stream and eolian (i.e., wind blown) deposits ofCarboniferous age characterize onshore fields in central Saudi
Arabia. Deep gas reservoirs are producing from Permian agedolomites, Carboniferous fluvial and eolian clastics and olderPaleozoic near-shore marine sands.
There are more than 5,000 oil and gas wells in the activefields, many of which have been on production for over 25years and some for over 50 years. As a result, much is knownabout the internal heterogeneity of these reservoirs. Theamount and diversity of data available for analysis and inte-gration into reservoir models is staggering. Saudi Aramco hasaddressed this issue by aggressively recruiting the best Saudiand expatriate geoscientists in the world and providing themwith the best technology available to do the job.
T O D AY ’ S T E A M
Reservoir characterization is a major activity of theExploration Organization. About 150 Saudi and expatriategeologists and geophysicists, representing a variety of subdis-ciplines, are dedicated to this important endeavor. Individualsoften work in multi-disciplinary teams comprised of profes-sionals from other departments within Saudi Aramco.
Each professional has a vast amount of well and seismic(i.e., geophysical) data available to analyze and interpret. TheExploration Organization’s core warehouse contains over167,640 meters (550,000 ft) of core samples (i.e., drilled rockextracted from the well intact) from hundreds of wells locatedthroughout the Kingdom. In addition, core description andanalysis reports are available on-line from Saudi Aramco’sdocument database system. Special core analysis and well testdata are also available from an Oracle database, as are allgeologic correlation markers. Open-hole and formation analy-sis logs are available on-line for all the thousands of wellsdrilled in the Kingdom. These logs provide a wealth of infor-mation about reservoirs, including formation tops, watersaturations and rock porosity. Geophysical interpreters havemodern 3D seismic surveys to work from, available for
4 S A U D I A R A M C O J O U R N A L O F T E C H N O L O G Y • W I N T E R 2 0 0 1
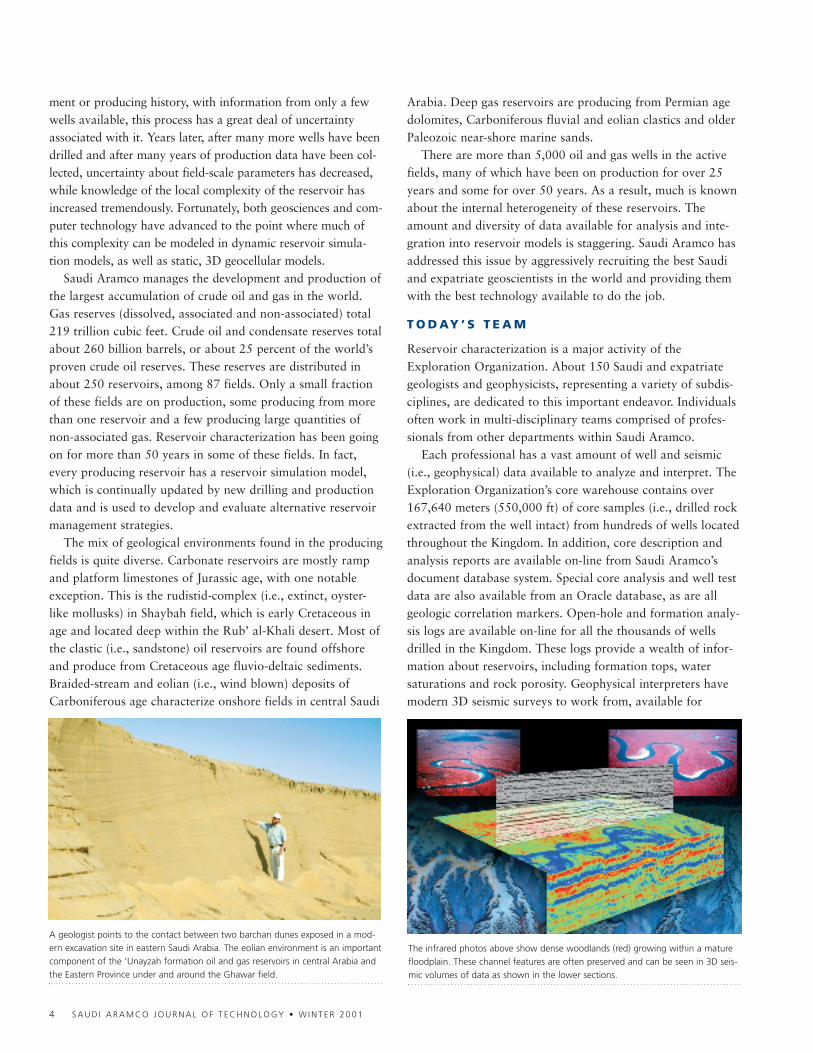
A geologist points to the contact between two barchan dunes exposed in a mod-ern excavation site in eastern Saudi Arabia. The eolian environment is an importantcomponent of the ‘Unayzah formation oil and gas reservoirs in central Arabia andthe Eastern Province under and around the Ghawar field.
The infrared photos above show dense woodlands (red) growing within a maturefloodplain. These channel features are often preserved and can be seen in 3D seis-mic volumes of data as shown in the lower sections.
50527araD2R1.p4.ps 12/06/2001 07:13 PM Page 4
almost every producing field.Integrating all these data together and providing fast indi-
vidual access to huge databases is one of the world’s greatestdata management challenges. The EXPEC Computer Centerhas constructed and now maintains one of the largest andfastest fiber-optic networks found in any corporation. Thenetwork interconnects several thousand UNIX and NT work-stations and several super-computers, while linking thecorporate databases through an elaborate security system.Each professional has the latest in geoscience software, fromreservoir correlation to seismic coherency volume attributeanalysis, available on his desktop.
R E D U C I N G U N C E R TA I N T Y
The aim of reservoir characterization is to reduce the uncer-tainty of where reservoir rocks and fluids are located, manythousands of feet below the surface. In order to accomplishthis, a variety of geoscience disciplines have been employedand the results integrated into a 3D “earth model” of thereservoir.
Much of the information used to delineate the geometriesof reservoirs and to measure rock properties within a reser-voir comes from data acquired while drilling wells. However,in Saudi Arabia the reservoir quality is so good that the spac-ing between neighboring wells in most fields is one kilometer
or more. Describing underground reservoirs with this level ofsampling is analogous to trying to map New York City fromvertical lines located at every other subway station. A daunt-ing task, indeed!
Fortunately, there are ways to get around the samplingproblem. Detailed geological analysis of cores, well logs and3D seismic data provide insights as to which direction a riverflowed in a Carboniferous age floodplain or where ooid shoaldeposits were being formed in a shallow Jurassic sea. Theseinterpretations provide the basis for the depositional model,which is the starting point for the reservoir’s geological model.
Obviously, a lot happens to these sediments over tens ofmillions of years of repeated burial and uplift. The rocksbecome lithified, cemented and might become chemicallyaltered by deep burial diagenesis. Plate tectonics have stressedthe rocks over time by compressing and stretching them, leav-ing them faulted and fractured to varying degrees. Definingthis geological complexity, and doing it with enough under-standing to reduce the uncertainty for reservoir modelingpurposes, is the primary goal of reservoir characterization.Using geologically based ideas, a reservoir model honors boththe actual well data and the conceptual 3D geological model.This is the way reservoir characterization fleshes out themodel from the existing sparse well control information.
S A U D I A R A M C O J O U R N A L O F T E C H N O L O G Y • W I N T E R 2 0 0 1 5
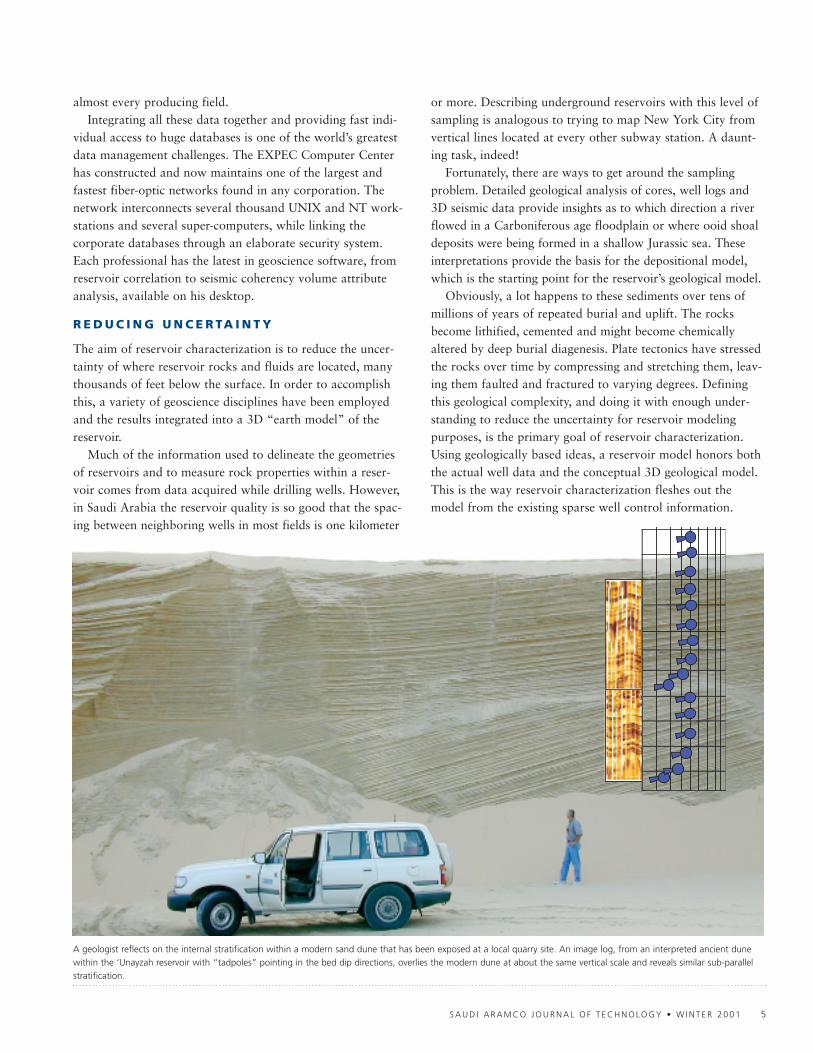
A geologist reflects on the internal stratification within a modern sand dune that has been exposed at a local quarry site. An image log, from an interpreted ancient dunewithin the ‘Unayzah reservoir with “tadpoles” pointing in the bed dip directions, overlies the modern dune at about the same vertical scale and reveals similar sub-parallelstratification.
50527araD2R1.p5.ps 12/06/2001 07:13 PM Page 5
T h e P r e s e n t i s t h e K e y t o t h e P a s t
One of the biggest challenges of reservoir characterization ispredicting the spatial distribution of rock types within thereservoir. The payoff for doing this correctly is huge. If therocks and their geometries are well known, the unique com-plexities of a reservoir regarding where the gas, oil and waterare located and how they are interconnected can be modeledquite effectively. However, that is a big “If.” As a rule, sub-surface data are very sparse and under-sample the reservoirrelative to its volume by many orders of magnitude.
Core interpretation is at the heart of any reservoir model.
Core description and lab analysis of the actual reservoir rockprovide the ground truth for all later inferences made aboutthe reservoir. Because coring and core handling are relativelyexpensive and time consuming, only a small percentage ofwells in a field are actually cored. The majority of wells onlyhave open-hole logs, so the geology is usually interpretedfrom log data alone. Transforming well log responses to rocktypes (i.e., lithology-from-logs) is an important way to expandthe knowledge gained from looking at the core to all theuncored wells in the field. After identifying existing rock typesand depositional trends, (from core, logs and 3D seismicdata), the details of the reservoir begin to unfold and mapsare drawn for each geological chrono-stratigraphic layer,delineating the distribution of the rock types.
Within the last decade or so, a new way of thinking abouthow sediments are deposited and preserved has evolved, andit is enabling geologists to predict rock facies distributionfrom limited subsurface data. This methodology is calledsequence stratigraphy and has become the preferred way tointegrate analyses from all the geological disciplines into onedepositional model.
Sequence stratigraphic analysis begins by inferring qualita-tive and quantitative parameters of the depositionalenvironment, such as water depth, accommodation space andsediment supply. Subsequent steps are to select the appropri-ate depositional model, input the known environmentalinformation and then forward-model or predict rock-type dis-tributions. Although initially developed from seismic
6 S A U D I A R A M C O J O U R N A L O F T E C H N O L O G Y • W I N T E R 2 0 0 1
A schematic of the depositional model of the Shu’aiba reservoir in Shaybah fieldshows the complex relationships between the rudist barrier (orange), lagoonal(blue) and marine slope (green) facies.
Slope angle
1°
4810
4820
4830
4840
4850
4860
4870
4880
4890
4900
4910
4920
4930
4940
4950
4960
4970
4980
4990
5000
5010
5020
5030
5040
5050
5060
5070
5080
5090
5100
5110
5120
5130
5140
5150
5160
5170
5180
5190
5200
5210
5220
5230
5240
5250
5260
5270
5280
2 Density 3
0.45 Neutron -0.150 Gamma Ray 30
2 Density 3
0.45 Neutron -0.150 Gamma Ray 30
SHYB-KL-Projected to represent
inner ramp setting in the southern Shaybah
4880
4890
4900
4910
4920
4930
4940
4950
4960
4970
4980
4990
5000
5010
5020
5030
5040
5050
5060
5070
5080
5090
5100
5110
5120
5130
5140
5150
5160
5170
5180
5190
5200
5210
5220
5230
5240
5250
5260
5270
5280
5290
5300
5310
5320
5330
5340
5350
5360
5370
5380
5390
5400
5410
5420
5430
5440
5450
5460
2 Density 3
0.45 Neutron -0.150 Gamma Ray 30
2 Density 3
0.45 Neutron -0.150 Gamma Ray 30
SHYB-GSE
SHYB-LG
4740
4750
4760
4770
4780
4790
4800
4810
4820
4830
4840
4850
4860
4870
4880
4890
4900
4910
4920
4930
4940
4950
4960
4970
4980
4990
5000
5010
5020
5030
5040
5050
5060
5070
5080
5090
5100
5110
5120
5130
5140
5150
5160
5170
5180
5190
5200
5210
5220
5230
5240
5250
5260
5270
5280
5290
2 Density 3
0.45 Neutron -0.150 Gamma Ray 30
2 Density 3
0.45 Neutron -0.150 Gamma Ray 30
SHYB-LD
4490
4500
4510
4520
4530
4540
4550
4560
4570
4580
4590
4600
4610
4620
4630
4640
4650
4660
4670
4680
4690
4700
4710
4720
4730
4740
4750
4760
4770
4780
4790
4800
4810
4820
4830
4840
4850
4860
4870
4880
4890
4900
4910
4920
4930
4940
4950
4960
4970
4980
4990
5000
5010
5020
5030
5040
5050
5060
2 Density 3
0.45 Neutron -0.150 Gamma Ray 30
2 Density 3
0.45 Neutron -0.150 Gamma Ray 30
SHYB-LGL
4980
4990
5000
5010
5020
5030
5040
5050
5060
5070
5080
5090
5100
5110
5120
5130
5140
5150
5160
5170
5180
5190
5200
5210
5220
5230
5240
5250
5260
5270
5280
5290
5300
5310
5320
5330
5340
5350
5360
5370
5380
5390
5400
5410
5420
5430
5440
5450
5460
5470
5480
2 Density 3
0.45 Neutron -0.150 Gamma Ray 30
2 Density 3
0.45 Neutron -0.150 Gamma Ray 30
Zone 1C(Upper Shu'aiba)Bab equivalent
B(Middle Shu'aiba)
A(Lower Shu'aiba)
1 a
2 a
1 b
2 b
3 a
4 a
4 b
3 b
1 c
Zone 2
Zone 3
Zone 4
5 a
6 a
7 a
7 b
6 b
5 b
Zone 5
Zone 6
Zone 7
BIYADH By
Reservoir Zones
Sequences
5280
INNER RAMPRAMP CREST
OUTER RAMPProximal Distal
Sea LevelSea Level
BBm
Lmi
Lmi
OAP
RB
RB
RB
SS
SS/SM
SD
SDSS/SM
SS/SM
FB
FB
RBBB
BB
RB
OAP
BIYADH
DOP
Lag
Lag
Sh Sh
LICOSm
LICOS
This schematic of the stratigraphic framework for the Shu’aiba formation in Shaybah field illustrates the correlation of the major cycles and the lateral and vertical distribu-tion of reservoir facies within each cycle. Rudist-beating lithologies dominate the depositional framework, which ranges from restricted marine (blue) through therudist-barrier complex (orange) to open marine facies (green).
50527araD2R1.p6.ps 12/06/2001 07:13 PM Page 6
interpretation ideas, the theory has been developed andproved from mapping and interpretation of surface outcropsof clastic and carbonate rocks throughout the world.
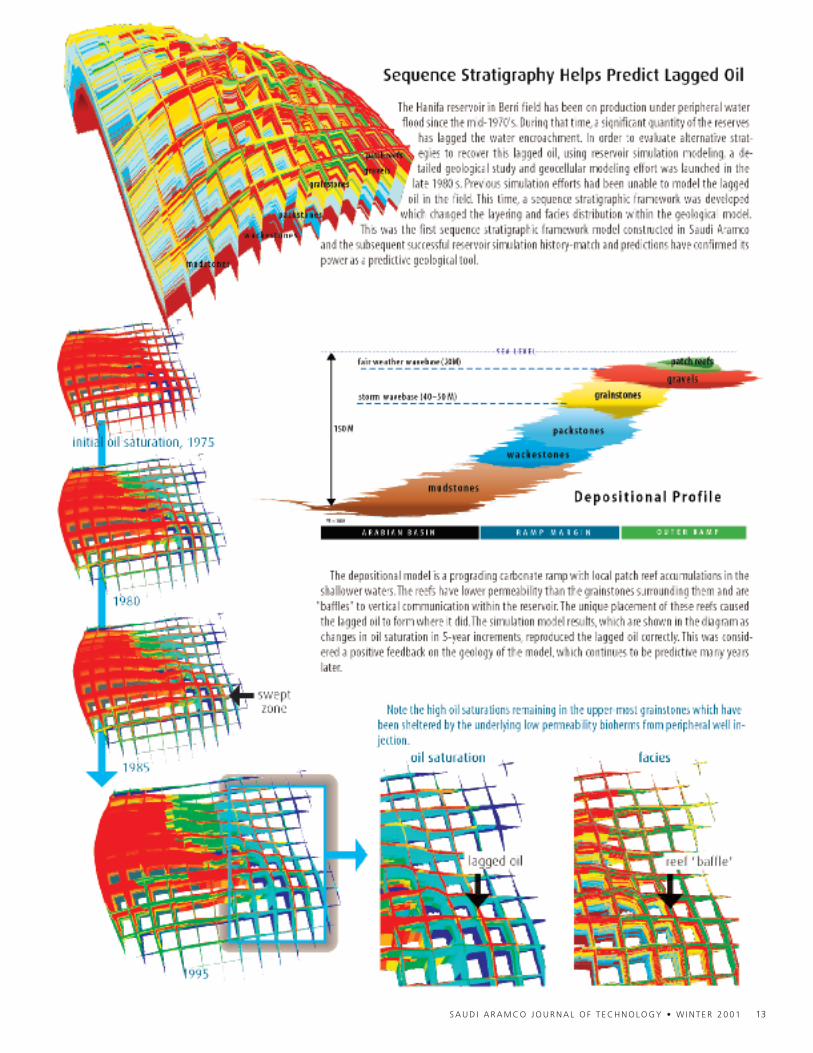
The methodology has been used at Saudi Aramco since thelate 1980s and with great success. It was first applied to twomature carbonate oil reservoirs in the offshore Berri field.These reservoirs have complicated production histories thatwere not closely duplicated by earlier reservoir simulationmodeling. After applying sequence stratigraphic analysis, bothreservoirs were re-correlated, re-mapped and completelyrebuilt for reservoir simulation. The history-matching effortsfor the new simulation models have been very successful, giv-ing the reservoir engineers much greater confidence in the
accuracy of the model predictions. So much so, that the mod-els are now used to predict favorable locations for lagged oilin the reservoir, as well as to evaluate alternative horizontalwell strategies to recover this oil.
Some reservoirs or parts of reservoirs have low permeabili-ty (i.e., a measure of the ability of fluid to flow through arock), which can make it problematic to produce the oil orgas economically. However, if a reservoir is significantly frac-tured and the fractures are open, the fractures (which canhave very high permeabilities) can become important path-ways for reservoir fluid communication. This also helps toexplain how lower permeability layers in the reservoir canstill contribute significantly to production despite little contri-bution to the well bore. On the negative side, fractures canconnect water legs and gas caps to a well bore, leading toexpensive remedial action.
Fractures vary in scale from small cracks crossing an indi-vidual sand grain to interconnected fault segments hundredsof miles long, such as the San Andreas Fault in California.Geological studies have demonstrated the fractal, or scale-independent, nature of fractures. Because of this, earthscientists now can create stochastic models of fracture andfault networks within reservoirs by integrating statisticalinformation from core and image logs of oil and gas wellswith 3D seismic data, representing several orders of magni-tude difference in scale.
A good example of how a variety of geological factors
S A U D I A R A M C O J O U R N A L O F T E C H N O L O G Y • W I N T E R 2 0 0 1 7
Driving past any rock exposure along a highway will reveal it is broken up intoblocks of various sizes, which are bounded by cracks or fractures.
Curvature analysis of 3D seismic surfaces provides a map of the large-scale (mostly sub-seismic) lineations that control fracture density distribution.
must be integrated in order to understand reservoir produc-tion behavior is the Arab-D reservoir in Ghawar (the world’slargest oil field). Depositional, diagenetic and tectonic eventsthroughout geologic time have left a variety of patterns ofporosity and permeability, which are sometimes dominated byone factor, but more often are the result of the presence of allthree events to different degrees. It is this interweaving ofdepositional facies, diagenetic (e.g. dolomitic) textures andfracturing that has made many observed production problemsso puzzling in the past.
Technologies that have emerged within the past decadehave led to a quantum leap in our ability to understand andpredict reservoir architectures and resulting flow patterns.
Sequence stratigraphic analysis of depositional processes sig-nificantly improves our ability to predict original rock typesbetween wells. Interpretation of recent geochemical studiessuggests a complex history of diagenesis and has been re-inte-grated as predictable distributions for different types ofdolomite. 3D seismic surveys, image logging and geomechani-cal studies have given us a detailed picture of fracturedensities and distributions, ranging from the micro-scale tothe mega-scale.
Each of the geologic areas above helps to explain animportant part of the Arab-D production story. But it is onlywhen they are combined in integrated workflows involvinggeoscientists and engineers that an understanding of the caus-es of the observed flow patterns begins to emerge. In fact, theGhawar field is comprised of many different Arab-D reser-voirs. The depositional rock fabric dominates reservoir flowin some areas of the field, while in other areas it is explainedby the effects of diagenetically altered strata or by fracture-enhanced flow. In addition, flow mechanisms in the upperlayers of the reservoir are often different from those in thelower layers.
Predictably, the most common situations found in the fieldsare those in which no single mechanism dominates produc-tion, but rather a complex interaction among all flowmechanisms exists. The only hope of understanding these sce-narios is to study the basic elements of reservoir architecture,
8 S A U D I A R A M C O J O U R N A L O F T E C H N O L O G Y • W I N T E R 2 0 0 1
A schematic diagram of Ghawar field flow mechanisms shows the complex path-ways that fluids can take to reach the well bore.
An array of vibrator trucks follow a strictly choreographed path over an oil field, providing the seismic energy required to image rock layers thousands of feet below the sur-face.
50527araD2R1.p8.ps 12/06/2001 07:13 PM Page 8
especially primary textures, geochemical alteration and frac-ture characteristics, and then to integrate them into areservoir simulation model with historical production data.The success of the computer simulation model in reproducingthe observed water cuts and pressures measured at the wells isthe ultimate validation of the reservoir characterization.
L i s t e n i n g t o t h e E a r t h
A very important way to acquire information about the sub-
surface rocks is through the use of geophysical or seismictechniques. Seismic data is acquired by geophone recordingsof reflections from seismic waves transmitted from the surfaceby an energy source, such as a vibrator truck or a dynamiteexplosion. Analysis of the reflected energy, using the seismicmethod, provides estimates of the depth to key horizons andreservoirs, which are thousands of feet below the surface.
Although seismic data has been commonly used for explo-ration purposes for over 40 years, its use for reservoircharacterization is a relatively new phenomenon. The use ofthe seismic method has always been limited, to a certaindegree, by computer technology. The large number of geo-phones and the continuous recording requirements create ahuge data processing burden on any computer system.Because of this, geophysics was initially limited to high-rollingexploration efforts, where the payoffs for success were largeand could be used to offset the expense. Seismic acquisitionwas usually limited to widely spaced regional 2D lines, whichwould locate interesting large-scale structural features. Theseprospective areas would have additional, more closely spaced,2D lines shot over them to better define the target structurefor potential reserves evaluations and optimum placement ofthe wildcat well. This was, and still is, expensive technologyto employ, but it did significantly reduce the risk of drillingdry holes and has proven to be a far cheaper strategy per bar-rel of oil discovered than drilling exploratory wells based onsurface geology alone. Until recent breakthroughs in comput-er technology, it was considered too expensive for reservoircharacterization purposes.
Because reservoirs are relatively thin intervals of interest andseismic has relatively coarse vertical resolution, in order to
S A U D I A R A M C O J O U R N A L O F T E C H N O L O G Y • W I N T E R 2 0 0 1 9
These figures compare a porosity distribution from a geocellular model (left) and a 3D seismic amplitude slice (right) at the stratigraphic position seen in the log cross-sectionat the top, left. Although the vertical resolution of the two displays is very different, the geocellular model has captured the areal distributions of the sands and silts by usingthe seismic as conditioning templates. Note how well the central low porosity “siltstone” is imaged in the 3D seismic slice and represented in the model.
Log sections A-B-C through wells in Hawtah field demonstrate the sand distributionbetween the wells. The dashed box represents the thickness seen in the seismic hori-zon slice, while the solid horizontal line represents a 1.5-meter (5-feet) thick slicethrough the geocellular model.
50527araD2R2 12/11/01 7:15 PM Page 9
sharpen the vertical and areal resolution, a fine mesh of 2Dseismic lines is required over the reservoir, commonly referredto as 3D seismic. Because the spacing between neighboring geo-phones is on the order of 25 to 50 meters (82 to 164 ft),equivalent to a fraction of a city block using our New YorkCity analogy, a detailed interpretation of observed reservoirgeometry and variability is possible, at least on an areal basis.(However, the vertical resolution of seismic data is still verycoarse compared to well logs and core.) Most of the compara-ble non-seismic interwell interpretation between wells isinferred from geological models and not observed as in the caseof 3D seismic surveys. 3D seismic surveys have been acquiredover most producing fields in Saudi Arabia. After tying in theseismic data at the well locations, seismic facies and/or porositymaps, as well as faults and fractures, can now be mapped at amuch higher resolution and with greater certainty.
The ‘Unayzah reservoir in the Central Arabian Trend is agood example of how 3D seismic data has been used to mapimportant geological features at a resolution far greater thancan be achieved by well data alone. This reservoir is a fluvialfacies assemblage overlain by a mixture of eolian and braided-stream facies associations. A large area in the central part ofthe Hawtah field 3D seismic data volume has negative ampli-tude within the upper reservoir unit. This corresponds to athick, low permeability siltstone seen in cored wells from thisarea. This large non-reservoir feature is interpreted from coreto be playa deposits within the eolian/braided-stream com-plex. Seismic facies maps, based on this observed relationshipbetween seismic amplitude and reservoir facies, were thenextracted from the 3D seismic volume and used as controlsfor geocellular models of porosity and facies.
In the development of deep gas reservoirs, seismic inversion
plays a key role. Porosity distributions in the gas reservoirs inGhawar field and the satellite fields correlate reasonably wellwith acoustic impedance, which is the result obtained fromthe seismic inversion process. In general, higher porosityzones correlate with lower impedance values (i.e., rock inter-vals with lower bulk densities and sonic velocities).
This relationship was first put to good use in the Khuff Cgas reservoir in the ‘Uthmaniyah area of Ghawar field. Afterdisappointing results in two development wells, a 3D surveywas acquired over the area. The 3D seismic data was invertedto an acoustic impedance model that was used as a constraintin a 3D geostatistical model of the predicted reservoir porosi-ty. The three maps in the figure above are slices within theKhuff C reservoir from the acoustic impedance model. Blueand green colors represent relatively high porosity, while yel-low and red represent low porosity. The two disappointmentsdrilled previously happened to be located in the low porosity(i.e., red and yellow) areas or high impedance areas. The sixsuccessful development wells were purposely drilled in thehigh porosity areas (i.e., blue areas) inferred from the lowimpedance values in the inversion volume. Due to the integra-tion of 3D seismic data, the success ratio for the many deepgas wells drilled since then is over 90 percent.
10 S A U D I A R A M C O J O U R N A L O F T E C H N O L O G Y • W I N T E R 2 0 0 1
This is a schematic of the seismic method-inversion process relationship. In theseismic acquisition step, the impedance layers and reflection coefficients are deter-mined by the subsurface geology and are unknown at the time of acquisition. Theenergy source or wavelet and the seismic signal are recorded at the time of acqui-sition. The inversion process works this in reverse by taking the wavelet out of thesignal and eventually ending up with impedance.
IMPEDANCE 1
IMPEDANCE 2
IMPEDANCE 3
IMPEDANCE 4
IMPEDANCE 5
IMPEDANCELAYERS
REFLECTIONCOEFFICIENTS
SEISMICSIGNALWAVELET
ACQUIRING SEISMIC
INVERTING SEISMIC
x =
Rock porosity can be predicted from 3D seismic impedance and used to goodadvantage for well location. For example, the success rate for recently drilled deepKhuff C gas wells has gone up to over 90 percent in the ‘Uthmaniyah area ofGhawar field, since the integration of 3D seismic data. In this figure, which showsthree slices through the seismic inversion model of the Khuff C reservoir, wellslocated in the blue and green areas (low impedance) have higher porosity and per-meability and are more productive than those located in the red areas.
50527araD2R1.p10.ps 12/06/2001 07:13 PM Page 10
Tr a n s f o r m i n g R o c k s t o N u m b e r s
Geological analysis is the key to understanding what andwhere rock types are distributed within the reservoir. The nextstep in the evolution of a reservoir’s characterization is toconvert rock type to physical and quantifiable attributes, suchas effective porosity, permeability and irreducible water satu-ration. Petrophysics is the subdiscipline concerned with howmuch and how connected the reservoir space is and how therocks interact with the particular oil, gas and water containedin them.
Through a rigorous process of laboratory analysis of coresamples and well log analysis, the petrophysicist convertsrocks into numerical properties, such as porosity and perme-ability, and to rock/fluid properties, such as connate watersaturation, relative permeability and capillary pressure curves.
Laboratory analyses are performed on core plugs andwhole core for representative intervals of the reservoir. Highlyskilled scientists and engineers perform these analyses at avariety of state-of-the-art R&D laboratories around theworld, as well as at Saudi Aramco facilities. The results areused by Saudi Aramco petrophysicists to calibrate well logdata to the rock measurements, thus expanding the value ofthe analyses to the uncored wells. Ultimately, these results are
used to transform computer models of the reservoir from rocktypes to petrophysical values, as discussed later. In addition,Saudi Aramco has a rock catalog containing exhaustive spe-cial core analysis data for hundreds of reservoir rock typesfrom around the world. This resource is used as a database ofanalog rock data to fill in some of the gaps in Saudi Aramco’srock type database. The catalog is continually being updatedwith Arabian reservoir rock type analytical data, as the in-house reference for petrophysical data.
I t ’s M o r e T h a n J u s t t h e R o c k s
Reservoir characterization also includes understanding theimportant role groundwater plays in confining oil and gas inthe reservoir rocks. Petroleum hydrogeology is the geosciencespecialty concerned with the interaction of the basinhydraulics with the oil and gas reservoirs. For example,knowledge of the boundary between water and oil or gas iscritical for defining the initial hydrocarbons in place, the basisfor reserves estimation. Also, in some offshore reservoirs,
S A U D I A R A M C O J O U R N A L O F T E C H N O L O G Y • W I N T E R 2 0 0 1 11
Overpressured Reservoirs. Oil and gas reservoirs have become hydraulically separated from the western recharge areas due to facies changes, faulting anddeep-burial diagenesis. Once separated from the regional pressure system, thepressure regimes in the reservoirs can change with time in response to many fac-tors. Hydrogeologists are able to help explorationists better predict the targetreservoir environment by using pressure depth plots to identify areas of reservoircontinuity and compartmentalization.
Core description coupled with laboratory analyses of selected core samples, oftenunder reservoir conditions of temperature and pressure, equate complex rockgeometries to an integrated set of petrophysical curves, cross plots and histograms.
50527araD2R2 12/11/01 7:15 PM Page 11
aquifer flow is strong enough to displace oil production with-out a significant decline in reservoir pressure, eliminating theneed for expensive peripheral water flood projects. In thesereservoirs, detailed characterization of the aquifer is necessaryin order to analyze problems in pressure support in some ofthe producing areas. In other reservoirs, occurrences of tarand tar mats impede the efficiency of peripheral water floods.Field-wide tar distribution is very difficult to investigate andrequires special knowledge of the basin hydraulics, oil migra-tion history and structural history to explain and predict itspresence and location. Petroleum hydrogeology provides thescientific skills necessary to accurately define both the existingand historical changes to the oil and water relationships of aparticular reservoir.
P u t t i n g I t A l l To g e t h e r
Advances in computer technology have enabled the geoscien-tist to not only analyze large quantities of data, but also tointegrate interpretations from several different disciplines intoone earth model. The main advantage of building 3D geocel-lular models is to provide the geoscientists and engineers adetailed picture of a reservoir located many thousands of feetbelow the surface. Reservoir structure maps, which have beenenhanced by 3D seismic interpretations, are combined withinterpreted well data and hand-drawn facies maps or seismicattribute maps to produce 3D geocellular models, comprisedof millions of individual cells. This is done using the combina-
tion of modeling and geostatistical techniques appropriate forthe situation. These reservoir “rock” models are then ready tobe transformed into petrophysical properties, such as perme-ability and connate water saturation, as input to reservoirsimulation models and reserves estimation. Reservoir modelsare also used on a daily basis to evaluate proposed well loca-tions and aid in tracking and geo-steering horizontal wells.
Geocellular models are used for many purposes over a pro-ducing field’s existence, from the discovery and appraisalstage through final depletion. Geologic models must be specif-ically designed for each of these stages in order to characterizethe reservoir producing mechanisms at the appropriate detail.For example, models built at the discovery and appraisalstage, where actual reservoir data is at a minimum, provideuseful insight on initial investment decisions, such as sizingsurface facilities or throughput capacity. These scoping models are built using only a few wells, usually with coredescriptions and 3D seismic data, if it is available. Conversely,a mature field, like the Ghawar field, has over 2,500 wells,several 3D seismic surveys and nearly 50 years of productionhistory to enhance the geologic model. Models built for thisfield are used to evaluate production strategies, injectionwater movement and ultimate recovery factors for variousareas of the field.
L e a r n i n g F r o m E x p e r i e n c e
Reservoir simulation modeling adds the time dimension to the
12 S A U D I A R A M C O J O U R N A L O F T E C H N O L O G Y • W I N T E R 2 0 0 1
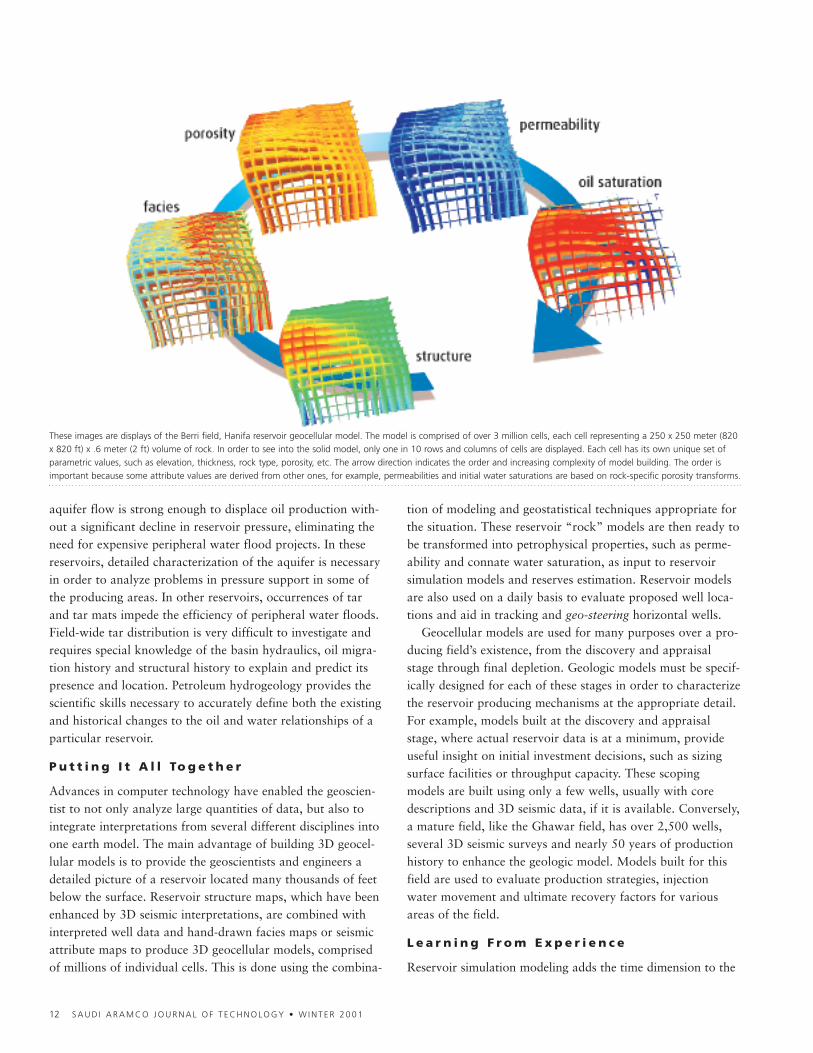
These images are displays of the Berri field, Hanifa reservoir geocellular model. The model is comprised of over 3 million cells, each cell representing a 250 x 250 meter (820x 820 ft) x .6 meter (2 ft) volume of rock. In order to see into the solid model, only one in 10 rows and columns of cells are displayed. Each cell has its own unique set ofparametric values, such as elevation, thickness, rock type, porosity, etc. The arrow direction indicates the order and increasing complexity of model building. The order isimportant because some attribute values are derived from other ones, for example, permeabilities and initial water saturations are based on rock-specific porosity transforms.
50527araD2R2 12/11/01 7:15 PM Page 12
S A U D I A R A M C O J O U R N A L O F T E C H N O L O G Y • W I N T E R 2 0 0 1 13
50527araD2R1.p13.ps 12/06/2001 07:13 PM Page 13
high-resolution 3D geocellular models by incorporating thefield’s production history. This provides a unique opportunityto both validate and improve the reservoir characterization bycomparing observed well pressures and water cuts to model-estimated values. During this process, which is commonlyreferred to as history matching, the geologist and engineer candetermine the overall accuracy of the simulation model.Engineers identify areas where production history is difficult tomatch, and these are reviewed by the geoscientists for possiblere-interpretation. After successful history matching, the modelsare then used in prediction models to test alternative develop-ment strategies, such as well location and completion issues,production depletion strategies and the timing for surface facil-ity construction or upgrades.
B U S I N E S S I M PA C T S
Some of the important business activities impacted by reservoircharacterization are drilling operations, field developmentplanning, production optimization and reserves assessment.Each of these activities benefits greatly from improvements inthe detail and accuracy of the reservoir model.
Drilling engineers depend on structure maps of the subsur-face to design individual well casing and completionprograms. Geological guidance regarding unstable formations,local fracturing/faulting or the presence of overpressuredzones alerts the drilling engineer to potential downhole prob-lems that might occur during drilling. For long reachhorizontal wells in heterogeneous reservoirs, geologists are
often asked to geo-steer the drilling well in order to follow orfind good quality parts of the reservoir. This is particularlychallenging in the deep gas reservoirs where the reservoirs arevery complex and the potential for a noncommercial well isvery high, given average well spacing of 3 kilometers (1.8miles) or more. The success ratio of drilling these expensivedeep gas wells has improved significantly after the integrationof 3D seismic interpretations into the geological models.
Most of the producing oil reservoirs have been on produc-tion for decades and are beginning to show signs of depletion.At this stage of reservoir development, increasing water cutsand lagged oil are major challenges of reservoir management.Reservoir characterization aids the engineers in designingremedial workovers for high water cut wells and short-lateralhorizontal recompletions, which target attic or lagged oil inheavily depleted areas of the reservoir.
One of the more recent synergies of old and new technolo-gies is the drilling of horizontal wells to deplete oil from partsof the reservoir that do not flow readily into conventionalvertical wells. By being oriented parallel to the reservoir bed-ding, the horizontal well is exposed to hundreds or thousandsof feet of reservoir. This long well bore exposure allows alower permeability reservoir to produce at a higher flow rateand lower drawdown pressure than would be possible with avertical well bore. Horizontal wells are not new, but with log-ging-while-drilling and continuous surveying tools on-board,the geologist can now surgically place a horizontal well boreexactly where he wants it. Add to this mix the results fromreservoir characterization and simulation model studies,which define the most likely locations for lagged oil, and you have both the right vehicle and the right road map forsuccess.
Saudi Aramco uses reservoir simulation technology to makeinvestment decisions on how to develop a new oil or gas incre-ment, as well as how to manage a reservoir over time.
14 S A U D I A R A M C O J O U R N A L O F T E C H N O L O G Y • W I N T E R 2 0 0 1
The lights are on at a Shaybah field camp at twilight in the Rub’ al-Khali desert.
Tar Area Depletion and Delineation. A large area in southeastern ‘Uthmaniyahhas a complex tar distribution that prevents efficient peripheral water injection andsweep processes within the high permeability producing zones of the Arab-Dreservoir. Field analyses show that lagged oil exists down-dip from the tar barrier,which cannot be produced easily, if at all, using conventional wells. Horizontalwells are used to delineate the tar distribution and deplete this oil by drilling thetop of Zone 2. Drilling proceeds in a direction down-dip from the tar area towardthe lagged oil until the well bore breaks free of tar and penetrates a suitable oilsection. Company scientists developed a procedure to analyze cuttings onsite tohelp determine the presence of tar and aid in geo-steering the well.
50527araD2R1.p14.ps 12/06/2001 07:13 PM Page 14
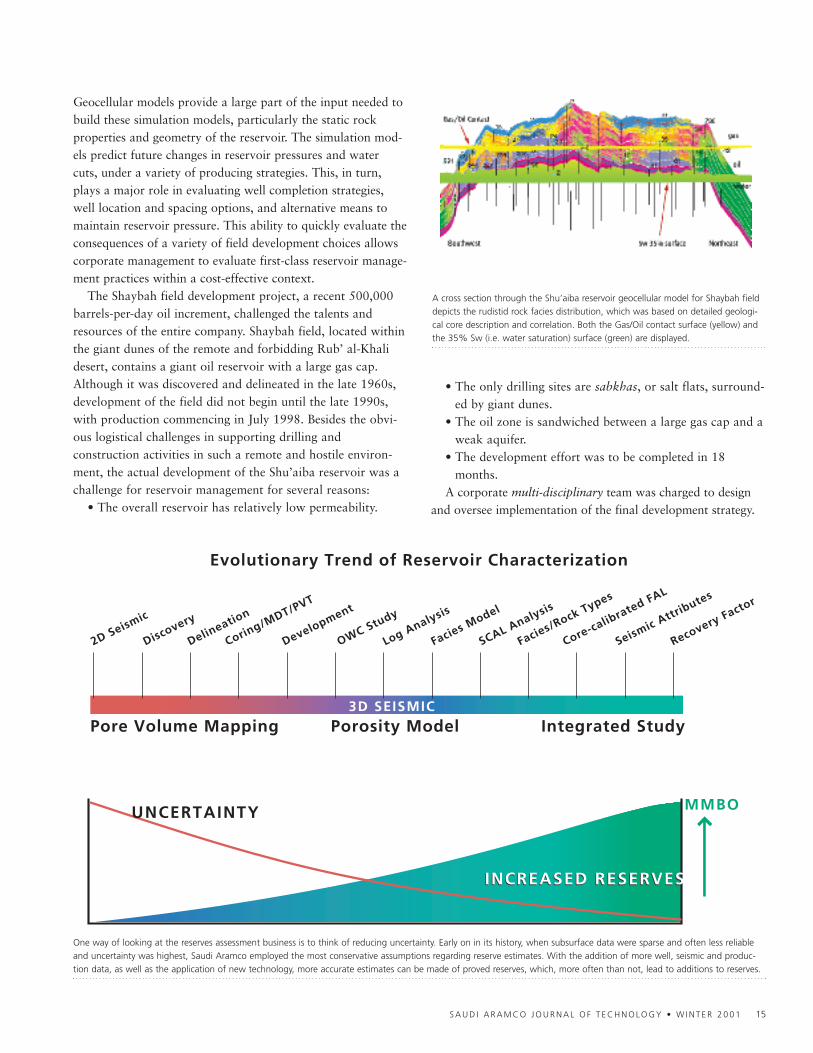
Geocellular models provide a large part of the input needed tobuild these simulation models, particularly the static rockproperties and geometry of the reservoir. The simulation mod-els predict future changes in reservoir pressures and watercuts, under a variety of producing strategies. This, in turn,plays a major role in evaluating well completion strategies,well location and spacing options, and alternative means tomaintain reservoir pressure. This ability to quickly evaluate theconsequences of a variety of field development choices allowscorporate management to evaluate first-class reservoir manage-ment practices within a cost-effective context.
The Shaybah field development project, a recent 500,000barrels-per-day oil increment, challenged the talents andresources of the entire company. Shaybah field, located withinthe giant dunes of the remote and forbidding Rub’ al-Khalidesert, contains a giant oil reservoir with a large gas cap.Although it was discovered and delineated in the late 1960s,development of the field did not begin until the late 1990s,with production commencing in July 1998. Besides the obvi-ous logistical challenges in supporting drilling andconstruction activities in such a remote and hostile environ-ment, the actual development of the Shu’aiba reservoir was achallenge for reservoir management for several reasons:
• The overall reservoir has relatively low permeability.
• The only drilling sites are sabkhas, or salt flats, surround-ed by giant dunes.
• The oil zone is sandwiched between a large gas cap and aweak aquifer.
• The development effort was to be completed in 18months.
A corporate multi-disciplinary team was charged to designand oversee implementation of the final development strategy.
S A U D I A R A M C O J O U R N A L O F T E C H N O L O G Y • W I N T E R 2 0 0 1 15
A cross section through the Shu’aiba reservoir geocellular model for Shaybah fielddepicts the rudistid rock facies distribution, which was based on detailed geologi-cal core description and correlation. Both the Gas/Oil contact surface (yellow) andthe 35% Sw (i.e. water saturation) surface (green) are displayed.
MMBO
INCREASED RESERVES
UNCERTAINTY
3D SEISMIC
Pore Volume Mapping Integrated StudyPorosity Model
Evolutionary Trend of Reservoir Characterization
2D Seismic
Discovery
Delineation
Coring/M
DT/PVT
Development
OWC Study
Log Analysis
Facies Model
SCAL Analysis
Facies/Rock Types
Core-calibrated FAL
Seismic Attributes
Recovery Factor
INCREASED RESERVES
One way of looking at the reserves assessment business is to think of reducing uncertainty. Early on in its history, when subsurface data were sparse and often less reliableand uncertainty was highest, Saudi Aramco employed the most conservative assumptions regarding reserve estimates. With the addition of more well, seismic and produc-tion data, as well as the application of new technology, more accurate estimates can be made of proved reserves, which, more often than not, lead to additions to reserves.
50527araD2R1.p15.ps 12/06/2001 07:13 PM Page 15
Reservoir characterization played a key role by developing thegeological model from core and log data; acquiring, processingand interpreting a 3D seismic survey; and building a geocellularmodel. The geocellular model was used to support reservoirsimulation studies considering a variety of reservoir issues,from well and surface facility design to ultimate recovery.
Based on the findings of the team, the field was developedusing horizontal wells exclusively. Each sabkha became theequivalent of an offshore drilling platform. A vertical wellwould be drilled first, if one did not already exist, in order tooptimize the horizontal well locations for that sabkha. Coreand log data from the new vertical wells were used to updatethe geological and geocellular models, as well as improve thewell tie-in with the 3D seismic data. Besides being involved inwell placement and drilling support, reservoir characterizationwas instrumental in encouraging new well completion strate-gies, such as multi-laterals and long-reach laterals, to improvewell productivity in the low permeability areas of the reservoir.
Reserves assessment and replacement are mission-criticalactivities of Saudi Aramco. Accurate assessment of reservesnumbers forms the basis for prudent financial planning of thewide range of upstream investments that are managed by thecompany. As the world’s largest oil producer, at a massive 3billion barrels annual production, the replacement of these
16 S A U D I A R A M C O J O U R N A L O F T E C H N O L O G Y • W I N T E R 2 0 0 1
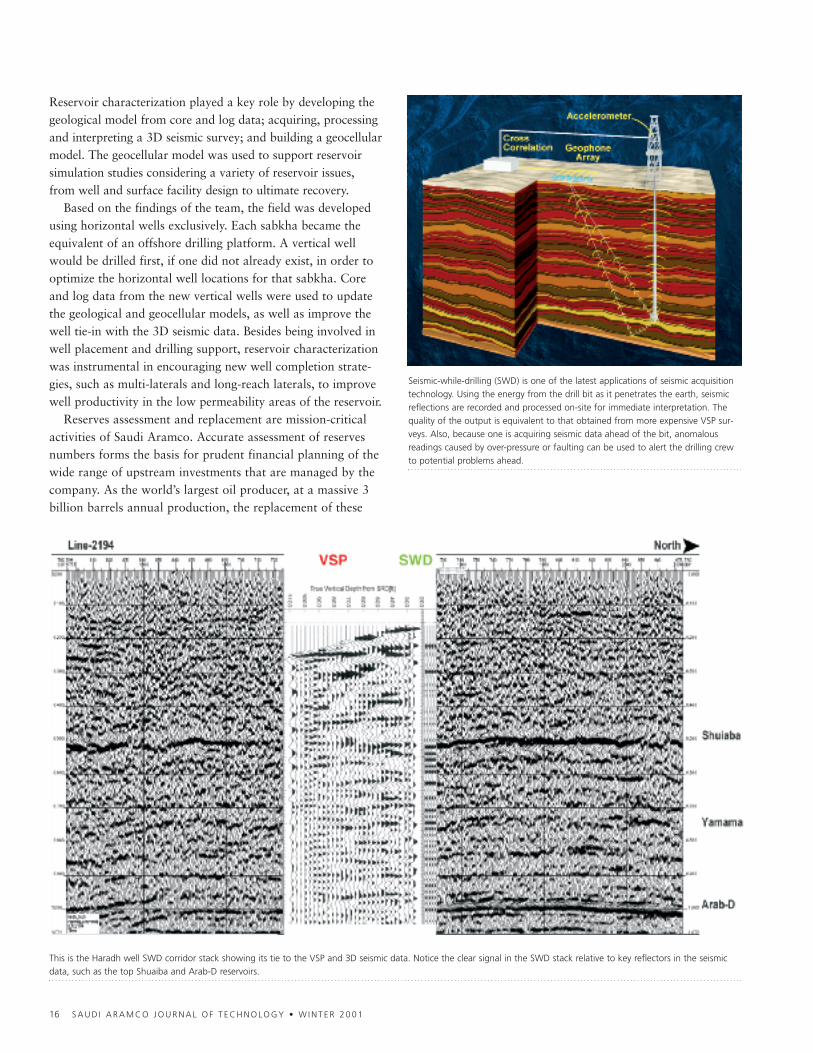
This is the Haradh well SWD corridor stack showing its tie to the VSP and 3D seismic data. Notice the clear signal in the SWD stack relative to key reflectors in the seismicdata, such as the top Shuaiba and Arab-D reservoirs.
Seismic-while-drilling (SWD) is one of the latest applications of seismic acquisitiontechnology. Using the energy from the drill bit as it penetrates the earth, seismicreflections are recorded and processed on-site for immediate interpretation. Thequality of the output is equivalent to that obtained from more expensive VSP sur-veys. Also, because one is acquiring seismic data ahead of the bit, anomalousreadings caused by over-pressure or faulting can be used to alert the drilling crewto potential problems ahead.
50527araD2R1.p16.ps 12/06/2001 07:13 PM Page 16
reserves is not just of corporate importance, but of globalimportance as well.
Annual reserves assessments are based on completed stud-ies that use current reservoir characterization technologyoperating on existing data. Great care is taken to give anaccurate assessment of reserves, but the assessment is alwayscarefully conservative to avoid overestimating reserves.Moreover, this gives a great window of opportunity -- wehave been conservative due to our uncertainty in some areasof technology and data. So, new technology for reservoircharacterization is constantly reviewed and applied, as areresults from new laboratory and field studies. With over 250reservoirs and the mix of reservoir types to which new tech-nology and data can be applied, there are many ways toachieve reserves replacement and accuracy objectives.
N E W T E C H N O L O G I E S
As mentioned above, a major emphasis of reservoir character-ization is the building of geocellular models that moreaccurately capture the detailed distribution of porosity, per-meability and water saturation of the reservoir. Ideally, thismodel represents the synthesis of all available geologic, geo-physical and engineering knowledge of the reservoir. Futurebreakthroughs in reservoir characterization, then, lie in devel-oping technologies that provide greater and better insight intothe reservoir’s properties, as well as those that will enablecloser and easier integration of the multi-disciplinary effortsthan are currently possible.
In the area of well bore logging, a new breakthrough hasbeen the application of nuclear magnetic resonance (NMR)technology, to measure pore size distributions. These distribu-tions can be empirically correlated to important petrophysicalproperties, such as permeability, connate water saturation andeffective porosity, as well as being a detailed facies and fluids
indicator. Other advances in well bore analysis and measure-ment are the use of neural networks to predict lithofacies; thecontinual improvement in the interpretation of image logs,particularly in horizontal wells, to define lithofacies, charac-terize fracturing and measure bedding dips in the reservoir;and the use of borehole seismics to image the reservoir aboveand below a horizontal well.
In the area of direct seismic description of the reservoir, aninteresting technology on the horizon is the use of cross-welltomography. This method measures the reservoir betweenwells by placing seismic sources and receivers in the wellbores. Further advances in the acquisition of 3D seismic information or data, specifically the use of multi-componentseismic receivers to enable the sampling of the elastic proper-ties of the seismic energy, will push the interpretation ofseismic data towards direct estimation of lithology, fluid satu-rations and fracture orientations and densities. Repeat 3Dseismic survey acquisition and analysis, or 4D seismic, canprovide detailed “snapshots” of fluid flow within the reser-voir, providing a direct means to validate reservoir simulation
S A U D I A R A M C O J O U R N A L O F T E C H N O L O G Y • W I N T E R 2 0 0 1 17
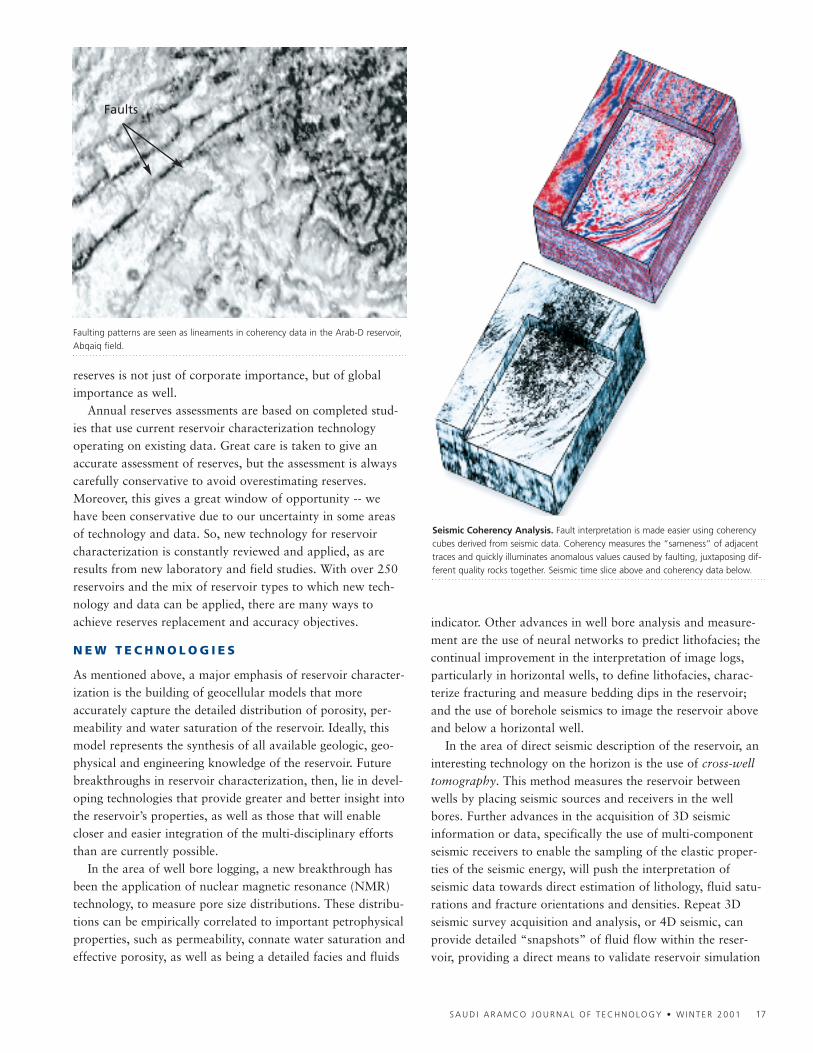
Faulting patterns are seen as lineaments in coherency data in the Arab-D reservoir,Abqaiq field.
Seismic Coherency Analysis. Fault interpretation is made easier using coherencycubes derived from seismic data. Coherency measures the “sameness” of adjacenttraces and quickly illuminates anomalous values caused by faulting, juxtaposing dif-ferent quality rocks together. Seismic time slice above and coherency data below.
Faults
50527araD2R1.p17.ps 12/06/2001 07:13 PM Page 17
results. A promising low-cost technique to acquire seismicinformation while drilling measures the reflected drill bit ener-gy, previously considered noise, as a source of seismic waves.The data are processed on-site to obtain a seismic imagebelow the drill bit, as well as to record a vertical seismic pro-file for later use in 3D seismic survey time-to-depthconversions. Advances in seismic data processing, such as pre-stack time or depth migration, are being used to improve thestructural imaging of many reservoirs by focusing seismicenergy arriving by complex ray paths. Innovative approachesin displaying seismic data, such as spectral color and coheren-cy, allow interpreters to extract finer details of faulting andfracturing of the reservoir.
The most useful developments in the reservoir characteriza-
tion area are in the integration of the multi-disciplinary data
into a single earth model. Novel gridding procedures are being
developed (e.g. Pebi cells) that allow the structural complexity
in the reservoirs (e.g. faults) to be more accurately represented.
New geostatistical approaches are being developed and
employed to incorporate the heterogeneity observed in the
well logs and seismic data into high-resolution models.
Saudi Aramco has developed in-house a massively par-
allel processing black oil simulator called POWERS, in
order to be able to model its huge and mature reser-
voirs at very high spatial resolution and for very long time
periods. In addition, reservoir simulators are being used by geo-
scientists to quickly quality-control and modify geocellular
models, if necessary, prior to constructing the simulation model.
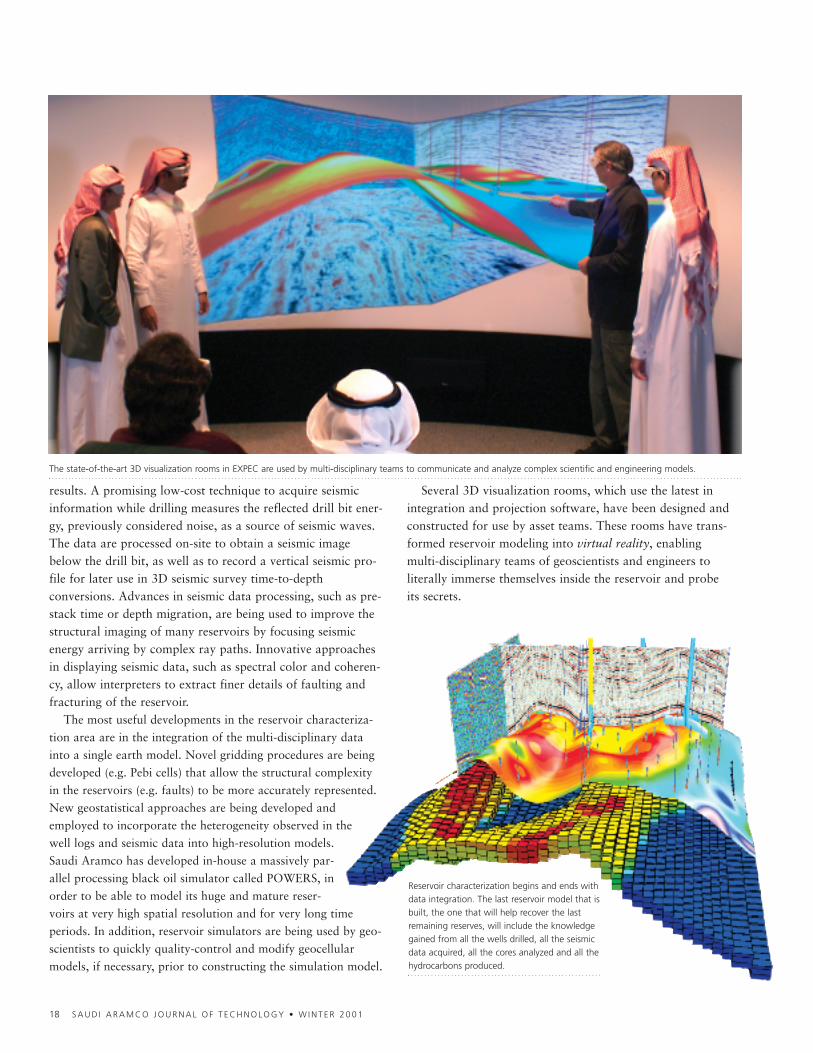
Several 3D visualization rooms, which use the latest inintegration and projection software, have been designed andconstructed for use by asset teams. These rooms have trans-formed reservoir modeling into virtual reality, enablingmulti-disciplinary teams of geoscientists and engineers to literally immerse themselves inside the reservoir and probe its secrets.
18 S A U D I A R A M C O J O U R N A L O F T E C H N O L O G Y • W I N T E R 2 0 0 1
The state-of-the-art 3D visualization rooms in EXPEC are used by multi-disciplinary teams to communicate and analyze complex scientific and engineering models.
Reservoir characterization begins and ends withdata integration. The last reservoir model that isbuilt, the one that will help recover the lastremaining reserves, will include the knowledgegained from all the wells drilled, all the seismicdata acquired, all the cores analyzed and all thehydrocarbons produced.