ISyE 2028 – Basic Statistical Methods Fall 2015 Bonus Project: “Big” Data Analytics Final Report Yesol Do Which is a better predictor of college success: SAT or High School GPA? Introduction How predictive of success in college are SAT scores? More than 800 four-year colleges and universities do not use the SAT or ACT to admit substantial numbers of bachelor- degree applicants. Are standardized tests such as the SAT a valid predictor of academic achievement in college? More colleges -- including competitive colleges -- have gone test optional in recent years. The National Center for Fair and Open Testing keeps a list of more than 800 four-year colleges that do not require the SAT or ACT, although some of those colleges are less selective in admissions. To determine whether the standardize test scores or high school GPA is the true measurement of college success, I closely observed the data results in the study involving 123,000 students at 33 colleges and universities of varying types. Summary and Major Findings This particular study assesses the outcomes of optional standardized testing policies in the Admissions offices at 33 public and private colleges and universities, based on cumulative GPA and graduation rates. Four cohorts of institutions are examined: twenty private colleges and universities, six public universities, five minority serving institutions and two arts institutions, with a total of just under 123,000 student and alumni records. Few significant differences between submitters and non-submitters of testing were observed in Cumulative GPAs and graduation rates, despite significant differences in SAT/ACT scores. This three-year study is the first major published research to evaluate optional testing policies in depth and across institutional types. 1. With approximately 30% of the students admitted as non-submitters over a maximum of eight cohort years, there are no significant differences in either Cumulative GPA or graduation rates between submitters and non-submitters. Across the study, non- submitters (not including the public university students with above-average testing, to focus on the students with below-average testing who are beneficiaries of an optional
Transcript
ISyE 2028 – Basic Statistical Methods -‐ Fall 2015 Bonus Project: “Big” Data Analytics
Final Report -‐ Yesol Do
Which is a better predictor of college success: SAT or High School GPA?
Introduction How predictive of success in college are SAT scores? More than 800 four-year colleges and universities do not use the SAT or ACT to admit substantial numbers of bachelor-degree applicants. Are standardized tests such as the SAT a valid predictor of academic achievement in college? More colleges -- including competitive colleges -- have gone test optional in recent years. The National Center for Fair and Open Testing keeps a list of more than 800 four-year colleges that do not require the SAT or ACT, although some of those colleges are less selective in admissions. To determine whether the standardize test scores or high school GPA is the true measurement of college success, I closely observed the data results in the study involving 123,000 students at 33 colleges and universities of varying types. Summary and Major Findings This particular study assesses the outcomes of optional standardized testing policies in the Admissions offices at 33 public and private colleges and universities, based on cumulative GPA and graduation rates. Four cohorts of institutions are examined: twenty private colleges and universities, six public universities, five minority serving institutions and two arts institutions, with a total of just under 123,000 student and alumni records. Few significant differences between submitters and non-submitters of testing were observed in Cumulative GPAs and graduation rates, despite significant differences in SAT/ACT scores. This three-year study is the first major published research to evaluate optional testing policies in depth and across institutional types. 1. With approximately 30% of the students admitted as non-submitters over a maximum of eight cohort years, there are no significant differences in either Cumulative GPA or graduation rates between submitters and non-submitters. Across the study, non-submitters (not including the public university students with above-average testing, to focus on the students with below-average testing who are beneficiaries of an optional
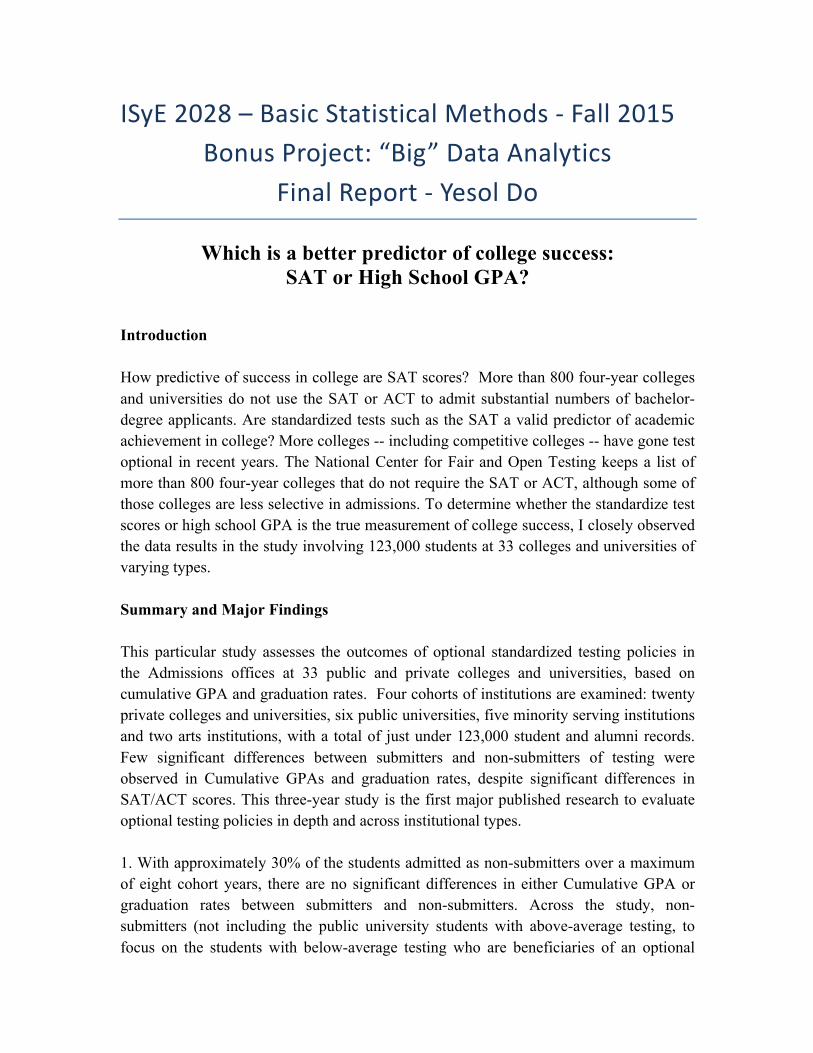
testing policy) earned Cumulative GPAs that were only .05 lower than submitters, 2.83 versus 2.88. The difference in their graduation rates was .6%. With almost 123,00 students at 33 widely differing institutions, the differences between submitters and non-submitters are five one-hundredths of a GPA point, and six-tenths of one percent in graduation rates. By any standard, these are trivial differences. 2. College Cumulative GPAs are closely related to high school GPAs. Students with strong HSGPAs generally perform well in college.
Figure 1
Figure 1 illustrates the relationship between high school GPA and college cumulative GPA. With 88,460 students from the 33 institutions and with above-average-testing non-submitters and below-average testing non-submitters graphed separately, the graph is a tight 45-degree slope: college Cumulative GPA is highly related to HSGPA. Also, the slope lines for both submitters and nonsubmitters are not only close to each other, but of almost exactly the same shape--there is little variation for either submitters or non-submitters. HSGPA predicts strongly for both submitters and nonsubmitters. (The vertical
pattern of HSGPA’s at the extreme right side of the graph is created by groups of students with HGPAs at or in excess of 4.0, the result of weighting HSGPAs for honors/AP/IB courses.)
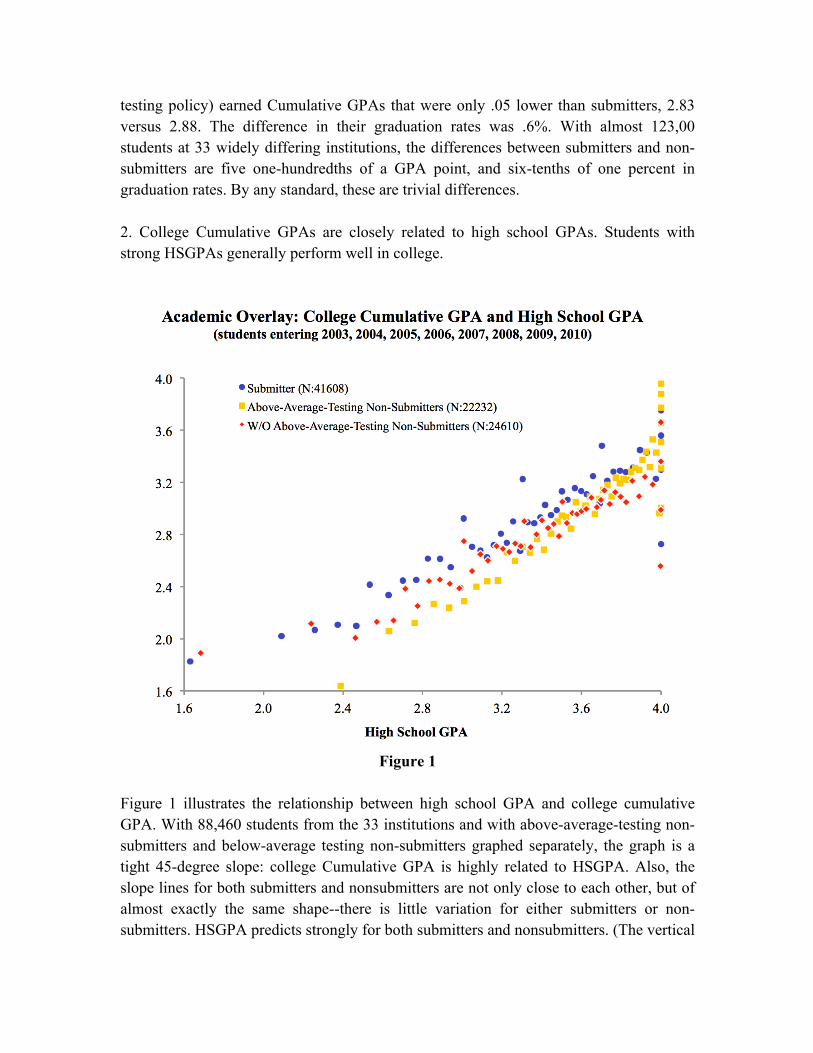
Figure 2
In contrast, when college Cumulative GPA is graphed against SAT scores, with over 105,000 student records, the graph has the much broader, semi-spherical that suggests a much-less-reliable prediction of college Cumulative GPA. While neither submitters nor non-submitters have a tight predictive line, non-submitters seem more dramatically to expand the oval shape of the graph--for them, SATs seem particularly unlikely to closely predict their college performance. Also worth noting is that neither submitters nor non-submitters dominate the top or the bottom of these graphs. (Note that because of the N sizes, each blue dot for submitters includes roughly twice as many students as an orange dot for either of the two groups of non-submitters.)
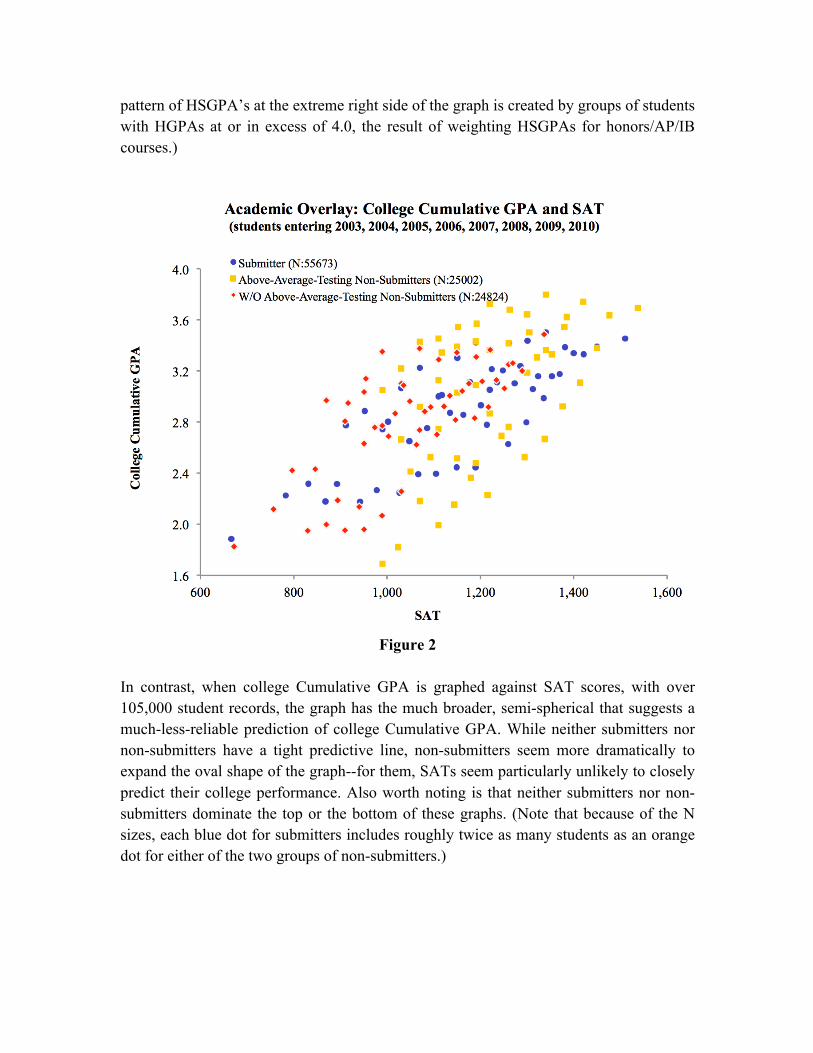
Six Public Universities: Principal Findings This comparison is based on aggregate cohorts from six public universities, a combined total of 71,831 records. The chart below provides a comparison of key data at each of the six public universities in the study, reasonably consistent patterns that will help with further analysis. Because of the institutional policies for automatic admission with certain HSGPAs and ranks, nonsubmitters enroll with consistently stronger HSGPAs. SATs (including converted ACTs) vary: 5 of 6 have higher SATs from non-submitters, but 2 of the 5 are by small differences, and the most competitive institution has higher SATs from the submitters by a small difference. The only large difference in SATs is at the institution with comparatively low overall academic criteria, including testing. All six institutions have non-submitters earning consistently higher first-year and cumulative GPAs. Of the five institutions with graduated cohorts, all five have higher graduation rates for non-submitters. (Figure 3)
Figure 3
In the pool of over 71,000 students, non-submitters have much better HSGPAs, and almost exactly the same average testing scores. As we will see repeatedly in this study, college and university Cum GPA’s track HSGPAs: non-submitters enter with HSGPAs that are .3 better than submitters, and graduate with average Cum GPA’s that are .3 higher than submitters. Graduation rates of non-submitters are 5% better than submitters. (Figure 3)
Figure 4
Figure 5
Chi Square Test
𝑿𝟐 = ∑𝒐− 𝒆 𝟐
𝒆
In summary, strong results came from students with testing below their institutional averages, and reasonable results even for the students with the lowest SATs. There are wide institutional variations, but the patterns seem steady across the diverse group of public universities. Correlation Coefficient Formula
For data in Figure 3:
Value of R – Non-sub Value of R – Sub High School GPA and
First Year GPA 0.7006 0.892
SAT and First Year GPA 0.4049 0.4375
Conclusion Are standardized tests good decision makers for college admissions, or does it artificially truncate the pools of students who would succeed in college if they were given a chance? Students with strong HSGPAs, even without testing, are likely to succeed in college, and students with low HSGPAs, even with a broad range of testing, have much lower college GPAs and graduation rates.
References
Kristen Garman, S. (2014, February 5). Defining Promise: Optional Standardized Testing Policies in American College and University Admissions. Retrieved November 15, 2015. Steenman, S., Bakker, W., & Tartwijk, J. (2014). Predicting different grades in different ways for selective admission: Disentangling the first-year grade point average. Studies in Higher Education, 1-16.