19
WHICH MULTI-ASSET CLASS RISK MODEL IS RIGHT FOR YOU?

W H I C H M U LT I - A S S E T C L A S S R I S K M O D E L I S R I G H T F O R Y O U ?

With more than 40 years of experience serving our risk management clients, FactSet understands that there is no one-size-fits-all risk management framework. The three multi-asset class risk models detailed in this guide offer various benefits to fit the needs of firms across the globe. Read on to see what each can offer.
A C C U R AT E + S O P H I S T I C AT E D
G L O B A L M O N T E C A R L O M U LT I - A S S E T C L A S S R I S K M O D E LThis model is best suited for risk teams communicating with regulators with tail risk measures such as VaR and CVaR. By performing risk pricing, it removes the assumptions for non-linear assets and offers more accurate assumptions in the tails of the distribution.
C U T T I N G - E D G E + I N S I G H T F U L
F AT-TA I L M U LT I - A S S E T C L A S S R I S K M O D E LThis model was designed to provide a truly forward-looking understanding of market turbulence. The model supplements the Monte Carlo model for revealing market turbulence and measuring tail dependence.
F A S T + D E S C R I P T I V E
G L O B A L L I N E A R M U LT I - A S S E T C L A S S R I S K M O D E LThis model is the perfect choice for investment decision support and communicating between the risk department and the investment team. Due to its linear nature, the model allows for easier reporting of where risk originates and how it changes depending on investment decisions.
The approaches described throughout this guide are further detailed in our full white papers. To request your copies, contact [email protected].
GLOB A L MONTE CA RLO MULTI-AS SE T CL AS S RISK MODEL
R I S K M O D E L 1

MODEL OVERVIEW
The FactSet multi-asset class (MAC) risk model is based on a Monte Carlo simulation of the joint distribution of future joint distribution of future portfolio returns, which allows for calculation of various risk statistics such as Tracking Error Volatility (TEV), Value-at Risk (VaR), and Expected Tail Loss (ETL), as well as other characteristics of the return distribution (kurtosis, skewness, etc.). The Monte Carlo framework reprices securities for each simulation to account for non-linear effects within a portfolio such as optionality and convexity. The factor framework uses factors specific to equities, fixed income, commodities, and alternative assets and combines them into one multi-asset class model through a full cross-asset class factor covariance matrix.
ASSET COVERAGE
• Over 50,000 global equities
• Over three million global bonds
• Over 250 highly liquid commodity indices, continuous front-month futures contracts, commodity ETFs, and mutual funds
• Over 150 currencies
• Exchange-traded and OTC derivatives of equity, fixed income, index, currency, and commodity products
• Hedge funds, private equity, real estate, and other private assets with flexible coverage based on available asset transparency
www.factset.com4 WHICH MULTI-ASSE T CL ASS RISK MODEL IS RIGHT FOR YOU?
Integrate equity, fixed income, commodity, currency, and returns-based factors to gain a full, transparent view of risk at the portfolio, factor, and asset levels using a Monte Carlo approach.
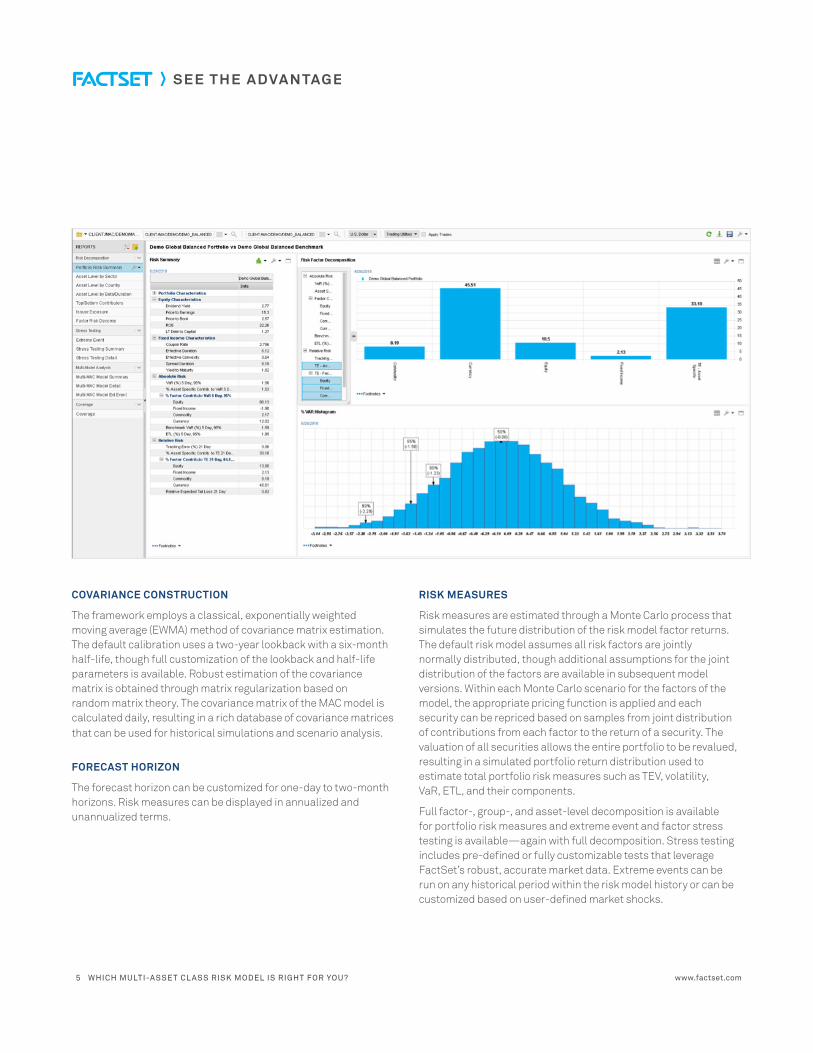
COVARIANCE CONSTRUCTION
The framework employs a classical, exponentially weighted moving average (EWMA) method of covariance matrix estimation. The default calibration uses a two-year lookback with a six-month half-life, though full customization of the lookback and half-life parameters is available. Robust estimation of the covariance matrix is obtained through matrix regularization based on random matrix theory. The covariance matrix of the MAC model is calculated daily, resulting in a rich database of covariance matrices that can be used for historical simulations and scenario analysis.
FORECAST HORIZON
The forecast horizon can be customized for one-day to two-month horizons. Risk measures can be displayed in annualized and unannualized terms.
RISK MEASURES
Risk measures are estimated through a Monte Carlo process that simulates the future distribution of the risk model factor returns. The default risk model assumes all risk factors are jointly normally distributed, though additional assumptions for the joint distribution of the factors are available in subsequent model versions. Within each Monte Carlo scenario for the factors of the model, the appropriate pricing function is applied and each security can be repriced based on samples from joint distribution of contributions from each factor to the return of a security. The valuation of all securities allows the entire portfolio to be revalued, resulting in a simulated portfolio return distribution used to estimate total portfolio risk measures such as TEV, volatility, VaR, ETL, and their components.
Full factor-, group-, and asset-level decomposition is available for portfolio risk measures and extreme event and factor stress testing is available—again with full decomposition. Stress testing includes pre-defined or fully customizable tests that leverage FactSet’s robust, accurate market data. Extreme events can be run on any historical period within the risk model history or can be customized based on user-defined market shocks.
www.factset.com5 WHICH MULTI-ASSE T CL ASS RISK MODEL IS RIGHT FOR YOU?
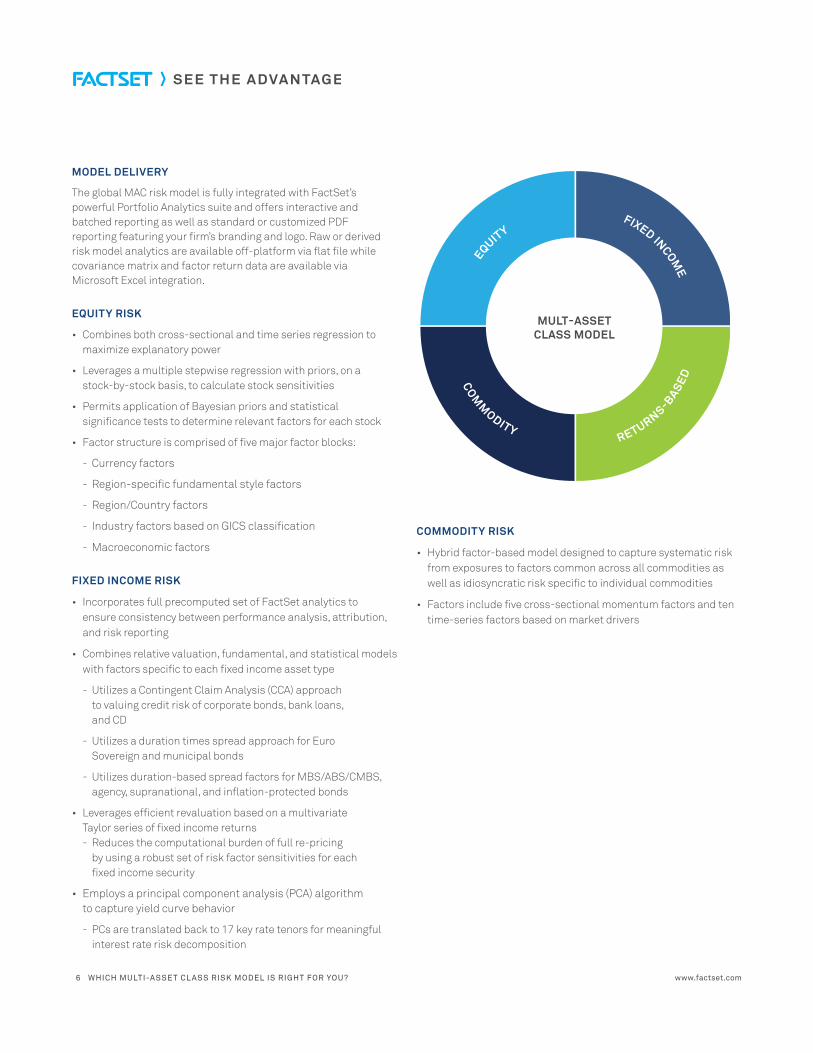
MODEL DELIVERY
The global MAC risk model is fully integrated with FactSet’s powerful Portfolio Analytics suite and offers interactive and batched reporting as well as standard or customized PDF reporting featuring your firm’s branding and logo. Raw or derived risk model analytics are available off-platform via flat file while covariance matrix and factor return data are available via Microsoft Excel integration.
EQUITY RISK
• Combines both cross-sectional and time series regression to maximize explanatory power
• Leverages a multiple stepwise regression with priors, on a stock-by-stock basis, to calculate stock sensitivities
• Permits application of Bayesian priors and statistical significance tests to determine relevant factors for each stock
• Factor structure is comprised of five major factor blocks:
- Currency factors
- Region-specific fundamental style factors
- Region/Country factors
- Industry factors based on GICS classification
- Macroeconomic factors
FIXED INCOME RISK
• Incorporates full precomputed set of FactSet analytics to ensure consistency between performance analysis, attribution, and risk reporting
• Combines relative valuation, fundamental, and statistical models with factors specific to each fixed income asset type
- Utilizes a Contingent Claim Analysis (CCA) approach to valuing credit risk of corporate bonds, bank loans, and CD
- Utilizes a duration times spread approach for Euro Sovereign and municipal bonds
- Utilizes duration-based spread factors for MBS/ABS/CMBS, agency, supranational, and inflation-protected bonds
• Leverages efficient revaluation based on a multivariate Taylor series of fixed income returns - Reduces the computational burden of full re-pricing
by using a robust set of risk factor sensitivities for each fixed income security
• Employs a principal component analysis (PCA) algorithm to capture yield curve behavior
- PCs are translated back to 17 key rate tenors for meaningful interest rate risk decomposition
MULT-ASSET CLASS MODEL
COM
M
ODITYRETURNS-BASE
D
EQUITYFIXED INCOM
E
COMMODITY RISK
• Hybrid factor-based model designed to capture systematic risk from exposures to factors common across all commodities as well as idiosyncratic risk specific to individual commodities
• Factors include five cross-sectional momentum factors and ten time-series factors based on market drivers
www.factset.com6 WHICH MULTI-ASSE T CL ASS RISK MODEL IS RIGHT FOR YOU?
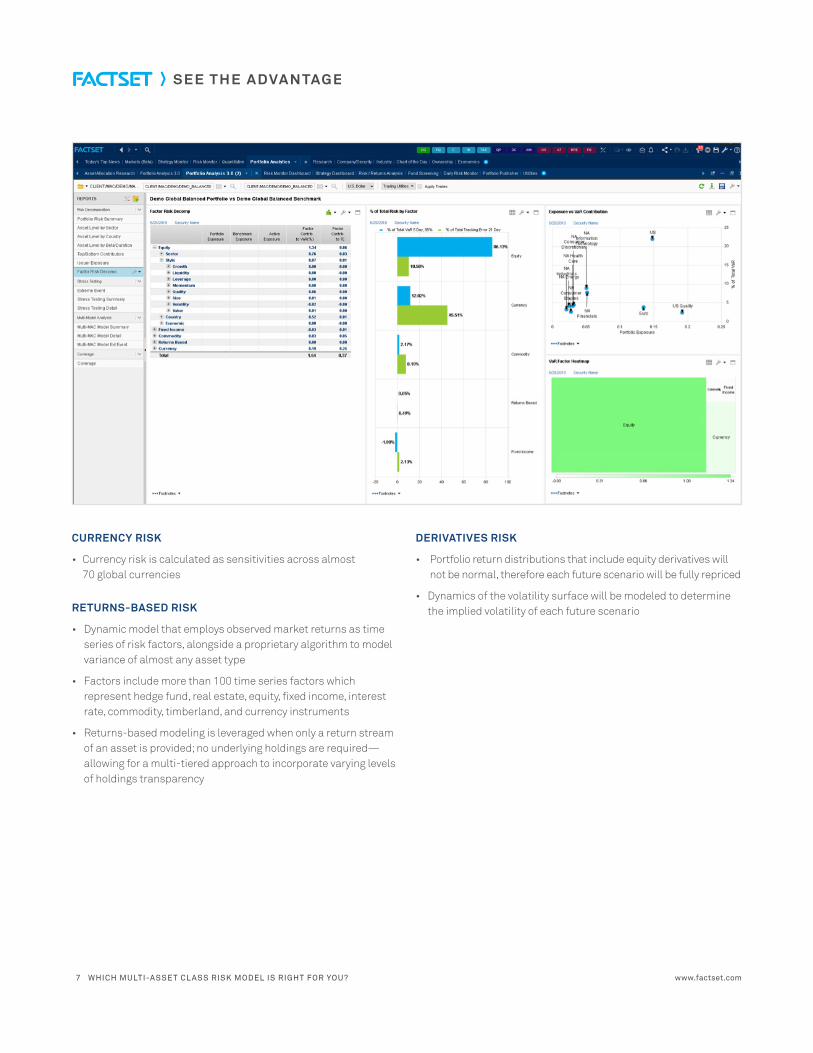
CURRENCY RISK
• Currency risk is calculated as sensitivities across almost 70 global currencies
RETURNS-BASED RISK
• Dynamic model that employs observed market returns as time series of risk factors, alongside a proprietary algorithm to model variance of almost any asset type
• Factors include more than 100 time series factors which represent hedge fund, real estate, equity, fixed income, interest rate, commodity, timberland, and currency instruments
• Returns-based modeling is leveraged when only a return stream of an asset is provided; no underlying holdings are required—allowing for a multi-tiered approach to incorporate varying levels of holdings transparency
DERIVATIVES RISK
• Portfolio return distributions that include equity derivatives will not be normal, therefore each future scenario will be fully repriced
• Dynamics of the volatility surface will be modeled to determine the implied volatility of each future scenario
www.factset.com7 WHICH MULTI-ASSE T CL ASS RISK MODEL IS RIGHT FOR YOU?
APPENDIX
Equity Fundamental Style Factors
• Value: composite of annual dividend yield, annual earnings yield, book to price ratio, and cash flow to price ratio
• Growth: composite of trailing annual earnings growth and forecast one-year earnings growth
• Size: natural log of market capitalization
• Quality: composite of annual return on assets, annual return on equity, and annual cash flow to sales ratio
• Long Momentum: OLS slope of 14 prices at four-week intervals from T-20 back to T-280, normalized by starting price (one-year momentum)
• Liquidity: time-weighted daily trading volume divided by 30-day average daily volume
• Leverage: composite of annual net debt to equity ratio and annual net debt to asset ratio
• Volatility: natural log of annualized standard deviation of daily returns over the last 65 trading days
Interest Rate Factors
• Government Curve: Australia, Brazil, Canada, Chile, China, Colombia, Czech, Denmark, Euro, Hong Kong, Hungary, India, Indonesia, Israel, Japan, Malaysia, Mexico, New Zealand, Nigeria, Norway, Peru, Philippine, Poland, Romania, Russia, Singapore, South Africa, South Korea, Sweden, Switzerland, Taiwan, Thailand, Turkey, UK, U.S.
• Libor Curve: Australia, Canada, Denmark, Euro, Hong Kong, Japan, New Zealand, Norway, Singapore, Sweden, Switzerland, UK
• Muni Curve: U.S.
Spread Factors
• Corporate Credit: uses Merton valuation model, which calculates the probability of default and translates that into a new simulated spread based on the relationship of debt to simulated value of underlying issuer
• Euro-Sovereign: Austria, Luxembourg, Belgium, Finland, France, Greece, Cyprus, Ireland, Italy, Central and Eastern Europe, Netherlands, Portugal, Spain
• MBS/ABS/CMBS: U.S. ABS/CMBS/RMBS, Japanese MBS, Non-U.S. ABS/CMBS
• Inflation Protected: Canada, France, Germany, Italy, Japan, UK, U.S.
• Quasi-Governmental
- Agency: Australia, Canada, Canada in USD, Japan, Northern Europe, Southern Europe, U.S.
- Supranational: AUD, EUR, GBP, USD
• Municipal: Sector, State, Duration, Vega
www.factset.com8 WHICH MULTI-ASSE T CL ASS RISK MODEL IS RIGHT FOR YOU?
FAT-TA IL MULTI-AS SE T CL AS S RISK MODEL
R I S K M O D E L 2
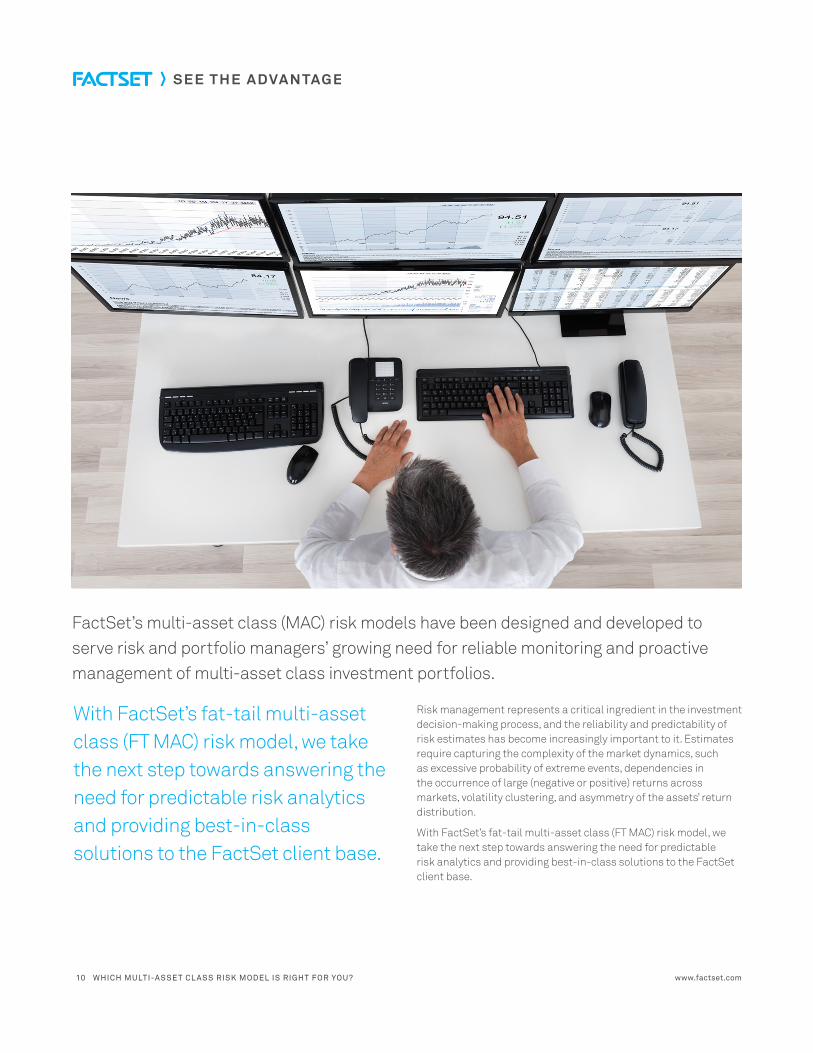
Risk management represents a critical ingredient in the investment decision-making process, and the reliability and predictability of risk estimates has become increasingly important to it. Estimates require capturing the complexity of the market dynamics, such as excessive probability of extreme events, dependencies in the occurrence of large (negative or positive) returns across markets, volatility clustering, and asymmetry of the assets’ return distribution.
With FactSet’s fat-tail multi-asset class (FT MAC) risk model, we take the next step towards answering the need for predictable risk analytics and providing best-in-class solutions to the FactSet client base.
With FactSet’s fat-tail multi-asset class (FT MAC) risk model, we take the next step towards answering the need for predictable risk analytics and providing best-in-class solutions to the FactSet client base.
FactSet’s multi-asset class (MAC) risk models have been designed and developed to serve risk and portfolio managers’ growing need for reliable monitoring and proactive management of multi-asset class investment portfolios.
www.factset.com10 WHICH MULTI-ASSE T CL ASS RISK MODEL IS RIGHT FOR YOU?
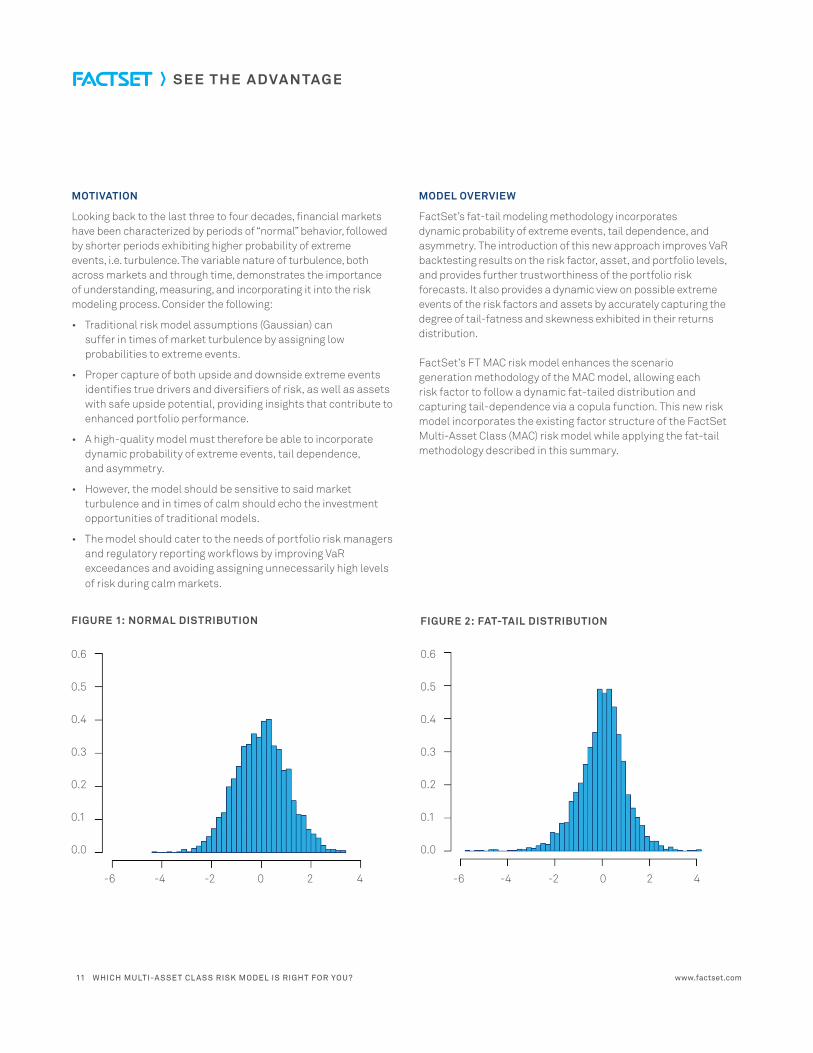
MOTIVATION
Looking back to the last three to four decades, financial markets have been characterized by periods of “normal” behavior, followed by shorter periods exhibiting higher probability of extreme events, i.e. turbulence. The variable nature of turbulence, both across markets and through time, demonstrates the importance of understanding, measuring, and incorporating it into the risk modeling process. Consider the following:
• Traditional risk model assumptions (Gaussian) can suffer in times of market turbulence by assigning low probabilities to extreme events.
• Proper capture of both upside and downside extreme events identifies true drivers and diversifiers of risk, as well as assets with safe upside potential, providing insights that contribute to enhanced portfolio performance.
• A high-quality model must therefore be able to incorporate dynamic probability of extreme events, tail dependence, and asymmetry.
• However, the model should be sensitive to said market turbulence and in times of calm should echo the investment opportunities of traditional models.
• The model should cater to the needs of portfolio risk managers and regulatory reporting workflows by improving VaR exceedances and avoiding assigning unnecessarily high levels of risk during calm markets.
MODEL OVERVIEW
FactSet’s fat-tail modeling methodology incorporates dynamic probability of extreme events, tail dependence, and asymmetry. The introduction of this new approach improves VaR backtesting results on the risk factor, asset, and portfolio levels, and provides further trustworthiness of the portfolio risk forecasts. It also provides a dynamic view on possible extreme events of the risk factors and assets by accurately capturing the degree of tail-fatness and skewness exhibited in their returns distribution. FactSet’s FT MAC risk model enhances the scenario generation methodology of the MAC model, allowing each risk factor to follow a dynamic fat-tailed distribution and capturing tail-dependence via a copula function. This new risk model incorporates the existing factor structure of the FactSet Multi-Asset Class (MAC) risk model while applying the fat-tail methodology described in this summary.
FIGURE 1: NORMAL DISTRIBUTION
0.6
0.5
0.4
0.3
0.2
0.1
0.0
-6 -4 -2 0 2 4
FIGURE 2: FAT-TAIL DISTRIBUTION
-6 -4 -2 0 2 4
0.6
0.5
0.4
0.3
0.2
0.1
0.0
www.factset.com11 WHICH MULTI-ASSE T CL ASS RISK MODEL IS RIGHT FOR YOU?
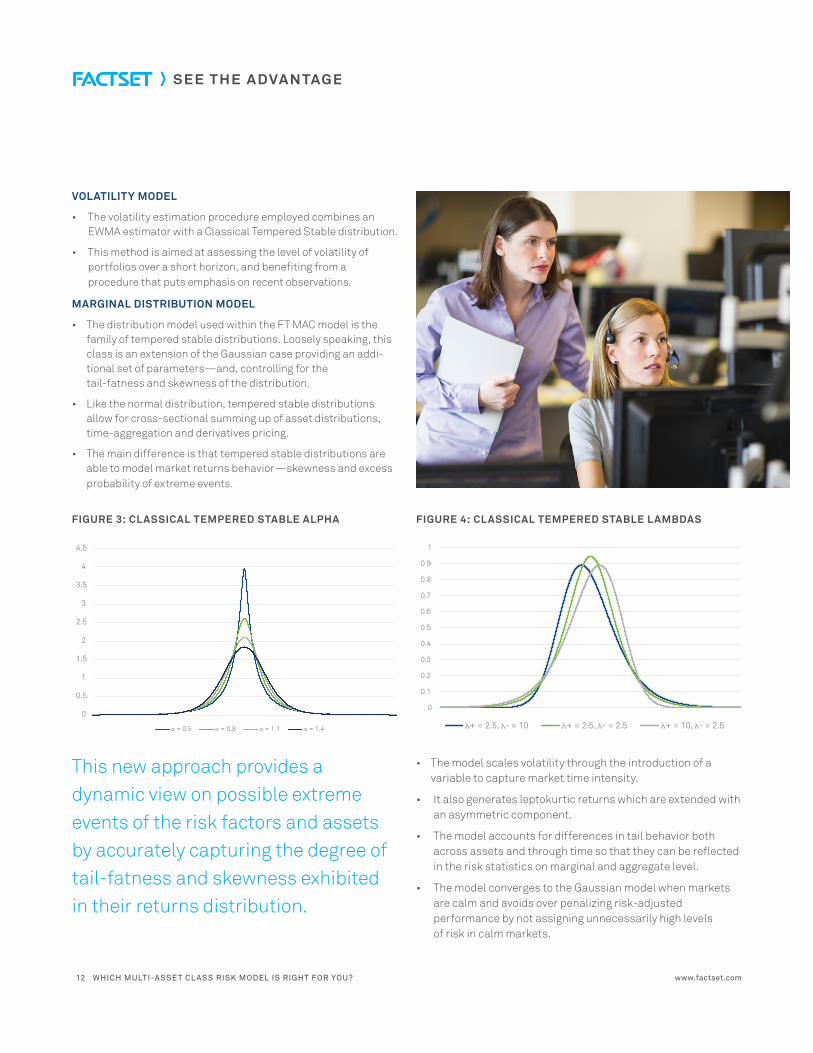
This new approach provides a dynamic view on possible extreme events of the risk factors and assets by accurately capturing the degree of tail-fatness and skewness exhibited in their returns distribution.
• The model scales volatility through the introduction of a variable to capture market time intensity.
• It also generates leptokurtic returns which are extended with an asymmetric component.
• The model accounts for differences in tail behavior both across assets and through time so that they can be reflected in the risk statistics on marginal and aggregate level.
• The model converges to the Gaussian model when markets are calm and avoids over penalizing risk-adjusted performance by not assigning unnecessarily high levels of risk in calm markets.
VOLATILITY MODEL
• The volatility estimation procedure employed combines an EWMA estimator with a Classical Tempered Stable distribution.
• This method is aimed at assessing the level of volatility of portfolios over a short horizon, and benefiting from a procedure that puts emphasis on recent observations.
MARGINAL DISTRIBUTION MODEL
• The distribution model used within the FT MAC model is the family of tempered stable distributions. Loosely speaking, this class is an extension of the Gaussian case providing an addi-tional set of parameters—and, controlling for the tail-fatness and skewness of the distribution.
• Like the normal distribution, tempered stable distributions allow for cross-sectional summing up of asset distributions, time-aggregation and derivatives pricing.
• The main difference is that tempered stable distributions are able to model market returns behavior —skewness and excess probability of extreme events.
FIGURE 3: CLASSICAL TEMPERED STABLE ALPHA FIGURE 4: CLASSICAL TEMPERED STABLE LAMBDAS
0
0.5
1
1.5
2
2.5
3
3.5
4
4.5
α = 0.5 α = 0.8 α = 1.1 α = 1.4
0
0.1
0.2
0.3
0.4
0.5
0.6
0.7
0.8
0.9
1
λ+ = 2.5, λ- = 10 λ+ = 2.5, λ- = 2.5 λ+ = 10, λ- = 2.5
www.factset.com12 WHICH MULTI-ASSE T CL ASS RISK MODEL IS RIGHT FOR YOU?
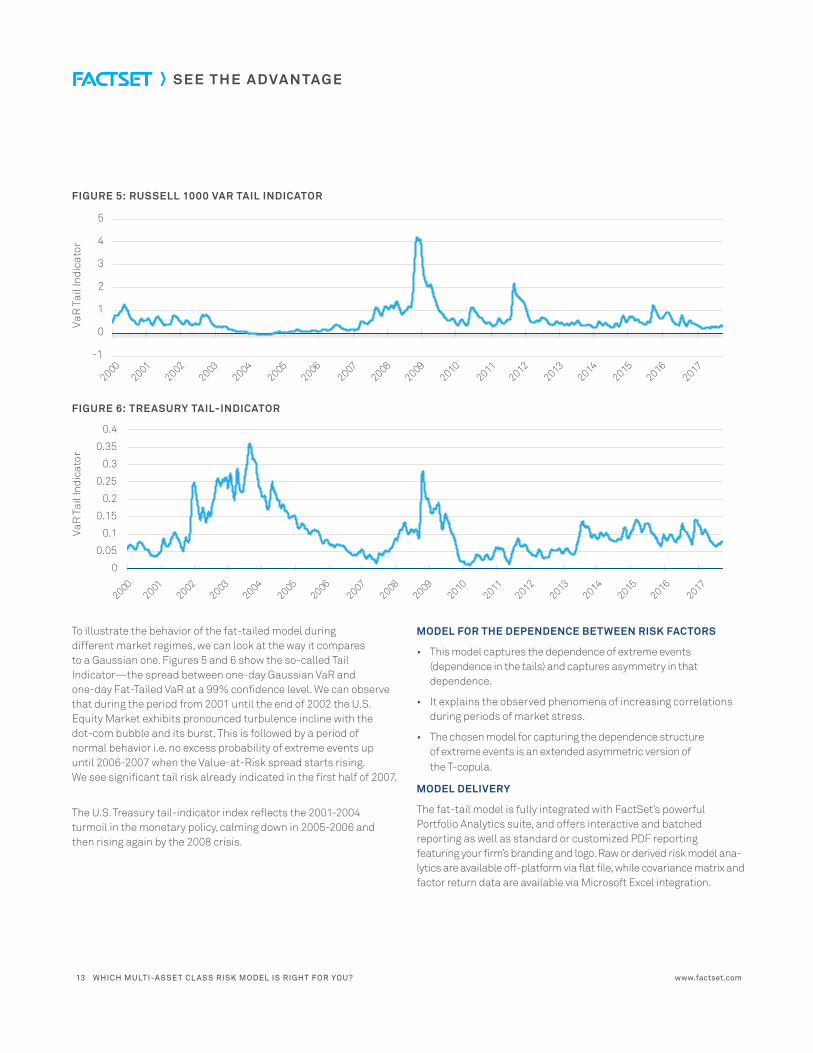
FIGURE 5: RUSSELL 1000 VAR TAIL INDICATOR
FIGURE 6: TREASURY TAIL-INDICATOR
To illustrate the behavior of the fat-tailed model during different market regimes, we can look at the way it compares to a Gaussian one. Figures 5 and 6 show the so-called Tail Indicator—the spread between one-day Gaussian VaR and one-day Fat-Tailed VaR at a 99% confidence level. We can observe that during the period from 2001 until the end of 2002 the U.S. Equity Market exhibits pronounced turbulence incline with the dot-com bubble and its burst. This is followed by a period of normal behavior i.e. no excess probability of extreme events up until 2006-2007 when the Value-at-Risk spread starts rising. We see significant tail risk already indicated in the first half of 2007.
The U.S. Treasury tail-indicator index reflects the 2001-2004 turmoil in the monetary policy, calming down in 2005-2006 and then rising again by the 2008 crisis.
MODEL FOR THE DEPENDENCE BETWEEN RISK FACTORS
• This model captures the dependence of extreme events (dependence in the tails) and captures asymmetry in that dependence.
• It explains the observed phenomena of increasing correlations during periods of market stress.
• The chosen model for capturing the dependence structure of extreme events is an extended asymmetric version of the T-copula.
MODEL DELIVERY
The fat-tail model is fully integrated with FactSet’s powerful Portfolio Analytics suite, and offers interactive and batched reporting as well as standard or customized PDF reporting featuring your firm’s branding and logo. Raw or derived risk model ana-lytics are available off-platform via flat file, while covariance matrix and factor return data are available via Microsoft Excel integration.
-1
0
1
2
3
4
5
VaR
Tai
l Ind
icat
or
0
0.05
0.1
0.15
0.2
0.25
0.3
0.35
0.4
VaR
Tai
l Ind
icat
or
www.factset.com13 WHICH MULTI-ASSE T CL ASS RISK MODEL IS RIGHT FOR YOU?
GLOB A L LINE A R MULTI-AS SE T CL AS S RISK MODEL
R I S K M O D E L 3

FactSet’s global linear multi-asset class risk model is based on a set of factor models that cover global markets, and allows for calculation of various risk statistics, such as Tracking Error Volatility (TEV), Value-at-Risk (VaR), and Expected Tail Loss (ETL). The model allows you to analyze the interplay of multiple asset classes on any portfolio with small contributions from other markets. You can also conduct portfolio stress test scenarios driven by other market factors.
MODEL OVERVIEWThe full model is based on risk factors that span equity, fixed income, commodity, and returns-based assets. Factors unique to each asset class are used to identify and calculate the risk of each security, while maintaining interactions across asset classes via a full cross-asset class covariance matrix.
Asset Coverage
• Over three million global bonds
• Over 50,000 global equities
• Over 250 highly liquid commodity indices, continuous front-month futures contracts, commodity ETFs, and mutual funds
• 150 currencies
• Alternative assets including private equity, hedge funds, and real estate
• Returns-based assets
LINEAR MAC
F I X ED IN C O ME
EQ U I T Y
RETURNS-BASED ASSETS
COMMODIT Y
Calculate various risk statistics, analyze the interplay of multiple asset classes on any portfolio, and conduct portfolio stress test scenarios with FactSet’s global linear multi-asset class risk model.
www.factset.com15 WHICH MULTI-ASSE T CL ASS RISK MODEL IS RIGHT FOR YOU?
Covariance ConstructionThe framework employs a classical, exponentially weighted moving average (EWMA) method of covariance matrix estimation. The default Calibration uses full available history with a six-month half-life, while additional models that use a one-year half-life (medium decay) and no half-life (no decay) are also available. The framework features a true cross-asset covariance matrix, which captures interactions across asset classes.
Forecast HorizonThe methodology is designed as a one-month horizon model, scaling the returns distribution variance with time to calculate alternative horizons. Standard risk measures are displayed in annualized terms.
Risk MeasuresCalculation assumes all risk factors are jointly normally distributed, allowing the use of simple analytical formulas to compute the parameters of the portfolio return distribution. These parameters are then easily converted into portfolio risk measures such as TEV, VaR, ETL, and their components. Full factor-, group-, and asset-level decomposition is available for portfolio risk measures, and extreme event and factor stress testing is available, again with full decomposition. Stress testing includes pre-defined or fully customizable tests that leverage FactSet’s robust, accurate market data. Extreme events can be run on any historical period within the risk model history or can be customized based on user-defined market shocks.
Model Delivery The global linear multi-asset class risk model is fully integrated with FactSet’s powerful Portfolio Analytics suite, and offers interactive and batched reporting as well as standard or customized PDF reporting featuring your firm’s branding and logo. Raw or derived risk model analytics are available off platform via flat file, while covariance matrix and factor return data are available via Microsoft Excel integration.
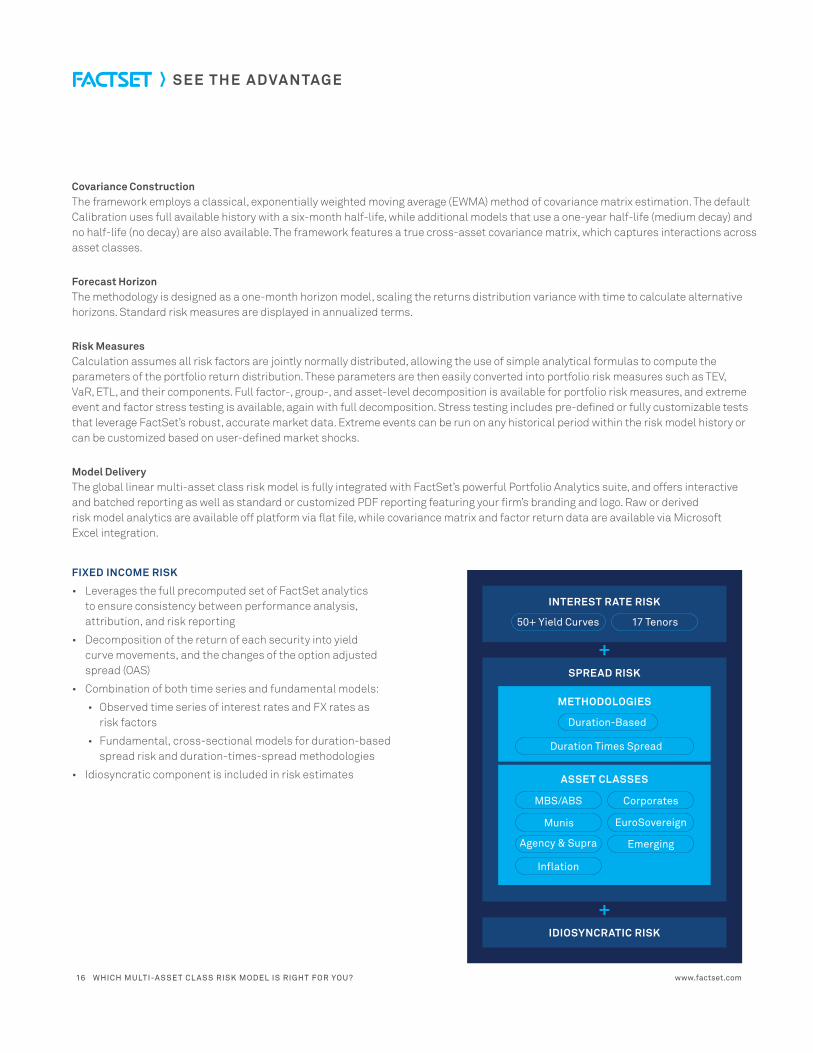
FIXED INCOME RISK
• Leverages the full precomputed set of FactSet analytics to ensure consistency between performance analysis, attribution, and risk reporting
• Decomposition of the return of each security into yield curve movements, and the changes of the option adjusted spread (OAS)
• Combination of both time series and fundamental models:
• Observed time series of interest rates and FX rates as risk factors
• Fundamental, cross-sectional models for duration-based spread risk and duration-times-spread methodologies
• Idiosyncratic component is included in risk estimates
INTEREST RATE RISK
+
+
IDIOSYNCRATIC RISK
SPREAD RISK
ASSET CLASSES
MBS/ABS Corporates
Munis EuroSovereign
Agency & Supra Emerging
Inflation
METHODOLOGIES
Duration-Based
Duration Times Spread
50+ Yield Curves 17 Tenors
www.factset.com16 WHICH MULTI-ASSE T CL ASS RISK MODEL IS RIGHT FOR YOU?

EQUITY RISK
• Combines both cross-sectional and time series regression to maximize explanatory power
• Leverages a multiple stepwise regression with priors, on a stock-by-stock basis, to calculate stock sensitivities
• Permits application of Bayesian priors and statistical significance tests to determine relevant factors for each stock
• Factor structure is comprised of five major factor blocks:
• Currency factors
• Region-specific fundamental style factors
• Region/Country factors
• Industry factors based on GICS classification
• Macroeconomic factors
COMMODITY RISK
• Hybrid factor-based model designed to capture systematic risk from exposures to factors common across all com-modities, as well as idiosyncratic risk specific to individual commodities
• Factors include five cross-sectional momentum factors and ten time-series factors based on market drivers
CURRENCY RISK
• Currency risk is calculated as sensitivities across major global currencies
RETURNS-BASED RISK
• Model spans 100+ risk factors for granularity across markets
• Returns based risk factors include equity, fixed income, interest rates, alternative investments, commodities and currency
www.factset.com17 WHICH MULTI-ASSE T CL ASS RISK MODEL IS RIGHT FOR YOU?
APPENDIX
Interest Rate Factors
• Government Curve: Australia, Brazil, Canada, Chile, China, Colombia, Czech, Denmark, Euro, Hong Kong, Hungary, India, Indonesia, Israel, Japan, Malaysia, Mexico, New Zealand, Nigeria, Norway, Peru, Philippine, Poland, Romania, Russia, Singapore, South Africa, South Korea, Sweden, Switzerland, Taiwan, Thailand, Turkey, UK, U.S.
• Libor Curve: Australia, Canada, Denmark, Euro, Hong Kong, Japan, New Zealand, Norway, Singapore, Sweden, Switzerland, UK
• Muni Curve: U.S.
Spread Model Factors
• Corporate: AUD, CAD, CHF, EUR, GBP, JPY, KRW, MYR, NOK, NZD, SEK, SGD, USD
• Euro-Sovereign: Austria, Luxembourg, Belgium, Finland, France, Greece, Cyprus, Ireland, Italy, Latvia, Lithuania, Slovenia, Slovakia, Netherlands, Portugal, Spain
• Emerging Markets: Africa, Americas, Asia, Brazil - Corporate, Brazil - Sovereign, Chile, China, Colombia, Eastern Europe, Indonesia, Israel, Malaysia, Mexico, Middle East, Peru, Philippines, Russia, South Africa, Turkey - Corporate, Turkey - Sovereign, UAE - Corporate, UAE - Sovereign, Venezuela
• MBS/ABS/CMBS: US ABS/CMBS/RMBS, Japanese MBS, Non-US ABS/CMBS
• Inflation Protected: Canada, France, Germany, Italy, Japan, UK, U.S.
• Quasi-Governmental • Agency: Australia, Canada, Canada in USD, Japan, Northern Europe, Southern Europe, U.S. • Supranational: AUD, EUR, GBP, USD
• Muni: AA, A, BBB, Sector Equity Fundamental Style Factors
• Value: Composite of annual dividend yield, annual earnings yield, book to price ratio, and cash flow to price ratio
• Growth: Composite of trailing annual earnings growth and forecast one-year earnings growth
• Size: Natural log of market capitalization
• Quality: Composite of annual return on assets, annual return on equity, and annual cash flow to sales ratio
• Long Momentum: OLS slope of 14 prices at four-week intervals from T-20 back to T-280, normalized by starting price (one-year momentum)
• Liquidity: Time-weighted daily trading volume divided by 30-day average daily volume
• Leverage: Composite of annual net debt to equity ratio and annual net debt to asset ratio
• Volatility: Natural log of annualized standard deviation of daily returns over the last 65 trading days
www.factset.com18 WHICH MULTI-ASSE T CL ASS RISK MODEL IS RIGHT FOR YOU?

FactSet (NYSE:FDS | NASDAQ:FDS) delivers superior content, analytics, and flexible technology to help more than 128,000 users see and seize opportunity sooner. We give investment professionals the edge to outperform with informed insights, workflow solutions across the portfolio lifecycle, and industry-leading support from dedicated specialists. We’re proud to have been recognized with multiple awards for our analytical and data-driven solutions and repeatedly ranked as one of Fortune’s 100 Best Companies to Work For® and a Best Workplace in the United Kingdom and France. Subscribe to our thought leadership blog to get fresh insight delivered daily at insight.factset.com. Learn more at www.factset.com and follow us on Twitter: www.twitter.com/factset.
www.factset.com
The approaches described throughout this guide are further detailed in our full white papers. To request your copies, contact [email protected].


