Which tools to monitor HIV treatment in resource-limited settings? Pierre-Marie Girard Hôpital St Antoine Institut de Médecine et d’Epidémiologie Appliquée, Fondation Internationale Léon Mba Paris, France
Transcript
Which tools to monitor HIV
treatment in resource-limited
settings?
Pierre-Marie Girard
Hôpital St Antoine
Institut de Médecine et d’Epidémiologie Appliquée,
Fondation Internationale Léon Mba
Paris, France
« ARV therapy in sub saharan Africa : • Complicated combination regimens• Expensive and dangerous• Severe side effects• Rapid development of drug resistance in the
community»
Lancet, 2002
There is no excuse for There is no excuse for delay !!!!delay !!!!
7.1 Source: UNAIDS & WHO unpublished estimates, 2007
Huge international fundings are
critical
but are not enough…
Critical Actions to improve access and success of ARV programs
• Diagnose HIV infection at much larger scale• Better utilization of scarce human resources• Make available the best drugs (not only the
cheaper ones)• Extend access to Lab facilities• In the meantime, revisit and adapt to local
settings the monitoring of therapy• Monitor (population level) the positive impact or
ARVs and their risks• Ensure durability of the programs.
Critical Actions to improve access and success of ARV programs
• Diagnose HIV infection at much larger scale• Better utilization of scarce human resources• Make available the best drugs (not only the
cheaper ones)• Extend access to Lab facilities• Meantime revisit and adapt to local settings
the monitoring of therapy• Monitor (population level) the positive impact or
ARVs and their risks• Ensure durability of the programs.
Diagnose HIV infection at much larger scale
• Performance and availability of tests are no more an issue
• Issue N°1: POLICY of HIV tests proposal• We must get out of the « HIV exceptionalism »
(Ron Bayer) • We must do it with respect of ethics,
confidentiality, and incorporating preventionissues.
• No testing without free clinical and biologicalevaluation of HIV stage and screening of comorbidities
Projection for HIV care visits in Western Kenya, Cohen et al, AIDS, 2004
Critical Actions to improve access and success of ARV programs
• Diagnose HIV infection at much larger scale• Better utilization of scarce human resources• Make available the best drugs (not only the
cheaper ones)• Extend access to Lab facilities• Meantime revisit and adapt to local settings the
monitoring of therapy• Monitor (population level) the positive impact or
ARVs and their risks• Ensure durability of the programs.
Lyell syndrome : Triomune® D8
Eholié S, Abidjan
Eholié S, Abidjan
Lipodystrophy : Triomune® M12
t
Egger, 2007
Treatment change(any change, including switching,
substitution)
Months after starting ART
0 6 12 18 24
% w
ithtr
eatm
entc
hang
e
0
20
40
60
Switzerland
South Africa
CROI 2007 – response – 26
Switch
Switch
Consider Switch
ConsiderSwitch
Immunologic and Virologic Failure
(CD4 and VL available)
Immunologic Failure(VL not available)
Clinical Failure(CD4 and VL not available)
SwitchConsider Switch3
SwitchSwitch
4
Do Not SwitchN/A2
Do Not SwitchN/A1
WHO Clinical Staging
When to Switch from 1st Line to 2nd Line ARV Regimens for Treatment Failure
Clinical failure is defined as a occurrence of new or recurrent WHO clinical stage 3 or 4 event (excluding IRIS).
CD4 failure is defined as a fall to (or below) the pre-treatment baseline or a 50% drop from the on-treatment peak level or persistent levels < 100 cells/mm3.
Virological failure is provisionally defined as a plasma HIV-1 RNA level >10,000 copies/ml after a minimum of 6 months on therapy.
Plasma HIV-1 RNA level >10,000 copies/ml e
Virologicalfailure
•Fall of CD4 count to pre-therapy baseline (or below) or•50% fall from the on-treatment peak value (if known) or•Persistent CD4 levels < 100 cells/mm3 d
CD4 cell failure c
Occurrence of new or recurrent WHO stage 3 or 4 condition a b
Clinical failure
Clinical, CD4 Cell Count, and Virological Definitions of Treatment Failure for Patients on a First-Line Antiretroviral Regimen for at Least Six Months
Immunological Failure
CD4
Mo 6 Month12
100
Drop > 50 %
Back to baseline
Stay < 100
Messou E, Bull WHO 2008
Messou E, Bull WHO 2008
Second Line ARV in adults and children
96% 99%
4% 1%0%
10%
20%
30%
40%
50%
60%
70%
80%
90%
100%
Adults Pediatric
% p
atie
nts
Renaud-Théry F, AIDS 2007
Extend access to Lab facilities
• Plasma Viral load measurements are the gold standard for assessing Antiretroviral activity.
• Its value assessed in 90’s firstly as a predictor of HIV clinical course then for early ARV failures
• Sensitivity has improved step-by-step starting from a threshold at 10 000 copies/ml to 40 copies/ml currently.
• Reproducibility is good.• Simplification of techniques less impressive than sensitivity
increase.• Access for PATIENT INDIVIDUAL MONITORING remains
exceptional in most Developing countries settings.
Cumulative proportion of patients needing 2nd Line ARV
Switch to 2d Line: mean 3% per year
5%6%
9%
12%
16%
0%
2%
4%
6%
8%
10%
12%
14%
16%
18%
2006 2007 2008 2009 2010
Renaud-Théry F, AIDS 2007
Low performance of WHO criteria for the diagnosis of virological failure
Performance of WHO criteria for Viral failure, Niger ia, « PEPFAR »
40%(34-46)
76%570-82°
59% (48-69)
59%(55-64)
CD4 down 50% from peak value
(n = 219)
42%
537-46°
81%
(74-87)
75%
(66-82)
50%
(46-54)
CD4 < 100 cells/mm3
(n = 233)
59%
(52-65)
64%
(48-78)
80%
(29-48)
39%
(29-48)
CD4 < pre-therapyCD4 (n = 86)
Negativepredictive
value (95% CI)
Positive predictive
value (95% CI)
Specificity(95% CI)
Sensitivity(95% CI)
CD4 criteria(WHO, 2006)
Etiebet MA et al, 16th CROI, 2009
Prices and regimen change in USD
3 000
2 250
Low income Lower Middle income
1 500
750
9191
3 750
132132469469
11391139554554
36203620
X13 X13
X27 X27
D4T/3TC/NVP – 1st line
TDF/FTC/EFV – substitute ABC/ddI/LPVr – 2nd line
Source: WHO HIV Département, AIDS Medicines & Diagno stics Service, Global Price Reporting Mechanism, 2008
WHO criteria for « virological failure »:poor performance
• Assess surrogate markers for virological failure
Any Other Options ?
• CD4 count:– Dynabeats method: Immuoflorescence, good correlation
with FacsCount but not so cheap, and poorly acceptedby technicinas
– Microfluid device for CD4 counting– Portable device for CD4 counting – Total Lymphocyte (only for indication of HAART)
• HIV viral load– The SAMBA project (MRC/MSF)
SAMBA Project
• Semi-quantitative viral load test:– Early diagnosis in newborns– Monitoring of HAART: indication for switching to 2nd line
therapy
• Principles:– Sample preparation– Amplification of DNA (using a small car-battery-
operated heating block about the size of a credit card)– Detection of amplified DNA (via a dipstick)
Closed system
SAMBA Project
Test characteristics:
1. Can detect <1000 virus particles/ml blood 2. Will provide a semi-quantitative or a qualitative resultin < 2 hrs3. Has simple visual readout4.~$6-8/test5.Robust6.Will detect all HIV1 subtypes7.No external water, cold chain or expensive machines need8. No accurate pipetting or centrifugation steps; can be
done by minimally trained staff
PLOS Editorial Comments
Systematic review of 13 publications
Objectives of ARV therapy Programs
• Reducing morbidity and mortality• Curbing the HIV epidemic• Maintaining economic stability• Achieving distributive justice
Am. J Public Am. J Public HealthHealth, 2005, 7, 1117, 2005, 7, 1117--11221122
Proposal for a New Program based Strategy
• Immediate planning of First and Second Line ARV drug supply
• Program Evaluation: principles of Mass therapy• Simple schemes for community level HIV
treatment• A plan for adherence monitoring• ARV therapy deliverers as primary care
deliverers
Am. J Public Am. J Public HealthHealth, 2005, 7, 1117, 2005, 7, 1117--11221122
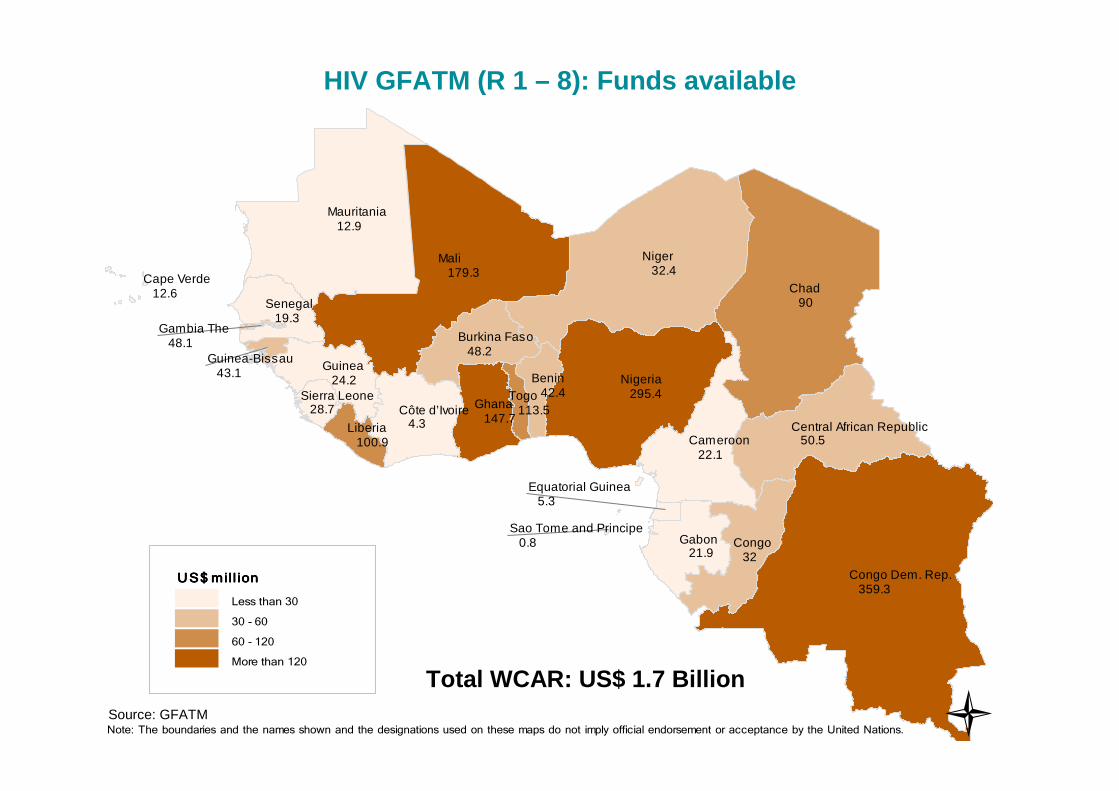
HIV GFATM (R 1 – 8): Funds available
Total WCAR: US$ 1.7 BillionSource: GFATM �
Benin 42.4
Burkina Faso 48.2
Central African Republic 50.5
Côte d’Ivoire 4.3
Cameroon 22.1
Congo Dem. Rep. 359.3
Congo 32
Cape Verde 12.6
Gabon 21.9
Ghana 147.7
Guinea 24.2
Gambia The 48.1
Guinea-Bissau 43.1
Equatorial Guinea 5.3
Liberia 100.9
Mali 179.3
Mauritania 12.9
Niger 32.4
Nigeria 295.4
Senegal 19.3
Sierra Leone 28.7
Sao Tome and Principe 0.8
Chad 90
Togo 113.5
US$ mill ion US$ mill ion US$ mill ion US$ mill ion
Less than 30
30 - 60
60 - 120
More than 120
Note: The boundaries and the names shown and the designations used on these maps do not imply official endorsement or acceptance by the United Nations.