White-Box Testing of Service Compositions Via Event Interfaces Chunyang Ye University of Toronto Toronto, Canada [email protected]Hans-Arno Jacobsen University of Toronto Toronto, Canada [email protected]ABSTRACT Service-oriented applications are usually composed of ser- vices from different organizations. To protect the business interests of service providers, the implementation details of services are usually invisible to service consumers. This makes it challenging to white-box test service-oriented ap- plications because of the difficulty to determine accurately the test coverage of a service composition as a whole and the difficulty to design test cases effectively. To address this problem, we propose an approach to white-box test service compositions based on events exposed by services. By deriving event interfaces to explore test coverage infor- mation from service implementations, our approach allows service consumers to determine accurately test coverage dur- ing testing based on events exposed by services at runtime. We also develop an approach to design test cases effectively based on services’ event interfaces. The experimental re- sults show that our approach outperforms existing testing approaches for service compositions with 35% more test cov- erage rate, 19% more fault-detection rate and 80% fewer test cases needed. Categories and Subject Descriptors D.2.5 [Software Engineering]: Testing and Debugging— Testing tools General Terms Measurement, Reliability, Verification Keywords Web service composition, white-box testing, event interface 1. INTRODUCTION The service-oriented architecture (SOA) paradigm is a widely adopted set of software engineering principles to help manage the complexity of software development for distributed enterprise applications [5, 11]. In this paradigm, service providers develop reusable software components, publish them as Web services, and register them in service registries. By composing selected services from registries, service consumers develop composite SOA applications across distributed, het- erogeneous and autonomous organizations [15, 29]. To guarantee the quality of SOA applications, integration testing of service compositions is required before the appli- cations are released. Testing is a challenging task, espe- cially, when an SOA application integrates third-party ser- vices from different organizations. On the one hand, white- box testing of a service composition requires implementation details of every third-party service involved in the composi- tion to be available [5, 17, 20]. However, for business reasons or privacy concerns, service implementation details must of- ten remain hidden from service consumers. On the other hand, black-box testing [14, 22] requires no implementation details of services to become visible but suffers from the lim- itation that service consumers have little confidence on how well a service composition has been covered in testing [31]. To address this dilemma, Bartolini et al. proposed an ap- proach which requires a service provider to report coverage information for its services to service consumers for testing purposes, such as the percentage of code paths covered, in- stead of revealing the services’ implementation [1]. Based on the coverage information reported and the given cover- age criteria, service consumers can estimate how well the involved services have been tested. However, we observe that it is still difficult to apply this approach to a service composition involving more than one third-party service. There are two reasons for this (1) the inability to accurately determine test coverage as a whole and (2) the difficulty of effectively designing test cases. First, although a service consumer can obtain the coverage percentage of every third-party service involved in a service composition under test, the service consumer is still unable to accurately determine how well the composition as a whole has been tested. For example, as illustrated in Fig. 1, a manufacturer com- poses two third-party item supplier services to a manufac- turer service. Each item supplier employs two different ways to produce items. Let us consider the following scenario: Suppose the first two test cases cover the two paths b1, b2, b3, c1, c2, c3 and b1, b4, b5, c1, c4, c5, respectively. Accord- ing to the solution proposed in [1], the manufacturer then stops the testing and releases the service composition since all the involved services in Fig. 1 report 100% path coverage. However, the composition is not adequately tested because two other scenarios (i.e., paths b1, b2, b3, c1, c4, c5 and b1, b4, b5, c1, c2, c3) are not covered by this testing. More- over, even with more test cases, the manufacturer still can- not determine whether all the scenarios are covered because all third-party services report 100% coverage. As a result, Service 1 Service 2 Manufacture Service a 1 a 2 a 3 a 4 a 5 a 6 b 1 b 4 b 2 b 3 b 5 c 1 c 4 c 2 c 3 c 5 Figure 1: Coverage of a service composition.
Transcript
White-Box Testing of Service CompositionsVia Event Interfaces
ABSTRACTService-oriented applications are usually composed of ser-vices from different organizations. To protect the businessinterests of service providers, the implementation details ofservices are usually invisible to service consumers. Thismakes it challenging to white-box test service-oriented ap-plications because of the difficulty to determine accuratelythe test coverage of a service composition as a whole andthe difficulty to design test cases effectively. To addressthis problem, we propose an approach to white-box testservice compositions based on events exposed by services.By deriving event interfaces to explore test coverage infor-mation from service implementations, our approach allowsservice consumers to determine accurately test coverage dur-ing testing based on events exposed by services at runtime.We also develop an approach to design test cases effectivelybased on services’ event interfaces. The experimental re-sults show that our approach outperforms existing testingapproaches for service compositions with 35% more test cov-erage rate, 19% more fault-detection rate and 80% fewer testcases needed.
Categories and Subject DescriptorsD.2.5 [Software Engineering]: Testing and Debugging—Testing tools
General TermsMeasurement, Reliability, Verification
KeywordsWeb service composition, white-box testing, event interface
1. INTRODUCTIONThe service-oriented architecture (SOA) paradigm is a
widely adopted set of software engineering principles to helpmanage the complexity of software development for distributedenterprise applications [5, 11]. In this paradigm, serviceproviders develop reusable software components, publish themas Web services, and register them in service registries. Bycomposing selected services from registries, service consumersdevelop composite SOA applications across distributed, het-erogeneous and autonomous organizations [15, 29].
To guarantee the quality of SOA applications, integrationtesting of service compositions is required before the appli-cations are released. Testing is a challenging task, espe-cially, when an SOA application integrates third-party ser-vices from different organizations. On the one hand, white-box testing of a service composition requires implementationdetails of every third-party service involved in the composi-tion to be available [5, 17, 20]. However, for business reasons
or privacy concerns, service implementation details must of-ten remain hidden from service consumers. On the otherhand, black-box testing [14, 22] requires no implementationdetails of services to become visible but suffers from the lim-itation that service consumers have little confidence on howwell a service composition has been covered in testing [31].
To address this dilemma, Bartolini et al. proposed an ap-proach which requires a service provider to report coverageinformation for its services to service consumers for testingpurposes, such as the percentage of code paths covered, in-stead of revealing the services’ implementation [1]. Basedon the coverage information reported and the given cover-age criteria, service consumers can estimate how well theinvolved services have been tested.
However, we observe that it is still difficult to apply thisapproach to a service composition involving more than onethird-party service. There are two reasons for this (1) theinability to accurately determine test coverage as a wholeand (2) the difficulty of effectively designing test cases.
First, although a service consumer can obtain the coveragepercentage of every third-party service involved in a servicecomposition under test, the service consumer is still unableto accurately determine how well the composition as a wholehas been tested.
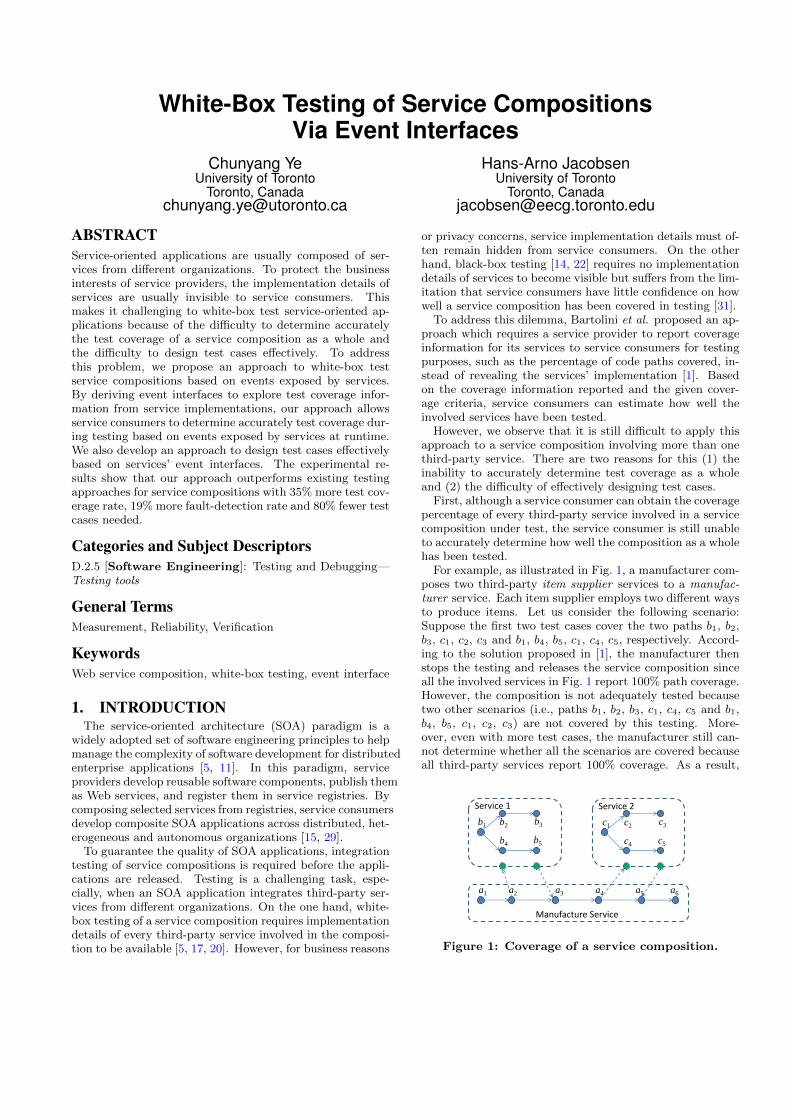
For example, as illustrated in Fig. 1, a manufacturer com-poses two third-party item supplier services to a manufac-turer service. Each item supplier employs two different waysto produce items. Let us consider the following scenario:Suppose the first two test cases cover the two paths b1, b2,b3, c1, c2, c3 and b1, b4, b5, c1, c4, c5, respectively. Accord-ing to the solution proposed in [1], the manufacturer thenstops the testing and releases the service composition sinceall the involved services in Fig. 1 report 100% path coverage.However, the composition is not adequately tested becausetwo other scenarios (i.e., paths b1, b2, b3, c1, c4, c5 and b1,b4, b5, c1, c2, c3) are not covered by this testing. More-over, even with more test cases, the manufacturer still can-not determine whether all the scenarios are covered becauseall third-party services report 100% coverage. As a result,
Service 1 Service 2
Manufacture Service
a1 a2 a3 a4 a5 a6
b1
b4
b2 b3
b5
c1
c4
c2 c3
c5
Figure 1: Coverage of a service composition.
faults in untested scenarios are left undetected (e.g., itemsproduced via path b1, b2, b3 may turn out to be inconsistentwith items produced via path c1, c4, c5).
Second, it is difficult for a service consumer to effectivelydesign test cases to cover a service composition because ofpossible dependencies among services.
For example, suppose Service 2 in Fig. 1 executes the pathc1, c4, c5 if and only if Service 1 executes the path b1, b4, b5in the composition. The test cases designed to cover path c1,c4, c5 in Service 2 will not work if Service 1 executes the pathb1, b2, b3 under these test cases. A dependency relationshipsuch as this cannot be derived from the reported coveragepercentages of Service 1 and 2 (as neither service has therequired information). As a result, service consumers mayneed to try a large number of test cases to cover all possiblescenarios, resulting in a significantly increased testing effort.
Therefore, reporting only the coverage percentage of eachthird-party service for testing is not enough. This motivatedus to explore what other information services could reveal fortesting while keeping their implementation details invisiblefrom service consumers.
To address this concern, in this paper, we explore thepotential of allowing services to expose events to supportwhite-box testing of service compositions. In our approach,instead of reporting the coverage percentage, each serviceprovider is required to provide service consumers with anevent interface derived from the service implementation atdesign time. The event interface encapsulates and revealsselected service internal state changes as events at runtime.
For example, Service 1 in Fig. 1 may declare an evente1 to reveal the status change of task b2 (i.e., from “non-committed” to “committed”) inside the service. Similarly,another event e2 can be defined to reveal status changes ofb4. These events are correlated in the event interface torepresent different executions of the service (e.g., e1 and e2represents two different paths of Service 1). During test-ing, events exposed by third-party services are propagatedto service consumers, who can then make use of them to de-termine test coverage of a service composition and effectivelyderive test cases.
There are two main challenges with this approach: (1) howto encapsulate and expose only the necessary events froma large number of events generated by services at runtimeto hide the service implementation details; and (2) how tocorrelate events from different services to reason about thecoverage of a service composition as a whole.
These challenges are addressed in this paper with a four-fold contribution: First, we propose a novel approach towhite-box test Web service compositions involving more thanone third-party service via events exposed from services.Next, we develop a model to derive event interfaces fromservice implementations. We prove that the test coveragederived based on event interfaces is equivalent to real cov-erage of service compositions under test. This allows ser-vice consumers to determine the test coverage of a servicecomposition without revealing the implementation of eachinvolved third-party service. Third, we propose algorithmsto effectively derive test cases based on event interfaces toreduce the number of test cases needed. Finally, we per-form a detailed experimental evaluation. The results showthat our approach achieves a 35% increase in test coverageand detects 19% more faults than the approach proposedby Bartolini et al. [1], and requires 80% fewer test cases on
average than the random testing approach [19].The rest of this paper is organized as follows: Section 2
reviews related work on service testing. Section 3 introducesour approach and methodology. Section 4 evaluates our ap-proach empirically and Section 5 discusses some limitations.
2. RELATED WORKIn this section, we review related work in the areas of
service testing and service interfaces.Service Testing. Service Testing has become an active
area of research in the software engineering community andhas attracted much attention in recent years [1, 5, 17, 20,21]. Existing approaches can be classified into two maincategories based on the roles involved in testing services:(1) from the perspective of service providers and (2) fromthe perspective of service consumers.
From the perspective of service providers, services need tobe tested to conform to quality standards prior to release.Service providers usually have all the implementation detailsof their services (or partial details if third-party services areintegrated to implement their services). Therefore, serviceproviders can white-box test their services. For example, Liet al. [16, 30] proposed a framework to organize unit testsand generate test cases based on a search of BPEL flowgraphs and constraint solving techniques. Mei et al. [20, 21]proposed a data flow approach to detect faults introducedby XML and XPath based on XPath rewriting. These ap-proaches however are inadequate to white-box test a servicecomposition involving third-party services because the im-plementations of third-party services are usually hidden.
Service consumers, on the other hand, need to know whe-ther the selected third-party services work correctly whencomposed together to form new applications, even thougheach service has been tested individually by each serviceprovider. Black-box testing approaches are often applieddue to unavailable implementations of third-party services.Kaschner [14] proposed an automatic approach to design testcases for black-box testing of services based on their busi-ness protocols. Bartolini et al. [3] proposed a model-basedapproach to generate testbeds to replace services for testingfrom service consumers. Mei et al. [22] proposed an approachto help service consumers prioritize test case selection for re-gression testing based on the coverage of WSDL tags of thetested service. These approaches can help service consumersto detect faults in a service composition. The limitation isthat it is unclear to service consumers how adequately aservice composition as a whole has been tested.
To gain confidence about how well a service compositionhas been tested, service consumers need to whiten SOA test-ing for service compositions. Li et al. [17] suggested thatservice providers design test cases based on their BPEL pro-cesses and provide the test cases to service consumers. Thelimitation is that service providers cannot anticipate all pos-sible composition scenarios. Bartolini et al. [1] proposed toinstrument each service with an intermediate service whichprovides coverage feedback for each third-party service toservice consumers during testing. However, the coveragepercentage provided by such an approach can not be usedto derive how adequately a whole service composition hasbeen tested. Moreover, this approach does not address howto design test cases based on the feedback. We view this asa non-trivial step. Our approach addresses these two issuesthrough the novel concept of event exposure from services
that we developed. By observing events and matching themto feasible observations constructed from event interfaces,service consumers can determine the test coverage of a ser-vice composition as a whole. Test cases can also be designedeffectively based on event interfaces, as we demonstrate.
Testing Equivalence of Processes. Much research hasalso been devoted to conformance testing of service specifi-cations and their implementations. For example, Nicola etal. [23] studied the equivalence relationship between pro-cesses based on a set of tests. Bentakouk et al. [2] proposedto test the conformance between service orchestration speci-fications and their implementations with symbolic executiontechniques. Tretmans [26] defined a test equivalence rela-tionship between asynchronous input/output automata andthe underlying synchronous labeled transition systems.
Our work also defines an equivalence relationship betweenthe event interface and the service implementation. Thedifference is that existing work does conformance testing ofservice specification and implementation, whereas our ap-proach determines the test coverage for white-box testing.Even though two processes are equivalent in terms of confor-mance testing, the test cases designed based on one processmay not cover the same paths in the other process.
Service Interface. Often, the implementation details ofa service are invisible to service consumers except for ac-cess to restricted service interfaces. Many researchers havestudied how to enrich service interfaces to facilitate a ser-vice composition. Beyer et al. [4] proposed to specify con-straints in Web service interfaces to define correctness re-quirements of a service. Alfaro and Henzinger [8] proposedto describe interfaces as automata to capture temporal as-pects of constraints. Emmi et al. [9] proposed a modularverification approach based on assume-guarantee rules tocheck the compatibility of interface automata. Ye et al. [29]proposed an atomicity-equivalent public view to check theatomicity property of a service composition. Some industrialstandards like the SCA Event Interface [25] and the WS-Eventing protocol [27] were proposed to expose and prop-agate events among services. However, all aforementionedapproaches do not address how to use service interfaces towhite-box test a service composition. Our work contributesa new kind of service interface, namely an event interface,to test services and thus complements existing approaches.
3. METHODOLOGY
3.1 OverviewAs discussed in Section 1, existing approaches to white-
box testing service compositions suffer from two limitations:inability to accurately determine test coverage as a wholeand difficulty to effectively design test cases. In this section,we illustrate our approach to address these issues based onthe exposure of events from services.
An event is defined as a state change [6, 18]. A state of aservice is defined as a snapshot of its execution at runtime.The execution of a service can be seen as a series of tran-sitions among its states. The transition from one state toanother is defined as a state change. For example, an onlineshopping service transitions from the state “the customerhas not been verified” to “the customer has been verified”.Usually, these states are invisible from outside the service,and thus referred to as internal states. We define an eventto reveal a state change from within a service.
s0
Service 1
e1 e2
s1
s3s2
s4
Service 2
Service 3
Choreography
Service consumer
①,③ …
,②…④
① : publish event interface
② : derive test cases
③ : monitor exposed events
④ : reason about test cover-age & derive new test cases
⑤ : the same as ③
⑥ : the same as ④
…
Testing activity Sequence
Figure 2: Methodology overview
In this paper, we explore the use of event exposure fromservices to support white-box testing of service composi-tions. The basic idea is to abstract coverage-related in-ternal state changes as events and expose them to serviceconsumers. For example, as illustrated in Fig. 2, supposeService 1 transitions from state s1 to state s2, then we de-fine and expose the event e1 to represent that the path froms1 to s2 has been covered. Similarly, another event e2 is de-fined to represent the coverage of the path from s1 to s3. Bymaking use of coverage-related events, service consumers canaccurately determine the test coverage of a service compo-sition as a whole. The conditions under which these eventsoccur can also be explored to help derive test cases moreeffectively to cover a service composition under test.
Note that given various coverage criteria, we can definedifferent sets of events to represent the coverage scenario.For example, for a data flow coverage criterion to cover alldefine-use relations [31], we can define a pair of events (edef ,euse) to track every define-use pair in the service. To ease thepresentation and without lose of generality, in the rest of thispaper, we use path coverage [31] to illustrate our approach.Other coverage criteria can be handled in a similar way.
Fig. 2 summarizes our methodology. Each third-party ser-vice provider defines coverage-related events in its service,abstracts them and their relationships into an event inter-face, and publishes the event interface to the service con-sumer. By monitoring and correlating the exposed eventsfrom third-party services during testing, the service con-sumer can determine how well the service composition hasbeen tested. Additionally, the service consumer can useevent interfaces to derive test cases to cover untested paths.
3.2 Coverage-equivalent Event InterfaceTo make use of event exposure from services to support
white-box testing of service compositions, service providersneed to encapsulate events related to test coverage, derivetheir relationships, and declare them in event interfaces. Be-fore illustrating how to do so, let us first introduce some ba-sic concepts. Similar to many existing work [4, 10, 11, 29],we model a service as a finite state machine in this paper.Each state is defined by a set of variables and their values.In Section 5, we discuss how to derive the state machine ofa service from its implementation (e.g., BPEL).
Definition 1 (State): A state s is defined as a finite set{(x1, t1, v1), · · · , (xn, tn, vn)}(n > 0), where xi is a variable,ti and vi are its type and value, respectively1.
Definition 2 (Service): A service P is a 6 tuple (S, s0, G,C ∪ I, T, F ), where S is a set of states, s0 ∈ S is the ini-tial state, F ⊆ S is the set of final states, C is the set
1Note that the value of a variable can be a concrete valueor a constraint to define a set of values (e.g., vi ≡ xi > 0).
of communicating actions (e.g., sending or receiving a mes-sage), I is the set of internal actions invisible to service con-sumers, G is the set of guarded Boolean expressions, andT ≡ S ×G× (C ∪ I)× S represents the set of transitions.
Given a state s in service P , P can transition from s to s′,
denoted as st−→ s′, if and only if ∃t ≡ (s, g, a, s′) ∈ T ∧s ` g.
An execution of P (also denoted as an instance of P ) is a
sequence of s0ti1−−→ si1
ti2−−→ · · · tik−−→ sik, where sik is its cur-rent state. The execution of a service is the transitioning ofthe service from one state to another. Informally speaking,these state changes represent that something happened andare defined as events.
Definition 3 (Event): Let s ≡ {(x1, t1, v1), · · · , (xn, tn,vn)} and s′ ≡ {(x′1, t′1, v′1), · · · , (x′n, t′n, v′n)} be two states ofservice P . A state change from s to s′ is defined as an eventes→s′ ≡ {(xi1, ti1, vi1), · · · , (xik, tik, vik)} ⊆ s ∪ s′.
Note that an event is different from a transition, in thesense that the former defines that something of interest hap-pens (i.e., a state change related to a set of variables xi1, · · · ,xik of interest), whereas the latter defines how somethinghappens (i.e., how a state change comes about). Since ourpurpose is to determine the coverage of a service compo-sition during testing without revealing the implementationdetails, we only need to know the coverage changes dur-ing testing. Therefore, we define two kinds of events in ourapproach: coverage-related events and auxiliary events. Theformer are defined and raised to reflect the coverage changesfor testing, whereas the latter are defined to correlate eventsfrom different services involved in a service composition.
To define coverage-related events, we introduce an extravariable xcoverage into a service to collect the coverage in-formation of a service for testing. For the path coveragecriteria [31], this variable is assigned a different value (e.g.,a unique branch ID) whenever a service enters a branch. Forexample, in Fig. 2, if Service 1 transitions from s1 to s2 (ors3), xcoverage can be assigned “Branch 1” (or “Branch 2”).Formally, suppose service P transitions from s to s′, where(s, g1, a, s
′) ∈ T , the value of xcoverage changes if and onlyif ∃(s, g2, b, s′′) ∈ T : (s, g2, b, s
′′) 6= (s, g1, a, s′). Whenever
the value of xcoverage changes, we raise an event to representsuch a change. For example, in Fig. 2, two events e1 ande2 are defined to indicate that Service 1 enters two differentbranches, respectively.
Besides coverage-related events, we also need to definesome auxiliary events to correlate events from different ser-vices. An auxiliary event occurs when a service sends or re-ceives a message: that is, if service P transitions from s to s′,where (s, g, a, s′) ∈ T ∧a ∈ C, then an auxiliary event es→s′
is defined. If both an auxiliary event and a coverage-relatedevent are defined for a transition, then only the auxiliaryevent is kept. We also define a start event for each serviceto indicate that the service has started to execute.
In order to represent the actual coverage of paths insidea service, what is still needed is a way to determine whichevents are on the same path and which are not. For exam-ple, as illustrated in Fig. 3(a), suppose service P transitionsfrom s0 to s4 via s2, event e0 will be raised first, followedby events e1, e2. Therefore, we can correlate e0, e1 and e2in a sequence e0e1e2 · · · to represent the path. On the otherhand, transitions t1 ≡ (s1, g1, a1, s2) and t8 ≡ (s0, g8, a8, s7)never belong to the same path in any execution of P . There-fore, e2 and e6 should not be correlated. The following defi-
Figure 3: (a) Event exposure. (b) Service composi-tion.
nition summarizes the causality relationships among events:Given two events es1→s2 and es3→s4 , es1→s2 is said to
cause es3→s4 , denoted as C (es1→s2 , es3→s4), if and only if
∃si1t1−→ si2
t2−→ · · · tik−−→ sik ∧ si1 ≡ s2∧ sik ≡ s3. If no event
is raised during si1t1−→ si2
t2−→ · · · tik−−→ sik, es1→s2 is calledthe direct cause of es3→s4 , denoted as DC (es1→s2 , es3→s4).In the above example in Fig. 3(a), e0, e1 and e2 cause e4 inthe path from s0 to s5 via s1, s2, s4. Event e2 is the directcause of e4 whereas e0 and e1 are not.
Based on the above discussion, we introduce the conceptof event interface to abstract both the exposed events andtheir causality relationships inside a service.
Definition 4 (Event Interface): An event interface EIis a tuple (E,R), where E is the set of exposed events, andR ≡ E × E is the set of causality relationships betweenevents, that is, ∀(ei, ej) ∈ R: DC (ei, ej).
Since our purpose is to use event interfaces to determinetest coverage inside services, service providers need to offerevent interfaces for their services to service consumers beforetesting. The following algorithm illustrates how to derive anevent interface from a service. As proven in Section 3.3, thecoverage derived based on event interfaces is equivalent tothe actual coverage of services in testing. Therefore, eventinterfaces are called coverage-equivalent event interfaces.
Algorithm 1 has two parts. Part 1 (Lines 2 to 18) traversesthe service and generates the two types of events (Lines 6,11); Part 2 (Lines 19 to 29) traverses the service in theopposite direction to determine the direct causes for eachevent. For example, as marked in Fig. 3(a), seven events{e0, e1, e2, e3, e4, e5, e6} are defined and exposed from Ser-vice P . For each event, the algorithm traces back fromthe state the event is raised to determine all potential di-rect causes. For instance, for event e4, the algorithm tracesback from state s4 to s2 and s3, and gets its two possi-ble direct causes e2 and e3. The causality relationship forother events can be calculated in a similar way. Therefore,the event interface for service P is EI ≡ (E,R), whereE ≡ {e0, e1, e2, e3, e4, e5, e6}, R ≡ {(e0, e1), (e0, e6), (e1, e2),(e1, e3), (e2, e4), (e2, e5), (e3, e4), (e3, e5), (e5, e1)}. Supposea service has k transitions, and exposes m events. Part 1(Lines 2 to 18) traverses at most k steps; Part 2 (Lines 19to 29) traverses at most m × k steps. Since m ≤ k, thecomplexity of Algorithm 1 in the worst case is O(k2).
3.3 Coverage ReasoningBased on the event interfaces provided by service providers,
service consumers can monitor the exposed events at run-time to determine test coverage. As mentioned in Section 1,the execution of a path in one service may depend on some
Algorithm 1 Derive a coverage-equivalent event interface.
Input:A service P ≡ (S, s0, G,C ∪ I, T, F );
Output:A coverage-equivalent event interface EI ≡ (E,R);
1: qsearch ← {s0}, E ← e0, generated(s0)← e0;2: while ∃cs ∈ qsearch do3: qsearch ← qsearch − {cs};4: for ∀t ≡ (cs, g, a, s) ∈ T do5: if a ∈ C then6: define an auxiliary event ea;7: E ← E ∪ {ea}, cause(ea)← cs;8: generated(s)← generated(s) ∪ {ea};9: else
10: if ∃t′ ≡ (cs, g′, a′, s′) ∈ T : t 6= t′ then11: define a coverage-related event ec;12: E ← E ∪ {ec}, cause(ec)← cs;13: generated(s)← generated(s) ∪ {ec};14: else15: shared(s)← shared(s) ∪ {cs};16: if visitedr1(s) = false then17: qsearch ← qsearch ∪ s;18: visitedr1(s)← true;19: for ∀e ∈ E do20: s← cause(e);21: if visitedr2(s) = false then22: visitedr2(s)← true, qsearch ← {s};23: while ∃cs ∈ qsearch do24: qsearch ← qsearch − {cs};25: cause set(s)← cause set(s) ∪ generated(s) ;26: for ∀ns ∈ shared(cs) : visitedr2(ns) = false do27: qsearch ← qsearch ∪ {ns};28: for ∀e′ ∈ cause set(s) do29: R← R ∪ {(e′, e)}
particular paths in another service. Suppose n services areinvolved in a service composition (denoted as P ), and eachone has mi paths, then P may have a total of
∏ni=1 mi pos-
sible combinations of execution paths. To accurately deter-mine test coverage of P as a whole, service consumers needto know which combinations of execution paths are feasible.Definition 5 specifies feasible paths in a service composition.
Definition 5 (Service Composition): Given n servicesPi ≡ (Si, si,0, Gi, Ci∪ Ii, Ti, Fi)(i = 1..n), their compositionis denoted as a service P ≡ ⊕(P1, P2, · · · , Pn). A stateof P can be represented as ((s1,j1 , w1), · · · , (sn,jn , wn)),where si,ji ∈ Si, and wi is a sequence of executed actionsin Ci ∪ Ii representing a path. The transition ((s1,j1 , w1),· · · , (sn,jn , wn)) → ((s′1,j1 , w
′1), · · · , (s′n,jn , w
′n)) is allowed
if and only if any of the following conditions are satisfied:
1. ∃ti ≡ (si,ji , gi, ai, s′i,ji) : si,ji
ti−→ s′i,ji ∧ ai ∈ Ii ∧w′i = wiai ∧ (∀l 6= i : s′l,jl = sl,jl ∧ w′l = wl).
2. ∃ti ≡ (si,ji , gi, ai, s′i,ji) :(si,ji
ti−→ s′i,ji ∧ ai ∈ Ci ∧w′i = wiai ∧ ∃tk ≡ (sk,jk , gk, ak, s
′k,jk
) : (sk,jktk−→ s′k,jk
∧ ak ∈ Ck ∧ w′k = wkak ∧ (ai sending a message and ak
receiving the message) ∧ (∀l 6= i, k : s′l,jl = sl,jl∧w′l = wl))).
Intuitively, Definition 5 specifies how a service composi-tion transitions from one state to another. In particular,Condition 1 represents a transition by executing an internalaction (that is, from Ii) of an involved service Pi; Condi-tion 2 represents a transition that two involved services Pi
and Pk communicate with each other via ai and ak2. A state
((s1,j1 , w1), · · · , (sn,jn , wn)) is feasible if and only if thereexists a sequence of transitions ((s1,0, {}), · · · , (sn,0, {}))→· · · → ((s1,j1 , w1), · · · , (sn,jn , wn)).
Let us take the service composition in Fig. 3(b) as anexample. Actions in transitions t13 and t14 of service P1
send two messages to P2 (represented as the dashed curve).These two messages are received by t21 and t22 of P2, re-spectively. The initial state of the service composition is((s10, {}), (s20, {})). If P1 transitions to s14, P2 will transi-tion to s22. Therefore, the state ((s14, a10a11a13), (s22, a20
a21)) is feasible, where ai represents the action in transitionti. Similarly, ((s15, a10a12a14), (s23, a20a22)) is also feasi-ble whereas ((s14, a10a11a13), (s23, a20a22)) is not, becausewhen P1 transitions to s14, P2 cannot transition to s23.
A feasible state of a service composition represents a feasi-ble execution path of the service composition. To accuratelydetermine test coverage of a service composition as a whole,service consumers need to correlate events in event inter-faces from different services and organize them in a way toenumerate every feasible execution path of the service com-position. On the other hand, every feasible execution path ofthe service composition should have only one such combina-tion of events. Definition 6 specifies the pattern to organizeand correlate events to represent a feasible execution pathof a service composition. To ease the presentation, we in-troduce the following notation: Given a sequence of eventsh ≡ e0e1 · · · en, tail(h) ≡ en and he ≡ e0e1 · · · ene; givenan event e, predicates aus(e), aur(e), cv(e) denote that e isan auxiliary event representing the sending of a message, anauxiliary event representing the receiving of a message, anda coverage-related event, respectively; com(ei, ej) = true ifand only if ei is the event representing that a message issent by a service and ej is the event representing that thismessage is received by another service.
Definition 6 (Observation): Let P be a service com-position of n services Pi(i = 1..n), and EIi ≡ (Ei, Ri) betheir coverage-equivalent event interfaces. An observationof events from this service composition can be representedas (h1, h2, · · · , hn), where hi is a sequence of events ob-served from service Pi. The observation (h1, h2, · · · , hn) canbe followed by (h′1, h
′2, · · · , h′n), denoted as (h1, h2, · · · , hn)
⇒ (h′1, h′2, · · · , h′n), if and only if ∃ej ∈ Ei : h′i = hiej ∧
(tail(hi), ej) ∈ Ri ∧ (∀l 6= i : h′l = hl) ∧ (aus(ej) ∨ cv(ej)∨ (∃k 6= i : com(tail(hk), ej)).
The intuitive meaning of Definition 6 is that a serviceconsumer can observe a new event from a service if and onlyif its direct cause is observed as the latest event from theservice. Moreover, if the event indicates that a message isreceived, then the event indicating that the same message issent by a service should be the latest observed event fromthe service3. An observation (h1, h2, · · · , hn) is feasible ifand only if there exists a sequence (e1,0, e2,0, · · · , en,0) ⇒· · · ⇒ (h1, h2, · · · , hn), where ei,0 is the start event of Pi.For example, as illustrated in Fig. 3(b), (e10e11e13, e20e21)is a feasible observation whereas (e10e11e13, e20e22) is not.Based on the above concepts, we have the following theorem:
2We assume synchronous communication between services.We discuss how to handle asynchronous communication inSection 5.3Events may lose order in a distributed setting. Service con-sumers can solve this issue by caching events into queues be-fore matching them to the observed pattern of Definition 6.
Theorem 1. Let P be a service composition of n servicesPi(i = 1..n), and EIi ≡ (Ei, Ri) be their coverage-equivalentevent interfaces. For every feasible execution ((s1,j1 , w1),· · · , (sn,jn , wn)) of P , there exists a feasible observation (h1,h2, · · · , hn) of events from P , and vice versa, where hi isthe sequence of events generated by Pi in the execution.
The intuitive meaning of Theorem 1 is that every feasi-ble observation of events corresponds to a feasible executionpath of a service composition, and vice versa. The proof ofTheorem 1 is to construct a one-to-one mapping between afeasible execution path of a service composition and a fea-sible observation of events. The proof can be found in theappendix.
With this theorem, service consumers only need to con-struct all the feasible observations based on the event in-terfaces from service providers, and determine the test cov-erage by counting how many of them have been observedduring testing. Note that when there are loops in a servicecomposition, the number of feasible execution paths may beinfinite. In practice, some constraints are usually added tothe path coverage criterion to terminate searching (e.g., thelength of each path is less than a given K [31], and this in-formation can be added into events). On the other hand,verifying a path is executable or not is generally undecid-able. As a result, white-box testing techniques usually counthow many of the potentially executable paths (whose exe-cutable conditions may be satisfied) have been covered [31].Consequently, the following algorithm constructs all the cor-responding potentially feasible observations.
Algorithm 2 Construct all feasible observations.
Input:n event interfaces EIi ≡ (Ei, Ri) of n services involvedin a service composition;
Output:A set of potential feasible observations O ≡ {(h1,1, h2,1,· · · , hn,1), · · · , (h1,m, h2,m, · · · , hn,m)};
1: qsearch ← {(e1,0, e2,0, · · · , en,0)}, O ← {};2: while ∃co ∈ qsearch do3: qsearch ← qsearch − co(≡ (h1, h2, · · · , hn));4: visited(co)← true;5: if satisfied(co) then6: O ← O ∪ {co};7: else8: for ∀i(i = 1..n) do9: for ∀e ∈ Ei : tail(hi, e) ∈ Ri do
Algorithm 2 constructs all potentially feasible observa-tions from scratch. In the beginning, only the start eventsof each involved service are put into an initial observation.Then, the algorithm constructs all the potentially feasibleobservations following the initial observation by adding anevent to the observation that may satisfy the condition inDefinition 6. If a new potentially feasible follow-up observa-tion satisfies the requirement (Line 5, e.g., the length of thepath is larger than a given K), the observation is put intothe output set O. This procedure is executed until no morepotentially feasible observations are found (Line 2). Sup-pose a service composition has m feasible execution paths,
Algorithm 2 executes at most m ×K steps. Therefore, thecomplexity of this algorithm is O(m×K).
3.4 Test Case GenerationAs mentioned in Section 3.3, service consumers can con-
struct all the potentially feasible observations based on thecoverage-equivalent event interfaces from service providers.During testing, service consumers generate test cases to testservice compositions and subscribe to the exposed eventsfrom involved services. By counting the number of poten-tially feasible observations that have been matched from ex-posed events, a service consumer can determine how well aservice composition has been tested.
One important issue remained is how to design test casesto cover the potentially feasible observations. Service con-sumers can apply existing approaches (e.g., random test-ing [19]) to generate test cases. However, as mentioned inSection 1, the execution of a path in one service may dependon the execution state of some particular paths in anotherservice. A dependency such as this increases the difficulty togenerate test cases effectively to cover a service compositionadequately. In this section, we illustrate that the depen-dency information can be explored and attached to eventinterfaces. The purpose is to allow service consumers touse the additionally exposed information to generate testcases effectively to cover potentially feasible observations.Note that the test oracle issue is out of the scope of this pa-per. The approach introduced in this section can be seen asa complementary approach to existing test case generationapproaches for service testing.
One natural solution to the aforementioned issue is to addmore information related to exposed events to provide moreinsights about the internal execution of a service. In partic-ular, we can analyze the service to determine the conditionsunder which an event can be raised in a given potentiallyfeasible observation. For example, as illustrated in Fig. 4,event e11 is raised if and only if service P1 transitions from
s10 to s12, that is, s10t10−−→ s11
t11−−→ s12. Since the guardedcondition of t10 is always true, P1 can transition from s10to s11. According to the action in t10, state s11 should sat-
isfy the following condition: y = x + 10. If s11t11−−→ s12,
then s11 ` g11 should be satisfied, that is, the condition(y = x + 10) ∧ (y < 20) should be satisfied at state s11.Therefore, under this condition, e11 is raised to follow af-ter e10. To ease the presentation, we call this condition thecausality condition between events e10 and e11, denoted asCC(e10, e11).
Note that the causality conditions between events can bederived during the construction of event interfaces in Al-
gorithm 1. Formally, suppose st−→ s′ and SC(s) represent
the constraints s satisfies, then SC(s′) ≡ SC(s) ∧ g ∧ a,where g and a are the guarded condition and action in t,respectively4. We can iteratively apply this rule during thetraversal of a service in Algorithm 1 to calculate the causalityconditions between every exposed event and its direct cause.Suppose event es1→s2 is the direct cause of esk→sk+1 , that
is, ∃s1t1−→ s2
t2−→ · · · tk−→ sk+1 and no event is raised during
s2t2−→ s3
t3−→ · · ·tk−1−−−→ sk. CC(es1→s2 , esk→sk+1) is equiv-
4We can always rename the variables to make sure eachvariable is assigned the value only once. Therefore, we cancalculate the constraint of SC(s′) in this way.
Figure 4: Causality conditions for events.
alent to SC(s1) ∧ (∧k
j=1(gj ∧ aj)) where gj and aj are theguarded condition and action in transition tj , respectively.
Let EI ≡ (E,R) be an event interface for service P , EIcan be extended to include the local causality conditions be-tween events, that is, EI ′ ≡ (E,R′), where ∀(e1, e2) ∈ R :(e1, e2, CC(e1, e2)) ∈ R′, and vice versa. By attaching thelocal causality conditions into the event interfaces as well,service consumers can integrate them into global constraintsfor the service composition and apply constraint solvingtechniques to generate the test cases for each given feasibleobservation. An alternative approach is that each involvedservice keeps its own local causality conditions invisible toservice consumers and collaborates with its partner servicesto generate the test cases based on their own causality con-ditions. In this paper, we illustrate the former and leave thelatter as future work.
Similar to the calculation of causality conditions betweenevents, the global constraints for a potentially feasible obser-vation can be calculated iteratively. Let EI ′i(i = 1..n) be theextended event interface of service Pi, and o ≡ (h1, · · · , hn)be a potentially feasible observation, the global constraintthat must be satisfied for o is denoted as GC(o). Sup-pose o ⇒ o′, where o′ ≡ (h1, · · · , hie, · · · , hn), then GC(o′)≡ GC(o) ∧ CC(tail(hi), e). For example, given a poten-tially feasible observation o1 ≡ (e10e11e13e15, e20e21e23e25)in Fig. 4 and the causality conditions among the events in o1,GC(o1) ≡(y = x+10) ∧ (y < 20) ∧ (z1 = 2y) ∧ (z1 < 30) ∧(u1 = z1 − 6) ∧ (w = u1 + 2). When GC(o1) is satisfied, o1can be observed by matching the exposed events from theservice composition. By applying constraint solving tech-niques to GC(o1), service consumers can obtain a solution{x = 2, y = 12, z1 = 24, u1 = 18, w = 20}. This solutionindicates a test case (that is, {x = 2}) to cover the feasibleobservation o1.
In practice, a test case may involve many interactions be-tween the service consumer and the service composition be-ing tested. For example, a customer needs to input the querycondition, receive the query result, input the confirmationetc. We can model the test case as a service involved in theservice composition as well. The generation of a test case isthe solution to the local variables inside the test case servicesatisfying the global constraints.
4. EVALUATIONAs illustrated in Section 3, our approach makes use of
events exposed by services and event interfaces to determinetest coverage of a service composition as a whole and to de-rive test cases for the composition. This section evaluatesthe approach quantitatively by comparing it to existing work
in terms of coverage rate, effectiveness in fault-detection andtest case generation. We also evaluate the running time com-plexity of our algorithms and overhead for event exposure.
4.1 Experimental SetupWe use three open-source service compositions to evalu-
ate our work: A supply-chain application [28] (denoted asSC), a loan approval application [13] (denoted as LA) and abook ordering application [24] (denoted as BO). Each appli-cation is characterized in Table 7 by listing the number ofservices, states, transitions, and events exposed for our ap-proach. These applications are also used for service testingby others [2, 14, 20, 30].
Table 1: Applications and descriptive statisticsServices #States #Trans. #Paths #Events
SC
s1 15 19 6 12s2 12 15 5 7
Comp. 25 30 18 19
LA
s1 5 7 3 8s2 8 9 3 8s3 6 8 4 10
Comp. 24 29 10 26
BO
s1 14 17 5 11s2 10 13 5 9
Comp. 24 29 15 20
In the first experiment, we evaluate the coverage percent-age in testing and the effectiveness in fault detection of ourapproach. We use the approach proposed by Bartolini et al.as a baseline [1]. In the baseline approach, we leverage thetesting based on the coverage percentage of each involvedthird-party service. We compare the coverage percentageof a service composition as a whole in testing using our ap-proach (denoted as OA) and the baseline approach (denotedas EA). To evaluate the effectiveness in fault detection, wemeasure and compare the fault-detection rate [12] of bothapproaches.
To evaluate the fault-detection rate, faulty versions of ser-vice compositions are needed. However, to the best of ourknowledge, few faulty versions are reported by developers.Therefore, we generate different faulty versions of servicecompositions by seeding one fault into the three originalservice compositions following the guidelines in [12]. Tobe fair, we seed two types of faults: Faults of Type 1 areinternal to a service (e.g., missing functionality), and usu-ally can be detected by unit testing of the service; faultsof Type 2 represent integration faults that are caused byinconsistency among services (e.g., inconsistent items pro-duced by Services 1 and 2 in Fig. 1). Faults of Type 2 areusually specific to some particular paths across different ser-vices in a service composition. In total, we create 30 faultyversions (Type 1: SC(6), LA(4), BO(5) and Type 2: SC(6),LA(4), BO(5)). Detailed description of services and seededfaults can be found in the appendix.
We then generate test suites for our approach and thebaseline approach. We randomly select a test case from atest pool and execute a target version of a service composi-tion over the test case. If the test case improves the coveragepercentage reported by OA or EA5, then it is added to the
5Note that the coverage percentage reported by our ap-proach is equivalent to the ratio of the number of feasibleobservations observed against the total number of poten-tially feasible observations; whereas the value reported by
test suite for the corresponding approach. The test case se-lection procedure terminates if 100% coverage is achievedwith the maximum length of a path set to 100, or if af-ter a maximum number (500) of trials, the coverage is notimproved. This procedure is repeated 2,000 times for eachversion. The fault-detection rate is calculated as the ratioof the number of test suites that can detect the fault in theversion against the total number of test suites selected. Thereal coverage percentage calculated in testing is equivalentto the ratio of the number of executed paths against thetotal number of potential paths in the service composition.
In the second experiment, we evaluate the effectivenessof test case generation for service compositions. We use therandom testing approach [19] as a baseline, that is, test casesare randomly generated to test a service composition. Toevaluate the effectiveness of test case generation, we measurethe number of test cases needed to cover each service com-position with differently given coverage percentages (coverthe paths of the service composition as a whole). The testcase generation procedure terminates if 100% coverage isachieved, or if after a maximum number (200) of trials thecoverage is not improved. Whenever the coverage percent-age is updated, the total number of test cases needed toreach the coverage percentage is recorded. The test casegeneration procedure is repeated 100 times for each servicecomposition. The number of test cases needed in both ap-proaches is compared.
Finally, we evaluate the complexity of our algorithms. Werandomly generate a set of services with the number of statesvarying from 1,000 to 10,000, and apply our algorithms toderive event interfaces. The overhead for exposing events atruntime for each service is also recorded. We also constructpotentially feasible observations for randomly generated ser-vice compositions with the number of states varying from1,000 to 10,000. The experiment is repeated 1,000 timesand the average time needed for both algorithms and run-time overhead for event exposure is recorded.
4.2 Experiment Data AnalysisIn this section, we analyze and report the experimental
results. In the first experiment, the minimum, mean, andmaximum coverage percentage during the testing of both ap-proaches are shown in Fig. 5(a). In each case, our approachhas better coverage percentage than the existing approach.In particular, our approach has 15%, 40%, and 40% highercoverage percentage than the existing approach for the ap-plication LA, 14%, 35%, and 40% for SC, and 15%, 17%,23% for BO, respectively.
The fault-detection rates for each category of faults andthe aggregated results are shown in Fig. 5(b). The resultsshow that our approach has a much higher fault-detectionrate than the existing approach, especially for faults of Type 2.In particular, with respect to fault-detection rate for faultsof Type 1, Type 2 and overall, our approach achieves 0.16,0.25, and 0.20 more than the existing approach for the ap-plication LA, and 0.05, 0.41, and 0.23 more for SC, and 0.09,0.17, and 0.13 more for BO, respectively.
Since the drop in coverage percentage and effectiveness ofEA may be due to fewer test cases in its test suites, we ran-domly added some extra test cases to the test suites in EA tomake sure that the number of test cases is equivalent to that
the existing work is equivalent to the average percentage ofthe path coverage rate reported by all the involved services.
in OA. We repeated the experiment 2,000 times, and the re-sults are shown in Fig. 5(c) and Fig. 5(d). Now, the averagecoverage percentage of the existing approach is improved,but our approach still achieves at lease 10%, 16%, and 20%more coverage percentage than the existing approach for theminimum, mean, and maximum cases, respectively.
For the overall fault-detection rate, our approach still achie-ves 0.02, 0.13, and 0.12 higher as compared to the existingapproach for the LA, SC, and BO application scenarios, re-spectively. However, the fault-detection rate for faults ofType 1 achieved by the existing approach is a little higher(0.02 and 0.05) than that of our approach for LA and SC,although the coverage percentage of the existing approachis lower than that of ours. This may be because faults ofType 1 are local to certain individual services in a servicecomposition. By randomly adding extra test cases to theexisting approach, all paths of a service can be covered withsimilar probability. However, in our approach, the possibil-ity of covering a path in a service depends on other servicesin a service composition. As a result, certain paths in aservice may be covered with more probability whereas theothers are covered with less probability. Therefore, faultsof Type 1 are more likely to be discovered by a test suitethat covers all the paths of a service evenly in the existingapproach. The fault-detection rate for faults of Type 2 inour approach is still higher than the existing approach (thatis, 0.06, 0.29, and 0.16 for the LA, SC and BO applications,respectively). This is because faults of Type 2 are acrossdifferent services, and our approach achieves a higher cov-erage percentage than the existing approach. As a result,faults of Type 2 are more likely to be discovered using ourapproach. This result implies that our approach is moreuseful to detect integration faults in a service composition.
For the second experiment, Fig. 5(e) illustrates the num-ber of test cases needed using both our approach (denoted asOA) and the random generation approach (denoted as EA-RD) to achieve the given coverage percentage in all the threeapplications. The figure shows that the number of test casesneeded using the random testing approach increases dramat-ically when the coverage percentage increases, whereas thenumber of test cases needed in our approach is much smaller(average 80% less) than that of the existing approach andnearly linear to the coverage percentage.
The running time of our algorithms and overhead for eventexposure (denoted as EP-OH) are shown in Fig. 5(f). Theresults show that it takes less than 1 second to derive anevent interface using Algorithm 1 and less than 0.1 secondto expose all the declared events at runtime for a service with10,000 states. For a service composition with 10,000 states,Algorithm 2 uses less than 800 seconds to construct all thepotentially feasible observations. Therefore, the overheadfor both algorithms and event exposure are small.
4.3 Threats to ValidityThe validity of the experimental results may be threatened
in the following ways:Construct validity. The experimental results may be
invalid if concepts were mismeasured using wrong variables.One purpose of our experiments is to evaluate the benefitsof our approach, which include accurate coverage reasoning,more adequate testing of a service composition, and effec-tiveness of test case generation. Therefore, we measured thequantitative benefits of our approach in terms of coverage
Figure 5: Coverage percentage, fault-detection rate, number of test cases, and time complexity.
rate, fault-detection rate and number of test cases needed.Internal validity. Confounding factors like the types of
seeded faults and test case selections may affect the cause-effect relationships in the experiments if the seeded faults aresensitive to only particular paths across the service compo-sition or the test cases are selected to cover each service wellbut only cover a few paths in the service composition as awhole. We alleviate the impacts of these factors by seedingdifferent types of faults evenly across a service compositionfollowing the guidelines from [12] and randomly selectingtest cases from a large pool of test cases.
External validity. To make sure that the experimentscan be generalized, we use three representative applicationsin the experiments because few real-life service compositionapplications are publicly available. Such applications arealso used in existing service testing work [2, 14, 20, 30].
Theoretical reliability. Finally, we repeated the exper-iments many times to remove accidental errors.
5. DISCUSSIONDeriving the formal model. In this paper, we model a
service as a finite state machine. In practice, services may beimplemented in BPEL and other languages. We can applymany existing work to transform BPEL services into for-mal models, such as finite state machines [11] and processalgebras [10] to just name a few. On the other hand, toderive the causality conditions among events, the semanticsof actions are needed. Some existing Web service standards(like OWL-S [27]) provide such semantics for services (e.g.,the pre/post conditions). In addition, the formal models ofservices with the semantics of actions can be derived usingsymbolic execution techniques [7]. Our work can be appliedto the model based on the existing work.
Event generation and propagation. In our work, ser-
vices need to generate and propagate events to service con-sumers during testing. We make no assumptions on howservices do that. In practice, aspect-oriented programmingtechniques can be used to generate events in a way trans-parent to the service implementations. Events can be propa-gated to service consumers using a pub/sub middleware [15],or using existing standards like WS-Eventing [27].
Asynchronous communication. To ease the presen-tation and illustration of our approach, we assume servicescommunicate with each other using synchronous communi-cation. Our approach is also applicable to asynchronouscommunication. To support asynchronous communication,queues can be introduced in Definitions 5 and 6 to buffer theasynchronous messages from partners. A feasible executionand a feasible observation can be derived in the same way.
Privacy concern. In our work, only necessary eventsare exposed to abstract and reveal coverage-related internalstate changes inside a service. All other state changes insidea service and how states are changed (i.e., by what tasks inthe business logic) remain invisible to service consumers. Inthis way, the privacy concern of service providers is respectedto a large extent. On the other hand, sometimes the causal-ity conditions for events may be related to business interests(e.g., the decision making strategies to choose different ex-ecution paths inside a service etc) so that service providersmay not be willing to expose them. An alternative solutionis that each service provider can derive the final conditionsthat must be satisfied for its own service along each givenfeasible observation, and provide it to service consumers toavoid revealing individual decision making strategies. Thiscollaborative solution can be applied when the causality con-ditions are unavailable from the service formal model. Wewill explore in this direction in our future work.
solving techniques to derive test cases for given feasible ob-servations. Constraints may not always be solvable. In thiscase, our approach can still be applied to determine test cov-erage using the test cases generated by existing work (e.g.,random testing [19]). An alternative approach is to applythe aforementioned collaborative approach to generate testcases for service compositions.
Parallel events. In practice, a BPEL process may in-volve concurrent executions (e.g., flows), which may gener-ate events to interleave with each other in many ways. Thefinite state machine model can describe all the possible in-terleavings as different paths. Service providers can alsochoose to keep some combinations and remove the othersin the event interface to reduce the number of paths (sincethese different combinations corresponding to the same con-current execution paths) based on the testing requirements(e.g., examining every possible interleaving is needed in somecritical requirements).
Composite Web services. In a service composition,the involved services may be composed of other services.The coverage-equivalent event interface of a composite ser-vice should be derived based on the event interfaces of itscomposed services. This requires to aggregate the eventsfrom the involved services into high-level events and con-struct their causality relationships and conditions. We willexplore this in our future work.
6. CONCLUSIONSWhite-box testing of service compositions is difficult be-
cause service providers usually hide the service implemen-tation details due to business interests or privacy concerns.This paper presents a novel approach to white-box test ser-vice compositions based on event exposure from Web ser-vices. By deriving coverage-equivalent event interfaces fromservice implementations, events are defined and exposed fromservices to accurately determine the test coverage of a ser-vice composition at runtime. In this way, service consumerscan gain confidence on how adequately a service compositionhas been tested. An approach to effectively design test casesbased on event interfaces is also proposed and the correct-ness of the approach is proven. Algorithms are developedto derive coverage-equivalent event interfaces and constructfeasible observations. The experimental results show thatour approach outperforms existing approaches in terms ofcoverage rate, fault-detection rate and effectiveness of testcase generation.
7. REFERENCES[1] C. Bartolini, A. Bertolino, S. Elbaum, and
E. Marchetti. Whitening soa testing. In ESEC/FSE’09, pages 161–170, 2009.
[2] L. Bentakouk, P. Poizat, and F. Zaıdi. A formalframework for service orchestration testing based onsymbolic transition systems. In TESTCOM’09/FATES ’09, pages 16–32, 2009.
[3] A. Bertolino, G. Angelis, L. Frantzen, and A. Polini.Model-based generation of testbeds for web services.In TestCom ’08 / FATES ’08, pages 266–282, 2008.
[4] D. Beyer, A. Chakrabarti, and T. A. Henzinger. Webservice interfaces. In WWW ’05, pages 148–159, 2005.
[5] G. Canfora and M. Di Penta. Testing services andservice-centric systems: Challenges and opportunities.IT Professional, 8(2):10–17, 2006.
[6] K. Chandy. Event-driven applications: costs, benefitsand design approaches. In Gartner ApplicationIntegration and Web Services Summit 2006, 2006.
[7] L. A. Clarke. A system to generate test data andsymbolically execute programs. IEEE Trans. Softw.Eng., 2(3):215–222, 1976.
[8] L. de Alfaro and T. A. Henzinger. Interface automata.In ESEC/FSE-9, pages 109–120, 2001.
[9] M. Emmi, D. Giannakopoulou, and C. S. Pasareanu.Assume-guarantee verification for interface automata.In FM ’08, pages 116–131, 2008.
[10] H. Foster, S. Uchitel, J. Magee, and J. Kramer.Model-based verification of web service compositions.In ASE ’03, pages 152–161, 2003.
[11] X. Fu, T. Bultan, and J. Su. Analysis of interactingbpel web services. In WWW ’04, pages 621–630, 2004.
[12] M. Hutchins, H. Foster, T. Goradia, and T. Ostrand.Experiments of the effectiveness of dataflow- andcontrolflow-based test adequacy criteria. In ICSE ’94,pages 191–200, 1994.
[14] K. Kaschner and N. Lohmann. Automatic test casegeneration for interacting services. pages 66–78, 2009.
[15] G. Li, V. Muthusamy, and H.-A. Jacobsen. Adistributed service-oriented architecture for businessprocess execution. ACM Trans. Web, 4(1):1–33, 2010.
[16] Z. Li, W. Sun, Z. B. Jiang, and X. Zhang. Bpel4wsunit testing: Framework and implementation. InICWS ’05, pages 103–110, 2005.
[17] Z. J. Li, H. F. Tan, H. H. Liu, J. Zhu, and N. M.Mitsumori. Business-process-driven gray-box soatesting. IBM Syst. J., 47(3):457–472, 2008.
[18] D. C. Luckham. The Power of Events: AnIntroduction to Complex Event Processing inDistributed Enterprise Systems. Addison-Wesley, 2001.
[19] J. Mayer and C. Schneckenburger. An empiricalanalysis and comparison of random testing techniques.In ISESE ’06, pages 105–114, 2006.
[20] L. Mei, W. Chan, and T. Tse. Data flow testing ofservice-oriented workflow applications. In ICSE ’08,pages 371–380, 2008.
[21] L. Mei, W. K. Chan, and T. H. Tse. Data flow testingof service choreography. In ESEC/FSE ’09, pages151–160, 2009.
[22] L. Mei, W. K. Chan, T. H. Tse, and R. G. Merkel.Tag-based techniques for black-box test caseprioritization for service testing. In QSIC ’09, pages21–30, 2009.
[23] R. D. Nicola and M. Hennessy. Testing equivalence forprocesses. In ICALP’83, pages 548–560, 1983.
[24] Oracle. Book ordering. http://www.oracle.com/technology/sample code/products/bpel/index.html.
[25] OSOA. Sca event processing. http://www.osoa.org/.[26] J. Tretmans. Test generation with inputs, outputs,
and quiescence. In TACAs ’96, pages 127–146, 1996.[27] W3C. Ws-eventing, owl-s. http://www.w3.org.[28] WS-I. Supply chain management. http://www.ws-
i.org/deliverables/workinggroup.aspx?wg=sampleapps.[29] C. Ye, S. C. Cheung, W. K. Chan, and C. Xu.
Atomicity analysis of service composition acrossorganizations. IEEE Trans. Softw. Eng., 35(1):2–28,2009.
[30] Y. Yuan, Z. Li, and W. Sun. A graph-search basedapproach to bpel4ws test generation. In ICSEA ’06,page 14, 2006.
[31] H. Zhu, P. A. V. Hall, and J. H. R. May. Software unittest coverage and adequacy. ACM Comput. Surv.,29(4):366–427, 1997.
APPENDIXA. PROOF OF THEOREM 1
Part 1: Given a feasible execution ((s1,j1 , w1), · · · , (sn,jn , wn)) of P , according to its Definition, there exists a sequenceof s0 → si1 → · · · → sik, where sik ≡ ((s1,j1 , w1),· · · , (sn,jn , wn)). We can construct a feasible observation (h1, h2, · · · ,hn) for this feasible execution in the following way: In the beginning, that is, in state s0, hi ≡ {ei,0}, where ei,0 is the startevent of Pi. Suppose an event ej ∈ Ei is raised during sil → si(l+1), according to the causality definition, (tail(hi), ej) ∈ Ri.Therefore, based on Definition 6, (h1, h2, · · · , hn)⇒ (h1, h2, · · · , hiej , · · · , hn). Hence, during each step of s0 → si1 · · ·→ sik,if an event defined in an event interface is exposed, we can construct a feasible observation from current observation with thisnew generated event.
Part2: Given a feasible observation (h1, h2, · · · , hn), according to its Definition, there exists a sequence (e1,0, e2,0, · · · ,en,0) ⇒· · ·⇒(h1, h2, · · · , hn), where ei,0 is the start event of Pi. We can construct a feasible execution of P for this feasibleobservation in the following way: In the beginning, that is, the observation is (e1,0, e2,0, · · · , en,0), and the service compositionis in the initial state s0. Suppose (e1,0, e2,0, · · · , en,0) ⇒(e1,0, e2,0, · · · , ei,0ei,1, · · · , en,0), then (ei,0, ei,1) ∈ Ri. According to
the Definition of causality, there exists an execution of service Pi, that is, si,0ti,1−−→ · · · si,j−1
ti,j−−→ si,j , and ei,1 ≡ esi,j−1→si,j .
For each step si,l−1
ti,l−−→ si,l, according to Definition 5, we can construct a corresponding feasible execution sl−1 → sl forthis service composition. Therefore, given a feasible observation (e1,0, e2,0, · · · , en,0)⇒ · · · ⇒ (h1, h2, · · · , hn), there exists acorresponding feasible execution ((s1,0, {}),· · · , (sn,0, {}))→ ((s1,j1 , w1),· · · , (sn,jn , wn)).
Based on the Part1 and Part2, the conclusion follows.
Table 5: Description of Seeding Faults for LoanApproval ApplicationFaulty Name Fault Type Fault Description
f1 Type 1 Approval: the threshold of g1 and g2 are changed to affect the service locallyf2 Type 2 Approval: g3 and g4 are changed to generate inconsistent resultsf3 Type 2 Loan: the threshold of g1 and g2 is chanted to generate inconsistent resultsf4 Type 1 Loan: g1 and g2 are changed locallyf5 Type 1 Loan: g3 and g4 with additional constraintsf6 Type 1 Loan: t8 failure with wrong variablef7 Type 2 RiskAssessment: g3 and g4 are exchanged to generate inconsistent resultsf8 Type 2 RiskAssessment: g1 and g2 have wrong threshold value to generate inconsistent results
Table 8: Description of Seeding Faults for BookOrdering ApplicationFaulty Name Fault Type Fault Description
f1 Type 1 Credit Card: t3 generates wrong resultf2 Type 2 Credit Card: t10 generates inconsistent resultf3 Type 2 Credit Card: t12 generates inconsistent resultf4 Type 1 Credit Card: g5 and g6 with additional constraintsf5 Type 2 Credit Card: t5 generates inconsistent resultf6 Type 2 Book Ordering: g1 and g2 with additional constraints to generate inconsistent decisionsf7 Type 1 Book Ordering: g3 with additional constraintsf8 Type 2 Book Ordering: g4 and g5 with wrong constraints to generate inconsistent resultsf9 Type 1 Book Ordering: t11 generates failure for particular customersf10 Type 1 Book Ordering: t16 generate side effects for particular customers
factoryA can produceg4 requested > manufacturer stock +
factoryA can produceg5 requested ≤ manufacturer stock +
factoryA can produce + factoryB can produceg6 requested > manufacturer stock +
factoryA can produce + factoryB can produceg7 requested ≤ manufacturer stock +
factoryA can produce + factoryB can produce +factoryC can produce
g8 requested > manufacturer stock +factoryA can produce + factoryB can produce +factoryC can produce
Table 10: Description of Retailer Servicet1 receive customer request t2 query warehouseAt3 transaction for A t4 deliver productt5 prepare complement warehouseA t6 Complement warehouset7 wait for manufacturer t8 assign complementedt9 query warehouseB t10 transaction for Bt11 prepare complement warehouseB t12 query warehouseCt13 transaction for C t14 prepare complement warehouseCg1 product type == 0 g2 product type == 1g3 product type == 2 g4 stockA ≥ amountg5 stockA < amount g6 stockB ≥ amountg7 rstockB < amount g8 stockC ≥ amountg9 stockC < amount
s0
t1
s1
t2
s2
t3
s3
t4
s4
t5
s5
t6
s6
t7
s7
t8
s8
t9
s9
t10
s10
t11
s11
g1
g2
g3
g4
g5
g6
g7
g8
Figure 11: Manufacturer Service
s0
t1
s1
t2
s2
t3
s3
t4
s4
t5
s5
t6
s6
t7
s7
t8
s8
t9
s9
t10
s10
t11
s11
t12
s12
t13
s13
t14
s14
g1
g4
g5
g2
g6
g7
g3
g8
g9
Figure 12: Retailer Service
Table 11: Description of Seeding Faults for SupplyChain ApplicationFaulty Name Fault Type Fault Description
f1 Type 1 Manufacturer: g1 and g2 are exchangedf2 Type 1 Manufacturer: g3 and g4 are exchangedf3 Type 1 Manufacturer: g7 and g8 are exchangedf4 Type 2 Manufacturer: t3 generates inconsistent resultf5 Type 2 Manufacturer: t6 generates inconsistent resultf6 Type 1 Manufacturer: t8 generates wrong resultf7 Type 1 Retailer: the threshold of g1 is changedf8 Type 1 Retailer: g8 and g9 have additional constraintsf9 Type 2 Retailer: g6 and g7 with wrong variable to generate inconsistent decisionsf10 Type 2 Retailer: t5 calculates wrongly for some range of inputf11 Type 2 Retailer: t11 calculates wrongly for some range of inputf12 Type 2 Retailer: t14 calculates wrongly for some range of input